Embed Size (px)
Citation preview

1
A Case Study of a Blended Learning Environment with a Focus on Mastery that Greatly
Impacted Mathematics Proficiency at Herbert Hoover Elementary School, Alaska
A Thesis presented by:
David L. Jones
The College of Professional Studies
In partial fulfillments of the requirements for the degree of
Doctorate of Education
Dr. Chris Unger
Advisor
Northeastern University
Boston Massachusetts
December 2016

2
Abstract
The purpose of this case study is to analyze how two teachers used technology to increase
student achievement in mathematics at Herbert Hoover Elementary School in rural, Alaska,
significantly increasing student outcomes on the Alaska Standardized Based Assessments in
mathematics. The case study reviews the qualitative data collected through interviews with the
administrator, teachers, and student focus groups through the lens of the Mastery Learning
Theory. The research question guiding the study is “How has the development of a blended
learning classroom with a focus on Mastery Learning greatly impacted mathematics achievement
in two elementary school classrooms, as perceived by the teachers using the program, the
administrator, and students?” The literature review presents research on the use of technology to
differentiate math instruction, increase student’s engagement in mathematics instruction,
Mastery Learning and students’ achievement in math. The case study presents how the blended-
learning approach impacted student learning, as discerned by the teachers, students, and
administrator involved. The results suggest that a blended-learning approach to learning math
can greatly increase student achievement over and beyond typical instructional strategies
employed in schools today.
Keywords: technology in the classroom, technology as motivation, differentiation using
technology, hybrid/blended learning, mastery learning

3
Acknowledgements
It is with my deepest appreciation that I acknowledge my advisor Dr. Chris Unger. His
encouragement, patience, and guidance made this journey the greatest educational experience of
my life. I would also like to thank Dr. Kelly Conn my second reader for valuable input on ways
to improve my study and for the time and energy spent doing so. Additionally I would like to
thank Dr. Priscilla Schulte for her willingness to serve as the third member of my committee.
Without the support of my wife Ingrid this educational accomplishment would have not
been possible. To my sons Jacob and Luke who sacrificed many of hours of family time due to
the fact that I had to spend much time studying. I thank you for your understanding and
patience.
I would also like to thank my colleague Dr. Valerie Brooks for encouragement and
constructive critique of my writing as we journeyed through the Northeastern program together.
I would also like to thank the administrator, the 5th grade and 6th grade teacher as well as the
students who were willing to participate and give of their time for this case study.

4
Table of Contents
Abstract ............................................................................................................................................2
Acknowledgements ..........................................................................................................................3
Table of Contents .............................................................................................................................4
Chapter 1: Introduction ....................................................................................................................7
Problem of Practice……………………………………………………………………….7
Significance of the Problem………………………………………………………………9
Positionality Statement………………………...………………………………………...12
Practical Goals…………………………………………………………………………...13
Intellectual Goals………………………………………………………………………...14
Research Question……………………………………………………………………….14
Theoretical Framework………………………………………………………………......15
Instructional methods used in the 5th and 6th grade classroom in this case study………19
Chapter II: Literature Review …………………………………………………………………...22
1. Technology in schools..................................................................................................22
2. The Use of Technology to Differentiate Math Instruction…………………………...27
3. The Use of Technology in Mastery Learning...............................................................33
4. The Impact of Technology Use on Student Engagement.…………………………....35
5. Using Technology with Face-to-Face Instruction…………………………………....37
6. Mastery Learning.……………………………………..……………………………...41
Chapter III: Methodology ……………………………………………………………………….49
Rationale for a Case Study………………………………………………………………49
Site and Participants.…………………………………………………………………….50
Study Context……………………………………………………………………………51

5
Data Collection.………………………….…………………………………………........53
Data Analysis…………………………………………………………………………….54
Validity and Credibility………………………………………………………………….54
Protection of Human Subjects…………………………………………………………...55
Conclusion……………………………………………………………………………….56
Chapter IV: Research Findings.………………………………………………………………….57
Administrator’s Perspective……………………………………………………………...57
Teacher Perspective – 6th Grade………………………………………………………...62
Teacher Perspective – 5th Grade………………………………………………………...70
Student Perspective.……………………………………………………………………...77
Chapter V: Discussion of Research Findings.…………………………………………………...83
Revisiting the Problem of Practice.……………………………………………………...83
Discussion of Major Findings.…………………………………………………………...85
Discussion of the Findings in Relationship to Mastery Learning.……………………….89
Discussion of Findings in Relationship to Literature Review…………………………...93
Conclusion...……………………………………………………………………….…...102
Limitations……………………………………………………………………………...104
Significance and Possible Implications of Study.……………………………………....105
Future Studies…….…………………………………………………………………….106
Personal Reflection.…………………………………………………………………….108
References………………………………………………………………………………………111
Appendices……………………………………………………………………………………...119
Appendix A …………………………………………………………………………… 119

6
Appendix B …………………………………………………………………………… 122
Appendix C …………………………………………………………………………… 124
Appendix D …………………………………………………………………………… 125
Appendix E …………………………………………………………………………… 126
Appendix F……………………………………………………………………………. 127
Appendix G …………………………………………………………………………… 134

7
Chapter I: Introduction
Problem of Practice
The current method of math instruction in public schools is not producing the results
desired to assure that the United States remains economically competitive in the global market
(Hess, 2010; Hanushek, Jamison, Jamison, & Woessmann, 2008; Chudgar and Luschei, 2009;
Petersen, Lastro-Anadon, Hanushek, Woessmann, 2011). According to the National Center for
Educational Statistics, the United States placed 24th in the mathematics ranking of the PISA test
where, “23 had higher average scores than the United States, 29 had lower average scores, and
12 had average scores not measurably different from the U.S. average score” (Fleischman,
Hopstock, Pelczar, & Shelley, p. 1). President Obama in his State of the Union Address January
2011 added, “The quality of our math and science education lags behind many other nations.
America has fallen to ninth in the proportion of young people with a college degree” (Obama B.
H., 2011). Hunt and Tierney (2006) emphasizes the importance of improving our education to
be competitive with other countries due to the fact that, “At issue is whose standard of living will
rise and whose will fall in a global economic environment that demands ever larger numbers of
highly trained and educated workers” (p. 7). As argued by many, if US students do not keep
pace academically with students from other countries they will be unable to find employment in
a knowledge based global economy (Hunt and Tierney, 2006; Hess, 2010).
In a 2006 review of state standards nationwide, the Fordham Institute (Finn, Julian, &
Petrilli, 2006) gave Alaska a “D” rating on its math standards compared to the National Council
of Teachers of Mathematics (NCTM) standards. As of 2015, the Alaska math standards will
correct this discrepancy and align the state standards with the NCTM standards. Alaskan
students will have to increase their math abilities dramatically at the time the new standards

8
replace the old standards. By July 1, 2015 each school district in Alaska will have to identify at
least two assessments with a maximum of four assessments to determine their students’
mathematics achievement as mandated by the Department of Education and Early Development
(DEED) of Alaska. In addition, the student outcomes of these assessments will be counted
toward twenty percent or more of the teacher evaluations. This is an accountability measure by
the state to make sure all students are getting adequate instruction.
The math curriculum that is used by most school districts today is designed to teach in a
whole class method where students progress together page by page through the textbook adopted
by the school district to teach mathematics. This method would be effective if all children had
the same learning style and had matching aptitudes in mathematics. This is contradictory to the
current understanding of developmental psychology where it is believed that specific capabilities
will be unique to the individual based on genetic inheritance and life experience (McCown,
Driscoll, & Roop, 1996). “Acknowledging that students learn at different speeds and they differ
widely in their ability to think abstractly or understand complex ideas is like acknowledging that
students of any given age are not all the same height” (Tomlinson, 2001, p. viii). American
teachers will have to change from teacher-centered instructional methods to student-centered
instructional methods and be able to differentiate their instruction accordingly if they want their
students to be successful on standardized tests.
Current traditional math curriculum and instruction do not take into account that the
individual student cannot move forward until he or she has mastered the skills needed for the
next objective. For example, if a student does not know his multiplication facts you cannot move
him on to a lesson teaching the student how to divide. When teachers move the students to the
next lesson without prior mastery of the current lesson because of time constraints they set the

9
student up for failure. “Common experience, as well as abundant research evidence, suggests
that the amount of time needed by the children even under … ideal conditions will differ widely”
(Carroll, 1963). Students must be allowed the time to master prior skills before moving on to the
lessons with a focus on later skills. Mastery learning is not a new concept. Benjamin S. Bloom
(1974) saw inferences to mastery learning in the writings of Comenius, Pestalozzi, and Herbart.
Bloom (1974) “reasoned that if we could provide the time and help needed and could motivate
the student to use the time available, most students could be brought to the criterion level of
achievement” (p. 684). Most standardized tests in the United States are criterion-based tests to
meet the requirements of the Elementary and Secondary Education Act (NCLB).
Traditional classroom instruction focused on adherence to a textbook is a flawed concept
in many aspects (Bloom, 1968; Dzakiria, Mustafa, & Bakar, 2006). The textbook is designed for
students to be exposed to the concepts that the author of the textbook determines to be the
appropriate material needed for each grade level. The content material is usually not taught to
mastery level for all students (Block, 1971). Additionally, there is rarely a perfect alignment
with the criteria of the standardized tests that students will be taking and the adopted textbooks
of the traditional classroom. Perspicuous defined objectives with small formative assessments
based on the standards to be tested must be designed, in place, and mastered so students can
become successful on summative assessments (standardized tests) (Bloom, Hasting, Madaus,
1971).
Significance of the Problem
The Congressional Budget Office (CBO) in their January 2011 economic outlook
forecast noted that there is “a mismatch between the requirements of existing job openings and
the characteristics of job seekers” (Whalen, Kowalewski, & Arnold p. 27). This mismatch has

10
occurred because American public schools are still teaching students with the methods and to the
academic level that was used when the United States economy was based on manufacturing.
This shift from an economy driven by agriculture and industry to an economy that requires
better-educated citizens will require dramatic change from public schools. As Hess (2006)
states, “Our nation’s postindustrial and increasingly global economy is now driven by knowledge
and by higher-order skills like symbolic reasoning, analysis, and communication” (p. 26). If the
students in the United States do not keep pace academically with students from other countries
they will be unable to find employment in a knowledge based global economy (Wagner, 2010).
If schools do not make the transition from industrial age methods of instruction to twenty
first instructional methods it will be difficult for the future generation to maintain the living
standard that their parents enjoy. Chris Dede, who is the Timothy E. Wirth Professor in
Learning Technologies at Harvard’s Graduate School of Education, asserted that the school
classroom will not go away due to online learning, but will use the online technology to
customize education for the individual student. As Dede (2007) wrote, “At this point in history,
the primary barriers to altering curricular, pedagogical, and assessment practices toward the
transformative vision of [information and communication technologies] ICT in education … are
not conceptual, technical, or economic, but instead psychological, political, and cultural” (p. 35).
The need for change in educational pedagogy is due to the fact that the skill brought by
students coming to public schools have changed and the skills they need to acquire for becoming
productive members of society have altered as well (Edgar 2012; Papert, 1993; Kort & Reilly
2002, Dede, 2007). At Houghtaling School in Alaska, not unlike most communities across the
US, the students coming into kindergarten begin with a wide range of capabilities in
preparedness to begin their education in academic abilities as well as social skills to become

11
successful students. With the new technology of online learning, teachers can move past the
current problems of practice and begin to implement the teachings of John Dewey and Lev
Vygotsky with a focus on the educational needs of the individual student as their main focus of
instruction moving from teacher centered to student centered instruction. Interactive software
can be used as the “knowledgeable other” that Vygotsky believed was needed to construct
knowledge. Dewey believed in a child center education that addressed the needs of the student
that the technology makes possible with differentiation of lessons designed for the individual
student (Gallant, 1973).
Instruction that is differentiated down to the individual student would not be possible for
a single teacher in a typical classroom in the United States until recent technological advances.
In 2009 61.9% of the non-disabled students of the 6th grade class at Herbert Hoover Elementary
School were proficient in math on the Alaska Standards Based Assessment (SBA) test. This was
increased to 93.2% proficient of the non-disabled student by the 2013 SBA math test by using
various web-based tools and resources (the method used in this case study) to align student
instruction to the individual student need. It is argued that the efficiency of an instructional
method that can individualize math instruction in the elementary classroom by way of web-based
programs and resources can produce a significant improvement in student outcomes.
In a collaboration between the New Media Consortium (NWC), the Consortium for
School Networking (CoSN) and the International Society for Technology in Education (ISTE)
the NMC Horizon Report: 2013 K-12 Edition (Johnson et al., 2013) stated, “Traditional lectures
and subsequent testing are still dominant learning vehicles in schools” (p.10) and that schools
needed to address blended learning and the growing success of non-traditional models of
schooling. Additionally stated in the NWC Report: 2013 K-12 Edition (Johnson et al., 2013)
12
was their view that, “The demand for personalized learning is not adequately supported by
current technology or practices” (p. 10). The report goes on to say that we are not using
technology formative assessment to drive assessment in the way it could and should in the
classroom (Johnson et al. 2013). Technology and in education has not been researched
extensively and technology has not been implemented to its full potential in the world of
education to benefit the individual student (Hess, 2006; Johnson et al, 2013; Staker & Horn,
2014).
Positionality Statement
In reflecting on my positionality of this case study I first acknowledge my background
and how at the age of 45 entered the field of education. I am a Caucasian male, Christian,
earning a middle class income. I was raised by my father, an internationally acclaimed research
scientist in the field of industrial hygiene and my mother an administrator of nursing homes. I
spent the majority of my life as a professional musician. In 2000 I became a music teacher and
was hired under an emergency certificate to teach music. I was hired under an emergency
certificate because I did not have a college degree or teaching certificate. My private studies in
music began at age 7 and continued until I was 35 ending when I went to Alaska where there
were not suitable music instructors in Southeast Alaska.
In 2002 I earned a Bachelor of Liberal Arts in General Studies after already teaching for
two years. I continued my education earning Master in the Art of Teaching in 2005 and a Master
in Education in Educational Leadership in 2007. In 2010 I entered Northeastern University to
begin work on a doctorate of education. Four years after teaching music I was transferred to a
classroom position due to the fact the school I was teaching at was closed. The second year of
being a classroom teacher, in 2005, I was transferred to the school that this case study is situated

13
in. When I examined my 2005 class’s academic ability I came to the conclusion that the
traditional method of math instruction would not bring about the outcomes that were needed for
these students to become successful. I purchased eight Dell computers and began an
individualized method of instruction. In 2013, I became the administrator of the site of this case
study. A fifth grade teacher and a sixth grade teacher are still using the methods that were
developed in 2005 who will be interviewed in this case study. “Inquirers explicitly identify
reflexively their biases, values, and personal background such as gender, history, culture, and
socioeconomic status, that may shape their interpretation formed during a study” (Creswell,
2007, p. 177). Bourke (2008) described positionality as the ability to reflectively self scrutinize
with self-conscious awareness of the relationship between the researcher and the study. My
inquiry is based on the statistically significant differences in outcomes between the classes
involved in this case study and the rest of the similar grade classes outcomes examined school
district wide. Alaska currently is without a state test so these classrooms are now compared to
Measure of Academic Progress from Northwest Evaluation Association that will compare their
growth internationally.
Practical Goals
The practical goal of this case study is to examine how the use of web-based programs
and resources to differentiate instruction in the Herbert Hoover Elementary School might have
contributed to an increase in Alaska Standards Based Assessment (SBA) math scores. Through
this examination a curriculum can be designed that takes into account the differences of student
cognitive development, the time needed to master desired skills and objectives, and clearly
define objectives based on the standards to be tested. This will be examined by conducting

14
interviews with the administrator, the teachers, and focus groups of students involved with the
innovation in instruction.
Intellectual Goals
There are two intellectual goals for this study:
1. To investigate how the instructors of this new design perceive the design is having a
significant impact on student learning, mastery, and engagement.
2. To identify how different methods of math instruction might have contributed to an
increase in the standardized test scores at Herbert Hoover Elementary School as
perceived by teachers, administrators and students.
Research Question
The research question guiding this study is as follows:
How has the development of a blended learning classroom with a focus on mastery
learning contributed to mathematics achievement in an elementary school, as
perceived by three teachers using the program, the administrator, and students?
Theoretical Framework: Mastery Learning Theory
Mastery Learning theory with the use of blended learning will be used to examine how
the use of web-based resources played a role in the increase of engagement and mathematical
achievement and in this rural elementary school. Mastery learning is not a new concept.
Benjamin S. Bloom wrote that the basic concepts of mastery learning date back as far as the
teachings of Plato and Socrates (Guskey, 1997). Bloom (1974) states that varying forms of
mastery learning appear in the methods of “Comenius in the seventeenth century, Pestalozzi in
the eighteenth century, and Herbart in the nineteenth century” (p. 4). In the early twentieth
century the work of Carleton Washburne and associates in the Winnetka Plan in 1922 and Henry

15
C. Morrison at the University of Chicago’s Laboratory School in 1926 implemented a method of
mastery learning (Block, 1971). The implementation of mastery learning was successful at the
University of Chicago’s Laboratory School, however, “the idea of mastery learning disappeared
due primarily to the lack of technology required to sustain a successful strategy” (Block, 1971, p.
4). In the modern era Bloom’s 1968 paper Learning for Mastery is considered to be the current
standard for the theoretical formulation on Mastery Learning (Guskey, 1997, Kulik, Kulik, &
Bangert-Drowns, 1990).
Bloom’s basis for Mastery Learning was derived from the work of John B. Carroll’s
(1963) “Model of School Learning” that claimed a majority of students can reach success in
learning in school given the time and instruction needed. Carroll (1963) states that the time
needed to master a learning objective would vary greatly among any group of students. James H.
Block (1971) summarized this method as:
1. Time Allowed 2. Perseverance
Degree of Learning = f 3. Aptitude 4. Quality of Instruction
5. Ability to Understand Instruction
Bloom (1968) stated, “a learning strategy for mastery may be derived from the work of Carroll
(1963)” (p. 3). Bloom (1968) addresses each of the five parts of Carroll’s formula for learning in
his article, Learning for Mastery, published by the Center for the Study of Evaluation of
Instructional Programs (CSEIP) located at the University of California Los Angeles which was
sponsored by the United States Office of Education.
Bloom (1968) discusses in his “Learning for Mastery” article the correlation between
aptitude and time needed to attain mastery of the task at hand. Those students with a higher
aptitude for a subject may require less time to learn a task. However, students with lower
aptitudes can still master the learning task if given adequate time. Schools must find ways to

16
provide students the time needed to learn the subject on an individual basis. In elementary
schools where teachers are in a contained classroom (all subjects with the same teacher in one
classroom) there is more flexibility with time so the needed time for mastery for individual
students can be accomplished. In middle schools and high schools where the timeframe for a
subject is defined into a set amount the schools will have rethink their schedules allowing
students the necessary time to reach mastery. Bloom (1968) determined from Carroll’s (1963)
work that the key to mastery is that the individual student is allowed the time needed to learn the
task and that the student allocates the time needed to attain mastery.
Carroll’s (1963) definition of perseverance is interpreted by Bloom (1968) as the time a
student is engaged in the learning process as opposed to the length of time the student spends on
learning a task. Perseverance according to Bloom (1968) will vary with the students’ interest in
the task at hand. A student who has struggled with math may give up quickly on a mathematical
learning task while the same student may engage for a great length of time in learning a subject
that is of great interest to him. Bloom (1968) states that a way to increase perseverance is to
make sure that instruction is matched to the student’s ability where the student can find success.
Bloom (1968) states, “In our own research we are finding that the demands for perseverance may
be sharply reduced if students are provided with instructional resources more appropriate for
them” (p. 7). Having the instructional level set at the appropriate level for the individual students
allows success rather than frustration. Once the student is successful they will be more
motivated to persevere until they reach mastery of the subject they are learning.
The public education system is still caught in the same “educational trap” almost five
decades after Bloom’s (1968) “Learning for Mastery” article. According to Bloom schools and
research have proceeded with the same standardization of classrooms looking for the one size fits

17
all curriculum and materials (textbooks) for the group, school district, and nation. Now after 100
years of this strategy with little improvement in public education it is time to seek a different
approach and look for what curriculum and material are best for the individual student.
“Carroll’s (1963) defines the quality of instruction in terms of the degree to which the
presentation, explanation, and ordering the elements of the task to be learned approach the
optimum for a given learner” (Bloom, 1968, p. 4). Bloom (1968) thought that future research
should focus on the different types of learners rather than on random assortments of learners so
that instruction could be developed to meet the needs of different learner types. Bloom (1968)
states, “it is unlikely that the schools will be able to provide instruction for each learner
separately” (p. 5). With 1968 technology when Bloom wrote, “Learning for Mastery” this
statement would have been true; in 2016 this is no longer the case.
Carroll (1963) interpreted the ability to understand instruction was based on a student’s
verbal ability and general intelligence Bloom (1968) wrote, “The ability to understand
instruction may be defined as the ability of the learner to understand the nature of the task he is
to learn and the procedures he is to follow in the learning of the task” (p. 5). Differentiating
instructional materials to suit a student’s needs to master the learning task at hand is an important
part of Mastery Learning. Bloom (1968) was clear in his position that the key to mastery was the
ability to modify instructional materials that serve the needs of the individual student rather than
a one size fits all instructional model. As he wrote,
The fact that one textbook has been adopted by the school or by the teacher does not
necessarily mean that other textbooks at particular points in the instruction when they
would be helpful to a student who can’t grasp the idea from the adopted textbook. The
task here is to be able to determine where the individual student has difficulty in

18
understanding the instructions and then provide alternative textbook explanations if they
are more effective at that point (Bloom, 1968, p. 6).
In 1968 another textbook could have been another resource. However, in 2016 this could be a
differentiated explanation provided by the way of technology. Other possibilities offered by
Bloom were workbooks, instructional units, audiovisual methods, and academic games. The
purpose of differentiating instruction is to meet the individual needs of a student so that they can
achieve mastery of content or skill.
Before Mastery Learning Theory can be successfully implemented in a classroom there
are preconditions that must be in place. What will mastery of a subject look like and what
evidence will be used as determination of whether as a student has achieved mastery (Bloom,
1968). This will require two forms of assessments to be constructed, formative and summative.
Formative assessments need to be built that break down the learning tasks into smaller well
defined units and should be used to determine what the student has learned and what learning
task the student needs to continue to work on. These should not be used for grading purposes but
should be used to determine if a student has mastered the learning task the student is currently
working on. Formative assessments reveal what the student has not understood and it must be
retaught preferably using alternative methods until the student masters the learning task.
Summative assessments can be given when the student has mastered all of the formative
assessment developed for that grading period and can be graded as evidence of a student’s
mastery of the subject.
Bloom (1968) discussed many problems with the existing education’s current method of
instruction; the normal curve, aptitude tests, group instruction. He did not see that only a select
few students could earn an A grade based on a normal curve. Bloom’s research in classrooms in

19
1967 found that using Mastery learning that 90 percent of his students were given grades of A.
In this class he found that the mean performance of the group using traditional methods of
instruction compared to the group using Mastery learning methods was about two standard
deviations higher than the group using traditional methods of instruction.
Bloom (1968) noted there were significant affective consequences for students using
Mastery learning methods. He stated that when a student reached Mastery of a subject “there are
profound changes in view of himself [the individual student] and of the outer world” (Bloom,
1968, p. 11). Bloom witnessed that students who achieved mastery became more engaged in the
subject and their perseverance and interest in the subject was increased dramatically.
This case study will examine the two classrooms that had significant increases in
achievement in mathematics on their summative state tests through the lens of Mastery Learning
Theory. Additionally this study will look for evidence of affective consequences that Bloom
(1968) discusses in his Learning for Mastery paper for the UCLA Center for the study of
Evaluation of Instructional Programs.
Instructional Methods used in the 5th and 6th grade Classroom in this Case Study
The mastery learning method implemented in the rural 5th and 6th grade classrooms of the
teachers of this study students have a diverse range of math understanding that might range from
2nd grade through 8th grade. In order to address every student’s needs assessments are done to
determine what grade level of instruction would be appropriate for the individual student.
Benjamin Bloom (1968) stated that one of the preconditions of implementing mastery learning
was that mastery needed to be defined so that assessments could be constructed to determine if a
student had master a subject. He stated that the summative assessment should be broken into
smaller formative assessments for the student to demonstrate mastery of the objective before

20
going to the next formative assessment. When successfully completing the formative
assessments then a summative assessment would be given to the student to demonstrate his
mastery of the course. Bloom suggested that third grade math could be broken down to about 35
objectives. The teachers of this study found Renaissance Learning had developed math software
with the assistance of the National Council of Teacher of Mathematics (NCTM) that broke each
grade level into roughly a hundred or more objectives for each grade level library. There are
multiple libraries available that include Common Core libraries and College and Career
Readiness libraries. The libraries extend from kindergarten to high school math courses
(Appendix F lists the 108 Common Core objectives for 5th grade and the 113 Common Core
objectives for the 6th grade).
The teachers used this software to determine students’ grade level and began giving them
formative assessments to move them forward in their understanding of mathematics. Each
formative assessment was five questions (Appendix G is examples of problems from the 5th and
6th grades Common Core libraries). The examples used are multiple choice however the
objectives can also be asked in a free response method. When a student could answer four out of
five questions correctly on a formative assessment the student would move to the next formative
assessment. The software automatically changed the questions so the student could not simply
memorize the answers.
When students could not answer four out of five questions correctly there were multiple
ways to teach them how to master the objective of the assessment. They could be assigned a
computerized lesson that taught that particular objective. These teachers used multiple software-
based lessons that included Compass Odyssey Learning and Kahn Academy. Additionally they
could get help from a peer who had master the objective or one-on-one with the teacher. When

21
the teacher and student decided she was ready to take another formative assessment on the
objective the student could then demonstrate their mastery of the objective. These formative
assessments are assigned to the individual student with every student going at their own pace and
level. This method of instruction has brought about impressive outcomes on summative
assessments showing significant growth classroom wide for high and low students.
When entering the classroom you will see students engaged in their personal formative
diagnostic assessments either on a device or with pencil and paper. Students that did not
successfully demonstrate mastery of a formative diagnostic assessment will be working on an
interactive computer lesson or viewing a video assigned by the teacher, working with a peer who
has successfully mastered the objective the student is currently trying to master, or working
directly with the teacher. The teacher will be assigning formative diagnostic assessment and
assigning interactive computer lesson or videos to student who did not master an objective.
Additionally, the teacher will be teaming up students to help each other to master objectives, and
working with students one-on-one.

22
Chapter II: Literature Review
A review of the current literature of using technology to improve instruction is the classroom
will be investigated in the six following categories:
1. Technology in schools: the need for better math instruction.
2. The Use of Technology to Differentiate Math Instruction
3. The Use of Technology in Mastery Learning
4. The Impact of Technology Use on Student Engagement
5. Using Technology with Face-to-Face Instruction to Improve Efficiency of Math
Instruction
6. Mastery Learning
This investigation into the literature is to determine how technology has been used in
math instruction in the recent past and present. This should facilitate an understanding of how
best educators can best use technology to increase the efficiency of math instruction and increase
student outcomes in math learning. Additionally this literature review will inform us of where
current use of technology in math pedagogy has been successful.
Technology in Schools
There are many interpretations defining online learning, which constantly change
exponentially with the growth of technology. Online education and distance education are often
seen as synonymous because distance education is often offered online via the Internet. For the
purpose of this paper the Mohamed Ally (2008) definition of online learning will be used. Ally
(2008) stated that online learning was the use of the “Internet to access learning materials; to
interact with the content, instructor, and other learners; and to obtain support during the learning
process, in order to acquire knowledge, to construct personal meaning, and to grow from the
23
learning experience” (p. 17). Online education does not have to be conducted from a distance
but can be delivered in a self-contained classroom. Chris Dede, the Timothy E. Wirth Professor
in Learning Technologies at Harvard’s Graduate School of Education asserts that the school
classroom will not go away due to online learning, but will use the online technology to
customize education for the individual student. Dede (2007) wrote, “At this point in history, the
primary barriers to altering curricular, pedagogical, and assessment practices toward the
transformative vision of [information and communication technologies] ICT in education … are
not conceptual, technical, or economic, but instead psychological, political, and cultural” (p. 35).
The need for change in educational pedagogy is due to the fact that the skill brought by students
coming to public schools have changed and the skills they need to acquire for becoming
productive members of society have altered as well (Edgar 2012; Dede 2007; Kort & Reilly
2002; Papert, 1993).
The digital natives that attend schools today are fully engaged in the latest technology
when they are not in schools. They are sitting in front of a television with a computer in their lap
and cell phone in their hand multitasking, digesting a sempiternal amount of information.
Teachers standing in front of classrooms lecturing and expecting everyone to follow along in a
textbook will no longer be able to maintain the attention of these young, tech savvy students.
Schools in the mid twentieth century began borrowing from industry the methods of mass
production. Class sizes became larger to make use of industries concept of the “economy of
scale” making the school costs more efficient. Individual instruction in the large classes became
increasingly difficult and the students were traditionally marched through textbooks together.
Instructional methods such as these do not allow for the needs of the individual, leaving the less
capable students lost and the more capable students bored. These methods were acceptable in an

24
economy that needed laborers for manufacturing jobs but are no longer adequate for an economy
that is knowledge based driven. The Organization for Economic Co-operation and Development
(OECD) stated, “Knowledge is now recognized as the driver of productivity and economic
growth” (1996, p. 3). The employment opportunities for students coming out of schools require
more knowledge based skills due to the increasing technology in the work environment. John
Akers, chairman of IBM stated, “In an age when a knowledgeable work force is a nation’s most
valuable resource, American students rank last internationally in calculus and next to last in
algebra ” (as cited in Cuban, 2001, p. 173). President Obama, in his State of the Union Address
2011, stated, “The quality of our math and science education lags behind many other nations.
America has fallen to ninth in the proportion of young people with a college degree.” Americans
can and must for the sake of the American economy improve education in public schools.
Teachers mastering the pedagogical skills necessary to implement online educational practices
that differentiate instruction on an individual level in the classroom will bring about significant
academic improvement in public schools. Alan November wrote, “As these emerging
information and communication technologies continue to have a profound impact on society, one
of the most important leadership skills will revolve around helping educators, families and
community to let go of existing structures” (p. 5). Americans must move past their
psychological fear of change and their political ideology and implement the “best practices” of
online educational theories.
Dede (2007) wrote, “In this enterprise of reinventing teaching, learning, and schooling,
we would not need to rely on any major technological advances not yet achieved, such as a
substantial leap in artificial intelligence” (p. 14). Schools have the necessary resources but have
25
not embraced the idea of a classroom of students all proceeding at different rates of development
or of constructed instructional methods to implement online learning in a K-12 classroom.
Teachers who have been trained to teach the whole class have difficulty making the
transition from teacher-centered instruction to student-centered instruction. Terry Anderson
(2008) describes this student-centered form of teaching as learner-centered. “Student-centered
approaches are theoretically consistent with constructivists’ view of the teaching and learning
process” (McCown, Driscoll, & Roop, 1996, p. 419). When online learning is based in a
classroom one is not hindered by the problems that distant online teaching can cause in initial
assessments. The blending of online learning and face-to-face learning enables teachers to use
the best of both worlds. “According to Siemens (2004), we now need a theory for the digital age
to guide the development of learning materials for the networked world” (as cited in Ally, 2008,
p. 18). With the new technology of online learning, teachers can begin to implement the
teachings of John Dewey and Lev Vygotsky where the educational needs of the student are the
main focus of instruction.
Dede (2007) wrote, “Education should prepare students for a world in which computers
do almost all types of routine cognitive tasks and in which expert thinking and complex
communications are the core intellectual skills for prosperity” (p. 13). Creating online learning
lesson does not require a unique theory of learning. The teacher must know the different theories
of learning and choose the appropriate method for each lesson. Ally (2008) wrote,
“Behaviorists’ strategies can be used to teach the what (facts); cognitive strategies can be used to
teach the how (processes and principles); and constructivist strategies can be used to teach the
why (higher-level thinking that promotes personal meaning)” (p. 20). Technology has advanced
to the point that not only are online lessons developed using behaviorist, cognitive, and

26
constructionist strategies, but also these lessons can utilize a mixture of the three and present
them in multiple learning styles simultaneously. Ally (2008) stated, “Strategies should be
selected to motivate learners, facilitate deep processing, build the whole person, cater to
individual differences, promote meaningful learning, encourage interaction, provide relevant
feedback, facilitate contextual learning, and provide support during the learning process” (p. 18).
The online learning enables teachers to provide each individual student the optimum lesson to
achieve growth without being overwhelmed, keeping them motivated to want to learn more.
Computer software has developed to the point that it can now be used to critique a
student’s writing providing instant feedback on: focus and meaning, content and development,
organization, language usage, and mechanics and conventions. Teachers cannot provide this
amount of instant feedback to a classroom of students nor can they design individual writing
assignments based on each individual student’s skills. Online learning makes this seemingly
impossible task, possible. Mathematical software is available that will allow a teacher to assign
an assessment based on standards selected by the teacher (Common Core or state) that will
automatically assign a learning path to work on areas of math that the student has missed on the
assessment. This enables teachers to match the difficulty level of the material to be learned to the
cognitive level of the individual student.
Students working in a self-contained classroom utilizing online technology will be able to
access learning materials on the Internet and also be able to interact with the instructor and other
learners on a daily basis. Through this interaction students will be provided ample educational
support, which will allow them “to construct personal meaning and to grow from the learning
experience” (Ally, 2008, p. 17). It is the interaction between student-teacher, student-student,
and student content that educational growth occurs. Terry Anderson (2008) wrote, “John

27
Dewey’s writings refer to interaction as the defining component of the educational process that
occurs when students transform the inert information passed to them from another and construct
it into knowledge with personal application and value” (p. 55). Online educational theory is in
its infancy and is still developing, but Anderson (2008) has concluded that substituting
technology for some of the interaction as long as one of the interactions remains does not harm
the quality of the educational results.
The online learning theory as described by Mohammad Ally (2008) where teachers and
students access knowledge with the use of technology, that is based on the needs of the
individual student allows all students to proceed at their individual pace and at an appropriate
level for each individual. Software has advanced today to the point where lessons can be
interactive and provide immediate feedback. The individual teacher who is teaching 20 to 30
students cannot provide this kind of support. This ability dramatically increases the efficiency of
the elementary classroom and develops an environment that is student centered. The
engagement of students can be dramatically increased when they can control the time a student
needs to reach Mastery and see a measurable progress. The use of technology in the elementary
classroom does not interfere with the interaction between student to students, and student to
teachers. Interaction is increased because of the constant learning and desire to share what they
have learned with each other.
The Use of Technology to Differentiate Math Instruction: The Research on the Use of
Technology Differentiated Math Instruction
Ysseldyke and Tardrew (2007) conducted a quantitative study to determine the
effectiveness of progress monitoring using a software program from Renaissance Learning to
enable teacher to differentiate math instruction. The software STAR Math from this company

28
does an initial assessment of each student and gives an analysis of what is the proper level of
instruction for the student in the Accelerated Math libraries. These libraries are broken down by
grade level based on the National Council of Teachers of Mathematics (NCTM) performance
standards. The research was conducted in 125 classrooms (67 experimental classrooms and 58
control classrooms) in 47 schools in 24 states. Because the students were not randomly assigned
to the classrooms a t-test was run on pretest NCE scores for experimental and control groups. A
t-test is “a parametric test of statistical significance used to determine whether there is a
statistically significant difference between the means of two matched, or non-independent,
samples” (Fraenkel et al., 2012, G-9). It was determined that the difference was not significant
and the results were the same from a t-test run on the scale scores (SS) of the different
classrooms. The researchers also ran an analysis of covariance (ANCOVA) to evaluate the
effectiveness of program monitoring for students participation in the study. An analysis of
covariance is “A statistical technique for equating groups on one or more variables when testing
for statistical significance; it adjusts scores on a dependent variable for initial differences on
other variables” (Fraenkel et al., 2012, G-1). The dependent variable was posttest normal curve
equivalent (NCE) scores and the covariant was pretest NCE scores.
The students in the experimental groups made significant gains over the control group on
the post STAR Math assessments. There were significant increases in grade equivalency, NCE,
and scale scores in the experimental groups compared to the control groups. Scores were
distributed evenly through all quartiles of student abilities showing that the less capable students
had equivalent gains compared to the high achieving students. In sum, the study indicated that
student being placed at the correct instructional levels is the first step in successful differentiated
instruction.

29
In addition to the above analysis at the conclusion of the study the researchers
administered surveys to the teachers who participated in the study. The survey revealed that
teachers of the experimental groups thought that students this year were doing far better at:
learning basic math skills, attaining higher order math skills, and problem solving skills.
Additionally the researchers thought that they had the information needed to diagnose individual
students’ difficulties in math. Some of the questions were answered with a numerical answer
when asked how much time was spent on various tasks, which revealed that the experimental
teachers spent significantly more time in individual instruction than group instruction.
Xin Liang & Qiong Zhou (2009) of the University of Akron conducted a qualitative case
study to learn how mathematics is processed when students use technology and what features
students feel facilitated learning mathematics when using technology. This qualitative study
concluded that, “The repeated instruction and immediate assessment promoted students’
autonomy, encouraged student engagement and nurtured self-directed learning” (Liang & Zhou,
2009, p. 62). The researchers studied two classrooms of a total 55 third graders that incorporated
technology into the learning of the standard 3rd grade curriculum. The two classrooms were
treated as individual case studies. Two third grade classrooms in two different schools were
chosen for the purpose of the cross case comparison and validation of student learning
experiences. The majority of students in this study were from lower socioeconomic conditions
and over half of the participants were African American students.
Data was gathered by classroom observations that were conducted twice, in fall 2006 and
spring 2007, using a specific observation protocol developed by the evaluation team. Additional
data was gathered through focus group interviews that investigated the reflection process
students engaged in when using technology to learn mathematics. The interview questions

30
included both open-ended questions and close-ended questions. Open-ended questions provided
an opportunity for students and instructors to describe what they were thinking and how it felt to
learn mathematics with computer assisted learning. The closed ended questions allowed
researchers to find out what features students liked best and what features fitted their specific
needs. The results of student experiences were cross-compared by schools and student
characteristics. The observation and focus group interview data was triangulated with the themes
derived from the three researchers. The results of classroom observations and the coding system
were then shared with teachers in the two research sites for member checking. The researchers
summarized that computer assisted learning had three unique features that made this method a
powerful tool to motivating students to learn mathematics. The computers assisted learning
environment made learning fun by having a video game like environment that provided the time
for self-exploration and correcting mathematic misconceptions with repeated instruction and
immediate feedback. What is not explained in this study are the formative assessments made to
determine what lesson each student was being assigned. If they were all assigned the same
lesson then instruction would not have been differentiated.
Yigal Rosen and Dawne Beck-Hill (2012) conducted a study based on a mixed-methods
design. The data that was collected included standardized assessment scores, school records on
attendance and discipline, student questionnaires, and observations in experimental and control
classes. The experimental groups were provided individual laptop computers for every student.
The researchers gathered data to learn: what was the impact of the program on students’ math
and reading performance, student attendance and disciplinary records, learning motivation and
attitudes toward learning with computers and instructional and learning practices with emphasis
on differentiated teaching compared to traditional classrooms.

31
The study participants were fourth and fifth grade students and their teachers from four
elementary schools from the Dallas area. The researchers sampled the known demographics of
schools in this area to find a total of four schools that were evenly matched using two schools as
experimental and two as control schools. From these four schools, 476 students and 20 teachers
participated in this study.
The impact on the math and reading performance was measured by comparing the 2010
Math and Reading Texas Assessment of Knowledge and Skills (TAKS) scores to the 2011
TAKS scores using a value added model. The impact of the program on student attendance and
discipline was collected from the school’s records that were used to see the correlation between
math and reading performance with attendance and discipline. Questionnaires at the beginning
and the end of the year informed researchers of the impact of the program on math and reading
learning motivation and their attitudes toward learning with computers. The researchers
qualitatively analyzed and coded data from 55 observations on the experimental and control
groups that were used to gain knowledge of the impact of the program on instructional and
learning practices with emphasis on using technology to increase instructional outcomes.
The results showed a significant difference in gains on the TAKS test scores for the
experimental group over the control group. The experimental group had 29% less absences
while the control group had an increase in student absences. The experimental group had less
discipline issues while the control group remained the same. Observations also revealed that the
one-to-one teacher-student interactions increased significantly in the experimental rooms over
one-to-one teacher-student interactions in the control rooms. This study provides evidence that
knowledge is not transferred from teachers to students but is a result of a collaborative social
constructivism environment (Rosen & Beck-Hill, 2012).
32
Researchers Valiande and Tarman (2011) conducted a study to determine how,
“information and technology can enhance and add to the effectiveness of differentiated teaching
in mixed ability classrooms” (p. 169). The study with 30 elementary teachers participation used
both qualitative and quantitative methods so that a more precise perspective of the impact of the
implementation of technology in the classrooms of this study. The researchers believed the use
of the technology let all students receive instruction at their readiness level allowing them to
“become ‘constructors’ of their own knowledge and information” (Valiande & Tarman, 2011,
p.170). Valiande, Kyriakides, and Koutselini (2011) wrote, “The theory of differentiated
instruction is based mainly on the theory of social constructivism (Vygotsky, 1978)” (p. 3).
Vygotsky (1978) believed learning occurs in the zone of proximal development (ZPD) and
progresses at a greater rate with the assistance of a teacher or more capable peer. He believed
that capabilities that already exist do not need to be learned and will not benefit from instruction.
Teachers have to meet students where they are academically for students to construct knowledge
according to Vygotsky (1978). Vygotsky (1978) distinguished between “the actual
developmental level [ZAD], that is, the level of development of a child’s mental functions that
has been established as a result of certain already completed developmental cycle” (p. 85) and
the potential development (ZPD) of the child. The theory of differentiated instruction determines
an individual’s ZAD through formative assessment and then places their instruction at their ZPD
with no regard to age, grade, or where other students ZPD level might be in their classroom
producing the most effective means of instruction and academic growth for the individual.
Valiande and Tarman (2011) concluded from their study that to successfully teach a mixed
ability class the instruction would have to be differentiated. “Finding of this study show that
differentiated instruction occurs efficiently when teachers implement ICT effectively” (Valiande

33
& Tarman, 2011, p. 169) They saw that technology could be incorporated into the classroom so
that instruction could meet the individual needs so that a mixed ability classroom would not
suffer from a one size fits all instructional method.
Use of Technology in Mastery Learning: Studies that used Technology to Implement
Mastery Learning.
Kent Miles (2010) conducted a study on Mastery Learning and Academic Achievement.
The study examined the outcomes of students taught 8th grade mathematics in a traditional
classroom setting compared to a classroom using an achievement goal theory with a mastery
approach to instruction. The assessment for the comparison between the experimental group and
the experimental group was STAR Math a computer-based assessment from Renaissance
Learning. This assessment is a norm-based test using a 1400 point scaled score spanning first
through twelfth grade. Miles (2010) stated that the validity of the assessment was based on:
comparing the STAR Math assessment to other …. tests of mathematics achievement.
These included the California Achievement Test (CAT), the Comprehensive Test of
Basic Skills (CTBS), the Iowa Test of Basic Skills (ITBS), the Metropolitan
Achievement Test (MAT), the Stanford Achievement Test (SAT), and several statewide
tests. The results indicated a construct validity coefficient of .65 on average in
grades 1-12. (p.61-62)
Additionally, Miles (2010) ran a Motivational Orientation Inventory (MOI) that examined
students’ motivation concerning: “(a) mastery (task) goal orientation, (b) performance-approach
orientation, and (c) performance-avoidance goal orientation” (p. 62).
Both the control group and experimental (treatment) had the same curriculum. The
students from experimental group were able to choose their collaborative partners where the
34
teacher assigned the control groups’ partners. Formal recognition of academic achievement in
the experimental group was individualized based on student’s effort and personal growth
whereas in the control group formal recognition was based on grades and class ranking. The
experimental group would have small group instruction for students working on similar
objectives while the control group had no small groups. The experimental group avoided using a
grading curve and strived for 80 percent mastery whereas the control group curved test scores
and did little in the way of remediation. Students’ in the experimental group set their own pace
and were allowed extra time to master objectives whereas in the control group the pacing was
controlled by the teacher.
Miles (2010) concluded that the mastery goal structure significantly increased math
achievement based on the fact that the experimental group had double the scale score growth of
the control group on the STAR Math assessment. The Motivational Orientation Inventory from
this study was to “evaluate the motivational orientation of the students, students’ perceptions of
classroom instruction, and students’ academic efficacy before and after treatment” (Miles, 2010,
p. 109). The results from the MOI data were statistically insignificant other than performance
avoidance behavior (Miles, 2010). Miles (2010) concluded that the higher achievement did not
significantly change student’s motivational orientation.
A study conducted by Lin, Liu, Chen, Liou, Chang, Wu, and Yuan (2013) entitled Game-
Based Remedial Instruction in Mastery Learning for Upper-Primary School Students examined
the effectiveness of using computer games for remedial instruction using elements of mastery
learning design. Lin et.al (2013) stated, “In order to remedy the shortcoming of traditional
teacher-centered instruction that ignores the need of students with low achievement, Bloom

35
(1968) proposed the idea of mastery learning” (Lin et.al., 2013, p. 271). Bloom (1968) asserts
that most students can learn given enough time.
A computerized monopoly game was constructed for this study. When the dice was
rolled and a student moved on the board a mathematical question would appear for the student to
answer. If answered correctly the student could continue to move around the board. If answered
incorrectly a video appeared to instruct the student on how the problem can be solved. In order to
proceed the student must master the skill needed to solve the math problem. The video could be
reviewed as often as necessary to learn the material. Pre and posttest outcomes demonstrate that
“the integration of an instructional video based on the concept of mastery learning is beneficial
for students learning mathematics” (Lin, et. al., 2013, p. 277). The study concluded “an
integration of mastery learning strategies with game-based learning provides greater benefits for
students learning mathematics” (Lin, et al., 2013, p. 278). Due to the fact that all students could
learn at their own pace, students were able to masters the mathematical content covered in the
lessons.
Impact of Technology Use on Student Engagement: Technology can be used to Impact
Student Engagements in the Learning Process.
Research on student engagement began in the early 1980s as a study on the drop out rate
of American high school students and their disengagement from the learning process (Mosher &
McGowan, 1985). James J. Appleton, Sandra L. Christenson, and Michael J. Furlong (2008)
state that, “The theoretical and research literatures on engagement generally reflect little
consensus about definitions and contain substantial variations in how engagement is
operationalized and measured” (p. 370). Most researchers agree that student engagement is
multi dimensional however they have not agreed upon what those different dimensions are

36
(Christenson, Reschly, & Wiley, 2012). Finding consensus on a definition of and how to
measure student engagement was the goal of Sandra L. Christenson, Amy L. Reschly, and Cathy
Wiley (2012) in the publication of their book Handbook of Research on Student Engagement that
had over seventy contributing authors in the 39 chapters of the book. In the epilogue of this
book they define student engagement as:
Student engagement refers to the student’s active participation in academic and co-
curricular or school-related activities, and commitment to educational goals and learning.
Engaged students find learning meaningful, and are invested in their learning and future.
It is a multidimensional construct that consists of behavioral (including academic),
cognitive, and affective subtypes. Student engagement drives learning; requires energy
and effort; is affected by multiple contextual influences; and can be achieved for all
learners. (pp. 816-817)
Reschly and Christenson (2012) summarized that “student engagement is a burgeoning
construct. It is viewed as a basis of theory and interventions related to high school dropout, high
school reform, and as a necessary element for improving student outcomes” (p. 17). Much of
what is learned from this research can be applied to all students not just high school students.
One accepted theory from the student engagement research is goal orientation theory,
which examines the students’ self-perspective on ability, motivation, and self-regulated learning
in a highly differentiated classroom. “Goal orientation theorists argue that practices that are used
by teachers in the classroom influence student motivation” (Ames & Archer, 1988 as cited in
Anderman et al., 2001, p. 77). The highly differentiated classroom viewed through the lens of
the goal orientation theory lens can examine the effect of students’ self-perception using this
instructional method. “From an engagement perspective, students who hold mastery goals are

37
likely to be more cognitively, emotionally, and behaviorally engaged with tasks because the
overarching “goal” is task mastery” (Anderman & Patrick, 2012). Online technology allows
students and teachers to track objectives (tasks) that have been mastered which demonstrate a
student’s growth.
Technology with Face-to-Face Instruction to Improve Efficiency of Math Instruction: A
Combination of Online Teaching and Face-to-Face Learning can Increase the Efficiency of
Student Growth in Mathematics.
Jeffery S. Drysdale, Charles R. Graham, Kristian J. Spring, and Lisa R. Halverson of
Brigham Young University in an analysis of research being conducted in the area of what
currently is called blended/hybrid learning found 205 dissertations or theses that were relevant to
their definition of blended learning (2012). The definition used in this study was based on
Charles R. Graham’s definition in the Handbook of Blended Learning: Global Perspectives,
Local Designs (2006) “blended learning systems combine face-to-face instruction with
computer-mediate instruction” (p. 6). The search was conducted in the ProQuest Dissertation
and Theses Database (PQDT) due to the fact that “PQDT receives 97.2% of all dissertations and
theses from research universities in the United States (276 of 284) and 87.2% (41of 47) of those
from Canadian research universities” (Davies, Howell and Petrie, 2010, p. 45). When these
dissertations and theses were examined and analyzed be the researchers they found that the
studies were equally divided between quantified inferential and qualitative studies.
Approximately half of the studies were focused on learner outcomes, which included:
performance, satisfaction, engagement, effectiveness, motivation and effort, independence in
learning, and retention rates (Drysdale et.al, 2012). There was little research found before 2008
in K-12 schools and "only five instances of K12 instruction qualified for the analysis, leaving a

38
need for further study on the subject” (Drysdale et.al, 2012, p. 4). A closer look at the research
reveals that the K-12 studies are mainly high school blended programs with little reference to
elementary schools. Additionally the researchers of this survey found that theoretical
frameworks for the 205 studies they looked at were weak and that “few researchers used
theoretical frameworks to shape their research questions” and that there was a “significant need
for more theoretical contributions unique to the context of blended learning” (Drysdale et.al,
2012, p. 17). Researching the use of technology in education can be difficult due to the fact that
the use of technology can be different not just from classroom to classroom but from student to
student in a single classroom. Due to the fact that blended learning is in its infancy theoretical
frameworks and terminologies have not been entirely solidified (Graham 2013; Drysdale et.al,
2012; Picciano, Dziuban, & Graham, 2014).
Heather Staker and Michael B. Horn note the differences between postsecondary and K-
12 education (Blended learning in the K-12 education sector, Chapter 19 in Picciano, A. G.,
Dziuban, C. D., & Graham C. R., Blended learning: research perspectives vol. 2, 2014). One
thing that Staker and Horn acknowledge is the in locos parentis role that the K-12 schools play in
today’s society. Children need a safe place to be while parents are working during the day. This
fact changes the way blended learning can be implemented in K-12 schools due to the fact that
students are on site and instruction with the use of technology can become more personalized in
comparison to a strictly on-line instructional method. Blended programs vary from school to
school with variations on the amount of time spent on instruction versus direct instruction.
Staker and Horn (2012) wrote a white paper for the Innosight Institute (renamed in 2013 the
Clayton Christensen Institute after Harvard Business School luminary) to help establish a
blended learning taxonomy so that K-12 schools could have a common language in which to
39
better communicate in discussions, collaborations and research. In their study they looked at
approximately 80 different programs where they found four distinct clusters of methods that met
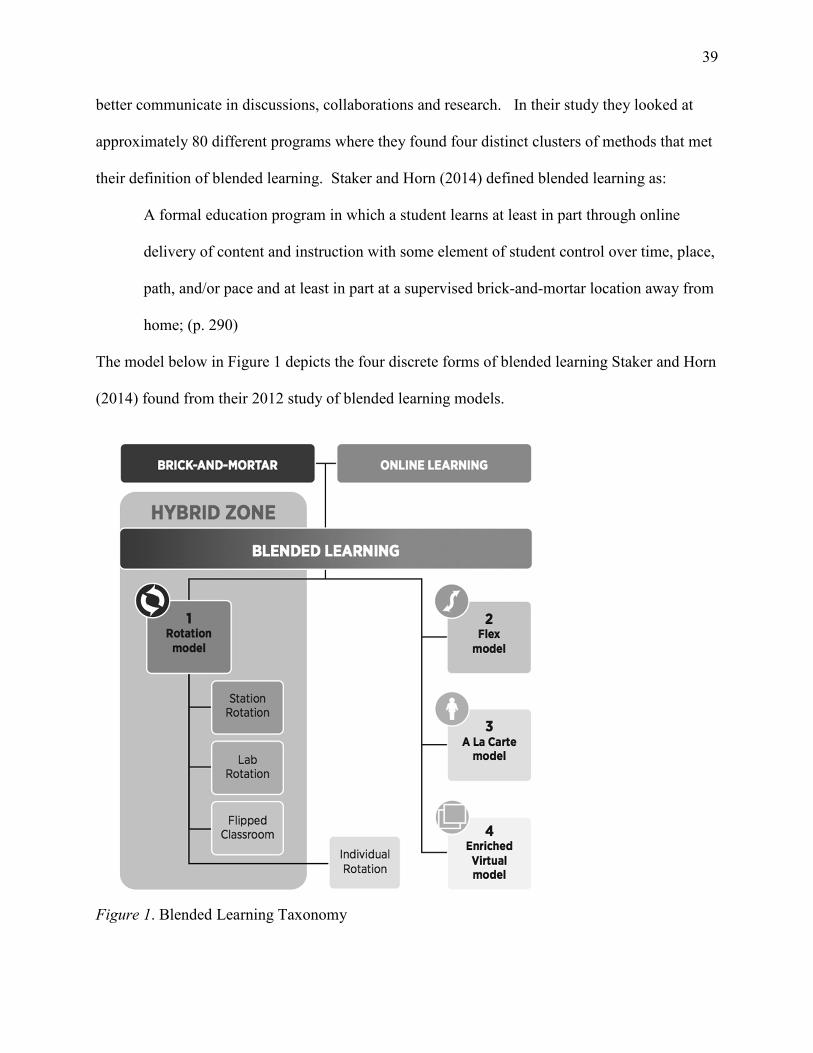
their definition of blended learning. Staker and Horn (2014) defined blended learning as:
A formal education program in which a student learns at least in part through online
delivery of content and instruction with some element of student control over time, place,
path, and/or pace and at least in part at a supervised brick-and-mortar location away from
home; (p. 290)
The model below in Figure 1 depicts the four discrete forms of blended learning Staker and Horn
(2014) found from their 2012 study of blended learning models.
Figure 1. Blended Learning Taxonomy

40
Their rotation model is broken down into four different models of rotations:
• Station rotation. This can be groups or whole class moving from online learning and
direct instruction on set time schedule or teacher’s prerogative.
• Lab rotation. The students rotate on set time schedule to a computer lab for online
learning instruction separate from the classroom.
• Flipped classroom. Direct instruction in the classroom with online learning done off site
often as homework.
• Individual rotation. A more personalized student centered approach model of rotation
between online learning and direct instruction. The rotation schedule is based on the
individual needs.
The second blended learning model that Staker and Horn (2012) found from their study
was what they called the Flex model. They found many models that were variations of the flex
model where the main part of instruction was online learning. The teacher can alter instruction
in a flexible manner providing the individual student the support needed to be successful. This
can come in many forms: small group instruction, scaffolding with peers, and one on one
instruction from the teacher. Additionally, teachers can assign individual online activities to
target an area where students are struggling.
The A La Carte model is the third model that Staker and Horn (2012) identify in their
study. This model is a combination of online learning courses and traditional courses. The
online courses are virtual courses that are not supplemented with any face-to-face instruction.
These courses are not blended learning but allow the student to attend other classes in a brick and
mortar school to experience the environment of the brick and mortar school. The courses that

41
are not online are taught in the traditional manner with face-to-face direct instruction methods.
The students can work on their online courses at school or at home choosing when and where
they will work on these courses.
The fourth model that Staker and Horn (2012) identified was what they referred to as the
Enriched Virtual Model that is a combination of face-to-face instruction with off-site online
learning. This model differs from the Flipped Classroom due to the fact that students do not
attend the brick and mortar school on regular weekday daily schedule. Staker and Horn (2012)
found that many of these schools started out as online schools and then added the brick and
mortar to create a blended learning model that could provide extra support for students so they
could have success in their learning experience.
Mastery Learning
Mastery Learning: 1968 ~ 1976. James H. Block and Robert B. Burns (1976)
conducted a survey of the studies on mastery learning that they believed was “the best of the
mastery learning to date” (p. 13). The criteria for their search of studies were that the study was
conducted in a school environment and were based on typical school objectives (Block & Burns,
1976). “The research we sought had to employ learning task that were meaningful, complex and
relatively long” (Block & Burns, 1976, p. 13). Block and Burns (1976) only used studies that
were pre-experimental, quasi-experimental and true experimental designed and where the
experimental and control groups were probabilistically equivalent. Block and Burns (1976)
looked for master learning studies in published books, journals, unpublished papers from
research meetings, and unpublished dissertations.
The studies collected by Block and Burns (1976) were broke into four types of research:
Type 1 studies examined if mastery learning was more effective than traditional methods

42
answering the question “Does it work” (p. 14). Type 2 research examined the affective and time
consequences of mastery learning. The third types of studies investigated the effect of mastery
learning for different kinds of learners and are there some components of mastery learning that
work better than other components. The fourth type of research that Block and Burns (1976)
referred to as an emerging field of research was why does mastery learning work and how do
you implement it.
Block and Burns (1976) stated that research in the Type 1 category demonstrates that
mastery learning does work. “In quantitative terms, mastery approaches have usually produced
greater student learning than non-mastery approaches, and they have usually produced relatively
less variability in this learning” (Block & Burns, 1976, p. 25). From a qualitative perspective
master learning has helped student learn higher order thinking.
The affective consequences examined in the Type 2 research concluded that “mastery
strategies have had a positive impact on students’ interest in and attitudes toward the subject
matter learned, self- concept (academic and more general), “academic self-confidence, attitudes
toward cooperative learning, and attitudes toward instruction” (Block & Burns, 1976, p. 26).
The second part of the Type 2 research found that the slower students using the mastery learning
methods overtime began to work more efficiently which led to a homogenous effect in regards to
the issue of time class-wide. Block and Burns (1976) stated “Our student time cost data suggest
that mastery strategies might eventually help slower students to learn more like faster students
do” (p. 32). The research indicates that students that initially works slower than some at first
may eventually work at the same pace as their peers over time.
The research from the third category concluded that the most important component of
mastery learning is the unit mastery requirement. Block and Burns (1976) wrote “we would

43
hypothesize that the reason the unit mastery requirement and the meeting of that requirement
have exerted such an influence over student learning is because they have affected the quality
and the quantity of student study time” (p. 35-36). Studies that failed to maintain strict unit
mastery requirements showed less student achievement and retention than the studies that kept
stringent requirements of unit mastery before proceeding to the next unit.
The Type 4 area of this research looks at materials that have created to instruct teachers
on how to implement mastery learning. There have been materials written by Block and
Anderson (1975) on implementing mastery learning in the elementary classroom. Okey and
Cielsa (1975) developed a module instructing elementary and junior high teachers how to
implement mastery learning. Anderson and Block have developed mastery-training material for
the college level. The Type 4 research concluded there are materials for training pre-service and
in-service teachers how to implement mastery learning strategies in the classroom.
Block and Burns believed “that the most important practical implication of the research is
that mastery learning strategies may represent one of those major breakthroughs to the
improvement of student learning for which the educational research and development
community has been searching (e.g., Krathwohl, 1974)” (Block and Burns, 1976, p. 38). The
theoretical implications of this study show the need for learning theories to be developed in the
school environment rather than in laboratories due to the fact that laboratory developed theories
are sometimes difficult to implement in the classroom (Block and Burns, 1976). Block and
Burns (1976) express their concerns that the ideological implications are that the vast majority of
teachers do not have faith in the fact that most students can reach mastery of material. Mastery
learning provides evidence that teachers have underestimated the capabilities of students to learn.

44
Mastery Learning: 1976 ~ 1986. Thomas R. Guskey and Sally L. Gates (1986)
gathered studies on group based mastery learning from the Educational Resource Information
Center (ERIC), Dissertation Abstracts, and the Psychological Abstracts databases. Additionally
a manual search was conducted through Glenn M. Hymel’s Mastery Learning: A Comprehensive
Bibliography. Guskey and Gates (1986) decided, “Since the Block and Burns review was judged
to be fairly complete summary of the research conducted through 1975, we focused our search
on articles and manuscripts that appeared after that year” (p. 74). The initial 234 potential
articles were reduced to 27 that dealt with elementary and secondary education. The criteria to
be included in this review was the study had to be group based, had to report on measured
outcomes for students mastery learning groups and control groups, and to be free of
methodological flaws (Guskey & Gates, 1986). The studies were quantified to include: time
variables, student affect, student achievement, student retention, and teacher variables.
Guskey and Gates (1986) meta-analysis of the 27 studies that met the criteria for this
review concluded that student achievement for the mastery-learning group was extremely
positive when compared to the control groups. “To quantify the outcomes of these studies we
used effect size, a statistic calculated by taking the difference between the means of the treatment
and control group and dividing that difference by the standard deviation of the control group
(Glass 1976)” (Guskey and Gates, 1986, p. 75). A +1.0 would be considered a significantly
positive outcome. This would mean the experimental group achieved a level that only the top
15% of students in the control group reached (Guskey & Gates, 1976). The effect size for
student achievement in grades 1-6 was .89 and for grades 7-8 was .92. The effect size for
student achievement for grades 9-12 was .72. “All of the 25 elementary and secondary school
studies reporting achievement out comes showed positive effects as a result of the application of

45
group based mastery learning strategies” (Guskey & Gates, 1986, p. 74). The mastery learning
strategies proved to be effective in all grades especially elementary and junior high schools.
The time variables for mastery learning showed an effect size of .68. Bloom (1971)
stated that mastery learning would reduce the differences of time needed between the faster
learners and slower learners. “Learning rate does appear to be alterable and mastery learning
procedures may be one way slow learners can be helped to increase their rate of learning”
(Guskey & Gates, 1986, p. 77).
From the group of studies in this review three of the studies investigated retention of
learned material (Guskey & Gates, 1986). One course in 8th grade Algebra found the effect size
of mastery learning to be .62 after the both groups were tested two weeks after the completion of
the course. Another group tested both groups on learned material three weeks after completion
of course and found a retention rate of .51 favoring the mastery-learning group. The one study
that did a long-term investigation was an elementary study that tested retention four months after
the completing instruction. “The retention of mastery student was again found to be significantly
greater with an effect size of .52 (Guskey & Gates, 1986, p. 77).
Only one study in an elementary school measured student affective variables. The study
measured student’s attitude toward the subject being learned and their own self-concept of their
learning abilities (Guskey & Gates, 1986). Students that were in the mastery group overall like
the subject better than control group with an effect size of .41 and were more confident about
their abilities with an effect size of .49 over the non-mastery group.
Teacher variables were the last area to be investigated by this review. Teachers using
mastery learning methods begin to believe that their instruction practices and behavior are more

46
important (effect size 1.13) than personality factors (effect size .38) (Guskey & Gates, 1986). As
they wrote,
Guskey (1984) found that teachers that use mastery learning and see improvement in
student learning outcomes begin to feel much better about teaching and their roles as
teachers (effect size .61), accept far greater personal responsibility for their students’
learning successes and failures (effect size 1.25), but express somewhat less confidence
in their teaching abilities (effect size -.59). (Guskey & Gates, 1986, p. 78)
Guskey & Gates (1986) believe that is important to conduct master-learning studies in
actual classrooms rather than is a laboratory classroom. The disadvantage of conducting studies
in actual classrooms, acknowledge by Guskey and Gates (1986), is that there will many variables
that cannot be controlled. Additionally the problem of precision in the treatment has as many
variables as there are students in the classroom. Overall Guskey and Gates (1986) wrote, “the
research evidence reviewed here indicates that the use of these strategies [mastery learning] can
result in significant improvements in a broad range of student learning outcomes and teacher
variables (p. 79).
Mastery Learning 1972 ~ 1986. Chen-Lin C. Kulik, James A. Kulik, and Robert L.
Bangert-Drowns (1990) conducted a meta-analysis study on the effectiveness of mastery
learning programs. To find studies for their meta analysis a search was conducted through two
library databases that were the Educational Resources Information Center (ERIC) and
Comprehensive Dissertation Abstracts. Additionally a second source was material referenced in
the original articles retrieved from the databases. The selection of studies to be included in the
meta-analysis had to meet four criteria: students taught using mastery learning methods are
compared to students using traditional methods, mastery method be no less than 70% on

47
assessments, methodology must be robust without flaws, and must contain quantitative results
large enough to evaluate effect (Kulik et al., 1990). There were 108 studies that met the
selection criteria.
End of course assessments was the most common outcome measured in the 108 studies.
Other variables that were measured included: retention, attitude toward instruction and subject
matter, course completion, and the time needed for learning (Kulik et al., 1990). The studies that
reported end of course assessment scores, which were 103 of the 108 studies, reported positive
effect for all but 7 studies. “Also, 67 of the 96 studies with positive effects reported that the
difference in amount learned by experimental and control groups was great enough to be
considered statistically significant” (Kulik et al., 1990, p. 271). These studies showed an
increase from the 50th percentile to the 70th percentile on end of course assessments.
Of the eleven studies that did follow up assessments all showed a positive effect in
retaining the instruction from the use of the mastery learning method. A more positive attitude
was found in 16 of the 18 studies that addressed the variable of attitude toward instruction.
Twelve out of the 14 studies that addressed the variable of attitude toward subject matter found a
more positive attitude in the classes that used a mastery learning method. Course completion
rate in the traditional methods of instruction was slightly higher than the mastery learning
methods. The groups that used mastery learning methods compared to traditional methods
needed slightly more time for instruction (Kulik et al., 1990).
The findings from this study concluded that mastery-learning methods made a positive
impact on summative assessments, attitudes toward instruction and attitudes toward subject
matter (Kulik et al., 1990). Additionally this study concluded that the affects of mastery learning
were more significant on the weaker students and did require slightly more instructional time.

48
The studies in this literature review show that mastery learning is an effective method of
instruction that will produce more positive outcomes on summative assessments than traditional
methods of instruction. Additionally it reveals the ability to differentiate instruction down to the
single student using technology also contributes to increases academic outcomes on summative
assessments. Combining mastery learning with a blended learning environment can greatly
impact math instruction in the elementary classroom.

49
Chapter III: Methodology
Rationale for a Case Study Design
To examine how the teachers in this study increased math achievement in their
classrooms there are to many variables to conduct a quantitative research method so a qualitative
method was chosen (Stake, 1995). Every student’s needs were addressed individually daily
causing a constantly changing environment of instructional methods being implemented.
Quantitative data does shows that outcomes on summative math assessments were significantly
greater in the two classrooms of this study than the normal classroom however it does not
explain how or why this occurred. To answer these questions a qualitative approach is best
suited to answer how and why the two classrooms produced greater math achievement on their
math summative assessments. This mixture of quantitative and qualitative data asking how and
why can best be examined with a case study approach (Yin, 2003).
The researcher will write a description of the case within in its setting and boundaries
simply stating the facts of the case adding this to the database (Creswell, 2009). The boundaries
for this case study will be looking at growth in mathematics in two classrooms rural Alaska
classrooms. The growth on state summative assessments, STAR Math assessments and MAP
from NWEA assessments in mathematics by these two classrooms over many years is significant
and this study will be looking for how and why this occurred by interviewing the teachers
administrator, and students from these two classrooms.
This qualitative case study inquiry presents how students’ achievement in math was
achieved from the perspective of the participants (administrator, teacher, and students) and how
the blended learning environment inclusive of the use of technology affected students’
engagement and achievement in learning mathematics. A study that reveals the methods of

50
using technology in math instruction to significantly improve the effectiveness of math
instruction will be a valuable addition to the current body of empirical evidence on differentiated
instruction. The two classrooms of this study have consistently produced significant
improvement of student outcomes in mathematics summary assessments (Appendix E) and these
methods have been proven to be transferable to other teachers and classrooms.
A case study will bring more insight to how these two classrooms had significantly better
outcomes than other classrooms in this rural Alaskan community whereas a quantitative study
would only reveal the already known fact that these three classes had superior outcomes on the
Alaska Standards Based Assessment in mathematics. When one is seeking an explanation of
how and why a phenomenon occurred a case study is an appropriate method of research (Yin,
2005). The use of a qualitative case study is appropriate due to the fact that little research has
been done on the use of technology in mathematics instruction in elementary classrooms and
“qualitative research is exploratory and is useful” when the phenomenon is complex in nature
(Creswell, 2009, p. 18).
Site and Participants
The setting for this case study is a rural community public elementary school in a school
district in southeast Alaska. Ketchikan Gateway Borough School District (KGBSD) is located
on the Revillagigedo Island off the coast of the mainland in Southeast Alaska. The main
industries of the island are tourism, fishing, and government work (e.g. coast guard, forest
service, local government).
The school has approximately 350 students of which: 43 percent are Caucasian, 33
percent are Alaskan Native, 15 percent are Asian, 3 percent are Multi Ethnic, 2 percent are
American Native, 2 percent are Hispanic, and the remaining 2 percent are classified as other.

51
Forty-eight percent of the student population is economically disadvantaged. The classrooms in
this case study consist of students from one 5th grade classroom and one 6th grade classrooms.
Focus groups will be conducted with several former cohorts of students having been in these
classrooms. The teachers that will be interviewed one 6th grade teacher and one fifth grade
teacher. Additionally, the building administrator of the school during the time frame being used
in the case study will be interviewed.
Study Context
This study examined mathematics outcomes on three different kinds of summative
assessments. The first is the Alaska Standards Based Assessment (SBA) that was used from
2006 thru 2014. The Data Recognition Corporation (DRC) that was founded in 1978 as a testing
and surveying company, worked with Alaska to develop the SBA based on Alaska State
Standards to meet the NCLB testing requirements. The second summative assessment is STAR
Math from Renaissance Learning, which is a skills based assessment of math achievement. The
predictive validity average on over 45 studies involving over 45 states involving over 60,000
students in math had a validity coefficient of 0.70 for 5th grade and 0.73 for 6th grade (STAR
Assessment, 2014). The validity for internal consistency in study of over 2 million 5th and 6th
grade students was 0.93 (STAR Assessments, 2014). The third assessment is the Measure of
Academic Progress (MAP) from Northwest Evaluation Association (NWEA). Educators and
researchers in Oregon and Washington founded NWEA in 1973. This nonprofit organization’s
goal was to create a new kind of testing tool to measure individual student’s academic level and
growth. Currently over 10 million students use the MAP assessment annually to track academic
growth.

52
The Ketchikan Gateway Borough School District (KGBSD) tracked the growth and
progress of students and teachers by using a value added model based on the outcomes of scores
on the Alaska Standards Based Assessments (SBA). The difference in scale scores from spring
to spring determined the amount of growth or regression of students. The chart in Appendix E
shows the value added average outcomes for the fourth, fifth, and sixth grade teachers’ students
in the KGBSD. The blue bar represents the year 2013 and the red bar represents the average
outcomes from 2008 through 2013. Two teachers averaged over double the growth of the fourth
ranked teacher in this school district with nearly half of the teacher’s averages regressing year
after year. The intellectual goal of this study will be to determine how these two teachers had
significantly higher outcomes in mathematics than the rest of the fourth, fifth and sixth grade
teachers in the Ketchikan Gateway Borough School District.
In 2013 the elementary school of this study began using MAP from NWEA to monitor
student growth. On the summary growth report is a column marked School Conditional Growth
Percentile which is a metric that shows how students growth compares to the approximately 10
millions students that take the MAP assessment annually. This measurement allows for
comparison of projected growth to other schools across subject areas and grade levels. The
school of this study’s 5th grade is in the 99 percentile and the 6th grade in the 97 percentile of the
conditional growth index for the approximately 10 million students that take the MAP
assessment annually. Both the Alaska SBA and MAP are based on a Rasch model. The SBA
scale is designed to measure horizontally (grade level criteria) and the MAP scale was designed
to measure vertically (overall growth from year to year). The MAP according to Richard M
Smith (personal communication November 10, 2016) editor of the Journal of Applied
Measurement recommended using the “MAP data due to the availability of the data across

53
cohorts and the superior scale properties when studying growth.” The MAP and STAR Math
give us grade equivalency data due to the fact that they measure vertically which gives educators
greater insight to overall growth in comparison to the Alaska SBA, which will give results to the
mastery of criterion of a single grade level.
Data Collection
The qualitative data was gathered came from a variety sources. As Creswell (2007)
states, “The data collection in case study research is typically extensive drawing on multiple
sources of information” (p. 75). Data was collected in the form of interviews, focus groups
interviews, and participants’ stated observation. Focus groups was formed with the students who
participated in the classrooms involved in this case study. There were one-on-one, face-to-face
interviews with the teachers and administrator involved in this case study. The focus group and
interview protocols for each stakeholder group can be seen in Appendices and include open-
ended questions that allow interviewees to talk and the interviewer to listen and take notes
(Creswell, 2007; Stake, 1995).
Two teachers, one administrator, and current and former students of Ketchikan Gateway
Borough School District who participated in and/or were affiliated with the math program being
studied were recruited for their participation. Recruitment letters for students were sent to the
parents of students. Students were be selected based on who was willing to participate
irregardless of gender, ethnicity, academic levels or socio-economic levels. The primary
researcher conducted the interviews at any location the participant chooses outside of normal
school/work hours. The teachers and student focus groups were interviewed following the
interview protocol forms in Appendix A and B. Interviews for all participants were recorded and
transcribed using Rev transcription services that provide the data that was used for analysis. The

54
interviews for the administrator and teachers were conducted by the researcher and were
approximately 60 minutes. Student focus group interviews were 30 to 50 minutes and the
researcher conducted these interviews.
Data Analysis
Data analysis is an ongoing process that begins when the data is first being collected until
final interpretations. Stake (1995) wrote, “There is no particular moment when data analysis
begins. Analysis is a matter of giving meaning to first impressions as well as to final
compilations” (p. 71). The transcribed interviews were organized into a data bank and read
through for analysis. The analysis was coded “begin with open coding, coding the data for its
major categories of information” (Creswell, 2007, p. 64). From this data axial coding was
conducted which looked for categories that reveal how the research question will be answered
(Creswell, 2007). From an analysis of the codes and categories, themes were developed that
contribute to an explanation as to how and why this growth in mathematics occurred. This
process was done individually on the data collected from each group, administrator, 5th grade
teacher, 6th teacher, and student focus groups. The themes from the different groups were then
brought into summary themes built from the perspectives of all groups combined. The coding
process is often cyclical according to Saldaña (2013) where the researcher will code and then
recode. The researcher used an interpretivist view that relied heavily on naturalistic methods to
determine what are the unique characteristics and differences in these two classrooms that led to
the significantly different outcomes in mathematics.
Validity and Credibility
Researcher constructed validity by using many sources of evidence, having a cumulative
amount of evidence and have key participants review case study (Yin, 2009). Researcher will

55
build internal validity by thorough matching of coding process, explaining the choice of analytic
data units, addressing other possible explanations of results and why the conclusions drawn are
correct. Using proper protocols for case study and showing that the data will produce the same
results with repeated procedures of the case study.
Protection of Human Subjects
The researcher received approval from Northeastern University Institutional Review
Board for this case study. An explanation of the purpose of the study was given and explanation
of how the answers to the questions will be used and assurances of their anonymity of their
responses to questions in interviews. Written permissions were signed before any interviews
took place (Stake, 1995). All interviews were recorded, transcribed and done face to face. The
interviewees will be offered a copy of their interviews once they are transcribed (Creswell,
2007). All participants will were informed about the research that was conducted in their
classroom. After an explanation of how the research will be conducted to the students and their
parents a written explanation of the research to be conducted was provided. Earnest T. Stringer
(2007) wrote that written consent documents should include:
1. People have the right to refuse to participate.
2. They may withdraw from the study at any time.
3. Data related to their participation will be returned to them.
4. Any information (data) will be stored safely so that others cannot view it.
5. None of the information that identifies them will be made public or revealed to others
without explicit and written consent. (p. 55).
Stringer (2007) further states that teachers engaging students in routine matters such as,
“find[ing] better ways of attaining learning objectives” may not require formal consent (p. 55).

56
However, it would be wise to acquire written consent so that students and parents are fully aware
of the research being conducted and what their participatory role will be. It is imperative that
checks are put in place to ensure the trustworthiness of the action research study (Stringer, 2007).
Four attributes to assess in a study: credibility, transferability, dependability, and confirmability,
are suggested by Lincoln and Guba (1985) to establish the trustworthiness and rigor of a study
(as cited in Stringer, 2007). This will lead to assuring the truthfulness and validity of a research
study.
Conclusion
There are significant differences in the outcomes on the state summative
assessment in mathematics than there are in the remaining 20 or more classrooms in this school
district. This case study’s goal was to reveal the reason for these significant differences in
outcomes on state summative mathematics test so that this information can be shared with other
colleagues in this school district and through out Alaska so that more student can reach Mastery
in Mathematics.

57
Chapter IV: Research Findings
The purpose of this case study is to understand why mathematical achievement was
significantly higher in two classrooms employing blended learning across multiple years in a
rural Alaskan elementary school as perceived by the administrator, two teachers, and students
from these classrooms. While the quantitative data shows a consistent significant difference
between the classrooms in this study and other classrooms in the school, district, and state on
summative assessments it does not explain why this has occurred. By interviewing the adults
and students involved in these classrooms and examining their perspective on why the academic
growth in mathematical outcomes was significantly higher in their classrooms might recommend
instructional strategies that can be put to use in other classrooms to increase student achievement
as well.
Below are the perspectives of the former administrator of the school, the two teachers,
and several students having experienced the program that is the subject of this study.
Administrator’s Perspective
The principal of the school with the two classrooms under review in this study went to
graduate school at the University of Southern Alabama and earned a Master of Education and
began working as a teacher in the school district that this study is conducted. In 2005 he became
the principal of the elementary school with the two classrooms being reviewed in this case study
that had failed to make AYP on the 2004 state test. This was his first year as an administrator
and teachers in the building approached him and expressed their concern that a new 5th grade
teacher, which is the researcher of this study, was not following the adopted school district’s
curriculum.

58
When he called the fifth grade teacher to his office to discuss the issue the fifth grade
teacher brought the school district’s math curriculum with him. The 5th grade teacher proceeded
to explain why this curriculum would not lead to successful outcomes for the 17 Title I students
and 5 ESL students in his classroom. This teacher had purchased eight Dell computers with his
own money and explained to the administrator how he would individualize the students’
instruction in his classroom that would lead to greater growth for the students in his classroom.
The teacher said that he would stand by the outcomes on the state test. And, in the end , his
students ended up with greater growth than all of the fourth, fifth, and sixth grade teachers in the
school district. The administrator allowed the fifth grade teacher to continue this method for the
next six years that he was the administrator of the elementary school of this case study.
Four themes emerged from the coding and analysis of the administrator’s interview were
derived from a close review of administrator’s interview, asking how he perceived the two
classrooms identified achieved significantly more growth on summative assessments than the
other teachers in the school district. The four themes identified are as follows:
- The classroom environment increased student engagement.
- The differentiation was individualized for every student.
- The students preferred the instructional methods.
- The state standards and grade level expectancies were taught to directly.
The classroom environment increased student engagement. The administrator noted
that when he entered these classrooms that all students were engaged. When the administrator
was asked about the environment of these rooms he stated:
the environment; I think one of the things right off the top, kids were engaged. They were
doing things. If we're looking at math time, for example, when you go in there at math

59
the kids are all engaged. They weren't doing things that they had already done. I mean for
the most part they were doing new things.
Additionally, the administrator noted that the environment of these classrooms resulted in strong
positive relationship between the teacher and students. The administrator found it to be
interesting:
that I think a lot of people would miss when you think about that kind of a classroom, is
the kids actually [made] good connections with their teachers, because when they did
[need] help they could go to their teacher and say, Hey I need help on this one particular
area. I think that built a good relationship between the teacher and the student.
The positive relationships within the classroom were further strengthened by student-to-student
relationships due to the fact the teacher would allow a student who mastered an objective to help
another student who was struggling with that objective. The administrator stated, “teachers
would use other peers to help as kind of peer helpers. I think that was really good. It built
relationships that way too.” Overall the administrator found the environment to be positive
which contributed to the outcomes of these classrooms. The relationships built between the
teacher and the students and the student-to-students created an atmosphere of high expectations
where a sense of community was built among all those who participated in the classroom.
The differentiation was individualized for every student. From the administrator’s
perspective the “biggest” difference from the classrooms of this study and the other classrooms
in the building was the individualized differentiation that was implemented in the classrooms of
this study. As he said, “Rather than having groups of kids working at one rate or another thing
or whatever it was, the kids were all able to meet their area of need and progress at their pace to a
large degree.” The administrator saw this individualized differentiation as beneficial in

60
comparison to the “traditional classroom” due to the fact as points out you only reach a portion
of the classroom with traditional methods. He saw the problem with the “traditional classroom”
to be that,
25% of the kids don't get it because it's too hard. 25% already get it so they're not
engaged. You're only kind of teaching to the middle and that just disappeared in those
classrooms where the kids could go at their own pace and deal with the material that was
...relevant to them.
Because the material for the individual student was relevant to the students needs the student
becomes more engaged in the math objective. The administrator stated, “I think the kids were
more engaged because they were doing stuff that mattered to them personally. They weren't
working on fractions if they already knew how to do fractions.”
The students preferred the instructional methods. He stated that some staff had
expressed concerns about the methods being used in these classrooms and said “that maybe kids
hated this and it was an awful thing and that the kids wouldn't like it.” When the administrator
began talking to students to find out how they felt about what was going on in the classroom he
found out that for the students “the lion's share, it was positive. They liked what they were doing.
They liked their teacher. I think that was good all the way around.” Additionally the
administrator found that a key component benefit was the immediate feedback that could be
given to each student by the programs being used. The administrator believed that the immediate
feedback kept students from “wondering” how they were doing on assessments and thought this
was “positive even if the results were not.” Due to the fact results were known instantly, “that if
they were hung up on something, they could get help immediately. That's always a good thing
too. There wasn't this quagmire of waiting to see what's going to happen next or whatever goes

61
with that. I think that's real positive.” The administrator noted that the self-concept of the
students became more positive as they realized that they could become successful academically
in a math class. This led to more engagement in the learning process and less classroom
management problems. The administrator stated that the instructional methods used in the
classroom helped with classroom management. As he said,
I think if it's managed well ... I think one of the things, as long as the kids, the
expectations are there, again, basic classroom management things, and a teacher moves
and does what they need to do I think it does help with management of kids for sure.
Overall the administrator found the blended instructional methods being used in the classrooms
of this study were liked by the students that led to increased engagement, less classroom
management problems and positive academic outcomes.
The state standards and grade level expectancies were taught to directly. The Alaska
State Standards developed in the 2005 developed grade level expectancies for each grade level so
teachers had a clear concise understanding of what expectations for each standard meant for each
grade level. For example for multiplication for 5th grade students were expected to be able to
multiply two digits by two digits. The teachers of the classrooms in this study developed tests
that would test students on all of the grade level expectations for their grade level in
mathematics. The administrator believed one of the major reason that the classrooms of this
study greatly impacted mathematics outcomes was due to the fact that the teachers in these
classrooms were making sure that students had mastered the grade level expectations of the state
standards. The administrator stated,
I'm sure they had kids that couldn't meet those expectations that they started lower that
worked up towards them, but the target was right in front of the kids in a couple of the
62
classrooms to the point where I saw the GLEs written on the board and the kids were
keeping track of which ones they've mastered. I see that as real positive.
The administrator was aware that this led to each student working on the grade level expectation
that they had not mastered so the individual students in the classroom could all be working on
the math objectives that pertained to the individual rather than the rest of the students.
From the administrator’s perspective the: classroom environment, the individualized
differentiation, the instructional methods, and directly addressing the state standards and grade
level expectancies are what led to a significant increase in mathematic growth and outcomes in
the classrooms of this study.
Teacher Perspective – 6th Grade
The 6th grade teacher of this study is a National Board Certified Generalist teacher for
students ages 7~12 from the state of Washington. Both of her parents were educators and she
originally began her college studies in “cognitive neural psychology.” The 6th grade teacher
stated, “I decided after learning what I did that I wanted to apply [this knowledge] in the
classroom.” The 6th grade teacher explained that when she began teaching the “reading
workshop literacy model was coming into prominence.” In the district that she was working in
Washington there were some of the national leaders in this field. The 6th grade teacher stated “I
went to study with them, and just learned about differentiation with literature, and finding
meaningful texts, and reaching kids where they were developed mentally.” When she asked her
colleagues what they were doing about math instruction she said they responded, “they don’t
teach math.” The 6th grade teacher stated that, “They just don’t teach it. They spend all day on
literacy, and they would get 4 to 5 years’ worth of growth with their kids every year, and they
would send math home in a packet for parents to do.” At this point in time this 6th grade teacher

63
stated that she decided she would try to “replicate the success I had with literature in a math
setting.”
The 6th grade teacher described how in her effort to replicate her success in literature in a
math setting she, “worked as a lab classroom teacher and a mentor teacher for the National
Council of Teachers of Mathematics (NCTM), and I had a state … like a liaison. I worked with
State Superintendent’s Office, and we would take the math textbook and completely deconstruct
every lesson.” She described the arduous task of differentiating every lesson as,
It would take us hours per lesson, and we would create differentiation, create multiple
modalities, create formative assessments, and all of that was done by hand as we went
every day for every lesson, and so it was a form of mastery learning, but the technology
wasn’t there to make it something that was transferable.
The 6th grade teacher expressed that she did not think that many teachers would dedicate the time
it was taking her to optimize every lesson for every student and acknowledged that even with all
the hours she was spending she was not at “100%” of what was needed. In 2008 the 6th grade
teacher moved from Washington to Alaska and began teaching at the elementary school that is
the location of this case study. The 6th grade teacher stated,
When I came here, 2008, and was introduced to the technology that was doing for me
automatically what I had been doing for hours every day after school by hand. It was like
a big … an instant like the last puzzle piece came into place. It made it possible for me to
do what I knew was best for kids in a practical way.
The 6th grade teacher of this case study has been using in her own words, “a form of mastery
learning” harnessing technology to achieve significant growth in mathematics in her classroom
since 2008.

64
Four themes emerged from the coding and analysis of the 6th grade teacher’s interview:
- Increased student engagement improved student’s self-concept.
- Student centered instructional methods increases mathematical achievement.
- Technology can be used to differentiate to the individual student.
- Students master their current objective before being moved to the next objective.
Increased student engagement improved student’s self-concept. The 6th grade
teacher’s thought that when instruction is adjusted to the individual student’s ability and students
find success their engagement increases and their personal self-concept improves. The 6th grade
teacher found that by using the blended model instructional methods she was introduced to in
Alaska it changed the dynamics of student engagement and the students own views of their
ability to master mathematics in her classroom. The 6th grade teacher stated,
A lot of times, kids who felt they were unsuccessful in the past, their coping strategy is to
disengage, so they don’t even want to attempt to try to feel like there is much of a chance
they’re going to be successful
The 6th grade teacher found by adjusting, “the task in front of them [students] is appropriate to
where they’re at developmentally” and the students began experiencing success; “Suddenly,
there’s a lot more engagement from the kids, classroom management is less of an issue, their
self-concept changes.” When the 6th grade teacher was asked how teaching math in this blended
model benefitted students she stated that students every year would:
walk in the door and say, I suck at math. I’m terrible at math. I can’t do this, because
their previous experience has usually been having material thrown at them one day, and
the next day, we move to the new topic

65
As she said, this would happen without the students getting the opportunity to master the
objective before them. The 6th grade teacher stated, “many kids every year that once they start to
see themselves as capable of learning and mastering new objectives, it’s really transformative.”
She found that even the students who started slow that, “their pace begins to increase as their
foundational skills increase and their confidence increases.” The 6th grade teacher shared her
perspective on how student engagement increased when the students began to believe they were
capable of being successful. When talking to students at the end of the year with students about
their out comes on major assessments and their grade she would have students tell her thing such
as: “I used to think I could not do math, and now, I can do this, converting decimals to percent,”
or, “I used to think that … I used to hate math, and now, it’s so easy for me.” Observing these
changes in her students changed the 6th grade teacher’s own self-concept. She stated the role in
the classroom using this blended model had changed her role as the teacher compared to a
traditional role of a teacher. As she said,
The role in this case is more guidance, and management, and oversight, administering
assessments and follow-ups, tracking progress, holding students accountable as opposed
to just delivering information, and it requires me to be aware of multiple different
activities happening at once in different levels of math. Maybe multiple grades of math,
but more in a coaching way than in a talk-down way.
The 6th grade teacher stated that when she began teaching that she believed the “perfect scenario”
would be a one-on-one or a small group of students. She was looking for a method of delivery
that makes that possible with 25 or 30 students. When she began using the blended model of
instruction she stated she felt, “ a lot more effective as a teacher.” She enjoyed seeing the
increased engagement and success of her student, “but to be able to see that translated into

66
quantifiable numbers is pretty rewarding.” The 6th grade teacher found that the methods she was
using increased student engagement and improved the students’ perspective on their ability to be
successful at mastering math and her belief that she had the ability to make that happen for her
students.
Student centered instructional methods increased mathematical achievement. The
6th grade teacher believed that her instructional methods were student centered which led to
greater growth due to the fact that the students’ instruction was relevant to the individual student.
The 6th grade teacher in her interview explained that the instructional methods of her classroom
were not the traditional model that was teacher centered rather than student centered. She
referred to the traditional method as the textbook method and stated: “it’s very different from a
textbook method where it’s one instructor delivering information at the same pace and the same
timeframe to a very diverse group of learners, which is usually not successful for most of them.”
The 6th grade teacher explained that through technology all lessons could be individualized to
meet the needs of the individual student. She expressed that her method was different than the
traditional method in that there was a, “lot of student self-direction.” The 6th grade teacher
further explained that, “the task in front of them is appropriate to where they’re at
developmentally, and then if they need further instruction, they have a lot of options to self-
select.” The 6th grade teacher explained that when they do not understand a math objective in
front of them they have multiple alternatives to receive assistance such as: “They might decide to
have a peer help them. They might work with an aide or me. They might decide they want to go
use some math software and get a video lesson.” She expressed that she believed students if
given enough time and proper instruction would be able to master the objectives they are asked
to complete.

67
The 6th grade teacher expressed her concern about the misconstrued ideas of how she was
using technology in her classroom. The 6th grade teacher expressed this as follows:
You see some of the misconceptions about it maybe from people who have seen students
just left alone in front of a computer or if there’s no follow-up, if the kids don’t have
accountability, if they’re not being assessed with each objective.
The 6th grade teacher discussed the importance of students knowing that what students do on-line
is being closely monitored and that they are provided needed feedback on how to improve their
understanding and mastery of objectives. She also discussed “decision points” in the online
assignments. These decision points, usually set at 80 percent mastery, will block a student from
going further in their assignments until they master the current assignment at a minimum of the
80 percent level. She thought, “it’s human nature to perform better when you know that what
you’re doing matters and that somebody is paying attention.” The misconception was the
students were “just going to click through.” She expressed when students realize that they will
be held accountable it changes their engagement level.
The 6th grade teacher acknowledged that these methods were not the traditional methods
however, she stated that, “it seems unlikely that continuing to do the same method and the same
model over and over for decades is going to ever result in different outcomes for kids.” The 6th
grade teacher expressed that, “you don’t necessarily have to work within a traditional delivery
method and traditional textbook method to be rigorous, and focused, and standards-driven.”
The outcomes in mathematical achievement on summative assessments from this 6th grade
teacher’s classroom would indicate that to be a true statement.
Technology can be used to differentiate to the individual student. The ability to
differentiate to the individual with the use of technology provided a way to achieve what had
68
been the 6th grade teacher’s goal in Washington as a lab classroom for NCTM and liaison to the
state superintendent. The 6th grade teacher when coming to the school of this study found two
other teachers using technology to differentiate instructions down to the individual students in
their classroom.
Before coming to Alaska she stated that this is what she was trying to create by hand in
Washington. The 6th grade teacher stated the technology is:
the piece that makes it possible to differentiate to this degree. There is an instructional
component to it. There’s an assessment piece. I have the ability to track, and kids know
that I’m keeping them accountable, and it’s a lot more engaging than a traditional
textbook or worksheet. There’s animation, and activities, and interactive games, so the
kids are more engaged. The materials are created, so I’m not reinventing the wheel every
day, and the pacing is able to be differentiated.
In the 6th grade teacher interview she explained how with the technology she could accommodate
for the individual pacing meeting each students needs. Using the technology the necessary
assessments were picked that showed mastery of the state standards. The students would work
through these objectives one at time, not moving onto the next objective until they had mastered
the objective that they were currently working on. The sixth grade teacher stated, “You start
with what the kids need to know and be able to do, and give them the tools to work through those
objectives.” Through the use of technology the 6th grade teacher was able to explain how she
could accommodate for the individual students learning speed and learning style. The teacher
explained that the class was equip with “one-to-one devices” that enabled each student to be
working on different objectives at their own pace and those students that had finished their sixth
grade objectives could move on to upper grade levels. The 6th grade teacher stated that, “there

69
are multiple avenues for kids to choose the method that makes most sense to them, and it’s
another thing that the technology provides, variety.” She believed the reason she was able to
achieve the significant growth in mathematical outcomes on summative assessments in her
classroom was due to the fact she was, “able to work with the kids where they’re at with the
differentiation that the technology provides.
Students master their current objective before being moved to the next objective.
When the 6th grade teacher was asked why she thought that the student growth in math was much
greater in her blended learning classroom than other classrooms she responded:
Definitely the mastery learning; the fact that the kids aren’t going to be asked to do things
they can’t do and they’re not going to be promoted ahead to new ideas unless they really
have a deep understanding and it’s embedded in their long-term memory.
The 6th grade teacher went on to explain that she believed this was achieved by breaking down
the overall lessons into smaller objectives that could be mastered one at a time. She stated from
her experience she had “never seen kids integrate information to a long-term memory from just
seeing it once in a textbook lesson, and then at the end of the year, you get to the accumulative
test, and they remember everything they’ve been taught.” The 6th grade teacher expressed that
mastery meant students should be able to apply the objective they had mastered, “to projects and
presentations [and] to mentoring other students who are still working on those same objectives.”
The 6th grade teacher’s class average showed 2.7 years grade equivalency growth on their
STAR Math Growth Report and was in the 97 percentile in their School Conditional Growth
Percentile on the MAP assessment of NWEA (over 10 million students in this norm referenced
test) for the 2015-2016 school year. The class began the year with a class average RIT score of
219 which is two points above the norm for a beginning 6th grade class. The RIT score average

70
for the 6th grade teacher’s class on their spring MAP test was 233.1. The norm for a beginning
11th grade class is 233.3. This class had statistically significant growth in mathematics for the
2015-2016 school. The 6th grade teacher has consistently gotten this kind of growth in
mathematics from her students over many years.
Teacher Perspective – 5th Grade
The 5th grade teacher of this study began teaching 5th grade in 1976 when he graduated
from college in Washington. After three years of teaching he went into the grocery business
running grocery stores. He had put himself through college working in grocery store and was
offered work managing grocery stores, which he did until 1990 when he returned to the teaching
profession. His experience in the grocery business became a part of his teaching style where
everything was data driven. The 5th grade teacher saw student growth as profit gain or profit
loss. He stated, “coming from my grocery experience, if we weren't on top of say your profit
loss, we couldn't wait a year to find out if things were doing okay.” The 5th grade teacher went
on to compare gathering data as the equivalence of keeping track of inventory in a grocery store.
To determine if students were making gains was like tracking perishable goods in a grocery store
stating that, “until you determine that you were losing money in any of those perishable areas,
then you would ... Inventory once a week. Sometimes once a day, until you found out where the
problem was.” When discovering how he could use technology to take an inventory of his
student’s individual gains and losses it change his perspective on his role as a teacher from the
“sage on stage” to being the “facilitator” of his students education.
Three themes emerged from the coding and analysis of the 5th grade teacher’s interview:
- The 5th grade teacher believed student engagement was greatly increased when
instruction was adjusted to the individual student’s ability and pace.

71
- The 5th grade teacher believed the ability to differentiate instruction to the individual
student with the use of technology greatly increased the academic growth in
mathematics.
- The 5th grade teacher believes that by differentiating the instruction to meet the
individual students needs on their own time line all students can achieve mastery of
the objectives.
The 5th grade teacher believed student engagement was greatly increased when
instruction was adjusted to the individual student’s ability and pace. The 5th grade teacher
believed that by adjusting instruction for the lower and higher student that “We’re looking at a
stronger engaged rate.” He stated that once instruction was adjusted to the appropriate level
irregardless of what level they came in at that, “When they see that it's productive, and if it's
individualized towards them, they tend to put out more effort for a sustained about of time.” The
5th grade teacher had 8 to 12 students that rotated depending on who did not have another
afterschool activity stay afterschool each night to work on math. Due to the fact that the math is
online students can work at home on a computer or on their smart phones. Engagement had
increased this year to where the 5th grade teacher informed his class not to do math after 9:00 and
“Don’t call me after 9:00.” The objectives record a time when a student submits their work. The
5th grade teacher would check to see what was submitted the night before when he came in to
school in the morning. When he saw a student had submitted an assignment at 10:36 the night
before so he asked the student:
How does that work with you and your family? Do you all stay up and work? He says,
"No, I was in bed." He was in bed with his smartphone, doing his math. That's not too
72
often, that you have somebody doing that if everyone is on page 57 and you're doing
problems 1 through 35, even if you're doing the odd or even ones.
The 5th grade teacher noted that the students hunger for learning math was dramatically increased
by the individualized and self pacing methods of instruction he incorporated in his classroom.
Time allowed in the classroom during the day was not sufficient to satisfy their appetite for
learning math. He stated:
I'll get phone calls during the night or on weekends to discuss certain objectives, certain
math topics. Typically it's the, "Feed me, Seymour," type of thing. That's from the Little
Shop of Horrors. They will want more during the off school hours. We find that it
empowers the student, because they can see that what effort they put into it, they can
excel rapidly.
The 5th grade teacher noted while most of his class has the technology at home to access their
math instruction in the current year there were three students who did not, however he could
accommodate their needs by printing their work to take home with them to do in a paper and
pencil method.
The 5th grade teacher was particularly impressed with one student’s intense engagement
in the current year that he described as “very veracious.” He said this boy had mastered, “832
objectives for the year” and was surprised that he was not leading the class in objectives
mastered. The 5th grade teacher stated that, “There was another gal who was in stealth mode and
she was calling me all year, talking about math, working during the day. She had 838.” He
further made it clear the minimum expectations was two objective a day and that, “I never held a
sorter hammer over them. They just did that because that's what they wanted to do.” The 5th
grade teacher in his interview inferred that one grade level was approximately 140 objectives.

73
He expressed that these student had done “a fair amount of work.” The 5th grade teacher
expressed that he did not think you would find this kind of engagement in your traditional
textbook instruction. He stated, “I'd say 98 percent, 99 percent of the kids who thought that they
could not do math, that math wasn't for them, they experienced success. They have it tailored to
them at their level. They have voracious appetites for it.”
He stated due to the increased engagement they did not have discipline problems during math
instruction. The 5th grade teacher stated:
We just don't have kids that act up during math. They might at recess. They might when
they're out in the general population, but their intent ... Because it's special to them and
it's targeted to them. Again, I don't play the organ, but it seems like more of a conductor.
If I can just keep those kids going to the area that they need to be in, and that they buy
into it then, too. When they experience success and they can just keep moving, I just
facilitate that.
The 5th grade teacher was clear that one of the major factors contributing to his classes’
exceptional growth in mathematics was the increased student engagement in learning math
brought about by adjusting the level and time allowed for the individual student to master each
objective.
The 5th grade teacher believed the ability to differentiate instruction to the
individual student with the use of technology greatly increased the academic growth in
mathematics in the classroom. He stated, “It's just through the use of technology, of some
human resources, and analyzing the data, that we're able to meet the mathematical needs of each
student.” The 5th grade teacher stressed throughout his interview that by using the technology in
his classroom instruction was tailored to the individual student. He stated that with the

74
technology, “I'm able to assess and react more rapid than without it. I can tell fairly quickly
[determine] where the kids are and where their mastery level is.” The 5th grade teacher inferred
that he could go in as many directions as he had students. This year he had 22 students and
stated he could adjust quicker “to the 22 different directions that the kids are going into. He
expressed that the technology allowed for the differentiation that was needed and stated:
Now with the use of the technology and my deeper toolbox, we can get to the needs of
each child, to their level of success and where they may need to start stepping up to get
towards grade level achievement or to get to their personal expectations.
The 5th grade teacher discussed that with this technology students that were above grade level
could be challenged and their individual needs could be met as well. Beginning in 2005 the 5th
grade teacher began looking for resources beyond the textbook “to meet the vast disparity in
grade level abilities” in his classroom and “what it would take to meet their needs.” He further
stated that at this time “we started to look at things like Compass [software from Odyssey
Learning]. This software allowed for building lessons to let individual students work on
achieving mastery of math objectives. The 5th grade teacher explained that one of the additional
ways that the technology is used to differentiate instruction to the individual student was using
the Measure of Academic Progress (MAP) assessment “available through the Northwest
Education [Association] (NWEA). He explained, “That has given us a chance to assess the
students on a trimester basis in the fall, and then we can make adjustments with the students'
needs, as determined by that test, and then use the Compass Learning program.” The Compass
program interfaces with the MAP assessments and then gives students lessons based on their
individual outcomes. The 5th grade teacher stated with the combination of these two programs,
“We've been able to get individual learning paths for the kids as a result of that testing.” He then

75
talked about the software that is the heart of the mastery portion of this math instructional
method, “We also use Accelerated Math [from Renaissance Learning].” The 5th grade teacher
stated, "The current library that I'm using goes up to 1,800 objectives for the kids. At each grade
level, I believe there's maybe 140, 145.” He explained that the students are “working through
their objectives.” The 5th graded teacher explained that,
Now the objectives as determined by grade level, as determined by assessments, on what
they're strong at and where they're weak. That's why I found that this one Accelerated
Math program helps me individualize better.
These individual assessments will determine what the individual student will do next. The 5th
grade teacher stated, “We have an electronic submission of their work and it'll tell them
immediately what they have done right, what they have done wrong.” While students will move
to the next objective if they correctly answer 80 percent of the questions the 5th grade teacher
explained,
we'll still investigate that one they missed. Usually it's a head slapper. ‘Oh, I just made a
mistake doing this.’ I still ask them to show me their work. They still have to have their
work attached to it, so that we can do that investigation.”
This process is where mastery learning in a blended environment begins.
The 5th grade teacher believes that by differentiating the instruction to meet the
individual students needs on their own time line all students can achieve mastery of the
objectives. When the 5th grade teacher discussed outcomes for student using his previous
traditional method, which he described as the “sage on the stage” he clearly knew he was not
reaching all the students. He stated,

76
if I were to go back to 1976, when I was fresh out of school and into a 5th grade
classroom of ... I think I had 28 kids. We were trying to hit them all with the same lesson
to all the kids. It would be like the one blanket is not going to cover everybody. The
majority of the kids, the average range, it was 5, but I was losing the high kids, losing the
low kids. That seemed to be about as good as I was going to be able to do with the tools
that my new teaching experience, which wasn't very deep.
The 5th grade teacher when discussing how he began teaching originally stated,
Almost 40 years ago now. I could sit down right now and write up my lesson plans for
next year out of my textbook. If I had a couple of weeks and I said, ‘Okay, I want to get
that knocked out,’ I would just get my textbook and my lesson plan and just write out
what I'm going to do in math. We'd know what page we're going to be on and what unit
we were going to do and when we were going to do ... Hopefully, we'd catch as many
kids as possible.
The 5th grade teacher discussed his role had now changed to that of a facilitator with his focus
getting every student to the area that they need to be in. When students demonstrate that they
have not mastered an objective the teacher had many ways to help them master the objective
before them which included the use of technology, peer to peer support and one on one with
teacher or an adult.
When explaining how the different ways the technology could be incorporated he stated,
“we can take them to a mini lesson on Compass. This year, we've been trying more on the Kahn
Academy also, which has been a terrific help.” One of the advantages the 5th grade teacher
discussed was when you find an area that a student has weakness in a certain strand explained:

77
We'll catch a place value. Say, "Well you see, they've had some holes in their place test,
so I can take them down to the third grade." There's maybe 10 objectives at 3rd grade. If
they master that, then we can take them through that same strand.
He continued to explain that you could then give them objectives on that strand in the next grade
level and proceed until they master their current grade level. The student does not have to do all
of the other grade level objectives just the ones that they are weak and the 5th grade teacher
pointed out this is not so easily accommodated when using a textbook method. When the 5th
grade teacher was asked how does he know if a student has mastered an objective he responded:
Through the accelerated math, we can look at each individual objective of that child and
we can make adjustments on that one. We'll look for retention on that every other week,
and then we'll come back and see how that student has retained that information.
The 5th grade teacher’s class average showed 2.7 years grade equivalency growth on their
STAR Math Growth Report and were in the 99 percentile in their School Conditional Growth
Percentile on the MAP assessment of NWEA (over 10 million students in this norm referenced
test) for the 2015-2016 school year. The 5th grade teacher has consistently gotten this type of
outcomes for the last 10 years using this unique form of instruction. This student growth is
statistically significant compare to most forms of instruction.
Student Perspective
The students interviewed were from both the 5th and 6th grade teachers’: 2015-2016,
2014-2015, and 2013-2014 classrooms. Twenty-four students participated in small focus groups
ranging from two to five students each with with an age range of 10 to 15 years in age. Seven
male students and seventeen female students participated in the focus groups. The academic

78
proficiency of students participating in the focus groups ranged from low-average to high
mathematical academic ability.
Three themes emerged from the coding and analysis of the student’s interviews:
- Students expressed how self-pacing and instruction differentiated to their ability
benefited their growth in mathematics.
- Students in the focus group viewed the use of technology-based programs beneficial
to their ability to master their personal math objectives.
- The students that had gone on to junior high and back to the traditional textbook
method of instruction became frustrated when classroom instruction moved forward
before they had mastered a concept.
Through out all the focus groups students expressed how self-pacing and instruction
differentiated to their ability benefited their growth in mathematics. The students stated that
being able to work at their own pace worked for them much better for them academically than
being tied to a class pace. One student stated how going at his own pace helped him from
becoming overwhelmed by his math lessons. The student stated:
I think it helped to learn math a lot better, because I was at my own pace and I could
know what I was working on and I felt good on what I was working on. Instead of having
like being a couple chapters back and like the math class I have now. Feeling like, I can't
do this problem, I can't do this set of problems, I'm going to work on this one. Just
feeling overwhelmed by it.
All students saw the advantage of being on their own path not to having to wait or be slowed
down by the abilities of another student. One student expressed this with his statement:

79
Being at your own pace and knowing what you have to do. You don't have to feel like
you need to catch up. Being like you feel like you don't have to slow down and wait for
everyone else to catch up. You can just go as far as you can.
Students that had struggled in math prior to having a self-pacing form of math instruction found
that they were able to master mathematics and begin to enjoy mathematics. A student expressed
this in her statement:
I remember when I was little I would always have a hard time because they would go
very quickly. So I'd be left behind. But now I can go at my own pace without worrying
about other people going very fast or too slow. So it's helpful when you're on your own.
Students who always excelled at math articulated that the self-pacing method increased their
engagement and relieved their boredom during math instruction. A student who had never
struggled in math stated, “I liked the individual path because when I was little and we didn't have
individual path things, I felt like I just had nothing to do. I was just like uhhhh I know this
already.” Due to the fact everyone could proceed at their own pace meant that they could also
proceed at their own ability level. Students recognized the importance of starting at the
developmentally appropriate level of instruction. This reflected in the comments made by
students such as: “it helped me with my mathematics. It helped me advance in it, because it
leveled out with me.” and “doing it by yourself, in your own personal level, it's a lot easier,
because it's more of a challenge for me.” All the students realized that their math instruction was
individualized; many referred to it as their “individual learning path.”
Students in the focus group viewed the use of technology-based programs beneficial
to their ability to master their personal math objectives. One student stated that when they
would have a low score on a formative assessment their teacher would give them options, which

80
included a lesson on a computer program or getting help from a peer who had mastered that
objective. Another student stated that use of technology assisted with mastering objectives due
to the fact that the computer lesson “really helped on showing examples of it” and “was good to
because you could get video on a certain lesson.” Many students liked the fact that with the use
of technology you would get instant feedback. One student expressed this in their statement, “I
think that using technology really helped, because you instantly saw if you got the questions
right or wrong and you could go back and fix them and then correct yourself.” Another student
stated this in their statement:
you could see what you got wrong and you could go back and learn it and if you still
didn't get it you had like you said Kahn Academy and Compass and it just made it a lot
easier to understand what you're learning.
Some students stated that they preferred the use of the technology over the traditional paper and
pencil format because they found the work easier to do in a format that they were more use to.
One student expressed this in his statement:
because we used more technology, and that's, honestly, easier for me to use and recognize
better than seeing it on paper. Sometimes it's a lot easier for me to look at and understand
it on the electronics sometimes, because it's something that's more familiar and I use
more often now.
Consistently through out the student focus groups students appreciated the fact that with the
computers all students’ objectives could be adjusted to their personal abilities. One student
stated, “it's good when we're on the computers on the individual learning paths. It's good cause it
kind of feels like you are learning more”

81
Many students found the convenience of having their math online made it easier to keep
track of their work unlike homework in a packet. One student expressed this in his statement, “A
lot of times my backpack is a huge mess, and I cannot find anything. Having it just online is a lot
easier.” From the discussions in the student focus groups it was evident that the technology was
appreciated by the students and increased their engagement.
The students that had gone on to junior high and back to the traditional textbook
method of instruction became frustrated when classroom instruction moved forward
before they had mastered a concept. One student that moved from their 6th grade school to
the junior high school where they were using the traditional textbook method with a pacing guide
stated:
If you get behind on one section today and then you move on to the next section you need
the knowledge from that last section to be able to do this. You end up getting further and
further behind, because you never mastered that first section.
When students were to make a comparison between the instructional methods they experienced
in 6th grade to their current instructional methods one student stated:
For me it was like if you're on something that was hard, you could not understand it a
hundred times and keep getting them wrong, but you didn't move on until you absolutely
knew it. Now they just expect you to know it every single day, you just keeping moving
forward even if you can't understand what you did before.
Many students expressed their frustration with statements like: “They're kind of just rushing you,
they just want to get it over with. If you don't get something, they'll just move on without you.”
and “if you fall behind, then you can't do the next lesson.” All of the students who had been in
the 5th and 6th grade teacher’s classroom of this study had been instructed in a method that
82
required them to master their current objective before they could move on to the next objective.
Moving back to a traditional textbook method where you keep moving forward to the next lesson
based on a pacing guide students realized the importance of mastery of objectives in
mathematical instruction before moving to the next lesson.
Summary of Findings
The findings of this case study are based on the interviews of the administrator, 5th grade
teacher, 6th grade teacher and student focus groups of a rural Alaskan elementary school. It is
evident that everyone interviewed believed that the significant gains in mathematics were
accomplished by allowing every student the time needed to master each objective before moving
on to the next objective. Due to the use of technology-based programs every student was given
instruction that matched his or her ability as described by participants as their “individual
learning path.”
By objectives being matched to what students described as “levels” they were able to find
success through the support of computer based lessons, peer to peer help, and one on one
instruction from their teacher. This success according to the administrator, 5th grade teacher, and
6th grade teacher led to significant increase in student engagement and subsequently student
learning. Children want to be successful; all you have to do is build them a path.

83
Chapter V: Discussion of Research Findings
Revisiting the Problem of Practice
The outcome of math scores on the Program for International Student Assessment (PISA)
was coordinated by the Organization for Economic Cooperation and Development (OECD). The
United States continues to lag behind other countries ranking 35th out of 64 countries that
participated in the 2012 PISA assessment (National Center for Education 2016). The National
Center for Education (NCES) (2016) reported that:
In 2012, average scores in mathematics literacy ranged from 368 in Peru to 613 in
Shanghai-CHN. The U.S. average mathematics score (481) was lower than the average
for all OECD countries (494). Twenty-nine education systems and two U.S. states had
higher average mathematics scores than the U.S. average score and nine had scores not
measurably different from the U.S. score.
Nationwide educational reform movements, such as NCLB and now Common Core, have had
little impact on mathematical assessments scores by American students on international
assessments.
Hess (2010) discussed the difficulty of reform in all bureaucracies stating that “size,
habit, and an established position left them lumbering and heavy footed” (p.14) like elephants,
and unable to respond to the current needs of the consumers. Hess (2010) refers to Economic
Turbulence (2006) by Claire Brown, John Haltiwanger, and Julia Lane that states that the
average life span of a Fortune 500 company is 50 years. The authors that worked 50 years ago
may not work in the present day. Most of the 13,500 public school systems in the United States
were established many decades before 1966. Hess (2010) states, “There is not a single sector

84
where widespread efforts across hundreds or thousands of organizations have resulted in
dramatic gains in quality” (p.12).
The importance of improving education in American schools as seen by the Council of
Foreign Affairs Independent Task Force report on the United States Education Reform and
National Security report stresses the importance of improving education in American schools and
notes that it is imperative to securing our economic future. "Educational failure puts the United
States' future economic prosperity, global position, and physical safety at risk," (Klein, et. al.,
2012, p.4) warns the Task Force, chaired by Joel I. Klein, former head of New York City public
schools, and Condoleezza Rice, former U.S. secretary of state. The country’s K-12 education
"will not be able to keep pace—much less lead—globally unless it moves to fix the problems it
has allowed to fester for too long," (Klein, et. al., 2012, p. 58). Richard N. Haass, (Klein, et. al.,
2012) President of the Council of Foreign Affairs, stated that students leaving schools today do
not have the math and science skills needed to work in modern industry. Employers are
recruiting foreign-born people for STEM positions for their companies due to the fact that they
cannot find US citizens who have the needed skills. These foreign-born employees increase
American costs according to a study conducted by Magnus Lofstrom and Joseph Hayes (2011)
comparing U.S. born employees’ earnings to the earnings of foreign born H-1B visa employees.
H-1B visas are issued for applicants that have a specialty skill that employers cannot find in US
born applicants to fill positions needed. Lofstrom and Hayes (2011) concluded, “that overall H-
1B workers in STEM occupations have higher earnings than their otherwise observationally
similar US born counterparts” (p.14). A research brief by Jonathan Rothwell and Neil G. Ruiz
(2013) determined that 90 percent of H-1B visas were STEM related.

85
The American K-12 public schools have to improve mathematic instruction if the United
States is going to compete economically with the rest of the world.
Discussion of Major Findings
Interviews with teachers, administrator, as well as student focus groups, multifarious
themes emerged that helped determine why these classroom’s yielded the tremendous growth
in mathematics achievement. Four major themes were identified from the interviews with the
teachers, administrators, and student focus groups. They are presented in Table 1.
Table 1
Major Findings from the Study
Student engagement will increase dramatically when instruction is adjusted to the students’
ability
Individualized learning paths for every student with the use of technology
Self pacing of instruction moving toward student centered learning
Mastery of state standards defined by objectives to be learned.
Student engagement will increase dramatically when instruction is adjusted to the
students’ ability. As seen in the fifth grade teacher’s interview the teacher had to set a 9:00 PM
deadline for students calling to ask that more math objectives be assigned to them online.
Students in a traditional textbook driven, teacher-centered classroom do not call their teacher at
home and ask a teacher to assign them more work as reported by the 5th grade teacher. Teachers
and administrator reported that when instruction is adjusted to the individual student’s ability and
they experience success they become more engaged. For many students this is a new form of
mathematics instruction encouraging increased engagement because they enjoy that experience.
The 6th grade teacher reported that this experience appeared to contribute to a change students’

86
self concept and that they no longer believed that they “sucked at math.” As reported by
students, teachers, and administrators, sole reliance on teacher centered whole class instruction
has the opposite impact causing students to disengage. A fifth grade student summed up what all
parties expressed reporting that by having her math assignments individualized it “relieved their
boredom during math instruction” and her feelings about sitting through a whole group
instruction was noted as, “uhhh I know this already.” The administrator reported the other end of
the spectrum when describing the teacher centered traditional classroom approach stating “25%
of the kids don't get it because it's too hard” and went on to say “that just disappeared in those
classrooms” referring to the classrooms of this study. Participants reported their belief that the
reason the method used by these teachers demonstrates multi level grade equivalency increases
every year is that students are not limited to their current grade level, but rather explore
assignments at their instructional level resulting in increased student engagement. If they are in
fifth grade objectives they quickly find out that if they master their entire current grade level
objectives they will be given objectives from the next grade level to work on. It is evident that
the people interviewed in this study believed adjusting instruction to the individual student’s
instructional level increased student engagement.
Individualized learning paths for every student with the use of technology. The
teachers, administrator, and students all reported that having individualized learning paths
greatly improved their mathematic achievement. The 6th grade teacher described the ideal,
perfect scenario for teaching would be if I could instruct “one student, the content, the level, and
the method of delivery.” With the use of technology the 6th grade teacher stated, “I make that
ideal possible in the reality of 25 or 30 kids in the classroom.” The technology was used to
administer formative assessments that determined the individual needs of every student. This

87
information was used to determine instructional level and assignments for each individual
student. The 5th grade teacher stated “if it’s individualized towards them, they tend to put more
effort for a sustained amount of time ... We find it empowers the student, because they can see
that what effort they put into it, they can excel rapidly.” Through this method students were not
working on objectives they had already mastered but working on new objectives that they needed
to learn. The technology provided a method for teachers to assign individual lessons to students
as needed to master new objectives. Students reported that the computer lesson would give them
examples of how to work the problems of their current objective and additionally provided video
lessons that greatly increased their understanding of the objective. Many students stated that the
instant feedback provided by the technology makes it easier to correct any errors regarding the
correct method of working on of their current math problem.
It is the educational technology that allows the individual students to access a variety of
avenues to learn the math objectives and this can enable most learning styles to be addressed.
The teachers and administrator reported that without the technology to differentiate instruction
and assignments to the individual student the significant gains on summative math assessments
would not have been attainable.
Self-pacing of instruction moving toward student centered learning. The students
reported the importance of self-pacing for themselves for them to be successful in mathematics
study. Students that moved out of elementary school and in to the junior high found themselves
back in traditional textbook classrooms. These students were frustrated by their experience and
reported that they struggled with a concept the teachers would still go on to the next section
whether or not all students understood the current objectives. One student stated when
comparing his 7th grade math class to his experience in his 5th and 6th grade math class, “It’s a

88
lot of my own pace and not the teacher’s teaching everybody at one pace. It was my own pace
and it was a lot easier than falling behind.” Another student stated, “Yeah, it’s definitely a lot
like more teacher oriented” when describing his 7th grade math class. The students realized that
math is taught in a linear sequential developmental method. They found when they went to the
next section of the book and had not mastered the objectives of the previous section they
experienced difficulty due to the fact they did not have the skills needed to master the new
objectives. Several students with high mathematical skills reported that they were forced to slow
down and wait for others in the class to catch up, and that led to lessening of their enthusiasm
during math class. Teachers, administrator, and students all found that the ability of students to
proceed at their own pace was a crucial element in the students’ increased math achievement.
Mastery of state standards defined by objectives to be learned. The administrator and
teachers reported that significant increase in the state test in mathematics was due to the fact that
the teachers developed tests that made sure every student had mastered all of the grade level
expectations that they would be tested on. There were approximately 100 small formative
assessments that would inform teachers if students were prepared for the state assessment.
Objectives that would not be on the state test were still taught with the same mastery expectation.
When Alaska had a state test (we currently do not have one) the state test was built from Alaska
grade level expectations that were built from the Alaska state standards. The math standards in
most states are broken down to performance expectations by grade level for all grades. Matching
the formative assessments in Accelerated Math to the performance expectations that are to be
tested for any grade level can give teachers the opportunity to determine if each individual
student has mastered the performance expectations for their grade level. As an example a 5th
grade level expectations for math was a student should be able to multiply two digits by two

89
digits. A formative diagnostic objective from Accelerated Math that tested a student’s ability to
multiply two digits by two digits with five questions would be administered. If the student got
four out of the five questions he was moved on to the next grade level expectation. Once a
student had mastered all of the grade level expectations they could begin working on the next
grade level. All students proceeded at their own pace and level through the grade level
expectations. When they had mastered one grade level they moved to the next grade level.
Retention of material was checked periodically and anything not retained was re-learned. The
test used for 6th grade expectations was 136 questions administered four times before students
took their state test. Using this method the classrooms were consistently prepared and successful
on the Alaska Standards Based Assessment in math.
Discussion of the Findings in Relationship to Mastery Learning
Mastery Learning is based on the belief that most students can achieve mastery of a
subject if an individual is given the time needed, exhibits perseverance, has the ability to
understand instruction, can, and is provided quality instruction (Carroll, 1963). Building on this
idea, Benjamin S. Bloom (1968), over a three-year period 1965 through 1967 at the University of
Chicago’s lab school, implemented a mastery-learning classroom. Ninety percent of the students
in Bloom’s classroom were able to achieve mastery (an A grade) by his third year. Bloom
(1968) stated that there were preconditions that needed to be met before you could implement a
mastery learning strategy in a classroom.
In order to determine if a student had mastered a subject or skill, the teacher must specify
the objectives a student must master and determine the assessments specific to these objectives
so the student can demonstrate her or his mastery of the subject. Bloom (1968) stated, “We must
be able to define what we mean by mastery and we must be able to collect the necessary

90
evidence to establish whether or not a student has achieved it” (p. 8). Bloom (1971), as an
example of objectives needed stated “in third grade arithmetic, there may be about 25 learning
tasks arranged in a sequence that someone believes appropriate from a logical, instructional, or
learning point of view” (p. 15). The National Council of Teachers of Mathematics (NCTM)
determined the 108 objectives for third grade mathematics that are used by the 5th and 6th grade
teachers of this study. Additionally there are libraries of objectives for each grade level
including Common Core libraries. These objectives are administered as diagnostic assessments,
consisting of five problems. A score of 80 percent correct indicates achieved mastery to move
on to the next objective. This defined list of objectives that show mastery can be assigned to an
individual student and accessed to be at their own pace. It does not matter if one student is on
the 53rd objective and another student is on the 85th objective. Through out the interviews
students, teachers and the administrator saw this ability to implement self-pacing as critical to the
students ability to produce tremendous growth in mathematics.
A method of allowing each student to have the amount of time necessary to complete
lessons is one of the preconditions necessary to implement mastery learning. This is an important
distinguishing feature that is different in the mastery learning classroom than the traditional
classroom. When you are teaching in a teacher centered instructional method from a textbook
every individual is expect to learn at the pace set by the classroom teacher. Bloom (1968) wrote
“Whatever the amount of time allowed by the school and the curriculum for a particular subjects
or learning tasks, it is likely to be too much for some students and not enough for other students”
(p. 7). The traditional class progresses page-by-page, chapter-by-chapter at a whole classroom
pace. In mastery learning students learns at a pace that enables them to master each objective.

91
A critical aspect of mastery learning is the ability to understand instruction. Bloom
(1968) wrote, “The ability to understand instruction may be defined as the ability of the learner
to understand the nature of the task he is to learn and the procedures he is to follow in the
learning task” (p. 5). No two students will learn at the same rate and in the same way. “Our
basic task in education is to find strategies which will take individual differences into
consideration but which will do so in such a way as to promote the fullest development of the
individual” (Bloom, 1968, p. 3). In the traditional classroom the class is following a textbook
and there is generally one way presented to learn an objective. In the 5th and 6th grade
classrooms of this case study adjustments were made for the individual students’ learning styles.
Lessons could be delivered in interactive computer lessons, video lesson, peer-to-peer oral
instruction, small groups with the teacher and one on one with the teacher. These instructional
methods led to greater growth in mathematics because the individual differences of students
were accommodated.
John B. Carroll (1970) defined perseverance as, “the time the student is willing to spend
on active learning” (p. 80). For mastery learning to be effective not only does the school have to
allow the student to have the time needed to master a subject, but the student has to actively
engage in the learning process. Carroll (1970) wrote:
There is abundant evidence to suggest that perseverance is largely a function of prior
experiences of success or failure with similar learning tasks. Often these experiences of
success and failure go back to the earliest school years; it must be in these years that it is
particularly important to arrange instruction so as to yield experiences of success for all
children irrespective of ability (p. 80).
92
Carroll (1970) goes on to say that students’ successes should be greater than failures, and that
prolonged failure will lead students to shutdown and withdraw from engaging in the learning
process. Teachers and the administrator of this study reported the importance of adjusting
instruction to the individual student so that they can find success in mastering the subject of
mathematics. The teachers determined this to be a key factor in the increased student
engagement in their classrooms. Differentiating instruction to the individual student’s ability
dramatically increased engagement and was significant in producing the positive outcomes on
summative math assessments found in the classrooms of this study.
Bloom (1968) expressed that schools were asking the wrong questions about curriculum,
materials, and instructional methods in regards to the quality of instruction. All of the questions
were based on what was best for a group whether teacher, methods, or materials. Bloom (1968)
stated, “One may start with the very different assumption that individual students may need very
different types and qualities of instruction to achieve mastery” (p. 4). Carroll (1970) discussed
“the important role of ‘formative’ or diagnostic tests, plus the feedback from such tests, in
contributing to the quality of instruction (p. 79). The teachers in this rural Alaskan elementary
school used a continuous stream of diagnostic assessments with nearly instantaneous feedback
that could move a student on to the next learning task, or take the corrective action needed to
lead the student to mastery of the objective. Teachers of this study did is what Carroll (1970)
described as “The teacher who makes judicious use of such tests and is able to provide
encouragement and praise, or corrective feed back as the case may be, is probably a more
effective teacher than one who makes only casual or insignificant use of such tests” (p. 79). The
effectiveness and the quality of instruction offered by the teachers of this study are made evident
by the significant growth their students achieved in their mathematical summative assessments.

93
Bloom (1968) discussed the affective consequences of mastery learning in his paper
Learning for Mastery. The teachers of this study reported perception that a student’s self-
concept and engagement in the learning process changes when they find success and begin to
believe that they can learn. Bloom (1968) stated, “If the system of formative evaluation
(diagnostic progress tests) and the summative evaluation (achievement examinations) informs
the student of his mastery of the subject, he [they] will come to believe in his [their] own mastery
and competence. The increased student engagement reported by the teachers and administrator
is directly related to the student’s change in their self-concept and belief in their ability to master
mathematics. Bloom (1968) stated, “When the student has mastered a subject and when he
receives both objective and subjective evidence of the mastery, there are profound changes in his
view of himself and of the outer world” (p. 11). A student’s academic self-concept of himself or
herself is often established in students’ attitude by the end of elementary school. The nature of
this self-concept could determine how successful they become students as they move through
elementary and middle school, and influence whether they complete high school (Bloom, 1971).
Discussion of Findings in Relationship to Literature Review
The use of technology to differentiate math instruction. Ysseldyke and Tardrew’s
(2007) study was reviewed in Chapter 2 since their study used the same software by Renaissance
Learning as the two teachers in the case study. Ysseldyke has been involved in many studies
determining the effectiveness of this software to improve math instruction. The study by
Ysseldyke and Tardrew (2007) used the STAR Math assessment to measure the grade
equivalency growth. Ysseldyke and Tardrew (2007) stated, “Implementation of a progress
monitoring and instructional management system had significant and profound positive effects
on students in Grades 3 through 6” (p. 24). The 5th and 6th grade teachers’ classes for the 2015-

94
2016 school year averaged 2.7 years grade equivalency growth. This more than double the 5th
grade classes and nearly double the 6th grade classes of Ysseldyke and Tardrew (2007)
experimental groups that had “significant and profound positive effects.” The 2.7 years grade
equivalency growth of the 5th and 6th grade teachers of this study is below their average over the
years. The 6th grade teachers STAR Math growth report is in the appendices showing 6.0 years
grade equivalency growth for the 2011-2012 school year.
One reason may be that 5th and 6th grade teachers’ classes of this study made significantly
more growth than the classes from Ysseldyke and Tardrew (2007) study is the teachers of this
case study only used the diagnostic test portion of Accelerated Math from Renaissance Learning
software. The Accelerated Math program assigns practice problems to a student if that student
does not demonstrate mastery of a particular math objective. The teachers of this study did not
reason that it would be effective to give practice problems related to an objective if that a student
has demonstrated a lack of understanding of the objective. The 5th and 6th grade teacher found it
more effective to send a student to an interactive computer program that could teach the student
the skill necessary to master the objective. Additionally, the 5th and 6th grade teachers of this
study could send the student to a video lesson of the objective, have the student work with
another student in the class who had mastered the objective, join a teacher led small group of
students working on the same objective, or work one-on-one with the teacher.
Liang and Zhou (2009), of the University of Akron conducted a qualitative case study
with 55 grade three students in two classrooms to determine how students processed learning
mathematics with the use technology and which features of the technology they liked best. The
researchers found that the students liked the fact that there was immediate feedback that would
correct their misconceptions about mathematics. Students also had the ability to have instruction
95
repeated and cultivated self-directed learning. The focus groups of students in this study in
Alaska had similar reactions, reporting that the immediate feedback was an important feature for
them. They also appreciated the ability to have interactive lessons and videos that they could
review when necessary.
A mixed-method study was conducted by Rosen and Beck-Hill (2012) to see what impact
the use of technology in fourth and fifth grade classrooms in the Dallas, Texas area would have
on the outcomes of students test scores on the Texas state test using a value added model. This
researcher’s case study conducted used a similar method using the Alaska Standards Bases
Assessments (SBA) to determine how the use of technology in the 5th and 6th grade teachers’
classrooms impacted the outcomes of their students’ test scores using a value added model. Both
the Rosen and Beck-Hill (2012) study and this current study saw significant gains on their state
summative assessments. Rosen and Beck-Hill (2012) study also noted that there were fewer
discipline problems with their experimental group compared to their control group. Likewise the
teachers and administrator from this study reported that the classrooms had few discipline
problems, and the environment brought about the increased student engagement with the use of
technology.
Valiande and Tarman (2011) conducted a study to find out how technology could be used
to differentiate teaching in a mixed ability classroom. They determined that instruction that met
the individual needs of the student would be more effective than using the traditional classroom
methods of one size fits all. Technology could be used to make the instruction individualized
efficiently and effectively. The teachers, administrator, and student focus groups of this study all
reported the importance of the self-paced, individualized instructional methods using technology

96
and believed this is what impacted the student engagement and growth in their understanding of
mathematics in the classrooms of this study.
The Use of Technology in Mastery Learning. Miles (2010) conducted a study to
determine if a mastery approach to teaching mathematics in 8th grade classes would improve
student academic achievement in mathematics. This study was conducted over one semester in
the 2006-2007 school year in a southeast Georgia suburban middle school. Prior instructional
methods for the group of students utilizing mastery learning methods according to Miles (2010)
were “whole-group instruction, teacher led demonstrations, and cooperative learning groups” (p.
70). “The instructional rate was kept at a constant rate based on the GPS timeframe for each
instructional unit” (Miles, 2010, p. 70). The treatment group that was using mastery learning
differed in that: the instruction was individualized, additional time was allocated, teacher in
small groups did remediation, and units were broken down into smaller sections. Miles (2010)
treatment group used Accelerated Math diagnostic exams to determine their individual mastery
of the Georgia standards. When a student does not master an objective remediation and time is
provided in the treatment group. Miles (2010) stated:
Instead of whole group pacing controlled by the teacher with a limited amount of time
given for the remediation and mastery of the content, struggling students were given
additional time to master the material based on the needs of each student. (p. 73)
At the end of the semester the treatment group and the non-treatment group were given a STAR
Math assessment to compare to the STAR Math assessment test given at the beginning of the
semester. The treatment group had more than twice the growth of the non-treatment group.
Miles’ methods and outcomes are closely related to the outcomes and methods of this study.
Miles (2010) does not speak to how additional time was allocated and how additional instruction

97
was provided. Bloom (1968) referred to this problem as “resources”, or the need for additional
people and time. Mastery Learning through numerous research studies over five decades has
been established as effective. The 5th and 6th grade teachers of this study have demonstrated the
ability to solve the “resource” problem with technology where initial and remedial instruction
can be provided through the use of interactive computer lessons that allow each student to have
the time they need to master each objective.
Lin, Liu, Chen, Liou, Chang, Wu, and Yuan (2013) conducted a study incorporating
mastery learning by building a monopoly game for remedial instruction in upper primary
elementary mathematics. They addressed the time and resource issue associated with mastery
learning by making the remediation program an after school activity. These researchers of this
study found that the activity did increase the achievement of the students who participated. Lin,
et al. (2013) “found that an integration of mastery learning strategies with game-based learning
provides greater benefits for students learning mathematics” (p. 278). This study did find success
in combining mastery learning with technology (Lin et al., 2013).
The impact of technology use on student engagement. Research on student
engagement is a relatively new area of study that has yet come to a consensus on theory and
definitions (Appleton, Christenson, and Furlong, 2008). Anderman and Patrick (2012) described
the relationship between achievement goal theory and student engagement stating, “Achievement
goal theory is a framework that is used to explain and study academic motivation classroom” (p.
173). Due to the fact that the classrooms of these two teachers have a mastery goal structure, the
relationship between achievement goal theory and student engagement provides insight into what
the teachers and administrator reported as increased student engagement. In their classrooms,
the teachers in Alderman and Patrick (2012) study “provide supportive instructional discourse, or

98
scaffolding, compromised of negotiating with students what academic tasks involve and
transferring tasks to students in accordance with their capabilities (Turner et al., 2002)”
(Anderman & Patrick, 2012, p. 185). They have altered their instructional practices so a
“classroom mastery goal structure is established by a coherent set of practices that together
communicate a consistent perspective toward learning and task engagement” (Anderman &
Patrick, 2012, p. 185) that resulted in a very motivational classroom environment. Anderman
and Patrick (2012) believe the convergence and collaboration of goal researchers and
engagement researchers will lead to more effective teachers and improved interventions for
students. The data gathered from all interviews demonstrate a stronger student engagement due
to the mastery goal structure.
Technology with face-to-face instruction to improve efficiency of math. Drysdale,
Graham, Spring, and Halverson (2012) conducted a meta-analysis of dissertations on
blended/hybrid learning. A search was conducted in the ProQuest Dissertation and Theses
Database (PQDT) in which they found 205 dissertations that met the criteria for their study.
There was little reference to elementary schools in their search. What they lacking in this field is
theoretical frameworks and common terminologies (Graham 2013; Drysdale et.al, 2012;
Picciano, Dziuban, & Graham, 2014). Definitions vary from Graham (2006) who defined,
“blended learning systems combine face-to-face instruction with computer-mediate instruction”
(pg.6) to Staker and Horn (2012) who defined blended learning as:
A formal education program in which a student learns at least in part through online
delivery of content and instruction with some element of student control over time, place,
path, and/or pace and at least in part at a supervised brick-and-mortar location away from
home; and the modalities along each student’s learning path within a course or subject are

99
connected to provide an integrated learning experience. (p. 290)
The students in this study are in a self-contained classroom that can control the pace of their
learning, however they cannot control the time or place. Staker and Horn (2012) sought to
define the various strategies of blended learning instruction finding four that were common in
their study. The four common methods found are: station rotation, lab rotation, flipped
classroom, and individual rotation. The students and 5th and 6th grade teachers of this study use
what Staker and Horn (2012) described as individual rotation. Students in the 5th and 6th grade
classroom went to computers based on the individual needs of the student. While students can
and do access their work from home the classroom in many ways resembles a traditional 9:00
AM to 3:30 PM classroom.
Mastery learning. Block and Robert B. Burns (1976) collected what they believed to be
the best mastery learning studies from the 1968 through 1976. They examined four aspects of
mastery learning the: quantitative aspects, the affective aspects, different styles of learners, and
why does mastery works and how to implement it.
The first aspect was the quantitative aspect. Block and Burns (1976) concluded that
mastery learning produced greater student learning. This case study shows that the student
learning in the 5th and 6th grade classroom of this small Alaskan school was quantitatively
significantly greater that the other 5th and 6th grades that their growth was compared too.
The second aspect Block and Burns (1976) examined was the affective consequences of
mastery learning. They describe this as, “academic self-confidence, attitudes toward cooperative
learning, and attitudes toward instruction” (Block & Burns, 1976, p. 26). Block and Burns
concluded affective consequence looked favorable for mastery learning but thought that more
studies needed to be conducted in this area of mastery learning. As reported by the teachers and

100
administrator the method of instruction used in the 5th and 6th grade classrooms of this study
impacted student’s self concept and student engagement in class activities. Block and Burns
(1976) noted that the slower learners time needed to reach mastery began to improve and the gap
between time needed for fast learners and slower learners decreased. In this case study in a rural
Alaskan school the 5th and 6th grade classrooms growth represented multiple grade year
equivalency. Assuming that the growth expectancy for average students is one year per school
year and noting that the time needed to reach mastery of an objective decreased significantly for
students in this Alaskan case study. The impact of mastery learning in a highly differentiated
blended learning environment decreased the time required for mastery for both average and
below average students.
The third aspect that Block and Burns (1976) was to examine the effectiveness of mastery
learning with different kinds of learners. Block and Burns (1976) concluded “we would
hypothesize that the reason the unit mastery requirement and the meeting of that requirement
have exerted such an influence over student learning is because they have affected the quality
and the quantity of student study time” (p. 35-36). While the data collected from this case study
does not disagree with these findings, the teachers of this case study took a different approach to
different learning styles. Students could select a learning method that was more impactful for
them. Students could use interactive computer programs that would accommodate many styles
of learning. Additionally, students could choose to address a visual-spatial learning style.
Students could work with a peer or teacher to address a verbal-linguistic style. Teachers in this
study were pragmatic in their different approaches to instruction, thus allowing students to learn
an objective using the method that was most effective for the individual student.

101
The fourth aspect that Block and Burns (1976) examine was why mastery learning works
and how to implement it. Block and Burns concluded that teachers learning to implement
mastery learning did not have to develop an entire new set of skills but be required:
a few new skills (e.g., diagnostic testing skills) to an existing repertoire (e.g., the use of
remedial instruction) and the orchestration of these new skills with the old (e.g., learning
how to use diagnostic test results to guide the choice of remedial learning activities).
(p. 38)
The teachers in this study achieved significant student growth in mathematics by utilizing
formative diagnostic tests and responding to the outcomes of those individual student tests by
assigning remedial instruction targeted to the individual student with the use of technology.
Thomas R. Guskey and Sally L. Gates (1986) picked up where Block and Burns (1976)
left off searching for mastery learning studies from 1976 to 1986. Their initial search found 234
potential that was reduced to 27 that met the criteria to be included. This study concluded that
25 of the elementary and secondary schools “showed positive effects as a result of the
application of group based mastery learning strategies” (Guskey & Gates, 1986, p. 74). The key
here is these were “group based mastery learning strategies.” The teachers of this case study
have broken down mastery learning to the individual student that resulted with considerably
greater growth than the schools in this study. The Guskey and Gates (1986) study concluded that
mastery learning did increase the rate of learning for slower students, which would coincide with
the results found in the Alaskan study, however, it also increased the rate of learning for the
faster students. The Guskey and Gates (1986) study also looked at retention of learned material
was greater in the experimental groups than the control groups. While the study in Alaska did
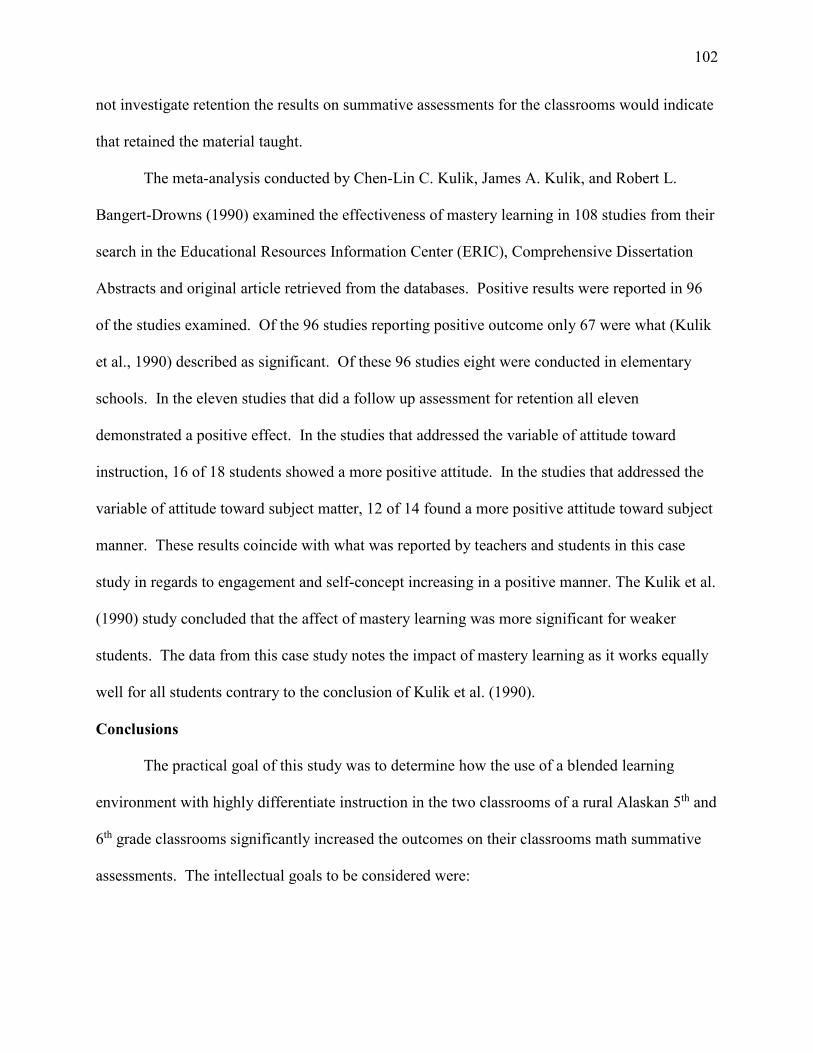
102
not investigate retention the results on summative assessments for the classrooms would indicate
that retained the material taught.
The meta-analysis conducted by Chen-Lin C. Kulik, James A. Kulik, and Robert L.
Bangert-Drowns (1990) examined the effectiveness of mastery learning in 108 studies from their
search in the Educational Resources Information Center (ERIC), Comprehensive Dissertation
Abstracts and original article retrieved from the databases. Positive results were reported in 96
of the studies examined. Of the 96 studies reporting positive outcome only 67 were what (Kulik
et al., 1990) described as significant. Of these 96 studies eight were conducted in elementary
schools. In the eleven studies that did a follow up assessment for retention all eleven
demonstrated a positive effect. In the studies that addressed the variable of attitude toward
instruction, 16 of 18 students showed a more positive attitude. In the studies that addressed the
variable of attitude toward subject matter, 12 of 14 found a more positive attitude toward subject
manner. These results coincide with what was reported by teachers and students in this case
study in regards to engagement and self-concept increasing in a positive manner. The Kulik et al.
(1990) study concluded that the affect of mastery learning was more significant for weaker
students. The data from this case study notes the impact of mastery learning as it works equally
well for all students contrary to the conclusion of Kulik et al. (1990).
Conclusions
The practical goal of this study was to determine how the use of a blended learning
environment with highly differentiate instruction in the two classrooms of a rural Alaskan 5th and
6th grade classrooms significantly increased the outcomes on their classrooms math summative
assessments. The intellectual goals to be considered were:

103
1. To investigate how the instructors of this new design perceive the design as having a
significant impact on student learning, mastery, and engagement.
2. To identify what methods of math instruction increased the standardized test scores at
Herbert Hoover Elementary School as perceived by teachers, administrators and
students.
These goals were based on the research question for this study:
1. How has the development of a blended learning classroom with a focus on mastery
learning greatly impacted mathematics achievement in an elementary school, as
perceived by three teachers using the program, the administrator, and students?
To answer this question interviews were conducted with the administrator of the school, the 5th
and 6th grade teachers and student focus groups from these classrooms. The data from these
interviews was coded and then an analysis of the themes that developed from the coding was
studied.
The study showed that the teachers had developed a form of mastery learning that,
through technology, allowed individualized instruction for every student. The teachers had
solved two problems of mastery learning: additional time needed by the student and remedial
instruction needed by students to achieve mastery of the subject. Bloom (1968) stated, “Tutorial
help (one to one relations between teacher and learner) represents the most costly type of help
and should be used only where alternative procedures are not effective” (p. 5). The teachers of
this study used interactive computer lessons and videos to replace the tutorial help needed,
making this instructional method cost feasible. Using the Renaissance Learning Accelerated
Math objectives to determine mastery of the subject solved the time needed by the individual
students. Students could proceed through the objectives at their own pace which students
104
reported to be an important piece of why their growth in mathematics was significant. These
teachers dramatically reduced the time of whole class instruction and began individualized
instruction meeting the individual students needs with the use of technology. Bloom (1968)
addressed the affective consequences of mastery learning with one impact being a positive
impact on the students’ self-concept. Both teachers reported that, as students found success by
having instructional level adjusted to the individual student’s, the student’s resultant engagement
in the learning process increased due. Teachers felt that students began to believe they could
master the subject of mathematics. Using the methods of instruction used by the 5th and 6th grade
teachers in this study, classes have consistently observed the type of growth presented in this
study since 2005-2006 school year.
Limitations
The most significant limitation of this study is the size of the study. Only two classrooms
in a rural Alaskan school were considered. Additional research would be needed to verify the
reliability of the instructional methods of these two teachers and to examine if their method of
instruction is transferable to other classrooms with similar outcomes. While there are studies
that use technology in the classroom, many with the Renaissance software used by the teachers
of this study, there were no studies that used this software for only diagnostic purposes. There is
a lack of prior research studies that uses technology for diagnostics in combination with using
technology to provide the “knowledgeable other” to teach students objective. This lack of prior
research that matches the methods of instruction used in this case study places obstacles in
building a solid foundation of prior studies in the literature review. The demographic makeup of
this school limits the ability of this study to make generalizations that could be applied in the

105
lower 48 state of the United States due to the large Alaska Native population in the rural Alaskan
elementary school.
Significance and Possible Implications of Study
The growth rate in mathematics that the teachers of this study recorded on summative
assessments is significantly greater than what the researcher could find in other studies. The
concepts of individualized student centered instruction are widely acknowledged by many
studies. However none of these studies demonstrate the multi grade level equivalency growth
that has consistently occurred in the two classrooms of this case for now over a decade. This
method of instruction could be what is known as a disruptor, and over time could change the
instructional methods in future classrooms. When classrooms can progress at multiple grade
levels in a single school year consistently for over a decade this a method that should be utilized
in schools everywhere. There has been multiple math curriculums come through this Alaskan
Elementary School of which none have made a significant difference in outcomes. The
instructional methods used by the 5th grade and 6th teachers of this school have consistently had
greater growth on the Alaska Standards Based Assessments than the other intermediate teachers
in the school district. Now that Alaska does not have a state tests this school has utilized the
MAP test by NWEA and the Renaissance Learning STAR Math test to measure growth. Both
assessments are used by millions of students internationally. The outcomes on last year’s
assessments were consistent with the outcomes they gotten for multiple years.
The 6th Grade teacher’2015-2016 class average showed 2.7 years grade equivalency
growth on their STAR Math Growth Report and was in the 97 percentile in their School
Conditional Growth Percentile on the MAP assessment of NWEA (over 10 million students in
this norm referenced test) for the 2015-2016 school year. The class began the year with a class

106
average RIT score of 219, which is two points above the norm for a beginning 6th grade class.
The RIT score average for the 6th grade teacher’s class on their spring MAP test was 233.1. The
norm for a beginning 11th grade class is 233.3 (Appendix D). This class had statistically
significant growth in mathematics for the 2015-2016 school. The 6th grade teacher has
consistently gotten this kind of growth in mathematics from her students over many years. The
2.7 years growth is on the low side of her usual STAR Math growth report as can be witnessed
by her 2011-2012-class STAR Math growth report with 6.0-grade equivalency growth
(Appendix C).
The Mark O’Brien’s 2015-2016 class average showed 2.7 years grade equivalency
growth on their STAR Math Growth Report and were in the 99 percentile in their School
Conditional Growth Percentile on the MAP assessment of NWEA (over 10 million students in
this norm referenced test) for the 2015-2016 school year. His class began at about a 4.3 grade
equivalency based on the MAP norms and ended with a approximately a 6.9 grade equivalency
based on MAP norms (Appendix D). This outcome on MAP aligns with the outcome on his
Math growth report. The 5th grade teacher has consistently gotten this type of outcomes for the
last 10 years using mastery learning in blended learning form of instruction. This student growth
is statistically significant compared to most forms of instruction.
Future Studies
Through the data collected in this study the participants reported the importance of
instruction being differentiated to the academic needs of individual students. Future studies will
need to provide evidence that differentiated instruction is based on empirical evidence that is
researched based. While there exists a significant amount of research on mastery learning there
is a lack of research where technology is used to differentiate mastery learning to the individual

107
student. Drysdale et.al. (2012) found very few studies conducted to examine blended learning
environment with using a combination of face-to-face instruction and computer-mediate
instruction. This is an area that needs considerable increase in studies to examine the
possibilities of using technology effectively in the classroom
Differentiated instruction has been the topic of numerous books and articles and there is a
sempiternal amount of information on differentiated instruction on the internet. What many
reviews of the literature have noted is that there is a lack of evidence proving that differentiated
instruction is effective. Tracey Hall, Nicole Strangman, and Anne Meyer (2003) in a paper for
the National Center on Accessing the General Curriculum (NCAC) wrote, “Based on this review
of the literature of differentiated instruction, the ‘package’ itself is lacking empirical validation”
(p. 5). This sentiment has been restated by many other studies and reviews including Pearl
Subban (2006) and Brenda Logan (2011). Future studies will need to investigate what is the
proper balance of instructional level, time on task, and motivation to produce the ideal
environment for increasing the accessed growth rate of the individual skills and content mastery.
There are many elements of differentiated instruction and to date research has chosen to examine
individual aspects of this method rather than developing studies that examine the whole picture
of differentiated instruction.
Assuming that differentiated theory is based mainly on Vygotsky’s (1978) sociocultural
theory (Valiande et al., 2011) studies will need to be designed that can examine the continual
cyclical movement of students going from ZPD to ZAD repeatedly ad infinitum. Within the
current constricts of public schools where the average pupil to teacher ratio is 20 to 1 (Synder
and Dillow, 2011) research will be needed to examine the most efficient manner to differentiate
instruction using today’s technology. This would be necessary because as differentiation applies

108
to the individual student, the teacher would not have sufficient time to be the “knowledgeable
other” for all students. Research on how technology could be used to instruct students who are
in their ZPD is paramount if differentiated instruction is to be used extensively in public schools.
To enable teachers to address individual student needs without technological assistance teacher
to pupil ratios will have to be drastically reduced, making full differentiation cost feasible to
implement. Research should be conducted determining an optimal age range or content area
where computers acting as the “knowledgeable other” will be effective. This would include
studies of the capabilities of computers to become substitutes for human tutors.
Personal Reflection
The researcher in this study began using the methods used by the 5th and 6th grade teacher
when he came to the school of this case study in 2005. The researcher’s first class consisted of
17 Title I students and five ESL students. The abilities of the students were wide ranging with
many gaps in their mathematics understanding. The researcher purchased eight Dell desktop
computers and began individualizing the students’ math instruction due to the fact he did not see
whole class instruction as an effective means of meeting the individual needs of the students.
Using Accelerated Math diagnostics tests (5 questions on each test) to determine the individual
student’s understanding of the math objectives that a student should have mastered to meet the
state standards expectations. When a student demonstrated lack of mastery on an objective they
were sent first to an interactive computer lesson on the objective. If this did not work the student
would work with a peer who had demonstrated mastery of the objective to learn the skill needed
to master the objective. If this method was not successful then the teacher would work with the
student one-on-one.

109
In the 2013-2014 school year the researcher became the assistant principal and
implemented the Measure of Academic test (MAP) from Northwest Evaluation Association to
use as a measuring tool to measure academic growth. The state test was changing to the
Common Core standards and it would take a few years to get a baseline to measure growth. The
new test developer was terminated after the 2014-2015 school year and Alaska did not take a
standardized test in the 2015-2016 school year. Alaska has yet to hire a vendor to create and
implement a test for the 2016-2017 school year as of November 2016, hence the MAP was
viewed as a necessity by the researcher to measure student growth. The researcher became the
principal in the 2014-2015 school year and took the methods of instruction used in the 5th and 6th
grade teachers of this study building wide. The technology in the building was sufficient to
begin this change in instructional methods. The researcher spent a few hours in each classroom
to help teachers begin moving from teacher centered instruction to individualized instruction
using Mastery Learning theory in a blended environment. To begin the process teachers
implemented a STAR Math test to determine where each student should begins in the
Accelerated Math libraries. Formative assessments are assigned to students and the process of
determining what each student understands and does not begins. When a student does not
demonstrate mastery of a formative assessment the teacher must decide what is the most efficient
way for this student to learn the objective. There are many options to choose from ranging from
an interactive computer lesson, Kahn Academy assignment, peer-to-peer help or one-on-one with
the teacher. When the teacher decides the student has learned the objective the student will
attempt to demonstrate mastery of the objective again.
The average for students meeting their projected growth on the MAP test from first grade
through sixth grade was 134 percent in the first year. The expectation of projected growth on the

110
MAP test is 50 percent. Dr. Nate Jensen (2013) from NWEA stated “if a school or district only
has 50% of students meeting or exceeding their growth projections, this shouldn’t be viewed as
poor performance – instead, this should be viewed as the students in a school or district showing
growth consistent with what we would likely expect to observe” (“Interpreting Growth
Projections,” para. 5). The researcher saw many teachers overwhelmed by the increased student
engagement that these methods of instruction creates, as they switched from teacher-centered
instruction to student-centered instruction. This study demonstrates that Bloom (1968) was
correct and that school’s need to avoid the “educational trap” of viewing students, instructional
materials, curriculum, and teachers as groups. The use of technology allows students the ability
to learn content at their own pace and at the appropriate level of instruction, which gives the
student the opportunity to “master” subject content. School must begin viewing students as
individuals with individual needs. The teachers in this study taught students as individuals rather
than a group and greatly increased the effectiveness and assessed academic growth of their
classrooms.

111
References
Ally, M. (2008). Foundationsof educational theory for online learning. In T. Anderson (Ed.),
The Theory and Practice of Online Learning (pp. 15-44). Edmonton, Canada: AU Press,
Athabasca University.
Anderman, E. M., Eccles, J. S., Yoon, K. S., Roeser, R., Wigfield, A., & Blumenfeld, P. (2001).
Learning to value mathematics and reading: relations to mastery and performance-
oriented instructional practices. Contemporary Educational Psychology, 26, 76-95.
doi: 10.1006/ceps.1999.1043
Anderman, E. M., & Patrick, H. (2012). Achievement goal theory, conceptualization of
ability/intelligence, and classroom climate. In S. L. Christenson, A. L. Reschly, & C. Wylie (Eds.),
Handbook of research on student engagement (pp. 173–191). New York: Springer.
Anderson, T. (2008). Toward a theory of online learning. In T. Anderson (Ed.), The Theory and
Practice of Online Learning (pp. 45-74). Edmonton, Canada: AU Press, Athabasca University.
Block, J. H. (Ed.) (1971). Mastery learning: Theory and practice. New York: Holt, Rinehart and
Winston Inc.
Block, J. H., & Burns, R. B. (1976). Mastery learning. Review of Research in Education, Vol. 4,
No.1, p. 3-49. doi: 10.3102/0091732X004001003
Bloom, B. S. (1968). Learning for mastery. UCLA-CSEIP, Evaluation Comment, 1(2), 1–12.
Bloom, B. S., (1971) Affective consequences of school achievement. In J. H. Block (Ed.) Mastery learning
Theory and practice (pp. 13-28). New York: Holt, Rinehart & Winston.
Bloom, B. S. (1974). An introduction to mastery learning theory. In J. H. Block (Ed.), Schools, society and
mastery learning (pp. 3–14). New York: Holt, Rinehart & Winston.

112
Bloom, R. M. (2010). Implementation practices of differentiated instruction in the upper
elementary and middle school classroom: a discovery through grounded theory
(Doctoral dissertation) Retrieved from ProQuest (UMI 3396747)
Bourke, B. (2014). Positionality: Reflecting on the research process. The Qualitative Report
Volume 19, p. 1-9 Retrieved from, http://www.nova.edu/ssss/QR/Qr19/bourke18.pdf
Block, J. H. (Ed.) (1971). Mastery learning:Theory and practice. New York: Holt, Rinehart and
Winston Inc.
Carroll, J. (1963) A model of school learning. Teachers College Record, 64: 723·733.
Carroll, J. B. (1970) Problems of measurement related to the concept of learning for mastery
Educational Horizons, 48(3), 71-89.
Christenson, S. L., Reschly, A. L., & Wylie, C. (Eds.) (2012) Handbook of research on Student
Engagement. New York: Springer
Chudgar, A, and Luschei, T. F. (2009). National income, income inequality, and the importance
of schools: A hierarchical cross-national comparison. American Educational Research
Journal. 46(3), 626-658.
Creswell, J. W. (2007). Qualitative inquiry and research design: Choosing among five
approaches. (2nd ed.). Thousand Oaks, CA: Sage Publications Inc.
Creswell, J. (2009). Research Design: Qualitative, Quantitative, and Mixed Method
Approaches. Thousand Oaks: SAGE Publications.
Cuban, L. (2001). The bottom line. In S. Mondale & S. Patton (Eds.), School: the Story of
American Public Education (pp. 173-182). Boston, MA: Beacon Press.
Davies, R. S., Howell, S. L., & Petrie, J. A. (2010). A review of trends in distance education

113
scholarship at research universities in North America, 1998–2007. International Review
of Research in Open and Distance Learning, 11(3), 42
Dede, C. (2007). Reinventing the role of information and communications technologies in
education. Yearbook for the National Society for the Study of Education , 106(2), 11-38.
doi: 10.1111/j.1744-7984.2007.00113.x
Drysdale, J.S., Graham, C.R., Spring, K.A. & Halverson, L.R.. (2012). An analysis of research
trends in dissertations and theses studying blended learning, The Internet and Higher
Education 17(1) doi: 10.1016/j.iheduc.2012.11.003
Dzakiria, H., Mustafa, C. S., & Bakar, H. A. (2006). Moving forward with Blended Learning
(BL) as a pedagogical alternative to traditional classroom learning. Malaysian Online
Journal of Instructional Technology (MOJIT), 3(1), 11-18.
Edgar, D. W. (2012). Learning theories and historical events affecting instructional design in
education: Recitation Literacy toward extraction literacy practices. Sage publication.
doi:10.1177/2158244012462707
Finn, C. E., Julian, L., & Petrilli, M. J. (2006). The state of state standards, 2006.
Washington D.C: Thomas B. Fordham Foundation.
Fleischman, H. L., Hopstock, P. J., Pelczar, M. P., & Shelley, B. E. U.S. Department of
Education Institute of Education sciences, National Center for Education Statistics.
PISA 2009 results: Washington D. C.: Government Printing Office.
Gallant, T. F. (1973). Thomas F. Dewey’s child-centered education in contemporary academe.
The Educational Forum, Vol.(4), 411-419.
Fraenkel, J. R., Wallen, N. E., & Hyun, H. H. (2012). How to design and evaluate research in
education. (8th ed.). New York, NY: McGraw-Hill.

114
Graham, C. R. (2013). Emerging practice and research in blended learning. In M. G. Moore
(Ed.), Handbook of distance education (3rd ed., pp. 333–350). New York, NY: Routledge
Guskey, T. R., & Gates, S. L. (1986). Synthesis of research on the effects of mastery learning
in elementary and secondary classrooms. Educational Leadership, 43(8), p. 73-79
Hanushek, E. A., Jamison, D. T., Jamison, E. A., & Woessmann, L. (March 01, 2008). Education
and economic growth: It's not just going to school, but learning something while there that
matters. Education Next, 8, 2, 62-70.
Hess, F. M. (2006). Politics, policy, and the promise of entrepreneurship. In F. Hess (Ed.),
Educational Entrepreneurship: realities, challenges, possibilities (pp. 243-260). Cambridge,
MA: Harvard Education Press.
Hess, F. M. (2010). Education unbound: the promise and practice of greenfield schooling.
Alexandria, VA: ASCD.
Hall, T., Strangman, N. & Meyer A. (2003). Differentiated instruction and implication for udl
implementation. Wakefield, MA: National Center on Accessing the General Curriculum
Retrieved June 5, 2012, from http://www.cast.org/publications/ncac_diffinstructudl.html
Hunt, J. B., Jr. & Tierney, T. J. (2006). American higher education: How does it measure up for
the 21st century? National Center Report, 06-2. United States, The National Center for
Public Policy and Higher Education
Jensen, N. (2013) Interpreting the percentage of students meeting or exceeding their growth projections.
NWEA Retrieved from https://www.nwea.org/blog/2013/interpreting-percentage-students-
meeting-exceeding-growth-projections
Johnson, L., Adams Becker, S., Cummins, M., Estrada V., Freeman, A., and Ludgate, H. (2013).
NMC Horizon Report: 2013 K-12 Edition. Austin, Texas: The New Media Consortium.

115
Klein, J. I., Rice, C., Levy, J., & Council on Foreign Relations. (2012). U.S. education reform
and national security. New York: Council on Foreign Relations.
Kort, B.; Reilly, R., "A pedagogical model for teaching scientific domain knowledge," Frontiers
in Education, 2002. FIE 2002. 32nd Annual, vol.1, no., pp.T3A-13,T3A-17 vol.1, 2002
doi: 10.1109/FIE.2002.1157956
Kulik, C. C., Kulik, J. A., & Bangert-Drowns, R. L. (1990). Effectiveness of mastery learning
programs: A meta-analysis. Review of Educational Research, Vol. 60, No. 2, pp. 265-299.
doi: 10.3102/00346543060002265.
Lin, C. H., Liu, E. Z-F., Chen,Y-U., Liou, P. Y., Chang, M., Wu, C-H., & Yuan, S. M. (2013).
Game-Based Remedial Instruction in Mastery Learning for Upper-Primary School Students.
Educational Technology & Society, 16 (2), 271-281.
Logan, B. (2011). Examining differentiated instruction: Teachers respond. Research in Higher Education
Journal, 13 (1-14).
McCown, R., Driscoll, M. & Roop, P. G. (1996). Educational Psychology: A learning-centered
approach to classroom practice. (2nd ed.). Boston: Pearson Custom Pub.
Miles, K. S. (2010) Mastery learning and academic achievement. Walden University,
Minneapolis, Minnesota.
Obama B. H. (2011, January, 25). [State of the Union Address]. Speech presented to a Joint
Session of Congress, House of Representatives, Washington DC. Retrieved from
https://www.whitehouse.gov/the-press-office/2011/01/25/remarks-president-state-union-
address
OECD. (1996). The knowledge-based economy. Retrieved from OECD publication website:
www.oecd.org/dataoecd/51/8/1913021.pdf

116
Peterson, P. E., Lastra-Anadon, C., Hanushek, E. A., & Woessmann, L. (2011). Are U.S students
ready to compete?: The latest on each state's international standing. Education Next, 11(4),50-59
November, A. (n.d.). Beyond technology: the end of the job and the beginning of digital work.
November Learning, Retrieved from http://novemberlearning.com/resources/archive-of-
articles/beyond-technology/
Papert, S. (1993). The children’s machine: Rethinking school in the age of the computer.
New York, New York City: Basic Books.
Picciano, A., Dziuban, C. and Graham, C. (2014). Blended learning: Research perspectives,
volume 2. NY: Routledge.
Rosen, Y. & Beck-Hill, D. (2012). Intertwining digital content and a one-to-one laptop
environment in teaching and learning: Lessons from the time to know program. Journal
of Research on Technology in Education, 44(3) 225-241
Saldaña, J. (2013). (2nd ed.) The coding manual for qualitative researchers. London, ENG: Sage
Stake, R. E. (1995). The art of case study research. Thousand Oaks, CA: Sage
Staker, H., & Horn, M. B. (2014). Blended learning in the K-12 education sector. In Picciano, A.
G., Dziuban, C. D., & Graham C. R., Blended learning: research perspectives vol. 2
(p. 287-303). New York NY: Routledge
STAR Assessments (2014). Understanding reliability and validity. Wisconsin Rapids, WI:
Renaissance Learning, Inc.
Stringer, E. (2007). Action research. (3rd ed.) Thousand Oaks, CA: Sage.years 2011 to 2021 (pp. 27-52).
Retrieved from https://www.cbo.gov/publication/21999
Subban, P. (2006). Differentiated instruction: A research basis. International Education Journal,
7(7), 935-947.

117
Snyder, T.D., and Dillow, S.A. (2011). Digest of Education Statistics 2010 (NCES 2011-015).
National Center for Education Statistics, Institute of Education Sciences, U.S Department
of Education. Washington, DC.
Tomlinson, C.A. (2001). How to differentiate instruction in mixed-ability classrooms, (2nd ed.).
Alexandria, Virginia: Association for Supervision of Curriculum Development.
Xin, L., & Qiong, Z. (2009). Students' experiences of mathematics learning in technology
integrated classrooms. International Journal Of Technology In Teaching & Learning,
5(1), 62-74.
Ysseldyke, J., & Tardew, S. (2007). Use of a progress monitoring system to enable teachers to
differentiate mathematics instruction. Journal of Applied School Psychology, 24(1), 1-28.
doi:10.1300/J370v24n01_01
Valiande, S. A., Kyriakides, L., & Koutselini, M. (2011, January) Investigating the impact of
differentiated instruction in mixed ability classrooms: Its impact on the quality and equity
dimensions of education effectiveness. Paper presented at the: International Congress for
School Effectiveness and Improvement 2011, Cyprus, Italy. Retrieved from
http://www.icsei.net/icsei2011/Full%20Papers/0155.pdf
Valiande, S. A. & Tarman, B. (2010, September). Differentiated teaching and constructive
learning approach by the implementation of ICT in mixed ability classrooms.
International Computer and Instructional Technologies Symposium. University of
Cyprus, Pedagogical Institute, Konya, Turkey.
Vygotsky, L. (1978). Interaction between learning and development. In M. Cole, V. John-
Stiener, S. Scribner & E. Souberman (Eds.). Mind and Society: The Development of Higher
Psychological Processes. Cambridge, MA: Harvard University Press.
118
Wagner, T. (2010). Global achievement gap: Why even our best schools don't teach the new
survival skills our children need--and what we can do about it. New York, NY, USA:
Basic Books. Retrieved from http://www.ebrary.co
Whalen, C., Kowalewski, K., & Arnold, R., The economic outlook (2011). In Bogusz, C., Kelly,
K., Mazade, L., Skeen, J., & Snyder, S (Eds.), The Budget and economic outlook: Fiscal

119
Appendix A
Teacher Interview Protocol
INTRODUCTION
Introductory Protocol
Thank you for your willingness to participate in this study. The reason I have selected you to
participate in this study is due to the fact that on all summative assessments over the past decade
you have consistently been among the few elementary intermediate teachers with the greatest
amount of student growth. You have showed significantly greater student growth than 95%
percent of the other elementary intermediate teachers in this district on SBA assessments, STAR
Math Assessments and MAP assessments. Through this study we hope to find how you have
consistently managed to do so every school year. We hope to examine what strategies and
instructional methods you have used to accomplish this and determine if these methods are
transferrable to other educators.
Due to the fact that your responses are important to this study I would like to digitally record our
conversation. I will take notes, however the recording will ensure that I do not miss any
information on how from your perspective you manage to consistently get tremendous growth
from your students. The digital recordings will be transcribed and then deleted. I will be the
only one with access to the transcriptions which be kept in a safe in my home. All information
will be kept confidential and a pseudonym will be used to label the tapes and pseudonym will be
used for you in the study.
It is the policy of Northeastern University that no activity involving human subjects be
undertaken until those activities have been reviewed and approved by the University’s
Institutional Review Board (IRB). All university research involving human subjects must first be
reviewed by the Office of Human Subject Research Protection to ensure that this study is in
compliance with federal, state and the university’s statutes and regulations relating to the
protection of human subjects. To begin this interview you will need to sign a consent document
that states: (1) All data gathered in this study will be kept completely confidential, publication
will use pseudonyms for all participants as well as location of study will use pseudonyms, (2)
your participation is voluntary and you can opt out at anytime, and (3) we do not intend to inflict
any harm. If you have questions about this form or the interview process please ask. I would
also like to digitally record this session and I have a document for you to sign giving us
permission to do so. This recording will be deleted after it has been transcribed.
This session is one hour and I have many questions that I would like you to respond to. If there
is need to pick up the pace to ensure that we get through all the questions I will let you know.
Do you have any questions before we start?
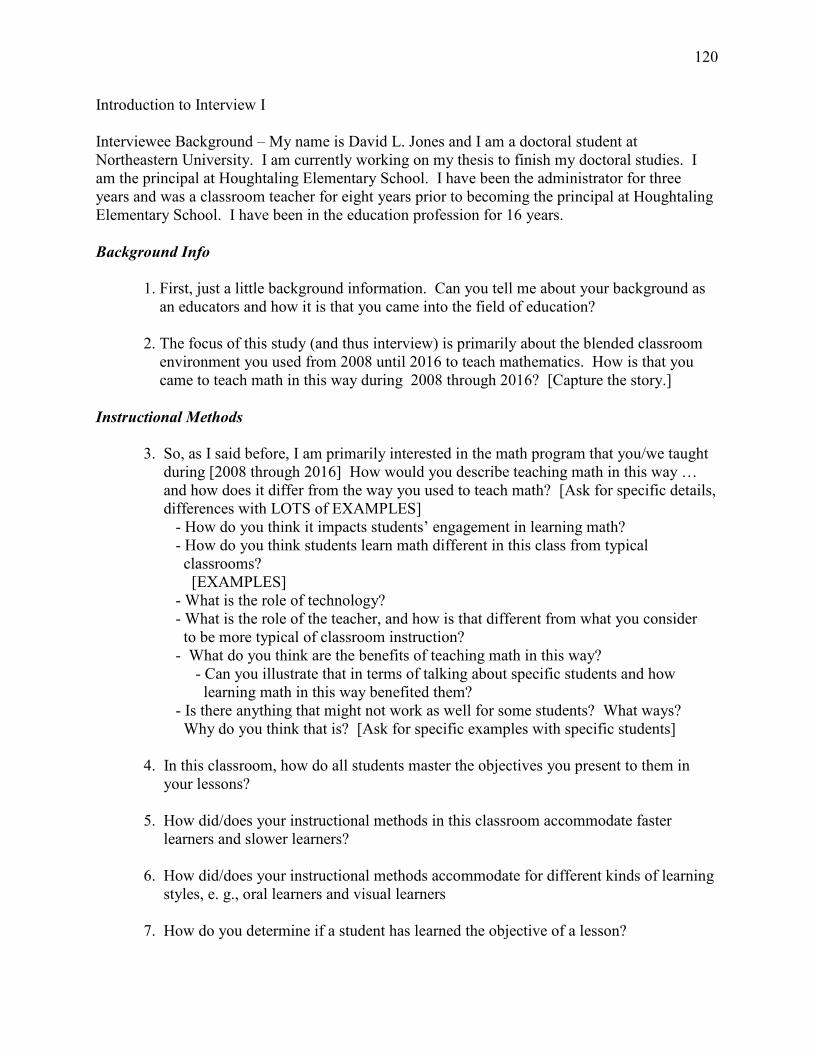
120
Introduction to Interview I
Interviewee Background – My name is David L. Jones and I am a doctoral student at
Northeastern University. I am currently working on my thesis to finish my doctoral studies. I
am the principal at Houghtaling Elementary School. I have been the administrator for three
years and was a classroom teacher for eight years prior to becoming the principal at Houghtaling
Elementary School. I have been in the education profession for 16 years.
Background Info
1. First, just a little background information. Can you tell me about your background as
an educators and how it is that you came into the field of education?
2. The focus of this study (and thus interview) is primarily about the blended classroom
environment you used from 2008 until 2016 to teach mathematics. How is that you
came to teach math in this way during 2008 through 2016? [Capture the story.]
Instructional Methods
3. So, as I said before, I am primarily interested in the math program that you/we taught
during [2008 through 2016] How would you describe teaching math in this way …
and how does it differ from the way you used to teach math? [Ask for specific details,
differences with LOTS of EXAMPLES]
- How do you think it impacts students’ engagement in learning math?
- How do you think students learn math different in this class from typical
classrooms?
[EXAMPLES]
- What is the role of technology?
- What is the role of the teacher, and how is that different from what you consider
to be more typical of classroom instruction?
- What do you think are the benefits of teaching math in this way?
- Can you illustrate that in terms of talking about specific students and how
learning math in this way benefited them?
- Is there anything that might not work as well for some students? What ways?
Why do you think that is? [Ask for specific examples with specific students]
4. In this classroom, how do all students master the objectives you present to them in
your lessons?
5. How did/does your instructional methods in this classroom accommodate faster
learners and slower learners?
6. How did/does your instructional methods accommodate for different kinds of learning
styles, e. g., oral learners and visual learners
7. How do you determine if a student has learned the objective of a lesson?

121
8. How important is tracking every student’s progress and how do you go about that task
in this classroom?
9. In this classroom, how do you think instructional is differentiated for each student?
And how does that benefit your students and their learning? [SPECIFIC EXAMPLES
referring to STUDENTS]
10. How did learning how to teach in this way change your perspective about teaching
and learning and your own perception of you as a teacher?
11. In the end, it has been found that student growth in math was much greater in this
classroom than other math classrooms. What do you attribute to this outcome?
12. Finally, how do you think this method of teaching and learning could benefit other
students and teachers?

122
Appendix B
Student Focus Group Interview Protocol
INTRODUCTION
Introductory Protocol
Hi. My name is David Jones and I used to teach in this school three years ago and I am now the
principal. Before we begin we will discuss talk about confidentiality of today’s discussion.
These conversations are private and not to be shared outside of this room.
Today I will be asking you questions that there are no right answers or wrong answers. I realize
everyone’s perspective could be different and that is fine and to be expected. I am only
interested in everyone’s personal perspective. At anytime if you are uncomfortable or feel
anxious by the questions you may leave and it will not be held against you in any way. Your
participation is completely voluntary.
I am looking at how math was taught to you in 5t//6th grade and would like to ask you today
about your thoughts, feelings, and experiences learning math in 5th/6th grade.
Because what you have to say is so important to me, I am going to record it so that I can listen
back to what you said.
I really appreciate you helping me think about this.
Do you feel ok participating and helping me by answering some questions?
One VERY important thing. I want you to answer me honestly. No answer is right or wrong. I
just want to know what you really think. Ok?
Focus Group Interview
1. Tell me how you learned math in this class?
- Can you give me some specific examples? [Probe for a lot of specifics.
Details. Examples.]
- How is that different from how you learned math in the past and/or learning
math now? [Can you give me an example of that. Get a lot of these.]
2. Do you feel that the use of technology helped you learn math better in this class?
- If so, how so? If not, how not? [Examples.]
3. How did the teacher help you learn math in this classroom?

123
- Was that helpful? How so? Not helpful? Now not?
4. Do you feel having math objectives specifically for you helped you to learn math
better? How so? How not?
5. How did you feel about everyone in the classroom working on different math
objectives everyday in this class?
6. Do you feel the way you were able to work with other students and your teacher helped
you to learn math? How so?
- Did it help you when you were struggling learning something? And, if so, how so?
- How is this different from how you learn math in other classes?
7. Do you feel you could learn math better in this class? Why do you say that? How did
it make you a better math learner?
8. Would you recommend that other students learn math in this way? Why do you say
that?

124
Appendix C

125
Appendix D
Fall 2015 5th Grade Spring 2016 5th Grade
Summary Summary
Total Students With Valid Growth Test
Scores
15 Total Students With Valid Growth Test
Scores
22
Mean RIT 205.5 Mean RIT 225.5
Median RIT 206 Median RIT 226.5
Standard Deviation 16 Standard Deviation 16.3
Norm Grade Level Mean RIT 211.4 Norm Grade Level Mean RIT 221.4
Students At or Above Grade Level Mean RIT 4 Students At or Above Grade Level Mean RIT 14
Fall 2015 6th Grade Spring 2016 5th Grade
Summary Summary
Total Students With Valid Growth Test
Scores
25 Total Students With Valid Growth Test
Scores
24
Mean RIT 219.2 Mean RIT 233.1
Median RIT 222 Median RIT 237
Standard Deviation 13.4 Standard Deviation 12.1
Norm Grade Level Mean RIT 217.6 Norm Grade Level Mean RIT 225.3
Students At or Above Grade Level Mean RIT 15 Students At or Above Grade Level Mean RIT 18
NWEA MAP Norms

126
Appendix E

127
Appendix F
5th Grade Accelerated Math Common Core Library
Topic 1 - Number and Operations in Base Ten: Operations Multi-digit Whole Number
Obj. 1 - Multiply a 3-digit whole number by a 2-digit whole number
Obj. 2 - Find the product of three identical factors
Obj. 3 - Multiply three 1- and 2-digit whole numbers
Obj. 4 - Multiply a 3- or 4-digit whole number by a 3-digit whole number
Obj. 5 - Divide a 3- or 4-digit whole number by a 2-digit whole number, with no remainder and
no zeros in the quotient
Obj. 6 - Divide a 3- or 4-digit whole number by a 2-digit whole number, with a remainder and no
zeros in the quotient
Obj. 7 - Divide a 3- or 4-digit whole number by a 2-digit whole number, with no remainder and
at least one zero in the quotient
Obj. 8 - Divide a 3- or 4-digit whole number by a 2-digit whole number, with a remainder and at
least one zero in the quotient
Obj. 9 - Divide a 3- or 4-digit whole number by a 2-digit whole number and express the quotient
as a mixed number
Obj. 10 - WP: Divide a whole number of up to 4-digits by a 2-digit whole number, with no
remainder
Obj. 11 - WP: Divide a whole number of up to 4-digits by a 2-digit whole number and interpret
the remainder
Topic 2 - Number and Operations in Base Ten: Decimals
Obj. 12 - Determine the decimal number through thousandths when given its word form
Obj. 13 - Determine the decimal number through thousandths when given its expanded form
Obj. 14 - Determine the decimal number through thousandths represented in expanded form
using powers of ten
Obj. 15 - Determine the word form of a decimal number through thousandths
Obj. 16 - Compare two decimal numbers through thousandths represented in expanded form
Obj. 17 - Compare two decimal numbers through thousandths
Obj. 18 - Round a decimal number to a specified place through hundredths
Obj. 19 - Add two decimal numbers through hundredths using pictures
Obj. 20 - Add two decimal numbers through hundredths using a place value chart
Obj. 21 - Add two decimal numbers through hundredths
Obj. 22 - Add three decimal numbers through hundredths using strategies based on properties of
operations
Obj. 23 - Subtract decimal numbers through hundredths using pictures
Obj. 24 - Subtract decimal numbers through hundredths using a place value chart
Obj. 25 - Subtract decimal numbers through hundredths
Obj. 26 - Relate multiplication of a decimal number through tenths by a whole number to a
model
Obj. 27 - Relate multiplication of a decimal number through tenths by a decimal number through
tenths to a model
Obj. 28 - Multiply a decimal number through hundredths by 10, 100, or 1,000
Obj. 29 - Multiply a decimal number through hundredths by a 1-digit whole number

128
Obj. 30 - Multiply a decimal number through hundredths by a 2-digit whole number
Obj. 31 - Multiply a decimal number through hundredths by a decimal number through tenth
Obj. 32 - Relate division of a whole number by a decimal number through tenths to a model
Obj. 33 - Relate division of a decimal number through tenths to a model
Obj. 34 - Divide a decimal number by 10 or 100
Obj. 35 - Divide a whole number or a decimal number by 0.1 or 0.01
Obj. 36 - Divide a 1-digit whole number by a decimal number through hundredths where the
quotient is a whole number
Obj. 37 - Divide a 2- to 3-digit whole number by a decimal number through hundredths where
the quotient is a whole number
Obj. 38 - Divide a decimal number through hundredths by a 1-digit whole number
Obj. 39 - Divide a decimal number through hundredths by a decimal number through hundredths
Topic 3 - Operations and Algebraic Thinking
Obj. 40 - Evaluate a numerical expression of two operations with parentheses, using order of
operations
Obj. 41 - Evaluate a numerical expression of three operations with parentheses, using order of
operations
Obj. 42 - Evaluate a numerical expression of four or more operations with parentheses, using
order of operations
Obj. 43 - Translate a verbal expression into a numerical expression
Obj. 44 - Translate a numerical expression into a verbal expression
Obj. 45 - Represent powers of 10 using whole-number exponents
Obj. 46 - WP: Generate two numerical patterns using two given rules
Obj. 47 - WP: Determine the relationship between corresponding terms in a table containing two
different numerical patterns
Topic 4 - Number and Operations: Fractions
Obj. 48 - Add fractions with unlike denominators that have factors in common
Obj. 49 - Add fractions with unlike denominators that have factors in common and simplify the
sum
Obj. 50 - Add fractions with unlike denominators that have no factors in common
Obj. 51 - Subtract fractions with unlike denominators that have factors in common
Obj. 52 - Subtract fractions with unlike denominators that have factors in common and simplify
the difference
Obj. 53 - Subtract fractions with unlike denominators that have no factors in common
Obj. 54 - Add mixed numbers with unlike denominators and simplify the sum
Obj. 55 - Subtract mixed numbers with unlike denominators and simplify the difference
Obj. 56 - Add two mixed numbers with unlike denominators or a mixed number to a fraction
with unlike denominators and simplify the sum
Obj. 57 - Subtract two mixed numbers with unlike denominators or subtract a fraction from a
mixed number with unlike denominators and simplify the difference
Obj. 58 - Estimate a sum of two fractions using benchmark numbers 0, 1/2, and 1
Obj. 59 - Estimate a difference of two fractions using benchmark numbers 0, 1/2, and 1
Obj. 60 - WP: Add or subtract fractions with unlike denominators that have no factors in
common
Obj. 61 - WP: Add or subtract mixed numbers with unlike denominators that have no factors in
common

129
Obj. 62 - WP: Estimate a fraction sum or difference using benchmark numbers 0, 1/2, and 1 .
Obj. 63 - WP: Add or subtract fractions with unlike denominators and simplify the sum or
difference
Obj. 64 - WP: Add or subtract mixed numbers with unlike denominators or a mixed number and
a fraction with unlike denominators and simplify the sum or difference
Obj. 65 - Relate a fraction to a division sentence
Obj. 66 - WP: Divide whole numbers resulting in a fraction or mixed number
Obj. 67 - Relate the product of a fraction and a whole number to a model
Obj. 68 - Relate the multiplication of a fraction by a whole number to an equivalent expression
Obj. 69 - Relate the multiplication of two fractions to an equivalent expression
Obj. 70 - Relate the product of two fractions to a rectangular area model
Obj. 71 - Determine the area of a rectangle with fractional side lengths by tiling
Obj. 72 - Multiply a fraction by a fraction
Obj. 73 - Multiply a mixed number by a whole number
Obj. 74 - Multiply a mixed number by a fraction
Obj. 75 - Multiply a mixed number by a mixed number
Obj. 76 - Determine the area of a rectangle with fractional side lengths using multiplication
Obj. 77 - Determine the result of multiplying a number by a fraction equal to 1, less than 1, or
greater than 1
Obj. 78 - WP: Multiply two fractions
Obj. 79 - WP: Multiply two mixed numbers or a mixed number and a fraction
Obj. 80 - Relate a situation involving division of a unit fraction by a non-zero whole number to a
numeric expression
Obj. 81 - Divide a unit fraction by a non-zero whole number
Obj. 82 - Relate a situation involving division of a whole number by a unit fraction to a numeric
expression
Obj. 83 - Divide a whole number by a unit fraction using a model
Obj. 84 - Divide a whole number by a unit fraction
Obj. 85 - WP: Divide a unit fraction by a non-zero whole number
Obj. 86 - WP: Divide a whole number by a unit fraction
Topic 5 - Measurement and Data
Obj. 87 - Solve a problem with fractions involving any of the four operations by using
information presented in a line plot with a fractional scale to eighths
Obj. 88 - Convert between customary units of length using fractional amounts
Obj. 89 - Convert between customary units of capacity using fractional amounts
Obj. 90 - Convert between customary units of weight using fractional amounts
Obj. 91 - Convert between metric units of capacity using decimal amounts
Obj. 92 - Convert between metric units of mass using decimal amounts
Obj. 93 - Convert between metric units of linear measurements using decimal amounts
Obj. 94 - WP: Solve a multi-step real-world problem involving unit conversions within the
customary system
Obj. 95 - WP: Solve a multi-step real-world problem involving unit conversions within the
metric system
Topic 6 - Geometry: Concepts and Measurement
Obj. 96 - Determine the location of an ordered pair in the first quadrant

130
Obj. 97 - Determine the location of an ordered pair in the first quadrant using compass directions
Obj. 98 - Determine how to travel from the origin to a given point in the first quadrant
Obj. 99 - Determine the ordered pair of a point in the first quadrant
Obj. 100 - WP: Graph a point in the first quadrant of the coordinate plane to represent a problem
Obj. 101 - Classify a 2-dimensional figure into categories and subcategories based on attributes
Obj. 102 - Determine the volume of a right rectangular
prism by counting unit cubes
Obj. 103 - Determine the volume of a right rectangular prism given a diagram
Obj. 104 - Determine the volume of a right rectangular prism
Obj. 105 - WP: Determine the volume of a right rectangular prism given a diagram and formula
Obj. 106 - WP: Determine the volume of a right rectangular prism given a formula
Obj. 107 - Determine the volume of a solid figure composed of right rectangular prisms by
decomposing it into two non-overlapping parts and adding the volumes of the non-overlapping
parts
Obj. 108 - WP: Determine the volume of a solid figure composed of right rectangular prisms by
decomposing it into two non-overlapping parts and adding the volumes of the non-overlapping
parts
6th Grade Accelerated Math Common Core Library
Topic 1 - Ratios and Proportional Relationships Obj. 1 - Relate a ratio to a diagram Obj. 2 - WP: Determine a ratio using whole numbers less than 50 Obj. 3 - WP: Determine the ratio of two whole numbers, at least one of which is larger than 50 Obj. 4 - Determine a ratio relationship between two quantities Obj. 5 - Determine a unit rate Obj. 6 - Relate an input-output table to equivalent ratios Obj. 7 - Find a missing value in a ratio table Obj. 8 - Determine the graph of the values in a ratio table Obj. 9 - WP: Compare two ratios using tables Obj. 10 - WP: Determine a unit rate with a whole number value Obj. 11 - WP: Determine a unit rate with a decimal value Obj. 12 - WP: Use a unit rate with a whole number or whole cent value to solve a problem Obj. 13 - Relate a percent of a quantity to a rate per 100 Obj. 14 - WP: Determine a percent where a ratio, not in 100ths, is given Obj. 15 - WP: Relate a percent of a quantity to a rate per 100 Obj. 16 - Determine the percent less than 100% given a part and a whole Obj. 17 - Determine the part given a whole and a percent less than 100% Obj. 18 - Determine the whole given a part and a percent less than 100% Obj. 19 - Determine the part given a whole and a percent more than 100% Obj. 20 - Determine the whole given a part and a percent more than 100% Obj. 21 - WP: Determine the percent less than 100% given a part and a whole Obj. 22 - WP: Determine the part given a whole and a percent less than 100% Obj. 23 - WP: Determine the whole given a part and a percent less than 100% Obj. 24 - WP: Determine the percent less than 100% given two parts of a whole

131
Obj. 25 - WP: Determine the whole given a part and a percent more than 100% Obj. 26 - Convert measurement units using ratios Obj. 27 - WP: Solve a problem involving measurement conversion Obj. 28 - Convert a rate from one unit to another with a change in one unit Obj. 29 - Convert a rate from one unit to another with a change in both units Topic 2 - The Number System Obj. 30 - Divide a multi-digit whole number by multiples of 100 or 1,000 Obj. 31 - Divide a multi-digit whole number of up to seven digits by a 3- or 4-digit whole number Obj. 32 - Determine the multiplication expression involving rational numbers that is equivalent to a given division expression Obj. 33 - Divide a fraction by a fraction Obj. 34 - WP: Divide a fraction by a fraction Obj. 35 - Add two or more decimal numbers of differing places to thousandths Obj. 36 - Subtract two decimal numbers of differing places to thousandths Obj. 37 - Multiply two decimal numbers through thousandths Obj. 38 - Divide a whole number or a decimal number through ten thousandths by 0.001 Obj. 39 - Divide a 1- to 3-digit whole number by a decimal number resulting in a quotient that contains thousandths or ten thousandths Obj. 40 - Divide a decimal number through ten thousandths by a 1- or 2-digit whole number or a decimal number through hundredths Obj. 41 - Find the greatest common factor of two whole numbers less than or equal to 100 Obj. 42 - Find the least common multiple of two whole numbers less than or equal to 12 Obj. 43 - Apply the distributive property to determine an equivalent expression Obj. 44 - WP: Represent a quantity using a positive or negative number Obj. 45 - Identify or locate an integer on a number line Obj. 46 - Identify a positive or negative rational number represented by a point on a number line Obj. 47 - Determine the opposite of an integer given a number line Obj. 48 - Determine the location of a rational number on a horizontal or vertical number line Obj. 49 - Determine the location of an ordered pair in any quadrant Obj. 50 - Relate the locations of two ordered pairs that differ only by signs Obj. 51 - Identify the quadrant for an ordered pair Obj. 52 - Determine the ordered pair of a point in any quadrant Obj. 53 - Compare two integers Obj. 54 - Order positive and negative integers Obj. 55 - Relate a statement of inequality to the relative positions of two rational numbers on a number line Obj. 56 - Compare positive and negative rational numbers Obj. 57 - Order positive and negative rational numbers Obj. 58 - WP: Determine a statement of order for rational numbers in context Obj. 59 - Interpret a statement of order for rational numbers using context

132
Obj. 60 - Determine the absolute value of a rational number shown on a number line Obj. 61 - WP: Solve a problem using absolute value to describe magnitude Obj. 62 - Solve a problem by graphing points in all four quadrants Topic 3 - Expressions and Equations Obj. 63 - Determine the exponential notation that represents a repeated multiplication Obj. 64 - Evaluate a whole number raised to a whole-number exponent Obj. 65 - Determine an exponential form of a whole number Obj. 66 - Use a numerical expression involving whole-number exponents to represent a multiplication expression Obj. 67 - Evaluate a numerical expression with parentheses and exponents, using order of operations Obj. 68 - Identify parts of an expression using mathematical terms Obj. 69 - Use an algebraic expression with one operation to represent a verbal expression Obj. 70 - Use an algebraic expression with two operations to represent a verbal expression Obj. 71 - Evaluate an algebraic expression with one variable and two or three operations, using whole-number substitution Obj. 72 - Evaluate an algebraic expression with two variables and two or three operations, using whole-number substitution Obj. 73 - Evaluate an algebraic expression involving whole-number exponents Obj. 74 - WP: Evaluate an algebraic expression or formula with one or two variables involving whole numbers Obj. 75 - WP: Generate a table of paired numbers based on an algebraic expression with two operations Obj. 76 - WP: Evaluate an algebraic expression involving exponents Obj. 77 - Identify equivalent algebraic expressions Obj. 78 - Determine solutions to a 1-variable linear inequality Obj. 79 - WP: Use an algebraic expression with one variable and one operation to represent a situation Obj. 80 - WP: Use an algebraic expression with one variable and two operations to represent a situation Obj. 81 - Solve a 1-step equation involving whole numbers Obj. 82 - Solve a 1-step equation involving fractions Obj. 83 - WP: Use a 1-variable 1-step equation to represent a situation Obj. 84 - WP: Solve a 1-step equation involving positive rational numbers Obj. 85 - WP: Write an inequality of the form x > c or x < c to represent a constraint or condition Obj. 86 - Represent the solution of an inequality on a number line Obj. 87 - Relate coordinates to a graph and a table Obj. 88 - Determine the algebraic expression with one operation for a table of paired numbers Obj. 89 - Determine the graph of a 1-operation linear function Obj. 90 - WP: Identify an algebraic equation with one operation for a table of paired numbers Obj. 91 - WP: Use an algebraic equation to express one quantity in terms of another

133
Topic 4 - Geometry Obj. 92 - Determine the area of a triangle Obj. 93 - Determine the area of a parallelogram Obj. 94 - WP: Determine the area of a triangle Obj. 95 - Find the area of a polygon composed of triangles and rectangles Obj. 96 - WP: Find the area of a polygon composed of triangles and rectangles Obj. 97 - Find the volume of a right rectangular prism with fractional edge lengths using unit fraction cubes Obj. 98 - Relate volume found using unit cubes to multiplication of edge lengths in a right rectangular prism Obj. 99 - Find the volume of a right rectangular prism with fractional edge lengths using a formula Obj. 100 - WP: Find the volume of a right rectangular prism with fractional edge lengths using a formula Obj. 101 - Determine the location of the vertices of a polygon on the Cartesian plane Obj. 102 - Find a side length of a polygon on the coordinate plane Obj. 103 - WP: Find a side length of a polygon on the coordinate plane Obj. 104 - Determine a net of a 3-dimensional shape Obj. 105 - Determine the surface area of a cube or a rectangular prism given a net Obj. 106 - WP: Find the surface area of an object using a net Topic 5 - Statistics and Probability Obj. 107 - Use a dot plot, histogram, or a box plot to represent data Obj. 108 - Report the number of observations in a data set Obj. 109 - Determine the mean of a data set Obj. 110 - Determine the median of a data set Obj. 111 - Determine the interquartile range of a data set Obj. 112 - Determine the mean absolute deviation for a data set Obj. 113 - Describe overall patterns and deviations within a data set

134
Appendix G
Topic 1: Rations and Proportional Relationships - 6th Grade Common Core
Obj. 1 – Relate a ratio to a diagram
1. The parallelogram below is made up of 64 small triangles. All the small triangles are the
same size and shape. What is the ratio of the unshaded area to the shaded area of the
parallelogram?
[A] 4:3 [B] 1:3 [C] 3:4 [D] 3:1
Topic 2: The Number System - 6th Grade Common Core
Obj. 34 – Divide a fraction by a fraction
1. Ms. Yu makes control units for electric wheelchairs. Each unit uses a computer chip
3/32 inch long. At her work station, Ms. Yu has a row of chips 3/16inch long. How many
control units can she make?
[A] 2 [B] 3 [C] 1 [D] 5
Topic 3: Expressions and Equations - 6th Grade Common Core
Obj. 67 - Evaluate a numerical expression with parentheses and exponents, using order of
Operations
1. (15 + 3)·20 – 82
[A] 792 [B] 296 [C] 4 [D] 11 Topic 4: Geometry - 6th Grade Common Core Obj. 92 Determine the area of a triangle 1. What is the area of the triangle?
18ft
5ft 16ft
[A] 144ft2 [B] 40ft2 [C] 45ft2 [D] 39ft2
135
Topic 5: Statistics and Probability - 6th Grade Common Core
Obj. 111 - Determine the interquartile range of a data set
1. There are 7 newborn kittens in a litter. These are their weights in ounces:
2.2, 2.4, 2.5, 2.6, 2.9, 4.2, and 4.8. What is the interquartile range of their weights?
[A] 1.8oz [B] 3.1oz [C] 2.6oz [D] 0.8oz
Topic 1: Number and Operations in Base Ten: Operations Multi-digit
Whole Numbers – 5th Grade Common Core
Obj. 1 - Multiply a 3-digit whole number by a 2-digit whole number
1. 397 x 65 = [A] 26,805 [B] 25,905 [C] 25,805 [D] 26,905
Topic 2: Number and Operations in Base Ten:
Decimals - 5th Grade Common Core
Obj. 17 - Compare two decimal numbers through thousandths
1. Which statement is true?
[A] 0.427 < 0.43 [B] 0.427 > 0.43 [C] 0.427 = 0.43
Topic 3: Operations and Algebraic Thinking - 5th Grade Common Core
Obj. 41 - Evaluate a numerical expression of three operations with parentheses, using
order of operations
3. 3 x (11+ 3) - 10 =
[A] 26 [B] 32 [C] 60 [D] 12
Topic 4: Number and Operations: Fractions - 5th Grade Common Core
Obj. 61 - WP: Add or subtract mixed numbers with unlike denominators that have no
factors in common
1. For a school project, Abigail is keeping a log of her activities. One day, she spent
2 5/12 hours reading for fun and 2 2/5 hours doing homework. How much time did she spend
reading and doing homework in all? Simplify the answer if possible.
[A] 4 8/17 hr [B] 4 7/17 hr [C] 4 49/60hr [D] 4 4/5 hr

136
Topic 5: Measurement and Data - 5th Grade Common Core
Obj. 95 - WP: Solve a multi-step real-world problem involving unit conversions within the
metric system
1. Each month Adam changes the amount of food and sunlight a potted plant receives. When
he started the plant was 75 cm tall. In the first month the plant grew 11 cm. The following
month, the plant grew 2 times as much as it did the first month. How many meters tall is the
plant at the end of the second month?
[A] 0.97 m [B] 0.88 m [C] 1.61 m [D] 1.08 m
Topic 6: Geometry: Concepts and Measurement - 5th Grade Common Core
Obj. 101 - Classify a 2-dimensional figure into categories and subcategories based on
Attributes
13. Which statement is true?
[A] A parallelogram is always a rhombus.
[B] A parallelogram is sometimes a rhombus.
[C] A parallelogram is never a rhombus.