Embed Size (px)
Citation preview
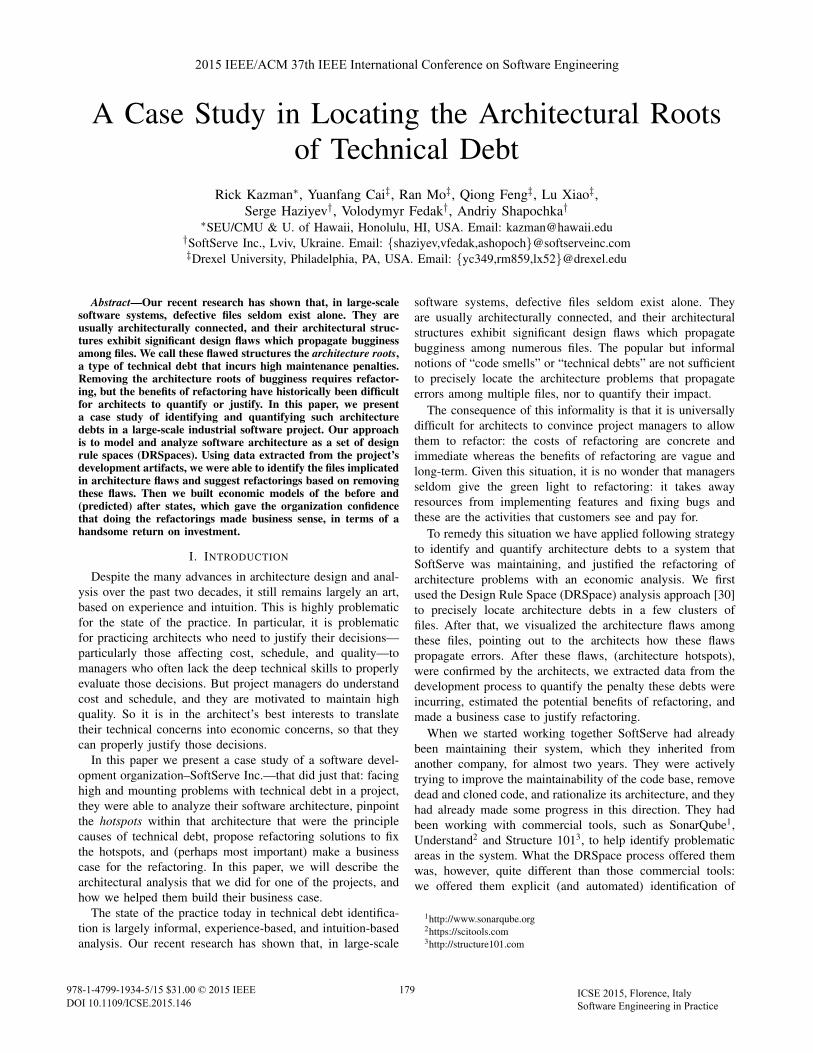
A Case Study in Locating the Architectural Rootsof Technical Debt
Rick Kazman∗, Yuanfang Cai‡, Ran Mo‡, Qiong Feng‡, Lu Xiao‡,Serge Haziyev†, Volodymyr Fedak†, Andriy Shapochka†
∗SEU/CMU & U. of Hawaii, Honolulu, HI, USA. Email: [email protected]†SoftServe Inc., Lviv, Ukraine. Email: {shaziyev,vfedak,ashopoch}@softserveinc.com‡Drexel University, Philadelphia, PA, USA. Email: {yc349,rm859,lx52}@drexel.edu
Abstract—Our recent research has shown that, in large-scalesoftware systems, defective files seldom exist alone. They areusually architecturally connected, and their architectural struc-tures exhibit significant design flaws which propagate bugginessamong files. We call these flawed structures the architecture roots,a type of technical debt that incurs high maintenance penalties.Removing the architecture roots of bugginess requires refactor-ing, but the benefits of refactoring have historically been difficultfor architects to quantify or justify. In this paper, we presenta case study of identifying and quantifying such architecturedebts in a large-scale industrial software project. Our approachis to model and analyze software architecture as a set of designrule spaces (DRSpaces). Using data extracted from the project’sdevelopment artifacts, we were able to identify the files implicatedin architecture flaws and suggest refactorings based on removingthese flaws. Then we built economic models of the before and(predicted) after states, which gave the organization confidencethat doing the refactorings made business sense, in terms of ahandsome return on investment.
I. INTRODUCTION
Despite the many advances in architecture design and anal-ysis over the past two decades, it still remains largely an art,based on experience and intuition. This is highly problematicfor the state of the practice. In particular, it is problematicfor practicing architects who need to justify their decisions—particularly those affecting cost, schedule, and quality—tomanagers who often lack the deep technical skills to properlyevaluate those decisions. But project managers do understandcost and schedule, and they are motivated to maintain highquality. So it is in the architect’s best interests to translatetheir technical concerns into economic concerns, so that theycan properly justify those decisions.
In this paper we present a case study of a software devel-opment organization–SoftServe Inc.—that did just that: facinghigh and mounting problems with technical debt in a project,they were able to analyze their software architecture, pinpointthe hotspots within that architecture that were the principlecauses of technical debt, propose refactoring solutions to fixthe hotspots, and (perhaps most important) make a businesscase for the refactoring. In this paper, we will describe thearchitectural analysis that we did for one of the projects, andhow we helped them build their business case.
The state of the practice today in technical debt identifica-tion is largely informal, experience-based, and intuition-basedanalysis. Our recent research has shown that, in large-scale
software systems, defective files seldom exist alone. Theyare usually architecturally connected, and their architecturalstructures exhibit significant design flaws which propagatebugginess among numerous files. The popular but informalnotions of “code smells” or “technical debts” are not sufficientto precisely locate the architecture problems that propagateerrors among multiple files, nor to quantify their impact.
The consequence of this informality is that it is universallydifficult for architects to convince project managers to allowthem to refactor: the costs of refactoring are concrete andimmediate whereas the benefits of refactoring are vague andlong-term. Given this situation, it is no wonder that managersseldom give the green light to refactoring: it takes awayresources from implementing features and fixing bugs andthese are the activities that customers see and pay for.
To remedy this situation we have applied following strategyto identify and quantify architecture debts to a system thatSoftServe was maintaining, and justified the refactoring ofarchitecture problems with an economic analysis. We firstused the Design Rule Space (DRSpace) analysis approach [30]to precisely locate architecture debts in a few clusters offiles. After that, we visualized the architecture flaws amongthese files, pointing out to the architects how these flawspropagate errors. After these flaws, (architecture hotspots),were confirmed by the architects, we extracted data from thedevelopment process to quantify the penalty these debts wereincurring, estimated the potential benefits of refactoring, andmade a business case to justify refactoring.
When we started working together SoftServe had alreadybeen maintaining their system, which they inherited fromanother company, for almost two years. They were activelytrying to improve the maintainability of the code base, removedead and cloned code, and rationalize its architecture, and theyhad already made some progress in this direction. They hadbeen working with commercial tools, such as SonarQube1,Understand2 and Structure 1013, to help identify problematicareas in the system. What the DRSpace process offered themwas, however, quite different than those commercial tools:we offered them explicit (and automated) identification of
1http://www.sonarqube.org2https://scitools.com3http://structure101.com
2015 IEEE/ACM 37th IEEE International Conference on Software Engineering
978-1-4799-1934-5/15 $31.00 © 2015 IEEE
DOI 10.1109/ICSE.2015.146
179
2015 IEEE/ACM 37th IEEE International Conference on Software Engineering
978-1-4799-1934-5/15 $31.00 © 2015 IEEE
DOI 10.1109/ICSE.2015.146
179
2015 IEEE/ACM 37th IEEE International Conference on Software Engineering
978-1-4799-1934-5/15 $31.00 © 2015 IEEE
DOI 10.1109/ICSE.2015.146
179 ICSE 2015, Florence, Italy Software Engineering in Practice
problem areas in the architecture, along with explanationsfor why these areas were problematic. Unlike other toolsthat report a list of individual problematic files, We reportedthese architecture debts in the form of 3 to 6 groups ofarchitecturally related files, and the architecture flaws amongthem can be visualized. This analysis revealed significantarchitecture issues not detectable by other tools, and allowedthem to plan refactoring strategies to address these problems.
In the end, we convinced SoftServe to refactor and this wasnot a difficult argument. SoftServe was, in fact, happy to dothe refactoring because: 1) they had specific advice about whatto refactor, how, and why; 2) they had a framework for makingeconomics-based decisions about refactoring that showed aclear and substantial predicted return on investment for thisactivity (nearly 300% ROI in the first year alone); and 3) theyhad more confidence in the results of the DRSpace analysisthan in the outputs of the tools that they had been using be-cause the visualization and quantification of architecture debtswere intuitive and sensible to both architects and management.Furthermore, the proposed refactoring strategy was backed upby empirical evidence based on sound software engineeringprinciples.
II. RESEARCH QUESTIONS
We conducted a case study as a means of achieving twoobjectives. First, we wanted to understand if our architecturehotspot analysis process could identify problems—architecturedebts—that industrial practitioners consider to be real, signif-icant, and worth fixing. Second, we wanted to understand if itis possible quantify these architecture debts, based on readilyavailable project data, to help these practitioners make rationalrefactoring decisions.
Towards these objectives, we examined the following re-search questions.
RQ1: According to opinions of SoftServe’s architects, arethe set of architectural issues that we reported truly problem-atic issues—that is, architecture debts?
RQ2: How do the results returned by the Titan tool chaindiffer from the files reported as sources of technical debt byother tools SoftServe is using, such as SonarQube?
RQ3: Is it possible to quantify the return on investment ofremoving architecture debts? In other words, is it possible todetermine the penalty incurred by the debts and the expectedbenefits if the debts are removed, and compare this with thecosts of refactoring?
III. CASE STUDY PROCEDURE
We were fortunate to work with SoftServe, a leading soft-ware outsourcing company with more than 3,500 employees,distributed over 200 active projects, with locations in 8 coun-tries. SoftServe has always prided itself on being a disciplinedsoftware engineering organization, having reached a CMMIlevel 3 and adopting many best practices in architecture,testing, agile development, and project management. Eachproject at SoftServe is managed using a suite of version controland issue tracking tools.
Moreover, SoftServe has made a significant, long-standingcommitment towards maintaining software quality by bothinvesting in ongoing education and by employing many com-mercial tools to identify technical debt, including Understand,Structure101, and SonarCube. Prior to our case study withthe subject project—a web portal system which we will referto as SS1 in this paper—SoftServe architects compiled alist of technical debts in SS1. These technical debts wereof multiple types, and were detected by various tools andmethods, such as multiple code violations detected by Sonar,numbers of Todo and FIXME tags reported by Eclipse, lackof reusability detected by code reusability scenarios, etc. Wewere interested to understand if the architecture debt areas weidentified overlapped with the ones identified by the tools thatSoftServe employed.
The most recent version of the project that we analyzed con-tains 797 source files. The revision history that we studied cov-ers from July 2012 to May 2014. The project was maintainedby 6 full-time developers, but with sporadic contributions fromseveral dozen more developers. Over this nearly two-year timeperiod, there were 3262 commits as recorded by their versioncontrol system. There were 2756 issues recorded in their JIRAissue tracking system. Of these issues, 1079 of them werebug issues, and 1677 were about epics, improvements, stories,technical tasks, etc. Given the choice of SS1 as our subject,our case study prosecuted the following steps:
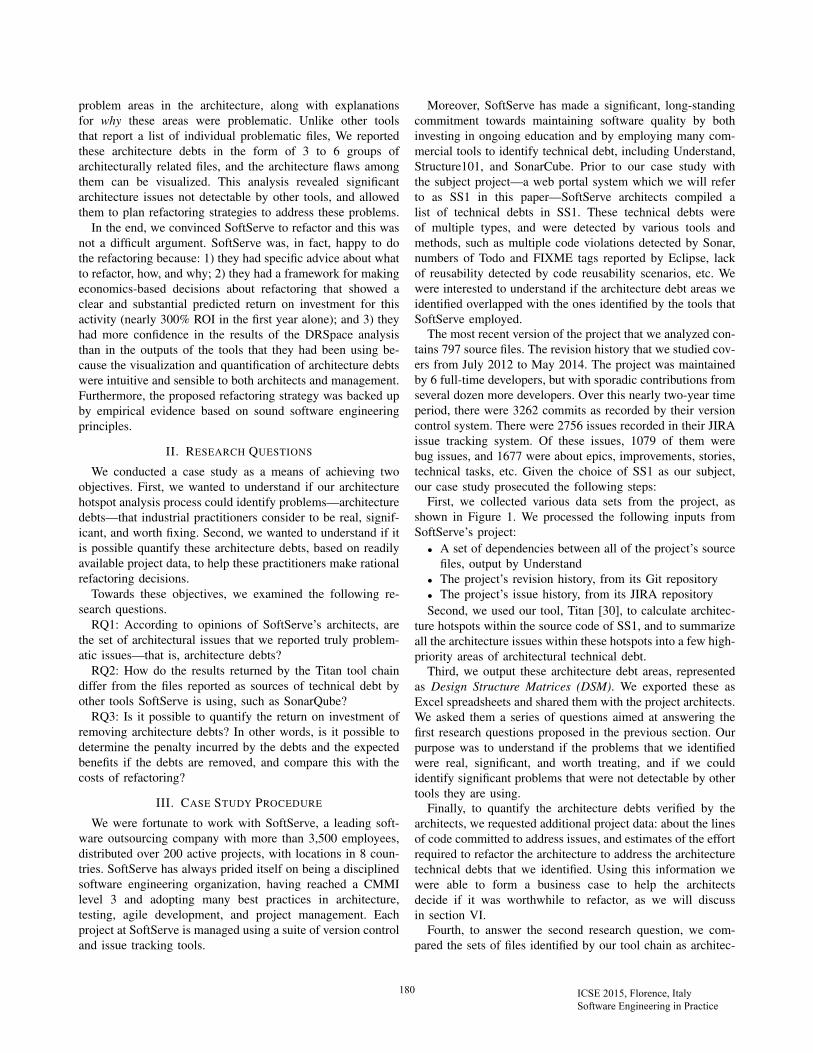
First, we collected various data sets from the project, asshown in Figure 1. We processed the following inputs fromSoftServe’s project:
• A set of dependencies between all of the project’s sourcefiles, output by Understand
• The project’s revision history, from its Git repository• The project’s issue history, from its JIRA repositorySecond, we used our tool, Titan [30], to calculate architec-
ture hotspots within the source code of SS1, and to summarizeall the architecture issues within these hotspots into a few high-priority areas of architectural technical debt.
Third, we output these architecture debt areas, representedas Design Structure Matrices (DSM). We exported these asExcel spreadsheets and shared them with the project architects.We asked them a series of questions aimed at answering thefirst research questions proposed in the previous section. Ourpurpose was to understand if the problems that we identifiedwere real, significant, and worth treating, and if we couldidentify significant problems that were not detectable by othertools they are using.
Finally, to quantify the architecture debts verified by thearchitects, we requested additional project data: about the linesof code committed to address issues, and estimates of the effortrequired to refactor the architecture to address the architecturetechnical debts that we identified. Using this information wewere able to form a business case to help the architectsdecide if it was worthwhile to refactor, as we will discussin section VI.
Fourth, to answer the second research question, we com-pared the sets of files identified by our tool chain as architec-
180180180 ICSE 2015, Florence, Italy Software Engineering in Practice
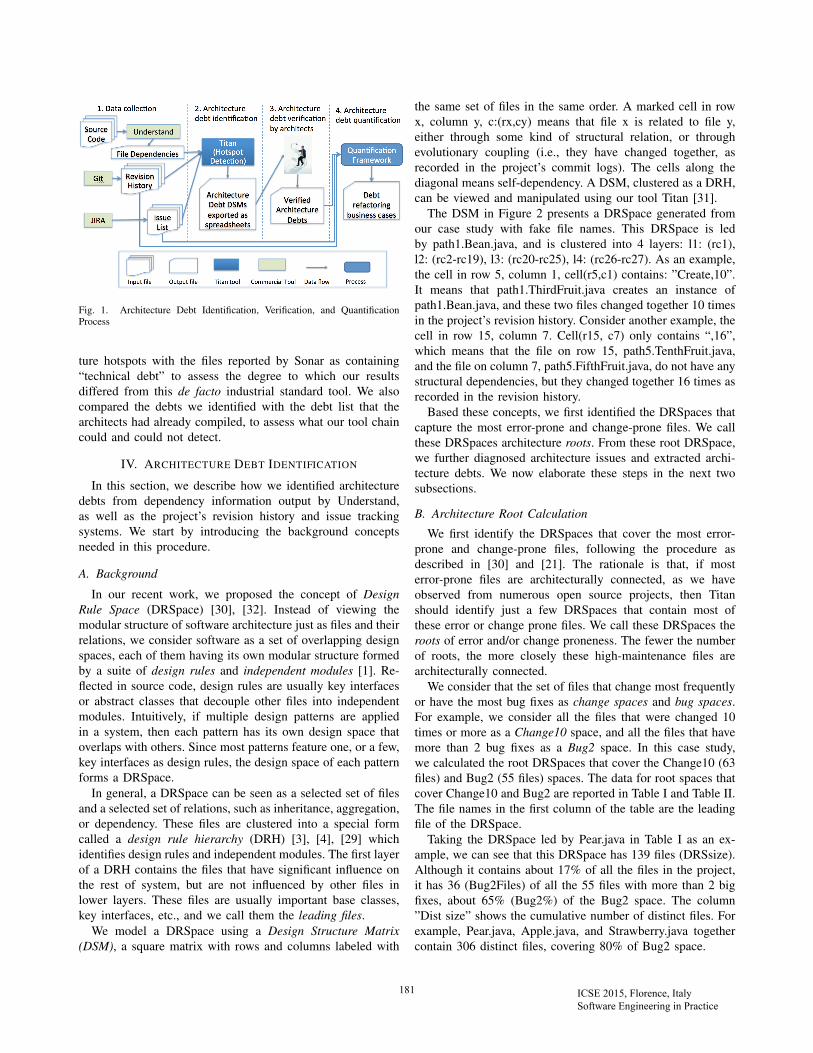
Fig. 1. Architecture Debt Identification, Verification, and QuantificationProcess
ture hotspots with the files reported by Sonar as containing“technical debt” to assess the degree to which our resultsdiffered from this de facto industrial standard tool. We alsocompared the debts we identified with the debt list that thearchitects had already compiled, to assess what our tool chaincould and could not detect.
IV. ARCHITECTURE DEBT IDENTIFICATION
In this section, we describe how we identified architecturedebts from dependency information output by Understand,as well as the project’s revision history and issue trackingsystems. We start by introducing the background conceptsneeded in this procedure.
A. Background
In our recent work, we proposed the concept of DesignRule Space (DRSpace) [30], [32]. Instead of viewing themodular structure of software architecture just as files and theirrelations, we consider software as a set of overlapping designspaces, each of them having its own modular structure formedby a suite of design rules and independent modules [1]. Re-flected in source code, design rules are usually key interfacesor abstract classes that decouple other files into independentmodules. Intuitively, if multiple design patterns are appliedin a system, then each pattern has its own design space thatoverlaps with others. Since most patterns feature one, or a few,key interfaces as design rules, the design space of each patternforms a DRSpace.
In general, a DRSpace can be seen as a selected set of filesand a selected set of relations, such as inheritance, aggregation,or dependency. These files are clustered into a special formcalled a design rule hierarchy (DRH) [3], [4], [29] whichidentifies design rules and independent modules. The first layerof a DRH contains the files that have significant influence onthe rest of system, but are not influenced by other files inlower layers. These files are usually important base classes,key interfaces, etc., and we call them the leading files.
We model a DRSpace using a Design Structure Matrix(DSM), a square matrix with rows and columns labeled with
the same set of files in the same order. A marked cell in rowx, column y, c:(rx,cy) means that file x is related to file y,either through some kind of structural relation, or throughevolutionary coupling (i.e., they have changed together, asrecorded in the project’s commit logs). The cells along thediagonal means self-dependency. A DSM, clustered as a DRH,can be viewed and manipulated using our tool Titan [31].
The DSM in Figure 2 presents a DRSpace generated fromour case study with fake file names. This DRSpace is ledby path1.Bean.java, and is clustered into 4 layers: l1: (rc1),l2: (rc2-rc19), l3: (rc20-rc25), l4: (rc26-rc27). As an example,the cell in row 5, column 1, cell(r5,c1) contains: ”Create,10”.It means that path1.ThirdFruit.java creates an instance ofpath1.Bean.java, and these two files changed together 10 timesin the project’s revision history. Consider another example, thecell in row 15, column 7. Cell(r15, c7) only contains “,16”,which means that the file on row 15, path5.TenthFruit.java,and the file on column 7, path5.FifthFruit.java, do not have anystructural dependencies, but they changed together 16 times asrecorded in the revision history.
Based these concepts, we first identified the DRSpaces thatcapture the most error-prone and change-prone files. We callthese DRSpaces architecture roots. From these root DRSpace,we further diagnosed architecture issues and extracted archi-tecture debts. We now elaborate these steps in the next twosubsections.
B. Architecture Root Calculation
We first identify the DRSpaces that cover the most error-prone and change-prone files, following the procedure asdescribed in [30] and [21]. The rationale is that, if mosterror-prone files are architecturally connected, as we haveobserved from numerous open source projects, then Titanshould identify just a few DRSpaces that contain most ofthese error or change prone files. We call these DRSpaces theroots of error and/or change proneness. The fewer the numberof roots, the more closely these high-maintenance files arearchitecturally connected.
We consider that the set of files that change most frequentlyor have the most bug fixes as change spaces and bug spaces.For example, we consider all the files that were changed 10times or more as a Change10 space, and all the files that havemore than 2 bug fixes as a Bug2 space. In this case study,we calculated the root DRSpaces that cover the Change10 (63files) and Bug2 (55 files) spaces. The data for root spaces thatcover Change10 and Bug2 are reported in Table I and Table II.The file names in the first column of the table are the leadingfile of the DRSpace.
Taking the DRSpace led by Pear.java in Table I as an ex-ample, we can see that this DRSpace has 139 files (DRSsize).Although it contains about 17% of all the files in the project,it has 36 (Bug2Files) of all the 55 files with more than 2 bigfixes, about 65% (Bug2%) of the Bug2 space. The column”Dist size” shows the cumulative number of distinct files. Forexample, Pear.java, Apple.java, and Strawberry.java togethercontain 306 distinct files, covering 80% of Bug2 space.
181181181 ICSE 2015, Florence, Italy Software Engineering in Practice
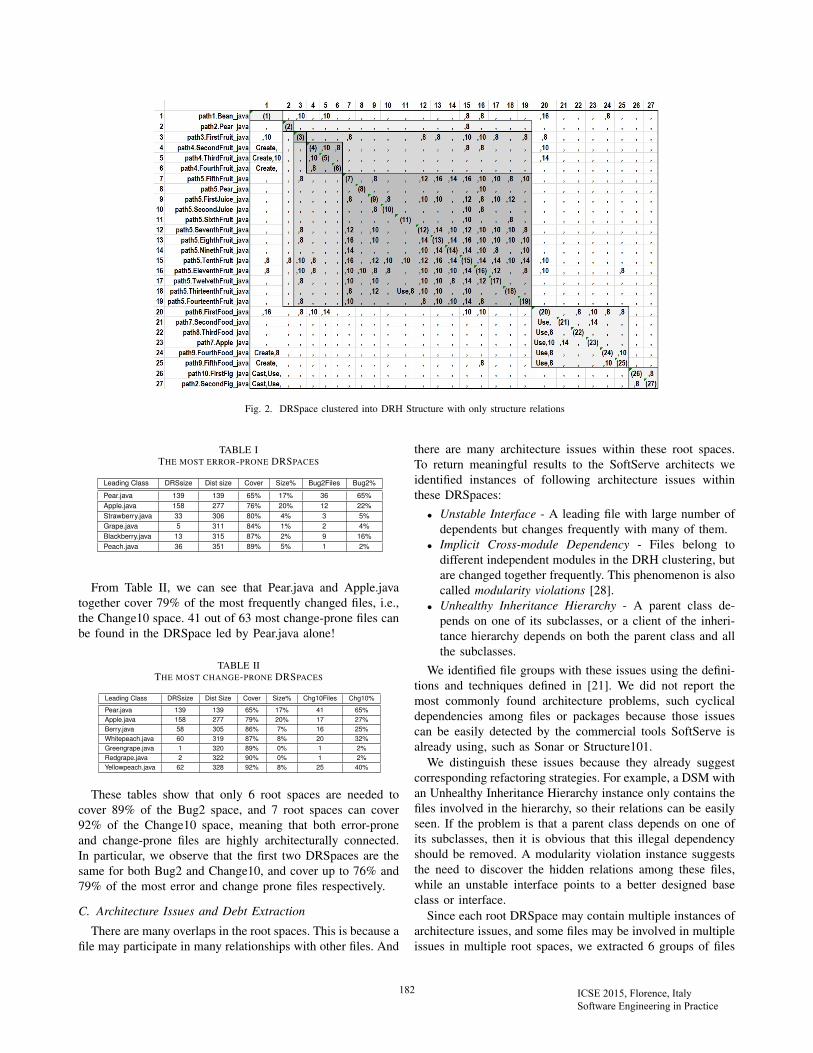
Fig. 2. DRSpace clustered into DRH Structure with only structure relations
TABLE ITHE MOST ERROR-PRONE DRSPACES
Leading Class DRSsize Dist size Cover Size% Bug2Files Bug2%
Pear.java 139 139 65% 17% 36 65%Apple.java 158 277 76% 20% 12 22%Strawberry.java 33 306 80% 4% 3 5%Grape.java 5 311 84% 1% 2 4%Blackberry.java 13 315 87% 2% 9 16%Peach.java 36 351 89% 5% 1 2%
From Table II, we can see that Pear.java and Apple.javatogether cover 79% of the most frequently changed files, i.e.,the Change10 space. 41 out of 63 most change-prone files canbe found in the DRSpace led by Pear.java alone!
TABLE IITHE MOST CHANGE-PRONE DRSPACES
Leading Class DRSsize Dist Size Cover Size% Chg10Files Chg10%
Pear.java 139 139 65% 17% 41 65%Apple.java 158 277 79% 20% 17 27%Berry.java 58 305 86% 7% 16 25%Whitepeach.java 60 319 87% 8% 20 32%Greengrape.java 1 320 89% 0% 1 2%Redgrape.java 2 322 90% 0% 1 2%Yellowpeach.java 62 328 92% 8% 25 40%
These tables show that only 6 root spaces are needed tocover 89% of the Bug2 space, and 7 root spaces can cover92% of the Change10 space, meaning that both error-proneand change-prone files are highly architecturally connected.In particular, we observe that the first two DRSpaces are thesame for both Bug2 and Change10, and cover up to 76% and79% of the most error and change prone files respectively.
C. Architecture Issues and Debt Extraction
There are many overlaps in the root spaces. This is because afile may participate in many relationships with other files. And
there are many architecture issues within these root spaces.To return meaningful results to the SoftServe architects weidentified instances of following architecture issues withinthese DRSpaces:
• Unstable Interface - A leading file with large number ofdependents but changes frequently with many of them.
• Implicit Cross-module Dependency - Files belong todifferent independent modules in the DRH clustering, butare changed together frequently. This phenomenon is alsocalled modularity violations [28].
• Unhealthy Inheritance Hierarchy - A parent class de-pends on one of its subclasses, or a client of the inheri-tance hierarchy depends on both the parent class and allthe subclasses.
We identified file groups with these issues using the defini-tions and techniques defined in [21]. We did not report themost commonly found architecture problems, such cyclicaldependencies among files or packages because those issuescan be easily detected by the commercial tools SoftServe isalready using, such as Sonar or Structure101.
We distinguish these issues because they already suggestcorresponding refactoring strategies. For example, a DSM withan Unhealthy Inheritance Hierarchy instance only contains thefiles involved in the hierarchy, so their relations can be easilyseen. If the problem is that a parent class depends on one ofits subclasses, then it is obvious that this illegal dependencyshould be removed. A modularity violation instance suggeststhe need to discover the hidden relations among these files,while an unstable interface points to a better designed baseclass or interface.
Since each root DRSpace may contain multiple instances ofarchitecture issues, and some files may be involved in multipleissues in multiple root spaces, we extracted 6 groups of files
182182182 ICSE 2015, Florence, Italy Software Engineering in Practice
(95 distinct files in total) with the least overlaps and the mostprominent type of architecture issues, and returned these toSoftServe as possible architecture debts. The 6 file groupscontained 3 instances of improper inheritance with 6, 3, and7 files respectively. The small sizes of these issue instancesindicate that inheritance is not a major architecture problem.
The other 3 instances included one modularity violationgroup with 27 files, and two instances of Unstable Interfaceissues, involving 26 and 52 files respectively. The DSM ofthe modularity violation instance is shown in Figure 2. ThisDSM reveals that although these files have very few structuredependencies (only 13 out of 729 pairs of files have structuralrelations), they changed together very often, indicating theexistence of strong implicit dependencies among these files.
V. ARCHITECTURE DEBT VERIFICATION
To investigate if the 6 file groups reveal true architectureissues that are considered significant and worth treating, weexported their 6 DSMs into spreadsheets and returned themto the SoftServe architects as possible architecture hotspots(potential architecture debts) for them to verify. We alsocompared the files within these 6 DSMs with technical debtfiles reported by Sonar for further analysis.
A. Debt Verification by SoftServe ArchitectsWe returned these architecture debt candidates to our col-
laborators along with the following questions:Q1: For each instance, is this a real design/architecture
problem with significant maintenance costs? If yes, do youplan to refactor and fix the issues in them?
Except for one improper inheritance instance with 7 files,the architect confirmed that all other instances were realarchitecture issues. They agreed that two of the improperinheritance instances indeed revealed that these files were over-designed. Since these instances have small numbers of files,and thus limited maintenance costs, we focused on the otherthree bigger architecture issue instances, and refactoring thesethree instances has been planned.
Q2: Are there any issues we identified but which were notrevealed by other tools in use?
The architect pointed out that the modularity violationinstances we identified (Figure 2) revealed deep problems thatwere not detectable by other tools. It revealed a poor designdecision that caused large number of co-changes among largenumber of seemingly unrelated files.
When one of the Unstable Interface instances was reported,our collaborators realized that the interface file leading thisDRSpace, Pear.java was overly complex, turning into a Godinterface, and recognized that Divide-and-conquer would bethe proper strategy to refactor this DRSpace.
The feedback from the architect is extremely encouraging.Since we have reported these architecture issues, they havespent much effort devising strategies to address these debts. Aswe will show, we were also able to extract more detailed datato quantify the cost and benefits, making it possible to makea business case targeting at the refactoring of these localizedhotspots.
B. Debt Comparison
The most significant difference between our approach andthat of other technical debt detection tools, such as Sonar, isthat, we identify debts as architecturally related groups (inour current case study, we reported 3 major file groups). Weuse DSMs to visualize the architecture problems linking thesefiles together, indicating how defects may propagate betweenthem. Sonar reports a list of files, without showing the relationsamong them. Although the architecture issue instances weidentified have been confirmed by SoftServe architects, wewere curious to know whether the files comprising thesearchitecture issue instances could be found by Sonar.
We only compared with Sonar, since it is the de factoindustrial standard for detecting technical debt. SoftServe alsoused other methods to identify other types of technical debt,like checking the “Todo” comments in source code, but wedon’t consider those as comparable to architecture debts. Wechose the three most common metrics used by Sonar tofind files in debt: lines of code, McCabe complexity, andduplicated lines. These metrics were also used by SoftServeto identify technical debts, prior to this case study. In atechnology assessment report created before our interactionwith SoftServe, they listed their 21 “fattest” (most complex)files. These files, reported by Sonar, were “considered asrefactoring priority candidates” by SoftServe. But their reportdid not show the relations among these fattest files, nor theirimpact scope.
Our purpose is to understand (1) whether files reported bySonar also suffer from architecture issues, and (2) whetherhigh-maintenance files have been missed by just detecting filesinvolved in architecture hotspots. For Sonar, we took the top10 percentile most complex files (LOC or McCabe), as wellas the top 10 percentile files with the most duplicated lines,and took the union of these sets to form a final set of 98files as the debts identified by Sonar. We compared these 98files (which we call SonarDebts) with the 95 files (TitanDebts)that we reported to SoftServe as being directly implicated inarchitecture issues.
We first compare the precision and recall of both of thesefile sets against the Bug2 (55 files) and Change10 (63 files)spaces. The Bug2 and Change10 file sets served as the “oracle”for this study, since these are the ground truth set of files thatare causing problems in the project. Our reasoning is that, themore files detected by a technique that are truly error-prone orchange-prone (high precision), and the more high-maintenancefiles that are detected (high recall), the more effective thetechnique is. The result of this study showed that the precisionof TitanDebts is 31% vs. 18% for SonarDebts using Bug2 asthe oracle, and 40% for vs. 27% using change10 as the oracle.The recall of TitanDebts vs. SonarDebts is 53% vs. 33% forBug2, and 60% vs. 41% for Change10. These data indicatethat Titan consistently performs better, in terms of capturingthe most error-prone and change-prone files.
The precision of any single technical identification tech-nique is likely to be low, because files might be buggy or
183183183 ICSE 2015, Florence, Italy Software Engineering in Practice
change-prone for a number of reasons: because of architecturalcomplexity, because of code complexity, or because of inherentdomain complexity. For TitanDebt, not all files involved in ar-chitecture issues have high maintenance costs; for SonarDebt,not all files that are complex are necessarily error-prone orbug-prone. In addition, the precision numbers reported hereare low because of the small sizes of Bug2 and Change10.Precision is a measure of what fraction of the retrieved resultsare relevant. Since the Bug2 and Change10 sets are smallerthan SonarDebts and TitanDebts (due to the relatively shortproject history that we were considering) the highest possibleprecision value for Bug2 would be about 57% and the highestprecision value for Change10 would be 66%.
Next we examined the overlap between TitanDebts andSonarDebts. There are 25 files found in the intersection ofTitanDebts and SonarDebts. These 25 files are undoubtedly themost problematic ones in the project: they are both complexand architecturally problematic. The fact that the intersectionsof these two sets only have about 1/4 of their total numberof files indicates that Sonar and Titan detect substantiallydifferent, and complementary, sets of files.
In summary, from this comparative analysis we can observethat the architecture instances we detected capture file groupswith higher error-proneness and change-proneness than whatSonar captured. In addition, a significant portion of the fileswith severe, high-maintenance architecture issues, detected byour tool, are missed by Sonar. We are not aware of any othertools that can detect those files, together with their visualizablearchitecture issues.
VI. ARCHITECTURE DEBT QUANTIFICATION
Now that the 3 instances of architecture issues are verifiedto be true architecture debts, the architect at Softserve needs toestimate the economic consequences of these debts, to makedecisions regarding to whether it is worthwhile to refactor.We first need to determine the scope of the debts. That is,how many files are influenced by these architecture flaws?Since each DRSpace contains all the files that are directly andindirectly impacted by the leading files, the scope of the 3architecture debts should be the DRSpaces led by the leadingfiles of these instances. In this case study, the scope shouldbe all the 291 distinct files contained in 3 DRSpaces led byPear.java, Apple.java, and Bean.java.
Next we need to quantify the unit of “effort” or “cost”.Here we needed to make some assumptions and collect projectdata based on those assumptions. Like most industrial projects,effort data was not carefully collected, and was not associatedwith file-level work. So while our DRSpaces technique wasbased on the file as the most basic unit of analysis, we couldnot collect true effort data on a per-file basis.4 For this reason
4We have assumed, for the purposes of our analysis, that the ratio of filesto classes is 1:1. This has broadly held true for the 30 or so systems that wehave analyzed to this point. If, for some reason, a project deviated from thisconvention, we could simply normalize the counts of defects, changes, andlines of code, to account for a different ratio.
we chose to collect other types of file-level data that wereavailable:
• number of resolved defects per file• number of completed changes per file• number of modified/added/deleted lines of code per file,
to fix defects and make changes
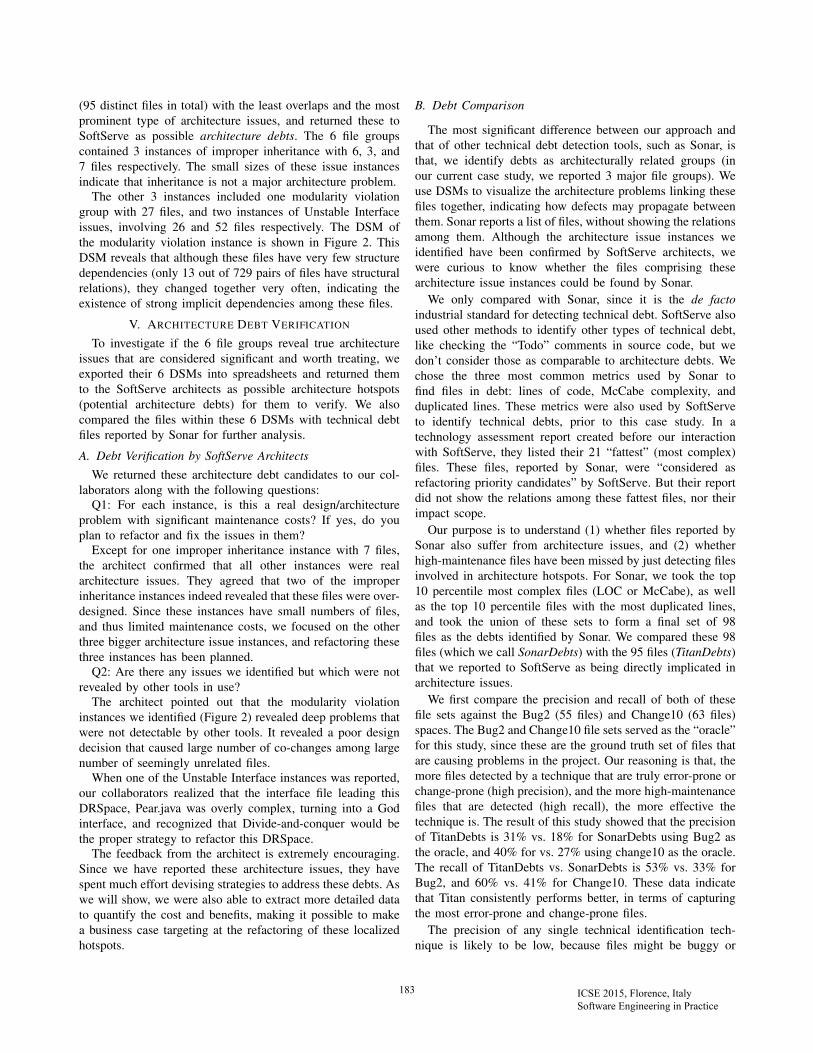
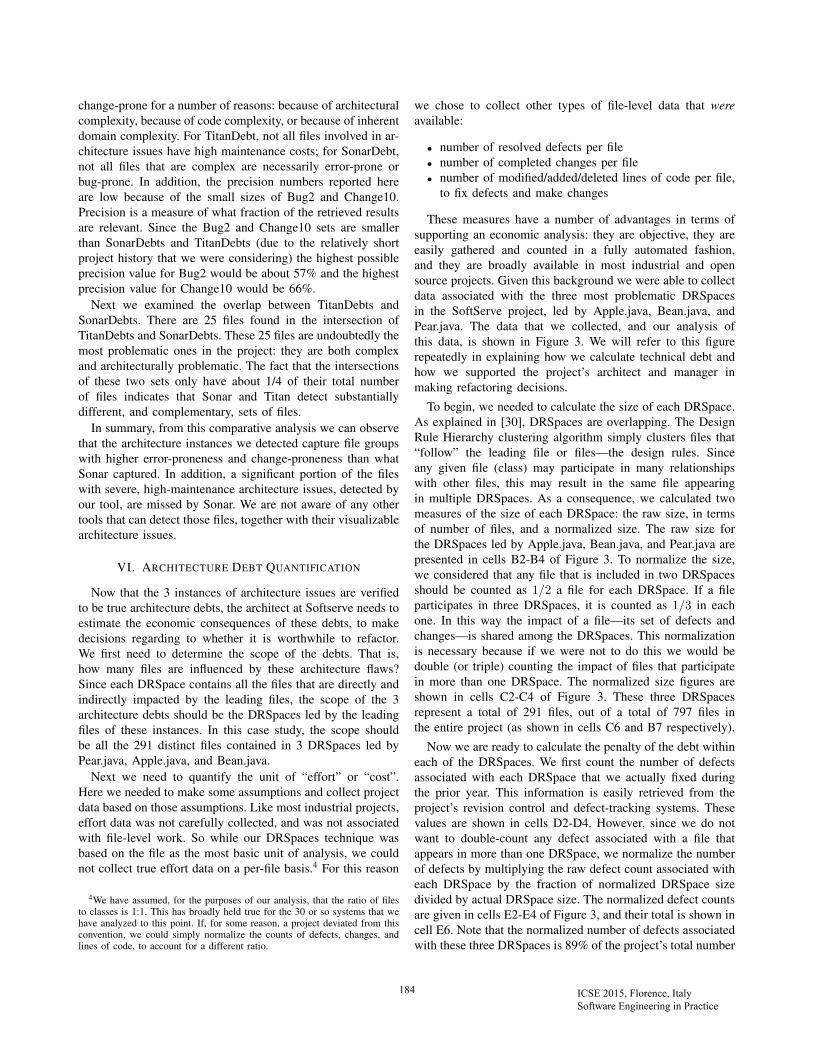
These measures have a number of advantages in terms ofsupporting an economic analysis: they are objective, they areeasily gathered and counted in a fully automated fashion,and they are broadly available in most industrial and opensource projects. Given this background we were able to collectdata associated with the three most problematic DRSpacesin the SoftServe project, led by Apple.java, Bean.java, andPear.java. The data that we collected, and our analysis ofthis data, is shown in Figure 3. We will refer to this figurerepeatedly in explaining how we calculate technical debt andhow we supported the project’s architect and manager inmaking refactoring decisions.
To begin, we needed to calculate the size of each DRSpace.As explained in [30], DRSpaces are overlapping. The DesignRule Hierarchy clustering algorithm simply clusters files that“follow” the leading file or files—the design rules. Sinceany given file (class) may participate in many relationshipswith other files, this may result in the same file appearingin multiple DRSpaces. As a consequence, we calculated twomeasures of the size of each DRSpace: the raw size, in termsof number of files, and a normalized size. The raw size forthe DRSpaces led by Apple.java, Bean.java, and Pear.java arepresented in cells B2-B4 of Figure 3. To normalize the size,we considered that any file that is included in two DRSpacesshould be counted as 1/2 a file for each DRSpace. If a fileparticipates in three DRSpaces, it is counted as 1/3 in eachone. In this way the impact of a file—its set of defects andchanges—is shared among the DRSpaces. This normalizationis necessary because if we were not to do this we would bedouble (or triple) counting the impact of files that participatein more than one DRSpace. The normalized size figures areshown in cells C2-C4 of Figure 3. These three DRSpacesrepresent a total of 291 files, out of a total of 797 files inthe entire project (as shown in cells C6 and B7 respectively).
Now we are ready to calculate the penalty of the debt withineach of the DRSpaces. We first count the number of defectsassociated with each DRSpace that we actually fixed duringthe prior year. This information is easily retrieved from theproject’s revision control and defect-tracking systems. Thesevalues are shown in cells D2-D4. However, since we do notwant to double-count any defect associated with a file thatappears in more than one DRSpace, we normalize the numberof defects by multiplying the raw defect count associated witheach DRSpace by the fraction of normalized DRSpace sizedivided by actual DRSpace size. The normalized defect countsare given in cells E2-E4 of Figure 3, and their total is shown incell E6. Note that the normalized number of defects associatedwith these three DRSpaces is 89% of the project’s total number
184184184 ICSE 2015, Florence, Italy Software Engineering in Practice
Fig. 3. Technical Debt Calculation Framework
of defects (which is 265), even though the normalized size ofthese DRSpaces—291—is just under 37% of the entire project.
Similarly we count the total number of changes affectingthe files in the three DRSpaces over the past year, and wenormalize these as we normalized the numbers of file anddefects. The raw numbers of changes are shown in cells F2-F4, and the normalized values are given in G2-G4. Note thatthe total normalized number of changes affecting Apple.java,Bean.java, and Pear.java is 1498, or about 2/3 of the projecttotal of 2332. This is consistent with our prior research, wherecomplex, problematic DRSpaces account for far more thantheir share of defects and changes, and require many morelines of code to modify and fix than average project files [21],[30].
Finally we show the number of lines of code committed tofix the defects and to make the changes for the files in thesethree DRSpaces over the past year. The raw numbers of linesof code are given in I2-I4 and the normalized values are givenin J2-J4.
Another key parameter needed to make refactoring decisionsis the cost of refactoring. The chief architect of the SoftServesystem agreed that not only are these DRSpaces problematic,but also agreed that the architectural flaws that we identifiedwere indeed design problems, violating standard rules of gooddesign such as the Law of Demeter, the Open/Closed principle,and so forth. Using the architectural flaws as a guide, a setof refactorings were determined and the chief architect madeeffort estimates for each of these refactoring efforts. Theseeffort estimates, in person months (PM) are shown in cellsK2-K4 of Figure 3 (highlighted in orange). The total effortfor the refactorings is given in cell K7.
We have thus far calculated the “penalty” being incurred bythese three DRSpaces, as a result of their architectural flaws,and the chief architect has estimated the cost to refactor theseDRSpaces. Now we turn to the issue of estimating the benefitthat we expect to accrue from this refactoring.
We used, as a basis for the estimate, existing projectaverages, shown in cells B11-B13. An average file in thisproject is subjected to 0.33 defects annually (i.e., there were265 defects affecting a total of 797 files) and 2.9 changes
annually (i.e. 2332 changes over 797 files), requiring 169.95lines of code to resolve (there were a total of 135,453 linesof code committed for the project’s 797 files).
Our assumption is that the refactoring of the three DRSpaceswill bring them down to project averages. This is, we feel,a very conservative assumption for two reasons: 1) the cur-rent project averages already include these flawed DRSpaces,which inflates the averages, and 2) it is likely that therefactoring could result in much better structure than theproject average, since the average project file has not beenrefactored. Thus the refactoring could conceivably result inlower defects, changes, and committed lines of code for thesethree DRSpaces. For these reasons we feel that using existingproject averages as our “target” for improvement is veryconservative. Our follow-on longitudinal study will allow usto test the validity of this assumption.
Based on this assumption, we can now calculate the ex-pected benefit from the refactoring these three DRSpaces.Cells L2-L4 list the expected numbers of defects that wouldaffect each of the problematic DRSpaces—34, 34, and 10—assuming that the refactoring brought them down to projectaverages. Similarly cells M2-M4 and N2-N4 show the nor-malized, expected numbers of changes and committed linesof code under the same assumption—that the refactoredDRSpaces exhibit project average behaviors. The totals forthe expected numbers of defects, changes, and lines of codeare presented in cells L6, M6, and N6.
Now we are in a position to calculate the expected benefitfrom these refactorings. The benefit is the difference betweenthe actual annual numbers of defects, changes, and committedlines of code and the expected numbers of defects, changes,and committed lines of code. These expected “savings” aregiven in cells L8, M8, and N8. Let us ignore the loss oftime and reputation due to bugs that are avoided (L8) andfocus purely on the lines of code that we expect the projectwill not have to commit, due to the refactoring (N8). Theproject can conservatively expect to save 24,808 lines ofcode by refactoring the three problematic DRSpaces. Now wetake company average productivity numbers and using this tocalculate the expected person months of effort avoided as a
185185185 ICSE 2015, Florence, Italy Software Engineering in Practice
result of the refactorings. This savings is shown in cell N12.The project can expect to save 41.35 person months of effortper year due to the proposed refactorings. Given that theserefactorings are estimated to cost just 14 person months ofeffort, the investment in refactoring is paid off in less than 1/2year and the project experiences a net benefit thereafter. Or, toput it in financial terms, the project can expect a 295% returnon investment in the first year alone.
This is, to our knowledge, the first time that the penaltyassociated with technical debt, the cost of refactoring toremove that debt, and the expected benefits of removing thedebt have been quantified based on hard data—project-specificempirical evidence. Of course, there are assumptions wrappedup in the estimates, but this is true of any financial estimatesin any field. These assumptions are supported by our priorresearch, but they are assumptions nonetheless. As we collectmore data we will be able to report on the validity and stabilityof these assumptions.
VII. RESULTS AND LESSONS LEARNED
Now we are in a position to answer the research questionsthat we posed in section II.
Regarding RQ1: According to the opinions of the Soft-Serve’s architects, the set of architectural issues that wereported to SoftServe were truly problematic. They often had avague idea that a region of the architecture was “troublesome”or “hard to maintain”, but they were unable to preciselyidentify the problems and their scope.
Regarding RQ2, the results returned by the Titan tool chaindid differ significantly from the files reported as sources oftechnical debt by SonarQube. The precision and recall of Titanoutperformed that of Sonar by 50% or more, when comparedwith Bug2 and Change10.
Finally, we feel that the answer to RQ3 was perhaps themost important outcome of this case study. It is indeed possibleto quantify the return on investment of removing architecturedebts. We were able to mine project data to estimate thepenalty incurred by the debts (hotspots) identified by Titan,and to calculate the expected benefits if the debts are removed.When we compared this with the costs of refactoring it madea compelling argument for SoftServe’s management, whoimmediately chose to refactor the system in the areas weidentified.
What have we learned, having worked through this processwith an industrial partner? We have gathered several importantlessons.
The first, and perhaps most important lesson is that the anal-ysis we did here was not remarkable; it is easily repeatable. Itdoes not depend on the skills of the analyst; it simply dependson having the appropriate input data. The good news is thatmost projects have enough data to make this determination:that is, they have source code that can be reverse engineered toextract file dependencies, they have revisions control systemsthat show which files were committed and how many linesof code were modified, and they have issue tracking systemsthat show and classify the reported project defects and change
or feature requests. What not all projects have is the abilityto trace among these project records. If the project does nothave the discipline to always associate a commit with anissue number from the issue-tracking system then we can nottrace from file to commit to bug or change. Thus, one of ourlessons learned is that we can influence projects to improvetheir record-keeping practices. We can influence them becausewe can show them how such tiny and inexpensive changes intheir processes can result in greater insight into the sources ofproject technical debt.
The second important lesson that we learned is that technicaldebt can arise from a variety of sources, and no single tool orapproach is going to find all of them. Code-based approacheswill tend to find one class of problems, dealing with (notsurprisingly) code-level issues—poor code structure, repeatedlines, lack of comments, and so forth. But another importantsource of technical debt comes from architectural problemsand the code-based analysis tools do not find this debt.
The third (related) lesson that we learned from the project,and also from many other interviews with practicing architectsis that architectural technical debt is extremely common.Like rust, it never sleeps; it just accumulates in projects,unless some conscious refactoring effort is made. This isbecause architectural debt is extremely easy to introduce, andextremely difficult for a programmer to discern. A programmertypically wants to fix a bug or introduce some new featureor function. In doing so they create new classes, modifyexisting classes, add relationships between existing classes,and so forth. Some of these changes inevitably underminethe architectural structure, even if this structure was notconsciously described. The structure slowly becomes morecomplex, more highly coupled, less cohesive. Unfortunately,refactorings to fix these debts are seldom made because thearchitects typically do not know: 1) how to locate the debts,and 2) how to create a business case that presents compellingevidence for the value of refactoring. By arming SoftServe’sarchitects with such information they were able to make acompelling business case which was immediately accepted andacted upon.
VIII. RELATED WORK
Our work is related to the work of technical debt detection,architecture analysis, and defect localization and prediction.
a) Technical Debt Detection: To locate technical debtin code, a number of heuristics have been proposed. Theseheuristics attempt to identify characteristic problems in code—such as clones, long methods, and god classes—that can bedetected by code analysis tools such as SonarQube. But notall of these code problems are certain to cause maintenanceor quality problems. In fact, no existing work has been ableto accurately locate the sources and estimate the magnitude oftechnical debt. For example, Zazworka et al. [33], comparedfour different technical debt detection approaches and foundthat only a subset of the debt detected by the four approacheswere strongly correlated with software changes and defectproneness.
186186186 ICSE 2015, Florence, Italy Software Engineering in Practice
The concept of a “bad smell” was first proposed in 1999 as aheuristic for identifying redesign and refactoring opportunities[7]. Code clones and feature envy were examples of smellsproposed in this work. Others [9] have extended this notionto include architecture-level bad smells. But to detect debtefficiently, the approach must be automatable. For example,Moha et al. [22] created the Decor tool to automate thecreation of design defect detection algorithms. In addition,some research has proposed automatically detecting bad smellsthat suggest refactorings. For example, Tsantalis and Chatzi-georgiou’s static slicing approach [27] aims to detect extractmethod refactoring opportunities. In addition, some commonsmells, such as code clones, have been extensively studied,such as Higo et al. [12]’s Aries tool to identify code clonesas candidates for refactoring.
Our architecture debt detection approach, however, is differ-ent. First, our approach focuses on the structure among files,rather than the internal problems within a file. Not all filesinvolved in architecture issues have bad smells. Second, exist-ing research on bad smells has always focused on analyzing asingle version of the software, while our approach examinesthe project’s evolution history. We can thus focus on the mostrecent and most frequently occurring architecture problems,and detect architecture issues that can only be exposed duringevolution, such as Implicit Cross-module Dependency andUnstable Interfaces. Neither can be detected by examining asingle version of a code base.
b) Architecture Representation and Analysis: The groundtruth of the architecture of a software project is usually difficultto acquire; architecture documentation is rarely up-to-date oraccurate. A software system contains multiple architecturalstructures that may be documented as views [2], [6], [18].But the views proposed in prior work are general-purpose. Tolocate and diagnose specific modularity debt, we need to focuson just a single architecture view—the module view. Withinthe module view DRSpaces are organized based on designrules and independent modules.
Methods supporting the analysis of architecture have beenwidely studied. The majority of architecture analysis methodscreated to date have either focused on questionnaires [20]or scenarios [14], [16]. For example, Kazman et al. [16]created the Architecture Tradeoff Analysis Method (ATAM)for analyzing architectures. This was extended with the CostBenefit Analysis Method (CBAM) [15], [24] so that thetechnical analysis of an ATAM could be informed by the costsand benefits of proposed architectural strategies, as a meansof determining an optimal project evolution path. Andrew [17]proposed anti-patterns to represent recurring problems thatare harmful to software systems. These methods are man-ual, and depend heavily on the skills of highly trained andexperienced architecture analysts. Our approach, by contrast,detects architecture issues automatically and can guide theuser, helping them to locate and diagnose software qualityproblems. Furthermore, we assist the user in analyzing theeconomic consequences of these problems and their repairs.
And this analysis requires only project data that is easilyavailable.
c) Defect Localization and Prediction: Numerous workhas been proposed to locate and predict software defects usingdependency relation, history, or metrics [11], [13], [19]. Selbyand Basili [26] first explored the relation between dependencystructures and software defects. The relation between evolu-tionary coupling and error-proneness has also been extensivelystudied [5], [8], [10]. Cataldo et al.’s [5] reported a strongcorrelation between change coupling density and failure prone-ness. Ostrand et al. [25] demonstrated that file change historycan be used to effectively predict defects. Nagappan et al. [23]used complexity metrics to predict defects, but admitted thatin different projects, the best metrics for prediction can bedifferent. Different from these prior work that all focus onindividual files as the unit of analysis, our approach revealsarchitecture flaws that propagate errors among files.
IX. CONCLUSIONS AND FUTURE WORK
Our case study with SoftServe has confirmed our researchhypotheses: we are able to locate the architectural sources oftechnical debt, quantify them, and quantify the expected pay-back for refactoring these debts. We did this based solely ondata that was already available within SoftServe. The evidencethat we produced and the arguments that we made based onthis evidence were compelling to SoftServe’s management,who immediately decided to invest in the proposed refac-torings. One might object that these estimates are just that–estimates. However, all decision-making in business involvesinvestment under uncertainty. And even if our ROI estimate isoff by an order of magnitude—that is, if it was merely a 30%ROI—it still represents an excellent choice for the company,which presumably can not earn such a high ROI through anytraditional means.
Our future work consists of a longitudinal study wherein wedo four things: First, we will track the architectural integrityof this system on a regular basis. That is, we plan to analyzeperiodic snapshots of SoftServe’s system, to see whether therefactoring is being done correctly, and whether it is erodingover time. Second, we plan to continue to track the frequencyof reported defects, and their connection to the files in SS1.Third we plan to continue to track the frequency of changesto the files of SS1. Finally, we plan to track the lines ofcode committed to fix defects and to make changes. Thislongitudinal data capture and analysis will allow us to validatethe expectations and opinions collected in the present study,and to build better predictive models for SoftServe in thefuture. We are also in the process of conducting other industrialcase studies, to show the repeatability of our methods indifferent industrial contexts.
In addition, we would like to examine the background trendsof the data in future work. For example, are bug rates, changerates, and churn level, going up, or going down in the project,irrespective of any intervention?
For now, SoftServe is very happy with the outcomes and istaking all necessary steps to refactor their architecture to fix
187187187 ICSE 2015, Florence, Italy Software Engineering in Practice
the defects that our Titan tool has highlighted. The SoftServearchitects felt that Titan provided insights, supporting dataand, (most important) explanations that no other analysistool had hitherto provided. These insights accorded with theirexperience of the system, and supported their intuitions aboutthe problems with its architecture. But, more importantly,the combination of project-data-driven economic argumentsand evidence-based identification of technical debts was com-pelling for SoftServe’s architects and they plan to pursue thisstrategy with other systems right away.
ACKNOWLEDGMENTS
This work was supported in part by the National ScienceFoundation of the US under grants CCF-0916891, CCF-1065189, CCF-1116980 and DUE-0837665.
This material is based upon work funded and supported bythe Department of Defense under Contract No. FA8721-05-C-0003 with Carnegie Mellon University for the operation ofthe Software Engineering Institute, a federally funded researchand development center. This material has been approved forpublic release and unlimited distribution. DM-0002092
REFERENCES
[1] C. Y. Baldwin and K. B. Clark. Design Rules, Vol. 1: The Power ofModularity. MIT Press, 2000.
[2] L. Bass, P. Clements, and R. Kazman. Software Architecture in Practice.Addison-Wesley, 3rd edition, 2012.
[3] Y. Cai and K. J. Sullivan. Modularity analysis of logical design mod-els. In Proc. 21st IEEE/ACM International Conference on AutomatedSoftware Engineering, pages 91–102, Sept. 2006.
[4] Y. Cai, H. Wong, S. Wong, and L. Wang. Leveraging design rules toimprove software architecture recovery. In Proc. 9th International ACMSigsoft Conference on the Quality of Software Architectures, pages 133–142, June 2013.
[5] M. Cataldo, A. Mockus, J. A. Roberts, and J. D. Herbsleb. Softwaredependencies, work dependencies, and their impact on failures. IEEETransactions on Software Engineering, 35(6):864–878, July 2009.
[6] D. Falessi, G. Cantone, R. Kazman, and P. Kruchten. Decision-makingtechniques for software architecture design: A comparative survey. ACMComputing Surveys, 43(4):1–28, Oct. 2011.
[7] M. Fowler. Refactoring: Improving the Design of Existing Code.Addison-Wesley, July 1999.
[8] H. Gall, K. Hajek, and M. Jazayeri. Detection of logical coupling basedon product release history. In Proc. 14th IEEE International Conferenceon Software Maintenance, pages 190–197, Nov. 1998.
[9] J. Garcia, D. Popescu, G. Edwards, and N. Medvidovic. Identifyingarchitectural bad smells. In Proc. 13th European Conference on SoftwareMaintenance and Reengineering, pages 255–258, Mar. 2009.
[10] T. L. Graves, A. F. Karr, J. S. Marron, and H. P. Siy. Predicting faultincidence using software change history. IEEE Transactions on SoftwareEngineering, 26(7):653–661, 2000.
[11] N. Gupta, H. He, X. Zhang, and R. Gupta. Locating faulty codeusing failure-inducing chops. In Proc. 20th IEEE/ACM InternationalConference on Automated Software Engineering, pages 263–272, 2005.
[12] Y. Higo, T. Kamiya, S. Kusumoto, and K. Inoue. Refactoring supportbased on code clone analysis. In Proc. 5th International Conferenceon Product Focused Software Development and Process Improvement,pages 220–233, Apr. 2004.
[13] J. A. Jones, M. J. Harrold, and J. Stasko. Visualization of testinformation to assist fault localization. In Proc. 24thInternationalConference on Software Engineering, 2002.
[14] R. Kazman, G. Abowd, L. Bass, and M. Webb. Saam: A methodfor analyzing the properties of software architectures. In Proc. 16thInternational Conference on Software Engineering, pages 81–90, May1994.
[15] R. Kazman, J. Asundi, and M. Klein. Quantifying the costs and benefitsof architectural decisions. In Proc. 23rd International Conference onSoftware Engineering, pages 297–306, May 2001.
[16] R. Kazman, M. Barbacci, M. Klein, S. J. Carriere, and S. G. Woods.Experience with performing architecture tradeoff analysis. In Proc. 16thInternational Conference on Software Engineering, pages 54–64, May1999.
[17] A. Koenig. Patterns and antipatterns. The patterns handbooks, 1998.[18] P. B. Kruchten. The 4+1 view model of architecture. IEEE Software,
12:42–50, 1995.[19] C. Liu, X. Yan, L. Fei, J. Han, and S. P. Midkiff. Sober: statistical
model-based bug localization. In 13rd ACM SIGSOFT InternationalSymposium on the Foundations of Software Engineering, 2005.
[20] J. Maranzano, S. Rozsypal, G. Zimmerman, G. Warnken, P. Wirth, andD. Weiss. Architecture reviews: Practice and experience. IEEE Software,22:34–43, 2005.
[21] R. Mo, Y. Cai, R. Kazman, and L. Xiao. Hotspot patterns: Theformal definition and automatic detection of recurring high-maintenancearchitecture issues. In Submission, 2014.
[22] N. Moha, Y.-G. Gueheneuc, A.-F. Le Meur, and L. Duchien. A domainanalysis to specify design defects and generate detection algorithms.In Proc. 11th International Conference on Fundamental Approaches toSoftware Engineering, pages 276–291, Mar. 2008.
[23] N. Nagappan, T. Ball, and A. Zeller. Mining metrics to predictcomponent failures. In Proc. 28th International Conference on SoftwareEngineering, pages 452–461, 2006.
[24] R. Nord, M. Barbacci, P. Clements, R. Kazman, M. Klein, L. O’Brien,and J. Tomayko. Integrating the archi-tecture tradeoff analysis method(atam) with the cost benefit analysis method (cbam). Technical ReportCMU/SEI-2003-TN-038, Carnegie Mellon University/SEI, 2003.
[25] T. J. Ostrand, E. J. Weyuker, and R. M. Bell. Predicting the locationand number of faults in large software systems. IEEE Transactions onSoftware Engineering, 31(4):340–355, 2005.
[26] R. W. Selby and V. R. Basili. Analyzing error-prone system structure.IEEE Transactions on Software Engineering, 17(2):141–152, Feb. 1991.
[27] N. Tsantalis and A. Chatzigeorgiou. Identification of move methodrefactoring opportunities. IEEE Transactions on Software Engineering,35(3):347–367, May 2009.
[28] S. Wong and Y. Cai. Improving the efficiency of dependency analysisin logical models. In Proc. 24th IEEE/ACM International Conferenceon Automated Software Engineering, pages 173–184, Nov. 2009.
[29] S. Wong, Y. Cai, G. Valetto, G. Simeonov, and K. Sethi. Designrule hierarchies and parallelism in software development tasks. InProc. 24th IEEE/ACM International Conference on Automated SoftwareEngineering, pages 197–208, Nov. 2009.
[30] L. Xiao, Y. Cai, and R. Kazman. Design rule spaces: A new form ofarchitecture insight. In Proc. 36th International Conference on SoftwareEngineering, 2014.
[31] L. Xiao, Y. Cai, and R. Kazman. Titan: A toolset that connects softwarearchitecture with quality analysis. In 22nd ACM SIGSOFT InternationalSymposium on the Foundations of Software Engineering, 2014.
[32] L. Xiao, Y. Cai, R. Kazman, and R. Mo. Investigating the evolutionaryconsequences of architecture roots of error-proneness. In Submission,2014.
[33] N. Zazworka, A. Vetro, C. Izurieta, S. Wong, Y. Cai, C. Seaman, andF. Shull. Comparing four approaches for technical debt identification.
Software Quality Journal, pages 1–24, 2013.
188188188 ICSE 2015, Florence, Italy Software Engineering in Practice