Embed Size (px)
Citation preview
Modelling integrated SDG pathways:A case study analysis of goals 6, 7, 12 and 13
Simon ParkinsonVolker Krey, David McCollum, Edward Byers, Ned Djilali and Keywan Riahi
11th Annual IAMC Meeting, Seville, Spain, November 2018
• The World in 2050 (TWI2050) is a global research initiative in support of a successful implementation of the United Nations’ 2030 Agenda.
• The goal is to provide the fact-based knowledge to support the policy process and implementation of the SDGs.
Some previous work• GEA (2012), van Vuuren et al. (2015)
– Pathways to achieve multiple sustainability targets
• Kim et al. (2016)– Balancing water availability and use at the basin-scale in GCAM
• Gao and Bryan (2017)– Integrated SDG pathways from a land-use perspective for
Australia
Research Questions
• How can we quantify interactions between water, energy and climate SDGs?
• How might sustainable consumption behavior impact SDG implementation costs?
`
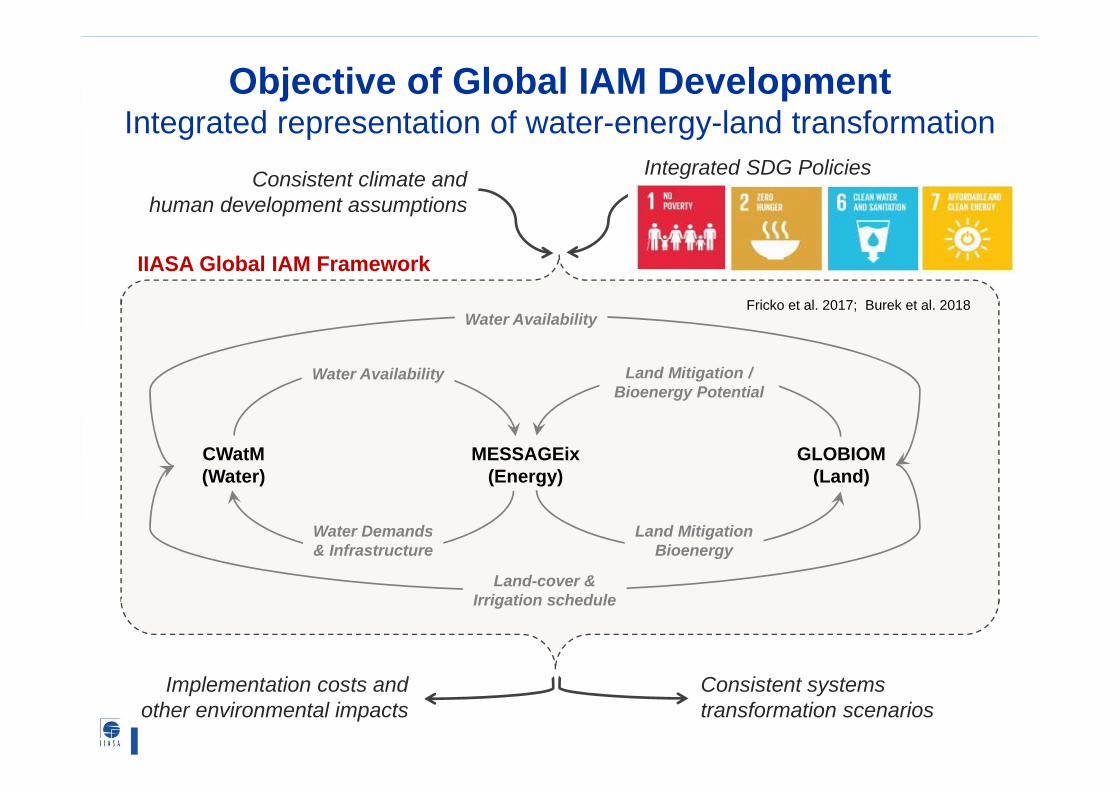
IIASA Global IAM Framework
Consistent climate and human development assumptions
Consistent systemstransformation scenarios
MESSAGEix(Energy)
CWatM(Water)
GLOBIOM(Land)
Water Demands& Infrastructure
Water Availability
Land-cover &Irrigation schedule
Water Availability
Land Mitigation / Bioenergy Potential
Land MitigationBioenergy
Objective of Global IAM Development Integrated representation of water-energy-land transformation
Integrated SDG Policies
Implementation costs and other environmental impacts
Fricko et al. 2017; Burek et al. 2018
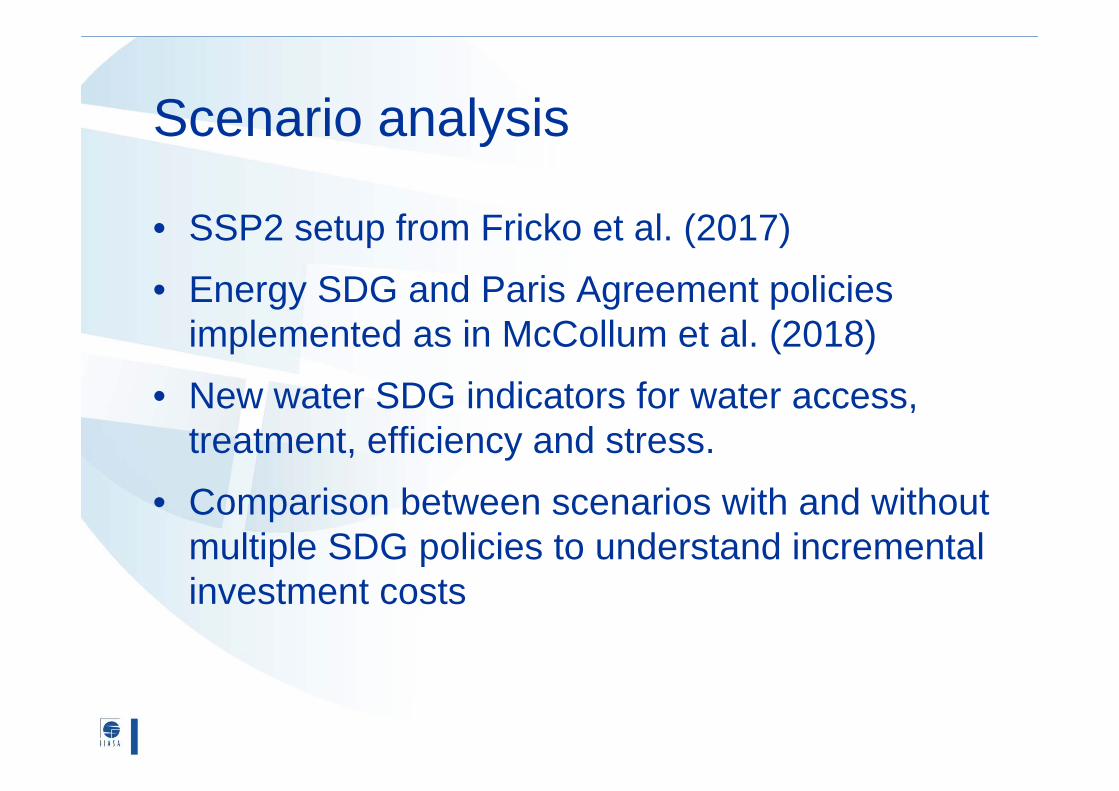
Scenario analysis
• SSP2 setup from Fricko et al. (2017)• Energy SDG and Paris Agreement policies
implemented as in McCollum et al. (2018)• New water SDG indicators for water access,
treatment, efficiency and stress.• Comparison between scenarios with and without
multiple SDG policies to understand incremental investment costs
`
Frac
tion
of w
ithdr
awal
s fro
m im
prov
ed s
ourc
esBaseline SDG6 Pathway
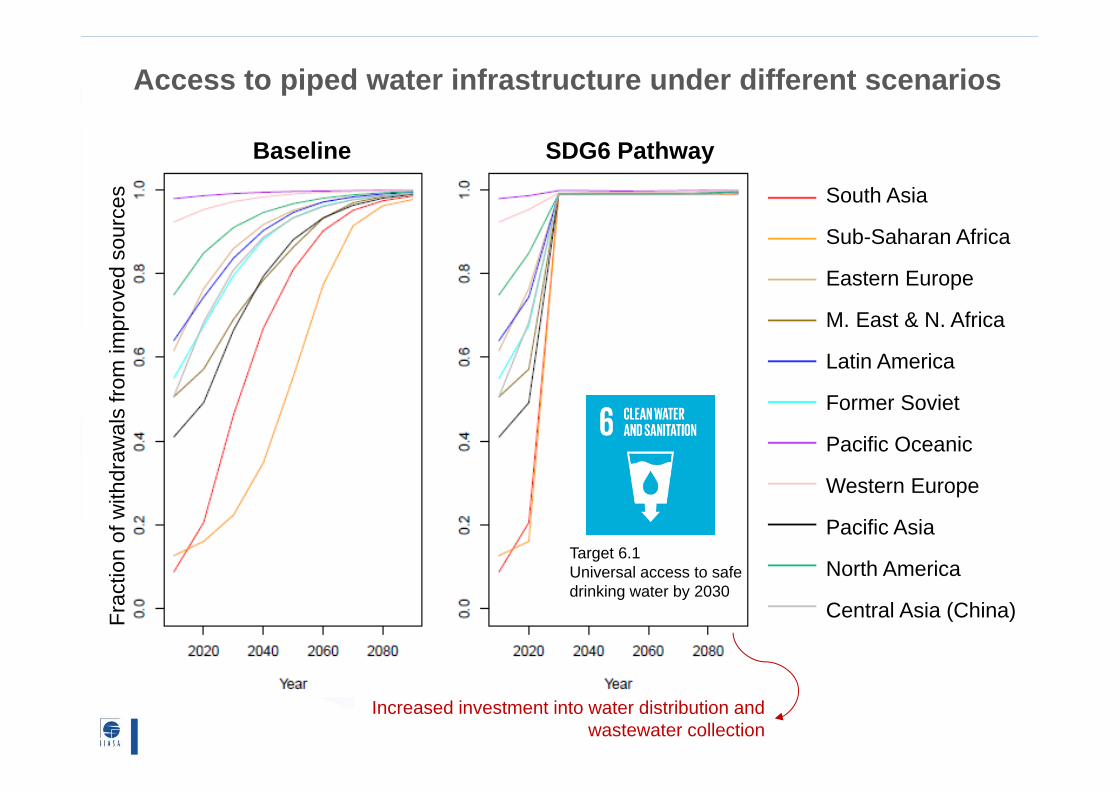
Access to piped water infrastructure under different scenarios
South Asia
Sub-Saharan Africa
Eastern Europe
M. East & N. Africa
Latin America
Former Soviet
Pacific Oceanic
Western Europe
Pacific Asia
North America
Central Asia (China)
Target 6.1Universal access to safe drinking water by 2030
Increased investment into water distribution and wastewater collection
`
Baseline SDG6 PathwayFr
actio
n of
retu
rn-fl
ow tr
eate
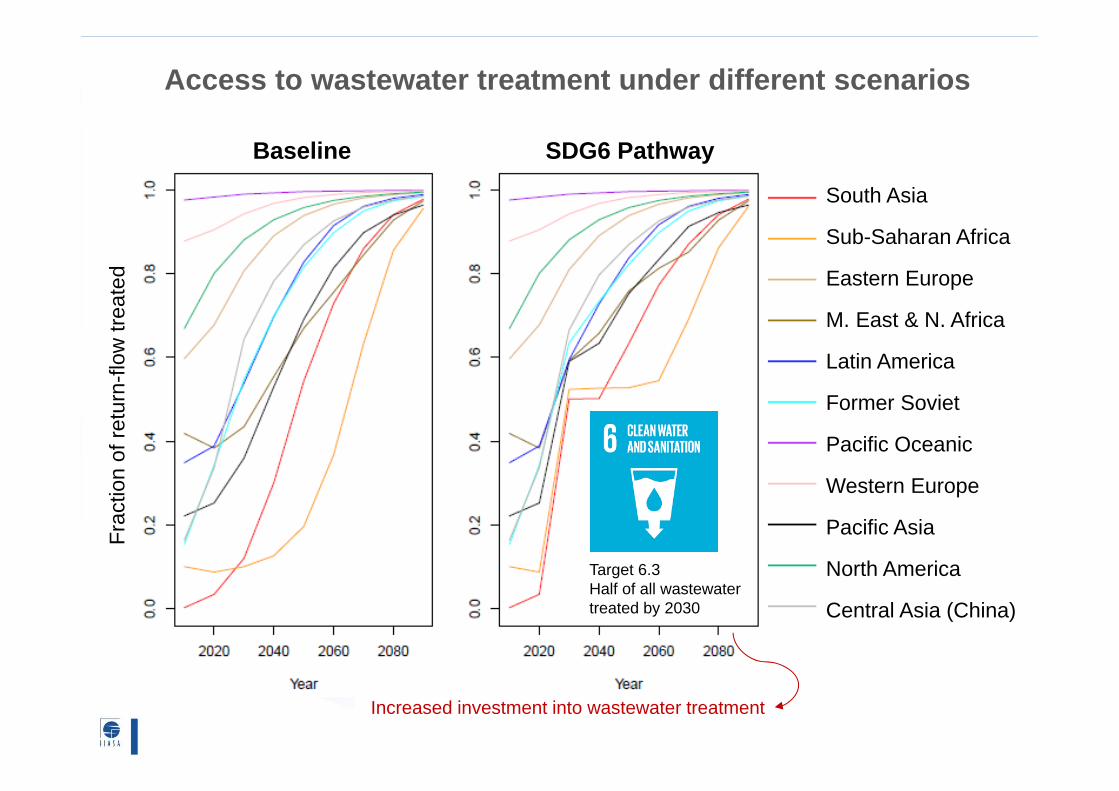
dAccess to wastewater treatment under different scenarios
South Asia
Sub-Saharan Africa
Eastern Europe
M. East & N. Africa
Latin America
Former Soviet
Pacific Oceanic
Western Europe
Pacific Asia
North America
Central Asia (China)
Target 6.3Half of all wastewater treated by 2030
Increased investment into wastewater treatment
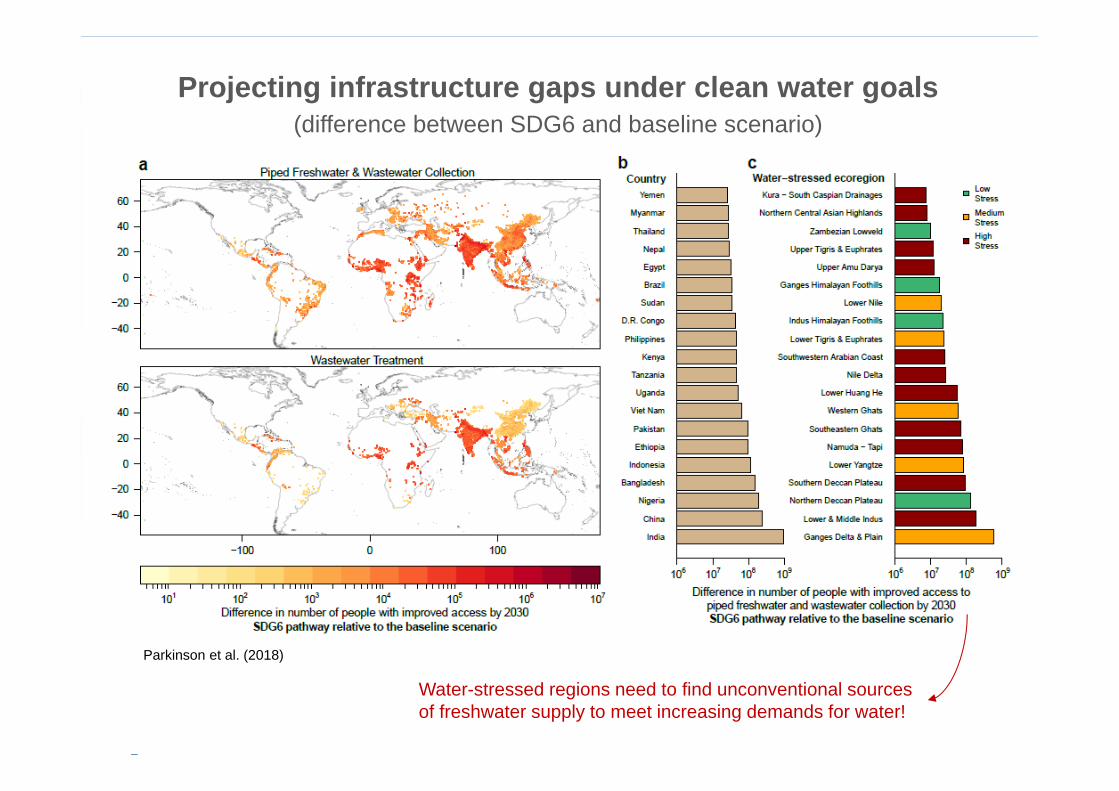
Projecting infrastructure gaps under clean water goals(difference between SDG6 and baseline scenario)
Water-stressed regions need to find unconventional sources of freshwater supply to meet increasing demands for water!
Parkinson et al. (2018)
`
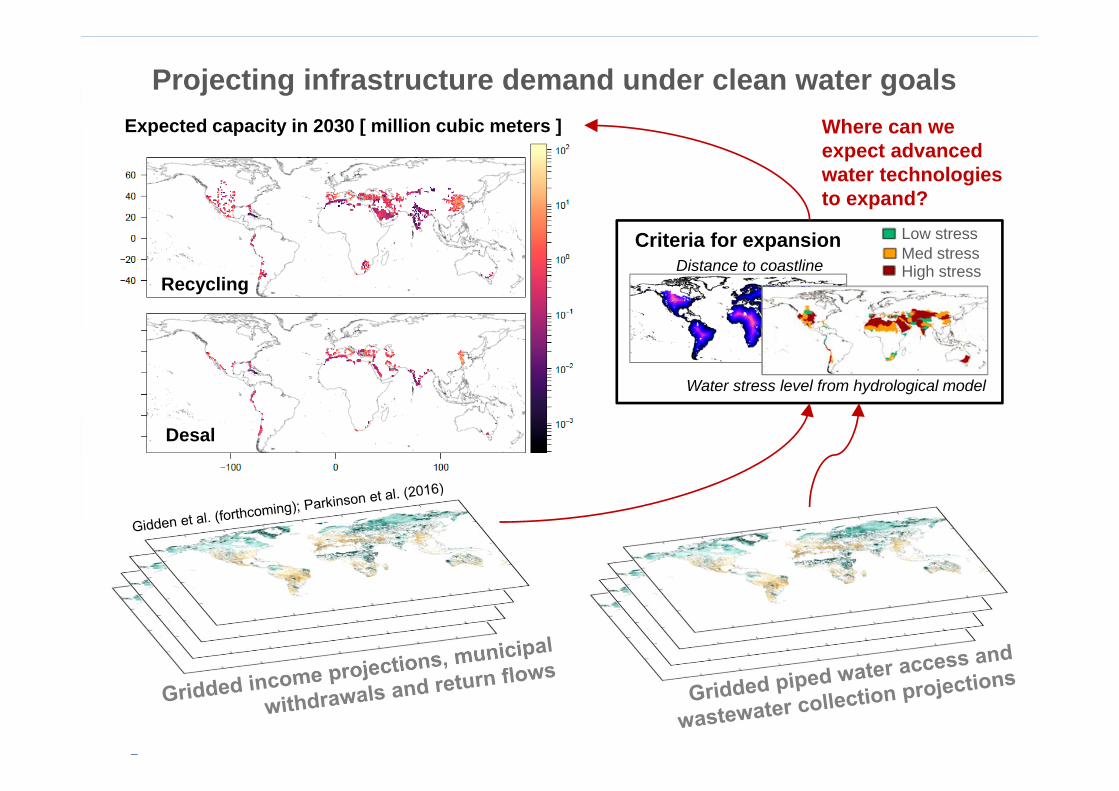
Projecting infrastructure demand under clean water goals
Criteria for expansionDistance to coastline
Water stress level from hydrological model
Low stressMed stressHigh stress
Expected capacity in 2030 [ million cubic meters ]
Recycling
Desal
Where can we expect advanced water technologies to expand?
`
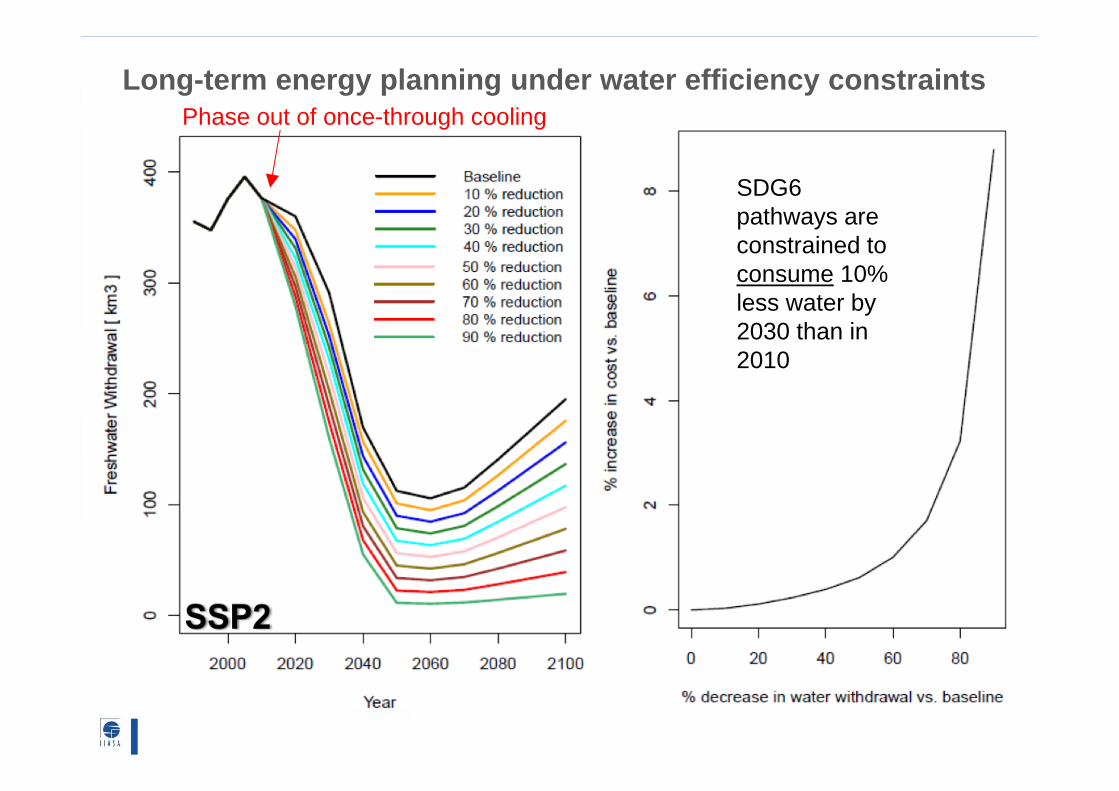
Long-term energy planning under water efficiency constraints
SDG6 pathways are constrained to consume 10% less water by 2030 than in 2010
Phase out of once-through cooling
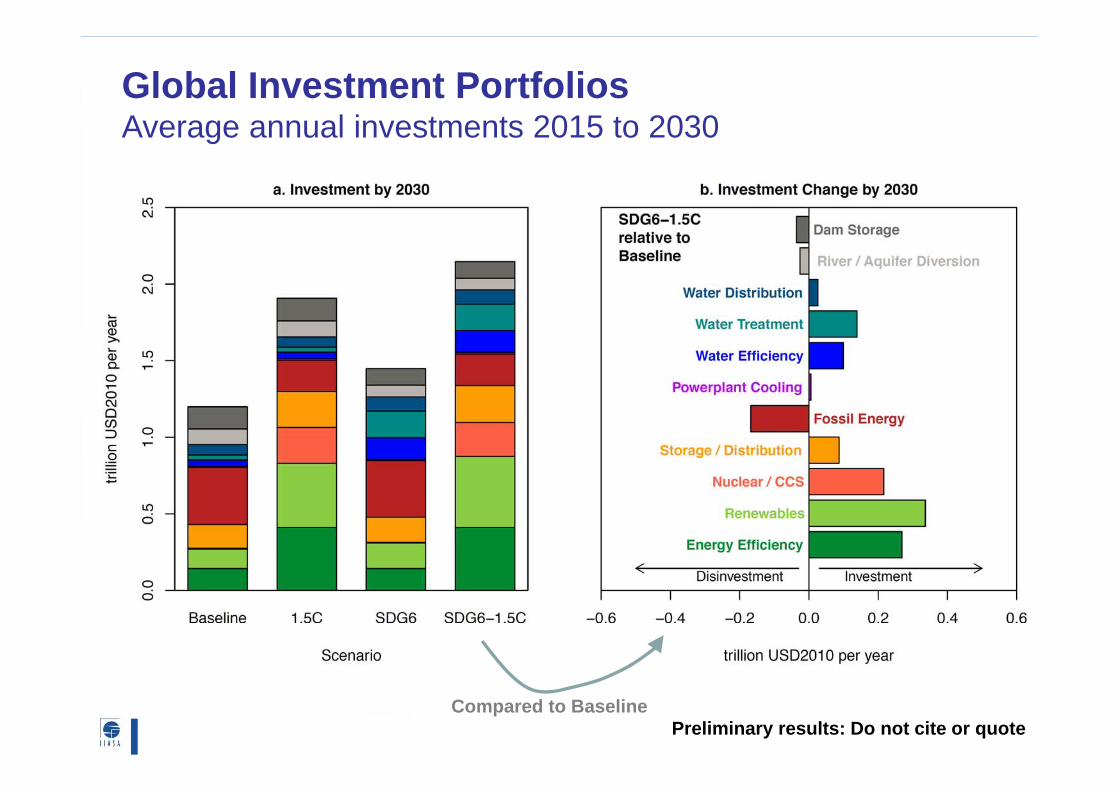
Global Investment PortfoliosAverage annual investments 2015 to 2030
Preliminary results: Do not cite or quoteCompared to Baseline
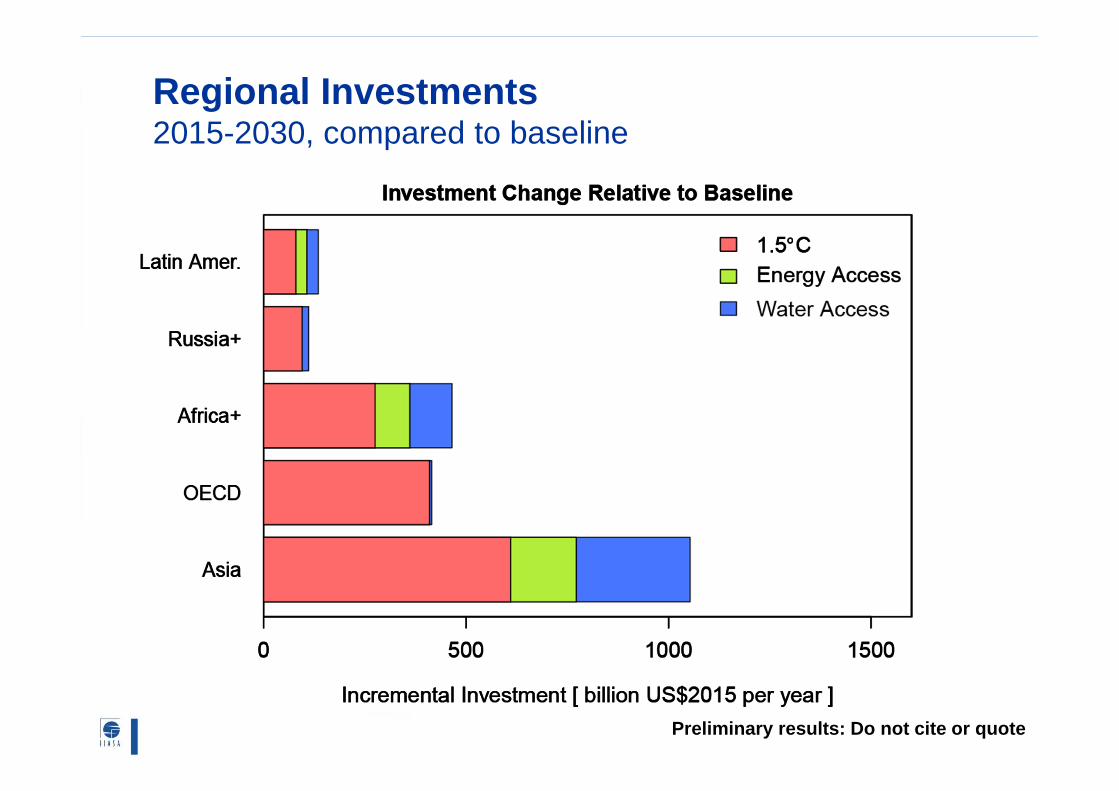
Regional Investments2015-2030, compared to baseline
Preliminary results: Do not cite or quote
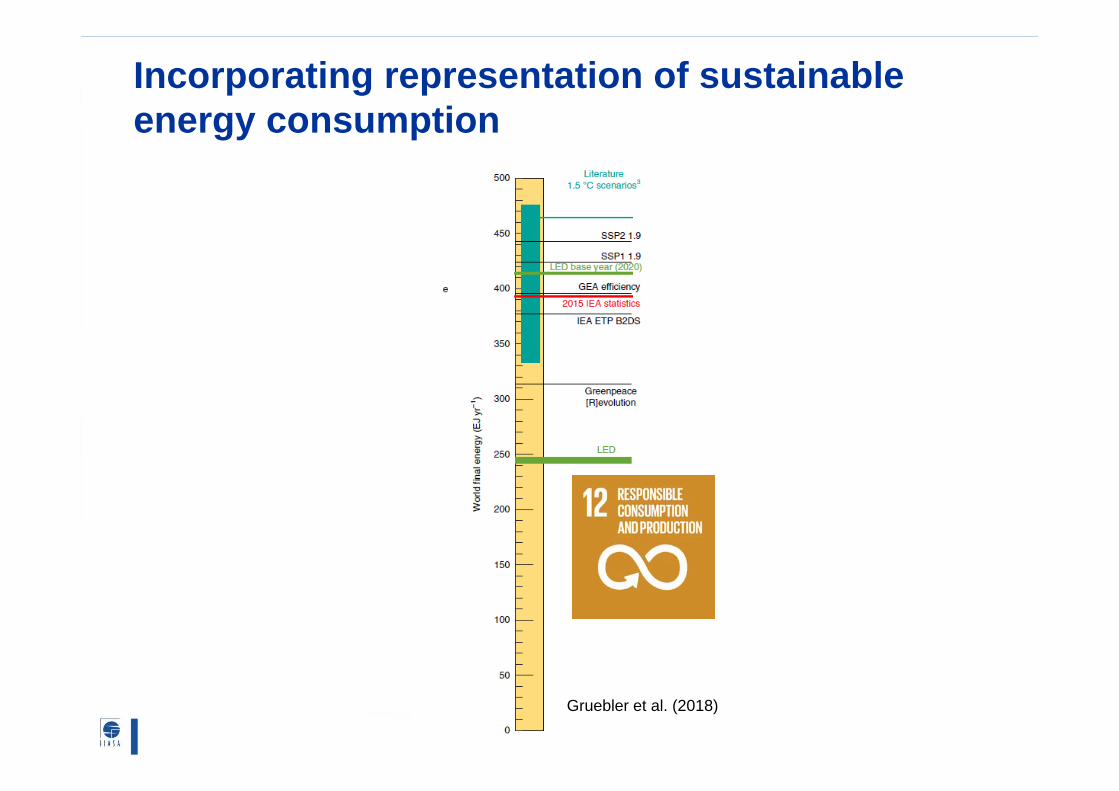
Incorporating representation of sustainable energy consumption
Gruebler et al. (2018)
`
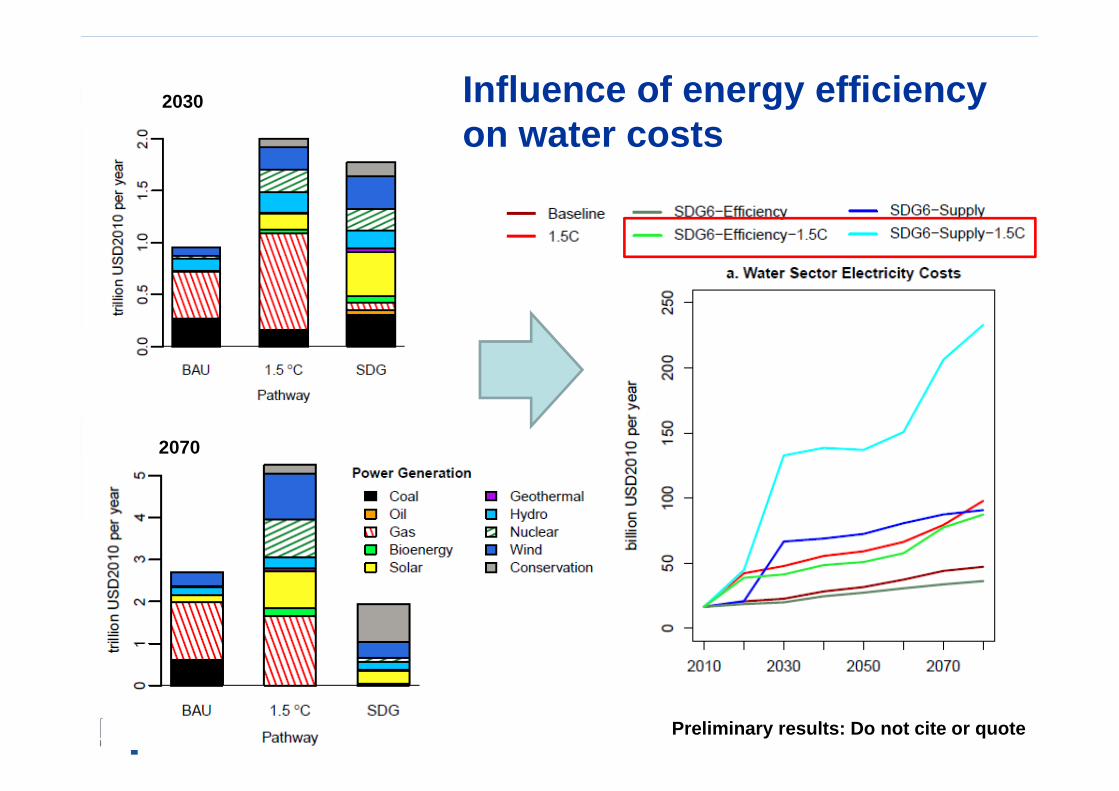
Influence of energy efficiency on water costs
Preliminary results: Do not cite or quote
2030
2070
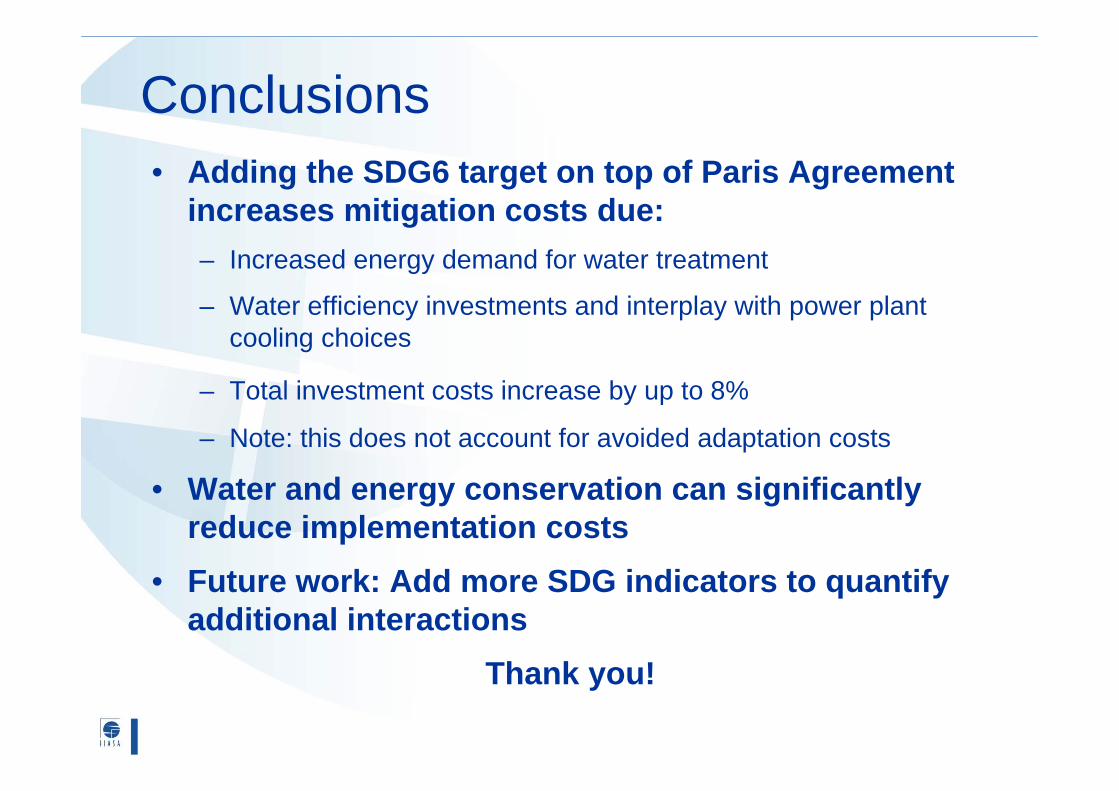
Conclusions• Adding the SDG6 target on top of Paris Agreement
increases mitigation costs due:– Increased energy demand for water treatment
– Water efficiency investments and interplay with power plant cooling choices
– Total investment costs increase by up to 8%
– Note: this does not account for avoided adaptation costs
• Water and energy conservation can significantly reduce implementation costs
• Future work: Add more SDG indicators to quantify additional interactions
Thank you!