Embed Size (px)
Citation preview

A Case for Solar Rooftop in Indonesia
A CENTRE FOR SCIENCE AND ENVIRONMENT ASSESSMENT
Centre for Science and Environment
A Case for Solar Rooftop in Indonesia report.indd 1 11/01/18 10:29 AM

A Case for Solar Rooftop in Indonesia report.indd 2 11/01/18 10:29 AM
A Case for Solar Rooftop in Indonesia
A CENTRE FOR SCIENCE AND ENVIRONMENT ASSESSMENT
Centre for Science and Environment
A Case for Solar Rooftop in Indonesia report.indd 3 11/01/18 10:29 AM
Research direction: Priyavrat Bhati
Writers: Aruna Kumarankandath, Shekhar Deepak Singh and Mandvi Singh
Editor: Souparno Banerjee
Cover design: Ajit Bajaj
Cover illustration: Tariq Aziz
Production: Rakesh Shrivastava and Gundhar Das
© 2017 Centre for Science and Environment
Material from this publication can be used, but with acknowledgement.
Published byCentre for Science and Environment41, Tughlakabad Institutional AreaNew Delhi 110 062Phones: 91-11-40616000Fax: 91-11-29955879E-mail: [email protected] Website: www.cseindia.org
This document has been produced with the support of the Swedish International Development Cooperation Agency (Sida). The views herein shall not necessarily be taken to reflect the official opinion of the donor.
A Case for Solar Rooftop in Indonesia report.indd 4 11/01/18 10:29 AM
5
A CASE FOR SOLAR ROOFTOP IN INDONESIA
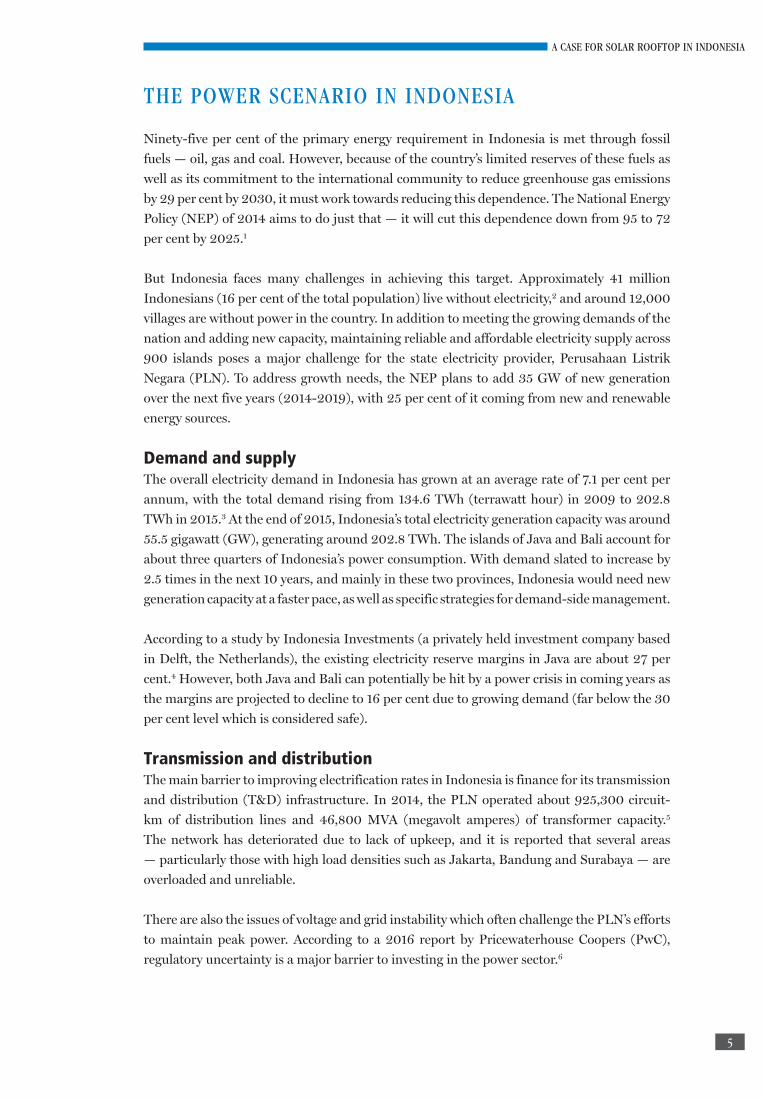
THE POWER SCENARIO IN INDONESIA
Ninety-five per cent of the primary energy requirement in Indonesia is met through fossil
fuels — oil, gas and coal. However, because of the country’s limited reserves of these fuels as
well as its commitment to the international community to reduce greenhouse gas emissions
by 29 per cent by 2030, it must work towards reducing this dependence. The National Energy
Policy (NEP) of 2014 aims to do just that — it will cut this dependence down from 95 to 72
per cent by 2025.1
But Indonesia faces many challenges in achieving this target. Approximately 41 million
Indonesians (16 per cent of the total population) live without electricity,2 and around 12,000
villages are without power in the country. In addition to meeting the growing demands of the
nation and adding new capacity, maintaining reliable and affordable electricity supply across
900 islands poses a major challenge for the state electricity provider, Perusahaan Listrik
Negara (PLN). To address growth needs, the NEP plans to add 35 GW of new generation
over the next five years (2014-2019), with 25 per cent of it coming from new and renewable
energy sources.
Demand and supplyThe overall electricity demand in Indonesia has grown at an average rate of 7.1 per cent per
annum, with the total demand rising from 134.6 TWh (terrawatt hour) in 2009 to 202.8
TWh in 2015.3 At the end of 2015, Indonesia’s total electricity generation capacity was around
55.5 gigawatt (GW), generating around 202.8 TWh. The islands of Java and Bali account for
about three quarters of Indonesia’s power consumption. With demand slated to increase by
2.5 times in the next 10 years, and mainly in these two provinces, Indonesia would need new
generation capacity at a faster pace, as well as specific strategies for demand-side management.
According to a study by Indonesia Investments (a privately held investment company based
in Delft, the Netherlands), the existing electricity reserve margins in Java are about 27 per
cent.4 However, both Java and Bali can potentially be hit by a power crisis in coming years as
the margins are projected to decline to 16 per cent due to growing demand (far below the 30
per cent level which is considered safe).
Transmission and distributionThe main barrier to improving electrification rates in Indonesia is finance for its transmission
and distribution (T&D) infrastructure. In 2014, the PLN operated about 925,300 circuit-
km of distribution lines and 46,800 MVA (megavolt amperes) of transformer capacity.5
The network has deteriorated due to lack of upkeep, and it is reported that several areas
— particularly those with high load densities such as Jakarta, Bandung and Surabaya — are
overloaded and unreliable.
There are also the issues of voltage and grid instability which often challenge the PLN’s efforts
to maintain peak power. According to a 2016 report by Pricewaterhouse Coopers (PwC),
regulatory uncertainty is a major barrier to investing in the power sector.6
A Case for Solar Rooftop in Indonesia report.indd 5 11/01/18 10:29 AM
6
A CASE FOR SOLAR ROOFTOP IN INDONESIA
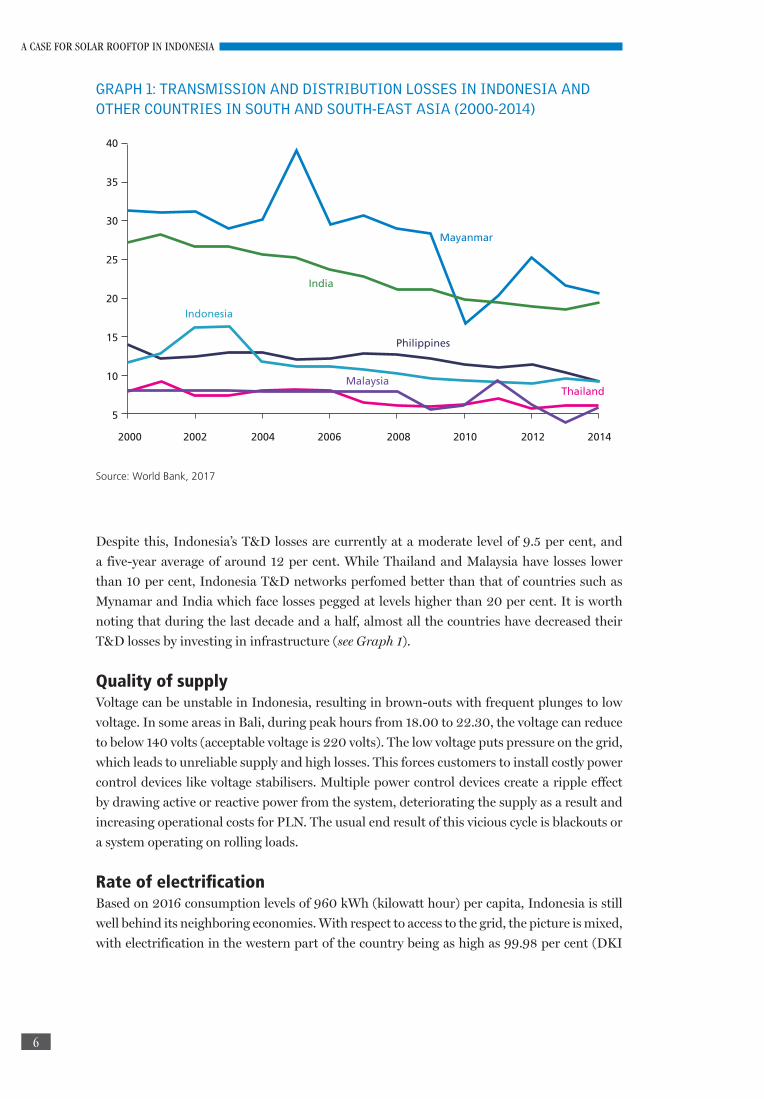
Despite this, Indonesia’s T&D losses are currently at a moderate level of 9.5 per cent, and
a five-year average of around 12 per cent. While Thailand and Malaysia have losses lower
than 10 per cent, Indonesia T&D networks perfomed better than that of countries such as
Mynamar and India which face losses pegged at levels higher than 20 per cent. It is worth
noting that during the last decade and a half, almost all the countries have decreased their
T&D losses by investing in infrastructure (see Graph 1).
Quality of supplyVoltage can be unstable in Indonesia, resulting in brown-outs with frequent plunges to low
voltage. In some areas in Bali, during peak hours from 18.00 to 22.30, the voltage can reduce
to below 140 volts (acceptable voltage is 220 volts). The low voltage puts pressure on the grid,
which leads to unreliable supply and high losses. This forces customers to install costly power
control devices like voltage stabilisers. Multiple power control devices create a ripple effect
by drawing active or reactive power from the system, deteriorating the supply as a result and
increasing operational costs for PLN. The usual end result of this vicious cycle is blackouts or
a system operating on rolling loads.
Rate of electrificationBased on 2016 consumption levels of 960 kWh (kilowatt hour) per capita, Indonesia is still
well behind its neighboring economies. With respect to access to the grid, the picture is mixed,
with electrification in the western part of the country being as high as 99.98 per cent (DKI
GRAPH 1: TRANSMISSION AND DISTRIBUTION LOSSES IN INDONESIA AND OTHER COUNTRIES IN SOUTH AND SOUTH-EAST ASIA (2000-2014)
40
35
30
25
20
15
10
5
2000 2002 2004 2006 2008 2010 2012 2014
Mayanmar
India
Philippines
Indonesia
ThailandMalaysia
Source: World Bank, 2017
A Case for Solar Rooftop in Indonesia report.indd 6 11/01/18 10:29 AM
7
A CASE FOR SOLAR ROOFTOP IN INDONESIA
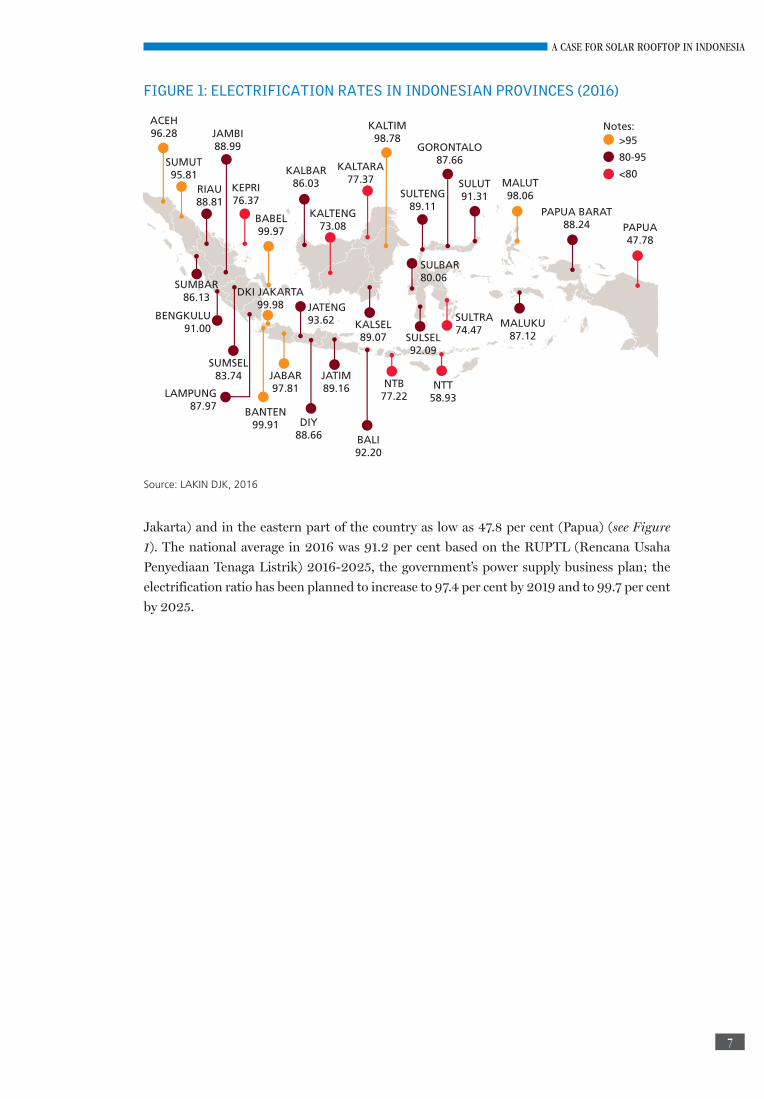
FIGURE 1: ELECTRIFICATION RATES IN INDONESIAN PROVINCES (2016)
ACEH96.28
SUMUT95.81
JAMBI88.99
KEPRI76.37
BABEL99.97
KALBAR86.03
KALTARA77.37
KALTIM98.78
GORONTALO87.66
SULTENG89.11
SULUT91.31
MALUT98.06
PAPUA BARAT88.24 PAPUA
47.78
MALUKU87.12
SULTRA74.47
BALI92.20
JATIM89.16
DIY88.66
JABAR97.81
BANTEN99.91
SUMSEL83.74
BENGKULU91.00
SUMBAR86.13
LAMPUNG87.97
JATENG93.62
DKI JAKARTA99.98
NTB77.22
SULSEL92.09
NTT58.93
KALTENG73.08
KALSEL89.07
SULBAR80.06
Notes:>95
80-95
<80RIAU88.81
Source: LAKIN DJK, 2016
Jakarta) and in the eastern part of the country as low as 47.8 per cent (Papua) (see Figure
1). The national average in 2016 was 91.2 per cent based on the RUPTL (Rencana Usaha
Penyediaan Tenaga Listrik) 2016-2025, the government’s power supply business plan; the
electrification ratio has been planned to increase to 97.4 per cent by 2019 and to 99.7 per cent
by 2025.
A Case for Solar Rooftop in Indonesia report.indd 7 11/01/18 10:29 AM
8
A CASE FOR SOLAR ROOFTOP IN INDONESIA
RENEWABLE ENERGY IN INDONESIA
Renewable energy investment in developed countries, as a group, fell 14 per cent in 2016, to
US $125 billion.7 The trend was reflected among emerging economies, which saw a decline
in new investments by 30 per cent (US $116.6 billion). However, Indonesia saw a rise in
investments in this sector amounting to US $1.36 billion in 2016 alone, compared to a total
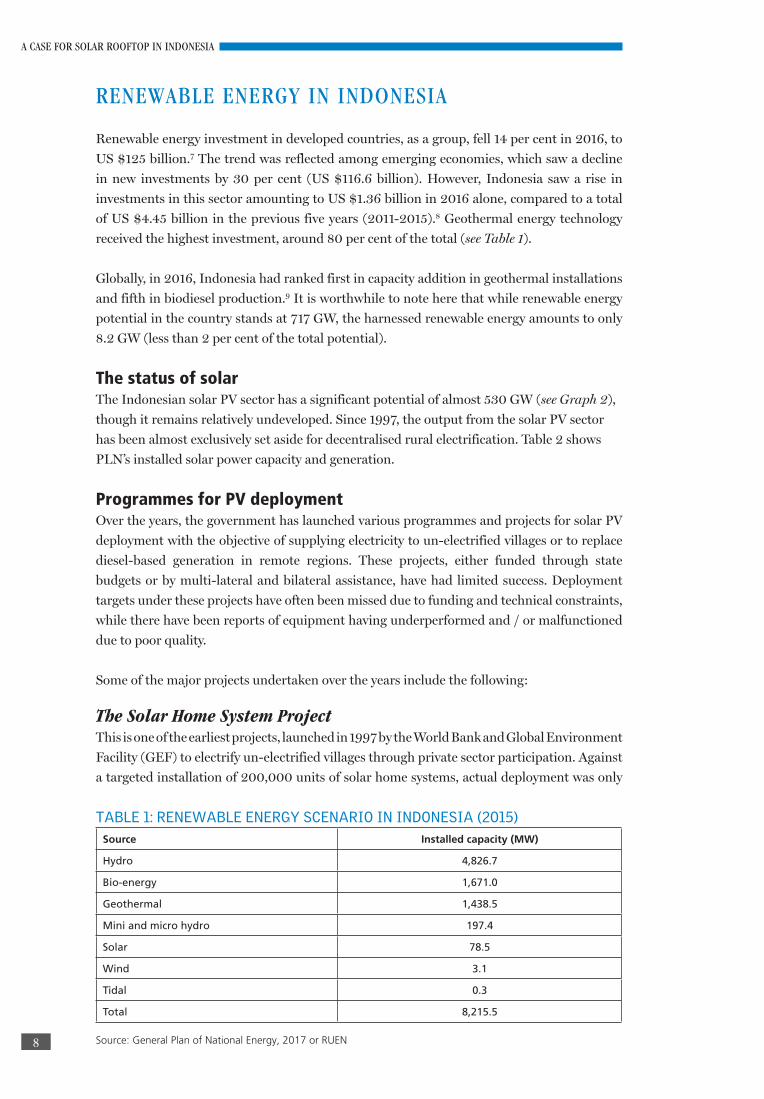
of US $4.45 billion in the previous five years (2011-2015).8 Geothermal energy technology
received the highest investment, around 80 per cent of the total (see Table 1).
Globally, in 2016, Indonesia had ranked first in capacity addition in geothermal installations
and fifth in biodiesel production.9 It is worthwhile to note here that while renewable energy
potential in the country stands at 717 GW, the harnessed renewable energy amounts to only
8.2 GW (less than 2 per cent of the total potential).
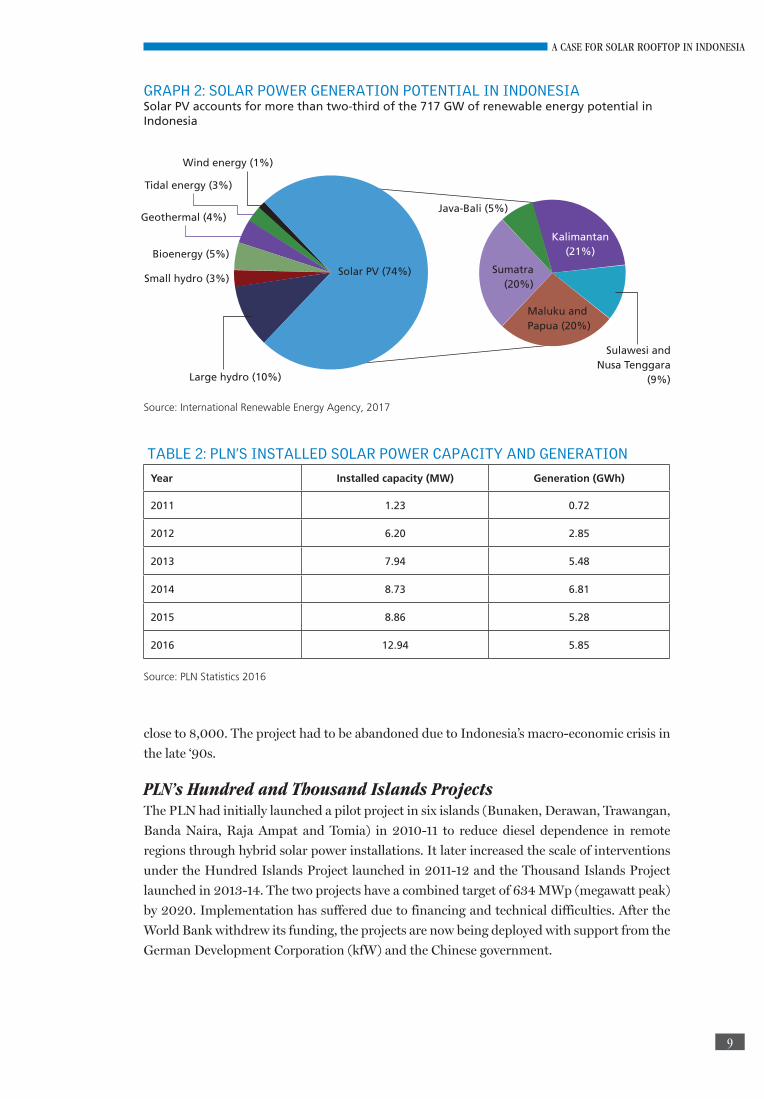
The status of solarThe Indonesian solar PV sector has a significant potential of almost 530 GW (see Graph 2),
though it remains relatively undeveloped. Since 1997, the output from the solar PV sector
has been almost exclusively set aside for decentralised rural electrification. Table 2 shows
PLN’s installed solar power capacity and generation.
Programmes for PV deploymentOver the years, the government has launched various programmes and projects for solar PV
deployment with the objective of supplying electricity to un-electrified villages or to replace
diesel-based generation in remote regions. These projects, either funded through state
budgets or by multi-lateral and bilateral assistance, have had limited success. Deployment
targets under these projects have often been missed due to funding and technical constraints,
while there have been reports of equipment having underperformed and / or malfunctioned
due to poor quality.
Some of the major projects undertaken over the years include the following:
The Solar Home System ProjectThis is one of the earliest projects, launched in 1997 by the World Bank and Global Environment
Facility (GEF) to electrify un-electrified villages through private sector participation. Against
a targeted installation of 200,000 units of solar home systems, actual deployment was only
TABLE 1: RENEWABLE ENERGY SCENARIO IN INDONESIA (2015)Source Installed capacity (MW)
Hydro 4,826.7
Bio-energy 1,671.0
Geothermal 1,438.5
Mini and micro hydro 197.4
Solar 78.5
Wind 3.1
Tidal 0.3
Total 8,215.5
Source: General Plan of National Energy, 2017 or RUEN
A Case for Solar Rooftop in Indonesia report.indd 8 11/01/18 10:29 AM
9
A CASE FOR SOLAR ROOFTOP IN INDONESIA
close to 8,000. The project had to be abandoned due to Indonesia’s macro-economic crisis in
the late ‘90s.
PLN’s Hundred and Thousand Islands ProjectsThe PLN had initially launched a pilot project in six islands (Bunaken, Derawan, Trawangan,
Banda Naira, Raja Ampat and Tomia) in 2010-11 to reduce diesel dependence in remote
regions through hybrid solar power installations. It later increased the scale of interventions
under the Hundred Islands Project launched in 2011-12 and the Thousand Islands Project
launched in 2013-14. The two projects have a combined target of 634 MWp (megawatt peak)
by 2020. Implementation has suffered due to financing and technical difficulties. After the
World Bank withdrew its funding, the projects are now being deployed with support from the
German Development Corporation (kfW) and the Chinese government.
GRAPH 2: SOLAR POWER GENERATION POTENTIAL IN INDONESIA Solar PV accounts for more than two-third of the 717 GW of renewable energy potential in Indonesia
Wind energy (1%)
Tidal energy (3%)
Geothermal (4%)
Bioenergy (5%)
Small hydro (3%)
Large hydro (10%)
Solar PV (74%)
Java-Bali (5%)
Kalimantan (21%)
Sulawesi and Nusa Tenggara
(9%)
Maluku and Papua (20%)
Sumatra (20%)
Source: International Renewable Energy Agency, 2017
TABLE 2: PLN’S INSTALLED SOLAR POWER CAPACITY AND GENERATION
Year Installed capacity (MW) Generation (GWh)
2011 1.23 0.72
2012 6.20 2.85
2013 7.94 5.48
2014 8.73 6.81
2015 8.86 5.28
2016 12.94 5.85
Source: PLN Statistics 2016
A Case for Solar Rooftop in Indonesia report.indd 9 11/01/18 10:29 AM
10
A CASE FOR SOLAR ROOFTOP IN INDONESIA
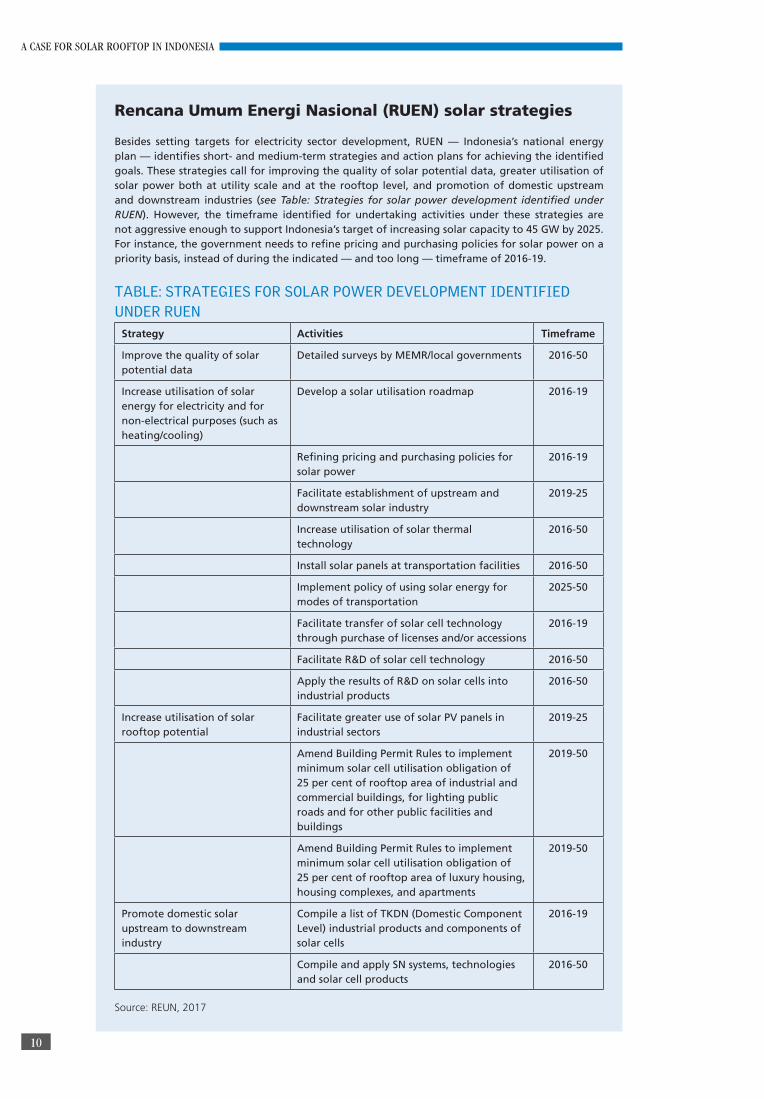
Rencana Umum Energi Nasional (RUEN) solar strategies
Besides setting targets for electricity sector development, RUEN — Indonesia’s national energy plan — identifies short- and medium-term strategies and action plans for achieving the identified goals. These strategies call for improving the quality of solar potential data, greater utilisation of solar power both at utility scale and at the rooftop level, and promotion of domestic upstream and downstream industries (see Table: Strategies for solar power development identified under RUEN). However, the timeframe identified for undertaking activities under these strategies are not aggressive enough to support Indonesia’s target of increasing solar capacity to 45 GW by 2025. For instance, the government needs to refine pricing and purchasing policies for solar power on a priority basis, instead of during the indicated — and too long — timeframe of 2016-19.
TABLE: STRATEGIES FOR SOLAR POWER DEVELOPMENT IDENTIFIED UNDER RUEN
Strategy Activities Timeframe
Improve the quality of solar potential data
Detailed surveys by MEMR/local governments 2016-50
Increase utilisation of solar energy for electricity and for non-electrical purposes (such as heating/cooling)
Develop a solar utilisation roadmap 2016-19
Refining pricing and purchasing policies for solar power
2016-19
Facilitate establishment of upstream and downstream solar industry
2019-25
Increase utilisation of solar thermal technology
2016-50
Install solar panels at transportation facilities 2016-50
Implement policy of using solar energy for modes of transportation
2025-50
Facilitate transfer of solar cell technology through purchase of licenses and/or accessions
2016-19
Facilitate R&D of solar cell technology 2016-50
Apply the results of R&D on solar cells into industrial products
2016-50
Increase utilisation of solar rooftop potential
Facilitate greater use of solar PV panels in industrial sectors
2019-25
Amend Building Permit Rules to implement minimum solar cell utilisation obligation of 25 per cent of rooftop area of industrial and commercial buildings, for lighting public roads and for other public facilities and buildings
2019-50
Amend Building Permit Rules to implement minimum solar cell utilisation obligation of 25 per cent of rooftop area of luxury housing, housing complexes, and apartments
2019-50
Promote domestic solar upstream to downstream industry
Compile a list of TKDN (Domestic Component Level) industrial products and components of solar cells
2016-19
Compile and apply SN systems, technologies and solar cell products
2016-50
Source: REUN, 2017
A Case for Solar Rooftop in Indonesia report.indd 10 11/01/18 10:29 AM
11
A CASE FOR SOLAR ROOFTOP IN INDONESIA
Photovoltaic Village PowerThe programme was launched in 2012-13, funded by the Directorate General of New
Renewable Energy and Energy Conservation (EBTKE) for rural electrification in off-grid
communities. It targeted installation of 112 small stand-alone PV/battery systems of 15 kW
each.
Energy Saving Solar Lamp (LTSHE)The LTSHE programme targets electrification of un-electrified villages located away from
PLN’s grid. It is a follow-up programme of Super Ekstra Hemat Energy (SEHEN) which was
initiated in 2012. The programme package includes solar panel capacity of 20 Wp, four LED
lights, batteries, installation costs, and after-sales service for three years. The government
has allocated a state budget of IDR 332 billion for the LTSHE programme and targets
distribution of 95,729 LTSHE packages across six provinces — West Nusa Tenggara, East
Nusa Tenggara, Maluku, North Maluku, Papua and West Papua. In 2018, the budget is likely
to be increased to IDR 1 trillion with a target of covering 255,250 households in 15 provinces.
Program Indonesia Terang (Bright Indonesia)The government has recently announced this national electrification initiative with the
objective of electrifying six eastern provinces, with a strong focus on solar PV deployment.
Constraints for solar rooftopDue to a number of factors, the cost of solar power in Indonesia has traditionally been on
the higher side relative to global averages. The country has so far been unable to utilise the
cost benefits of scale as the average size of equipment orders have remained small: annual
solar capacity additions have generally ranged from 10 to 20 MW, and the largest operational
project size is only 5 MW. Further, since solar project development has so far been concentrated
mostly in remote areas, the cost of grid connection and equipment transportation tends to
remain high, collectively accounting for 15 to 20 per cent of the project cost in certain cases.
The cost of PV installations in Indonesia is largely dependent on the international market,
as these comprise either fully imported or locally assembled PV modules. The country’s
domestic solar power industry consists of only a limited number of small local companies
engaged in assembling components imported primarily from China and Taiwan. While
module import is not being taxed, some of the major auxiliary equipment (aluminum frame,
ethylene vinyl acetate film, back sheet, junction box, silver solder ribbon and sealant etc) are
taxed in range of 13 to 20 per cent. Also, the mandatory provision of high domestic content
requirement (25.63 per cent on goods sourced, 100 per cent on services and 43.85 per cent on
both combined) adds to the costs of solar power generation.
A Case for Solar Rooftop in Indonesia report.indd 11 11/01/18 10:29 AM
12
A CASE FOR SOLAR ROOFTOP IN INDONESIA
THE CASE FOR SOLAR ROOFTOP
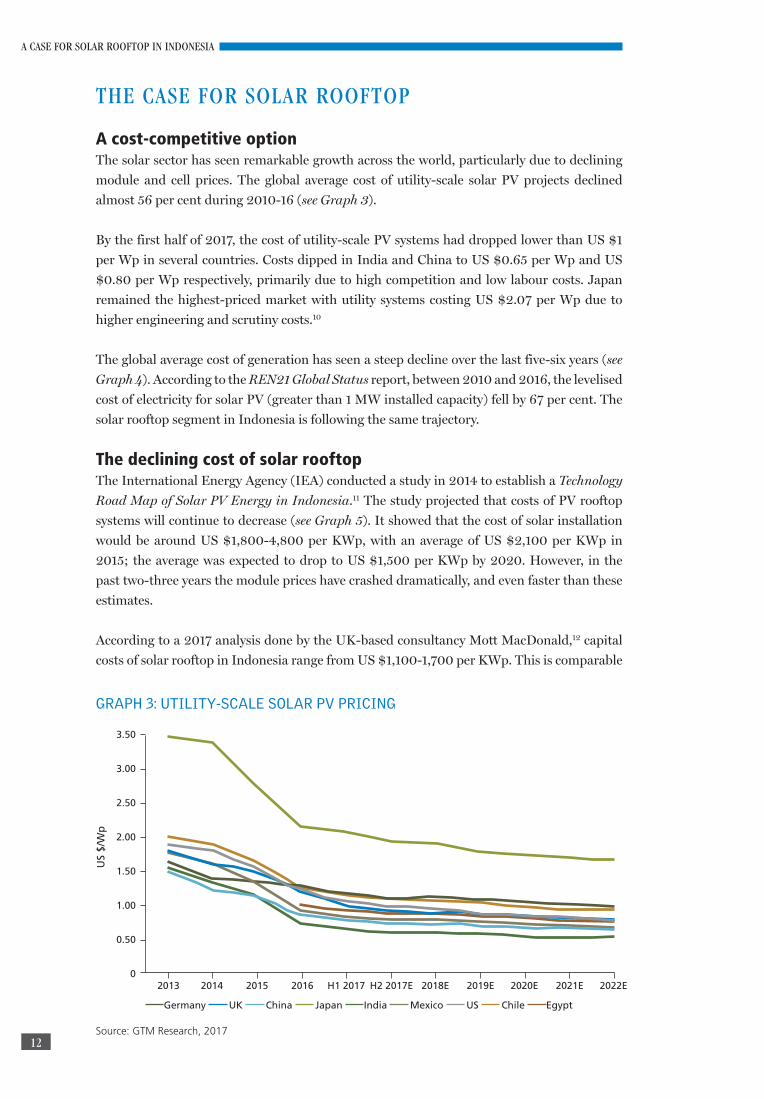
A cost-competitive optionThe solar sector has seen remarkable growth across the world, particularly due to declining
module and cell prices. The global average cost of utility-scale solar PV projects declined
almost 56 per cent during 2010-16 (see Graph 3).
By the first half of 2017, the cost of utility-scale PV systems had dropped lower than US $1
per Wp in several countries. Costs dipped in India and China to US $0.65 per Wp and US
$0.80 per Wp respectively, primarily due to high competition and low labour costs. Japan
remained the highest-priced market with utility systems costing US $2.07 per Wp due to
higher engineering and scrutiny costs.10
The global average cost of generation has seen a steep decline over the last five-six years (see
Graph 4). According to the REN21 Global Status report, between 2010 and 2016, the levelised
cost of electricity for solar PV (greater than 1 MW installed capacity) fell by 67 per cent. The
solar rooftop segment in Indonesia is following the same trajectory.
The declining cost of solar rooftopThe International Energy Agency (IEA) conducted a study in 2014 to establish a Technology
Road Map of Solar PV Energy in Indonesia.11 The study projected that costs of PV rooftop
systems will continue to decrease (see Graph 5). It showed that the cost of solar installation
would be around US $1,800-4,800 per KWp, with an average of US $2,100 per KWp in
2015; the average was expected to drop to US $1,500 per KWp by 2020. However, in the
past two-three years the module prices have crashed dramatically, and even faster than these
estimates.
According to a 2017 analysis done by the UK-based consultancy Mott MacDonald,12 capital
costs of solar rooftop in Indonesia range from US $1,100-1,700 per KWp. This is comparable
GRAPH 3: UTILITY-SCALE SOLAR PV PRICING
Source: GTM Research, 2017
3.50
3.00
2.50
2.00
1.50
1.00
0.50
0
US
$/W
p
Germany UK China Japan India Mexico US Chile Egypt
2013 2014 2015 2016 H1 2017 H2 2017E 2018E 2019E 2020E 2021E 2022E
A Case for Solar Rooftop in Indonesia report.indd 12 11/01/18 10:29 AM

13
A CASE FOR SOLAR ROOFTOP IN INDONESIA
to costs in most South and South-east Asian nations (see Table 3). However, more recent
information from India suggests that capital costs have dipped to around US $820 per KWp
compared to the US $950-1,400 per KWp mentioned in the analysis.
In terms of cost of generation, Indonesia seems to follow the developments across the globe.
The Mott MacDonald study quotes the levelised cost of generation (LCOE) at around US
$0.06-0.11 per unit of electricity (kWh) in Indonesia. In comparison, a grid-connected solar
rooftop system would cost around US $0.08 per kWh in India (see Graph 6).
GRAPH 4: DECLINE OF LEVELISED COSTS OF ELECTRICITY FROM SOLAR PV PROJECTS ACROSS COUNTRIES (US $ PER KWH)
0.078
0.070
0.150
0.049
0.050
0.020
0.080
0.140
0.220
0.069
0.070
0.050
0.085
0.178
0.250
0.080
0.080
0.110
0.096
0.180
0.300
0.090
0.110
0.120
0.000 0.050 0.100 0.150 0.200 0.250 0.300 0.350
China
USA
Japan
Germany
India
Mexico 2014
2015
2016
2017
Source: Compiled from various sources
GRAPH 5: COSTS OF SOLAR PV ROOFTOP SYSTEMS IN INDONESIA
5,000
4,000
3,000
2,000
1,000
0
US
$/kW
2015 2020 2030 2040 2050
Range Weigthed average
Source: IEA, 2014
US $/kWh
A Case for Solar Rooftop in Indonesia report.indd 13 11/01/18 10:29 AM
14
A CASE FOR SOLAR ROOFTOP IN INDONESIA
GRAPH 7: TRENDS IN PLN GRID ELECTRICITY PRICES VS PV ELECTRICITY COST
0.35
0.30
0.25
0.20
0.15
0.10
0.05
0
US
$/kW
h
2014 2016 2018 2020 2022 2024 2026 2028 2030
Grid electricity price PV electricity cost
Source: PLN, 2016
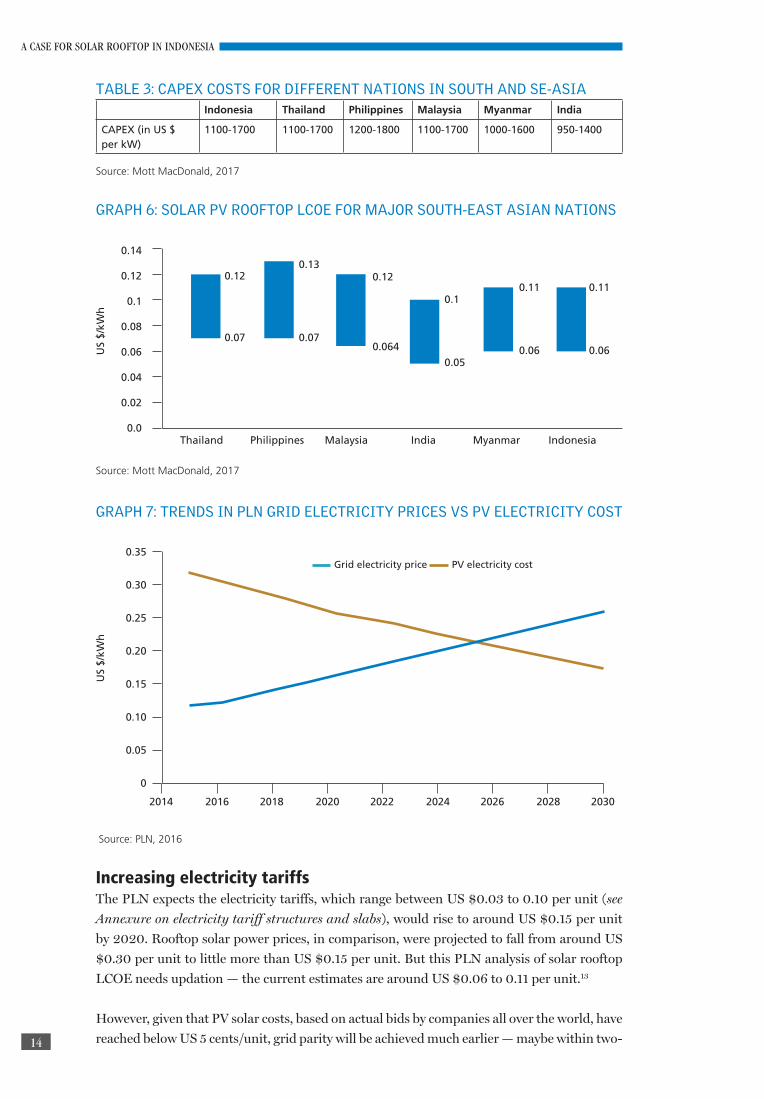
TABLE 3: CAPEX COSTS FOR DIFFERENT NATIONS IN SOUTH AND SE-ASIAIndonesia Thailand Philippines Malaysia Myanmar India
CAPEX (in US $ per kW)
1100-1700 1100-1700 1200-1800 1100-1700 1000-1600 950-1400
Source: Mott MacDonald, 2017
GRAPH 6: SOLAR PV ROOFTOP LCOE FOR MAJOR SOUTH-EAST ASIAN NATIONS
Thailand Philippines Malaysia India Myanmar Indonesia
0.14
0.12
0.1
0.08
0.06
0.04
0.02
0.0
0.12
0.07
0.13
0.07
0.12
0.064
0.1
0.05
0.11
0.06
0.11
0.06US
$/kW
h
Source: Mott MacDonald, 2017
Increasing electricity tariffs The PLN expects the electricity tariffs, which range between US $0.03 to 0.10 per unit (see
Annexure on electricity tariff structures and slabs), would rise to around US $0.15 per unit
by 2020. Rooftop solar power prices, in comparison, were projected to fall from around US
$0.30 per unit to little more than US $0.15 per unit. But this PLN analysis of solar rooftop
LCOE needs updation — the current estimates are around US $0.06 to 0.11 per unit.13
However, given that PV solar costs, based on actual bids by companies all over the world, have
reached below US 5 cents/unit, grid parity will be achieved much earlier — maybe within two-
A Case for Solar Rooftop in Indonesia report.indd 14 11/01/18 10:29 AM
15
A CASE FOR SOLAR ROOFTOP IN INDONESIA
three years, even in Indonesia. Indeed, the cost of solar PV electricity would already be lower
than that supplied by the grid in Indonesia for a number of customer types.
The average tariff rates for residential and social sector consumers with fairly small connected
load of 1.3 KW are higher than the solar rooftop cost of generation at US $0.06 per kWh.
Similarly, tariff rates for industrial, commercial, government and street lighting segments are
higher at US $0.08 per kWh to US $0.10 per kWh. The average tariff rates are also on the
higher side in cities like Tarakan, Batam, Jakarta, Yogyakarta and Banten. It makes economic
sense for consumers with tariffs higher than US $0.06 per unit to install solar rooftop and
partially or completely supplement their electricity supply. With the gradual increase in retail
tariffs and the projected decline in solar PV costs, the competitiveness of rooftop installations
is expected to improve for even larger sets of customers in the coming years.
Indonesia has witnessed its electricity tariffs go up because of withdrawal of subsidies by the
government. In order to gain international investment for its power plants, President Joko
Widodo’s government has been phasing out electricity subsidies since 2014. Another reason
behind this move was to reduce the budget expenses for the country.14
In 2014, the government announced that it would cut down its IDR 280 trillion (US $24
billion) subsidy bill by increasing tariffs for its biggest electricity consumers.15 This came
on the back of the fact that because of the reducing value of the Indonesian Rupiah, the
government ended up increasing budget estimates by 15 per cent. This led to a 10-11 per
cent hike for all consumers except government and households with connections less than
5.5 kVA, which received a tariff hike of around 5.5 per cent. This hike came into effect in
November 2014.
Then again, in 2016, PLN announced that the subsidy for 900-VA customers would be
gradually revoked starting from January to May 2017. About 4.3 million 900-VA and 450-
VA customers who are qualified to receive government subsidies, were made eligible for cheap
electricity. PLN estimated that the 18.7 million consumers who had a 900-VA connection can
afford to pay for their electricity without subsidies. In the latter half of the decade, the subsidy
for electricity fell from IDR 103.33 trillion in 2012 to only IDR 59.23 trillion in 2016.16
Offsetting the use of diesel gensetsIndonesia has at least 11 cities of over a million residents (medium-sized cities) each; Jakarta
is considered a megacity. Major cities such as Bandung, Surabaya, Medan, Semarang etc are
facing problems with both the quality of power and outages.17 This disturbs daily household
needs as well as business operations. There have been many reports in the media about
business and industrial entities raising these issues.
A 2015 Asian Development Bank (ADB) report titled Improving the Investment Climate in
Indonesia says power outages are one of the most important factors in hindering business
operations.18 According to it, power outages result in production losses amounting to
around 4 per cent of total sales in the (surveyed) firms. Starting a business in Indonesia is
also constrained by delays in acquiring electricity connections. Power interruptions have
prompted firms to rely on private generators, which now supply more than one third of the
energy requirements in some regions.
A Case for Solar Rooftop in Indonesia report.indd 15 11/01/18 10:29 AM
16
A CASE FOR SOLAR ROOFTOP IN INDONESIA
Jakarta experiences one of the highest number of days of power outages among all cities.
According to a Reuters report, from big multinational manufacturers to small neighborhood
restaurants, businesses in Indonesia are investing in diesel gensets because of the blackouts,
thus paying a higher price for the power they use.19 Among foreign investors, the Japanese
have been the most vocal with complaints about power shortages.
The question of access in the islandsApart from Jakarta, many other regions are prone to power cuts and dips in frequency. The
non-availability of quality power can have severe spillover effects. For instance, despite being
blessed with abundant natural resources and large markets, North Sumatra and Aceh have
struggled to attract foreign investors, mainly because of infrastructure problems, including
those related to erratic electricity supply.
Although a large section of Indonesia’s 250 million people is concentrated on the two main
islands of Java and Sumatra, there are more than 900 permanently inhabited islands. This
throws a logistical challenge for maintaining a reliable electricity grid supply, particularly in
Eastern Indonesia where it will be expensive to extend the T&D network.
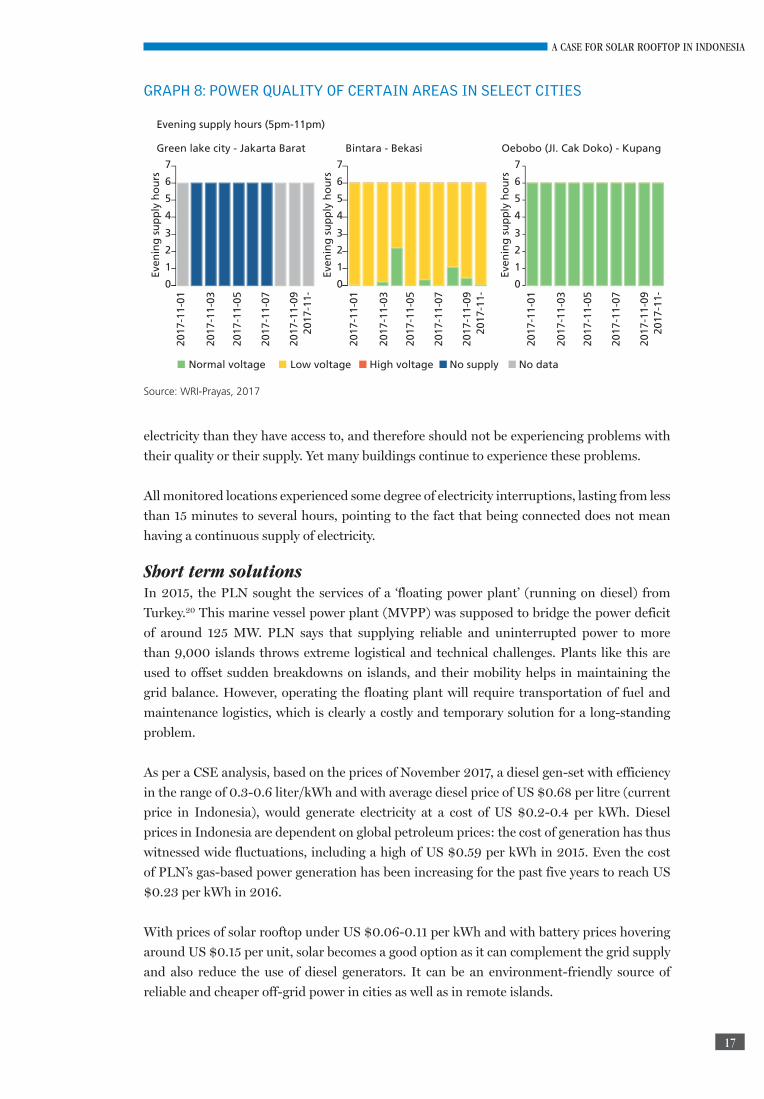
Power cutsA WRI-Prayas initiative has studied power cuts at 25 different sampling points across cities in
Indonesia. The Graph 8 presents the comparison for three different cities — Jakarta, Bekasi
and Kupang — for around 10 days of electricity patterns (November 1-11, 2017) for the evening
peak hours (17.00-23.00). In the Green Lake City area of Jakarta, power cuts happened for
six hours during the evening peak time. In Bekasi, power remained, but there were voltage
dips. Interestingly, the Oebobo area in Kupang city had power with normal voltage.
The data reveals that despite being connected to the grid, power voltage levels were fairly
low throughout the 25 locations monitored (210 volts being low, 220 volts being normal and
250 volts being high). Low power voltage levels affect appliance performance or the ability to
charge electronics such as mobile phones. It was also observed that in most locations, installed
electricity capacity exceeded consumption, meaning that buildings are consuming much less
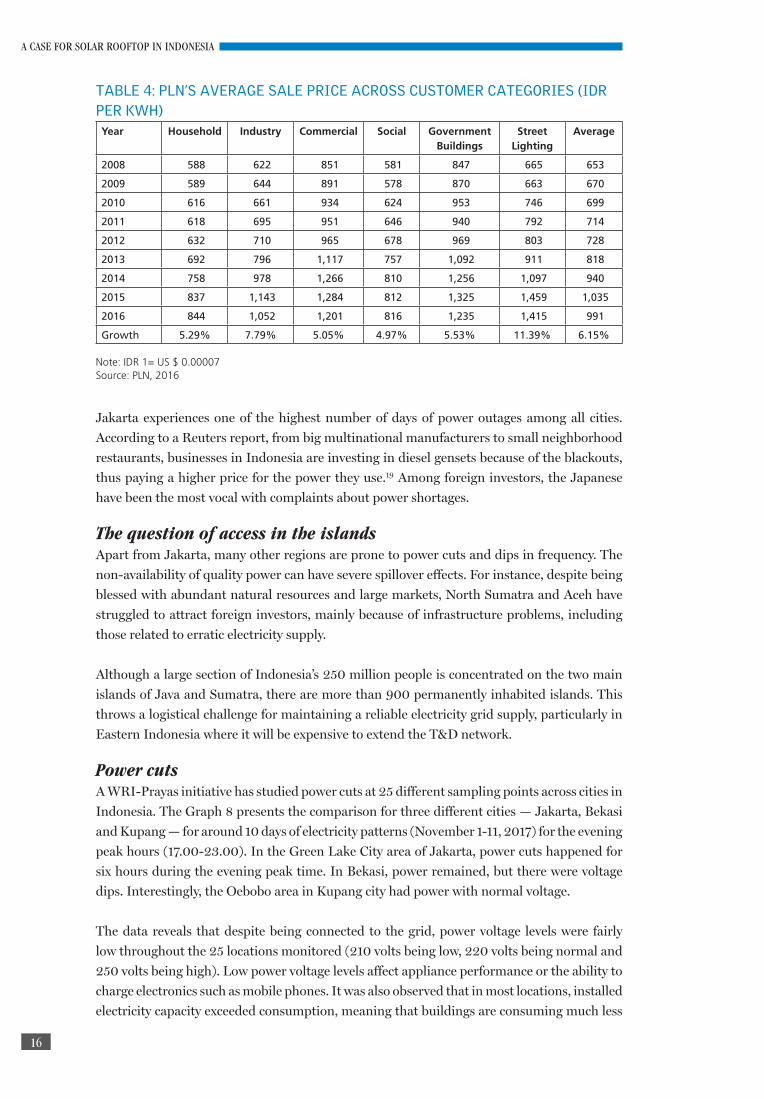
TABLE 4: PLN’S AVERAGE SALE PRICE ACROSS CUSTOMER CATEGORIES (IDR PER KWH)Year Household Industry Commercial Social Government
BuildingsStreet
LightingAverage
2008 588 622 851 581 847 665 653
2009 589 644 891 578 870 663 670
2010 616 661 934 624 953 746 699
2011 618 695 951 646 940 792 714
2012 632 710 965 678 969 803 728
2013 692 796 1,117 757 1,092 911 818
2014 758 978 1,266 810 1,256 1,097 940
2015 837 1,143 1,284 812 1,325 1,459 1,035
2016 844 1,052 1,201 816 1,235 1,415 991
Growth 5.29% 7.79% 5.05% 4.97% 5.53% 11.39% 6.15%
Note: IDR 1= US $ 0.00007Source: PLN, 2016
A Case for Solar Rooftop in Indonesia report.indd 16 11/01/18 10:29 AM
17
A CASE FOR SOLAR ROOFTOP IN INDONESIA
electricity than they have access to, and therefore should not be experiencing problems with
their quality or their supply. Yet many buildings continue to experience these problems.
All monitored locations experienced some degree of electricity interruptions, lasting from less
than 15 minutes to several hours, pointing to the fact that being connected does not mean
having a continuous supply of electricity.
Short term solutionsIn 2015, the PLN sought the services of a ‘floating power plant’ (running on diesel) from
Turkey.20 This marine vessel power plant (MVPP) was supposed to bridge the power deficit
of around 125 MW. PLN says that supplying reliable and uninterrupted power to more
than 9,000 islands throws extreme logistical and technical challenges. Plants like this are
used to offset sudden breakdowns on islands, and their mobility helps in maintaining the
grid balance. However, operating the floating plant will require transportation of fuel and
maintenance logistics, which is clearly a costly and temporary solution for a long-standing
problem.
As per a CSE analysis, based on the prices of November 2017, a diesel gen-set with efficiency
in the range of 0.3-0.6 liter/kWh and with average diesel price of US $0.68 per litre (current
price in Indonesia), would generate electricity at a cost of US $0.2-0.4 per kWh. Diesel
prices in Indonesia are dependent on global petroleum prices: the cost of generation has thus
witnessed wide fluctuations, including a high of US $0.59 per kWh in 2015. Even the cost
of PLN’s gas-based power generation has been increasing for the past five years to reach US
$0.23 per kWh in 2016.
With prices of solar rooftop under US $0.06-0.11 per kWh and with battery prices hovering
around US $0.15 per unit, solar becomes a good option as it can complement the grid supply
and also reduce the use of diesel generators. It can be an environment-friendly source of
reliable and cheaper off-grid power in cities as well as in remote islands.
GRAPH 8: POWER QUALITY OF CERTAIN AREAS IN SELECT CITIES
2017
-11-
01
2017
-11-
03
2017
-11-
05
2017
-11-
07
2017
-11-
0920
17-1
1-
2017
-11-
01
2017
-11-
03
2017
-11-
05
2017
-11-
07
2017
-11-
0920
17-1
1-
2017
-11-
01
2017
-11-
03
2017
-11-
05
2017
-11-
07
2017
-11-
0920
17-1
1-
0
1
2
3
4
5
6
7Ev
enin
g s
up
ply
ho
urs
0
1
2
3
4
5
6
7
Even
ing
su
pp
ly h
ou
rs
0
1
2
3
4
5
6
7
Even
ing
su
pp
ly h
ou
rs
Green lake city - Jakarta Barat
Evening supply hours (5pm-11pm)
Normal voltage Low voltage High voltage No supply No data
Bintara - Bekasi Oebobo (JI. Cak Doko) - Kupang
Source: WRI-Prayas, 2017
A Case for Solar Rooftop in Indonesia report.indd 17 11/01/18 10:29 AM
18
A CASE FOR SOLAR ROOFTOP IN INDONESIA
Immense potentialThere are no comprehensive studies to assess the potential of solar PV rooftop systems in
Indonesia. Scientific estimation of a region’s rooftop potential will require detailed modeling
and assessment of solar radiation, rooftop area, shade analysis, load profiles etc which is
beyond the scope of this paper. For the purpose of gauging Indonesia’s solar rooftop potential,
various indicators — urban area, solar insolation, land use pattern etc — can be explored to
arrive at broad estimates.
Indonesia is urbanising at a rapid pace with cities and towns growing at an average rate of
4.1 per cent per year, as per World Bank estimates.21 The total urban land area in the country,
estimated to be 42,077 sq km, is the highest in South-east Asia. Fortunately Indonesia’s urban
areas experience high solar insolation required for solar power generation. For instance, in
Jakarta, the solar irradiance level is estimated to vary from 4.2 to 5.7 kWh per sq metre per
day during the year. The variability of the PV system output is also estimated to be low —
pointing to a high rooftop development potential.
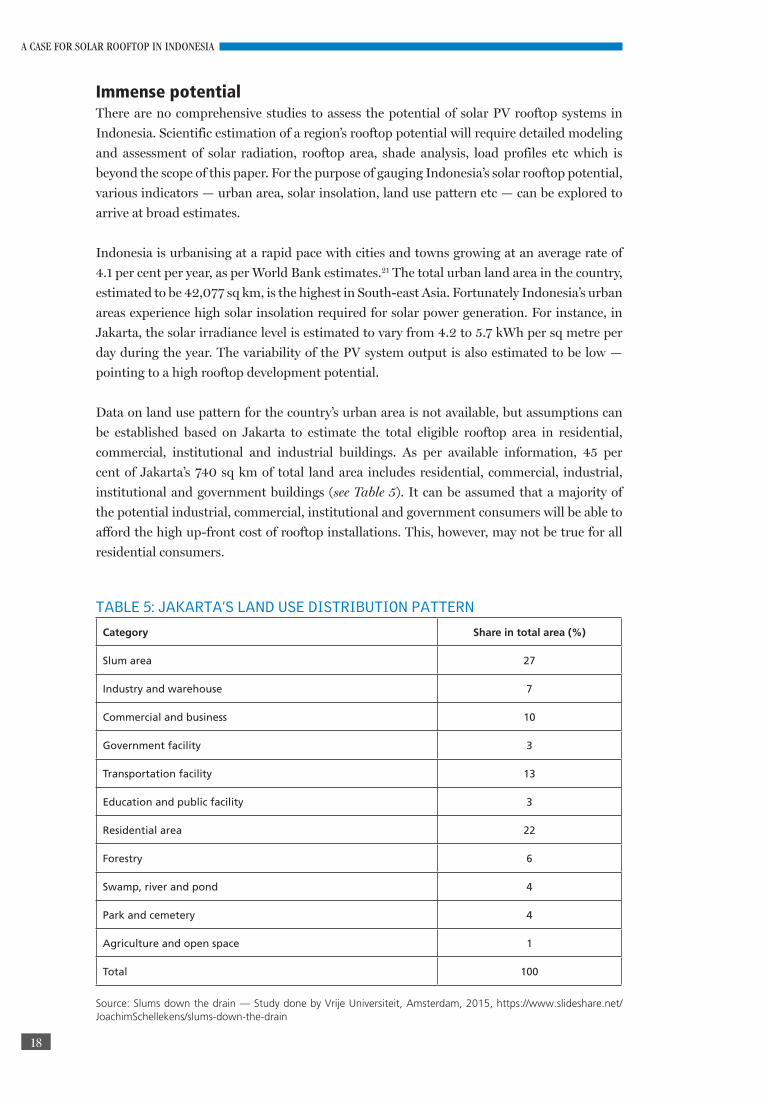
Data on land use pattern for the country’s urban area is not available, but assumptions can
be established based on Jakarta to estimate the total eligible rooftop area in residential,
commercial, institutional and industrial buildings. As per available information, 45 per
cent of Jakarta’s 740 sq km of total land area includes residential, commercial, industrial,
institutional and government buildings (see Table 5). It can be assumed that a majority of
the potential industrial, commercial, institutional and government consumers will be able to
afford the high up-front cost of rooftop installations. This, however, may not be true for all
residential consumers.
TABLE 5: JAKARTA’S LAND USE DISTRIBUTION PATTERN
Category Share in total area (%)
Slum area 27
Industry and warehouse 7
Commercial and business 10
Government facility 3
Transportation facility 13
Education and public facility 3
Residential area 22
Forestry 6
Swamp, river and pond 4
Park and cemetery 4
Agriculture and open space 1
Total 100
Source: Slums down the drain — Study done by Vrije Universiteit, Amsterdam, 2015, https://www.slideshare.net/JoachimSchellekens/slums-down-the-drain
A Case for Solar Rooftop in Indonesia report.indd 18 11/01/18 10:29 AM
19
A CASE FOR SOLAR ROOFTOP IN INDONESIA
The potential for solar rooftop can be assessed on the basis of a study done for the National
Capital Territory of New Delhi in India. NCT, Delhi is estimated to have a total land area of
around 1,484 sq km, with around 700 sq km of built area. Approximately, 30 per cent of the
land is covered with trees and roads, and 490 sq km of developed areas is available for rooftop
space. It is likely that there would be certain buildings that cannot be used for installing solar
rooftop systems because they are either too old, or are monuments or religious structures.
Removing another 10 per cent of such buildings, it gives us 441 sq km of buildings with
suitable rooftop space. A total capacity of 3.65 GW of rooftop solar can be installed, given that
10 per cent of the available space is conducive to rooftop installation because of direction and
availability of roof space.
On a similar scale, Jakarta’s 333-sq km area would have a usable roof space of about 30 sq km
which — in all likelihood — would be technically and economically suitable for solar rooftop
development. Given that about 12 sq m area is required to install a solar PV system of 1 kWp,
the estimated rooftop solar potential for Jakarta could be 2.5 GW.
Another approach for estimating potential can be through the assumption that customers
who are paying around US $0.07 per unit, would be likely to move to solar rooftop since it
makes sound economic sense. These would ideally be consumers under the connection slab
of over 900 V-RTM (see Annexure on electricity tariff structures and slabs), they are the ones
paying higher electricity charges and do not get the benefits of subsidised power. Besides
them, consumers with higher load slabs (of above 3,500 VA) in regions which are plagued
by power cuts, can take recourse to solar rooftop, thereby reducing the use of diesel gensets.
A gross estimate of Jakarta’s solar rooftop potential can be made based on the assumption
that if 10 per cent of consumers in the city — around 200,000 households — install just 1
KW each, Jakarta can install 200 MW of solar rooftop capacity and reduce its dependence
on diesel to some extent. This can also significantly bring down the stress on the grid and
provide reliable back-up power to consumers during outages. These are conservative figures
as the total number of potential customers has been estimated to reach up to 1.2 million in
2020 — hence, the actual potential might be much higher.
Ensuring energy securityElectricity demand in Indonesia is projected to increase at a high compound annual growth
rate of 8.6 per cent over the next decade (see Graph 9). To meet this demand, the government
has sketched out elaborate plans to build mega power projects. However, a significant chunk
of the growing demand burden can be effectively met through rooftop solar PV installations,
given that large projects entail high gestation periods and billions of dollars in project and
grid investments. Most large generation projects, both in the public and private sectors, have
missed commissioning deadlines due to numerous development challenges. Additionally,
under-investments in renovation and modernisation of older power plants also threaten the
country’s energy security.
There are costs associated with adding more large-scale plants into an already overburdened
transmission and distribution system. Investment in grid infrastructure is an expense that
most countries have not been able to determine yet. On the other hand, more and more
intermittent power being fed into the grid requires grid flexibility and does have certain costs.
A Case for Solar Rooftop in Indonesia report.indd 19 11/01/18 10:29 AM

20
A CASE FOR SOLAR ROOFTOP IN INDONESIA
The other issue is increase in operational costs of the systems, which would include costs to
the existing power system — reduced utilisation, increase in reserve capacity etc.
According to IRENA’s Renewable Energy Integration in Power Grids report22, upgrading the
grid and the costs involved would be determined by the existing features of the grid. IRENA
estimates them to be around US $0.6-3.5 per MWh as grid costs and US $17-30 per MWh
as system operations costs. It also estimates that for a 10 per cent increase in the share of
electricity generated from renewable sources, there needs to be a 1.5-4 per cent increase in the
share of variable capacity. Another estimate by German consultancy Agora Energiewende23
puts the estimates at US $5-15 per MWh.
Again, this makes a case for rooftop solar installation because it can provide flexibility to
manage demand. The advantage that decentralised generation like solar rooftop has over
centralised generation is the fact that adding 10-15 per cent of capacity to the grid does not
require huge investments from the distribution company. In addition, decentralised systems
do not have T&D losses since the consumption occurs at the point of generation. The scope of
utilising rooftop installations increases further as a majority of the demand will continue to
be concentrated in the largely urban Java-Bali grid region — accounting for 70 per cent of the
country’s electricity demand in 2025.
Rooftop installations also represent a long-term reliable source of power. With frequent
blackouts and poor quality of power supply in other smaller towns and cities, distributed
generation can help ensure power supply stability in wake of such challenges. Even the Java-
Bali region has experienced prolonged blackouts in the past because of fuel supplies to power
stations being impacted due to natural disasters.
GRAPH 9: PROJECTED INCREASE IN ELECTRICITY REQUIREMENT IN JAVA-BALI GRID 2015-24 (TWH)
151 162 197
228 261
298 318 21 23
60 36
44
52 56
29 32
41 51
62
75 83
0
50
100
150
200
250
300
350
400
450
500
2015 2016 2018 2020 2022 2024 2025
Sumatra
Eastern Indonesia
Java-Bali
Source: PLN’s RUPTL, 2016-25
TWh
A Case for Solar Rooftop in Indonesia report.indd 20 11/01/18 10:29 AM
21
A CASE FOR SOLAR ROOFTOP IN INDONESIA
Feed-in-tariffs — an option miscalculated
In February 2017, the Indonesian government adopted an entirely new feed-in-tariff (FiT) mechanism for the renewable energy sector, including solar. While the FiTs were earlier fixed by the government, these are now to be determined based on negotiations between PLN and IPPs, subject to a cap determined by regional electricity supply costs. The FiT for all renewable energy projects (other than geothermal and waste-to-energy) has been capped at 85 per cent of the regional electricity generation cost, if the regional cost is above the national average. This cap is equal to the regional cost if it is lower than the national average.
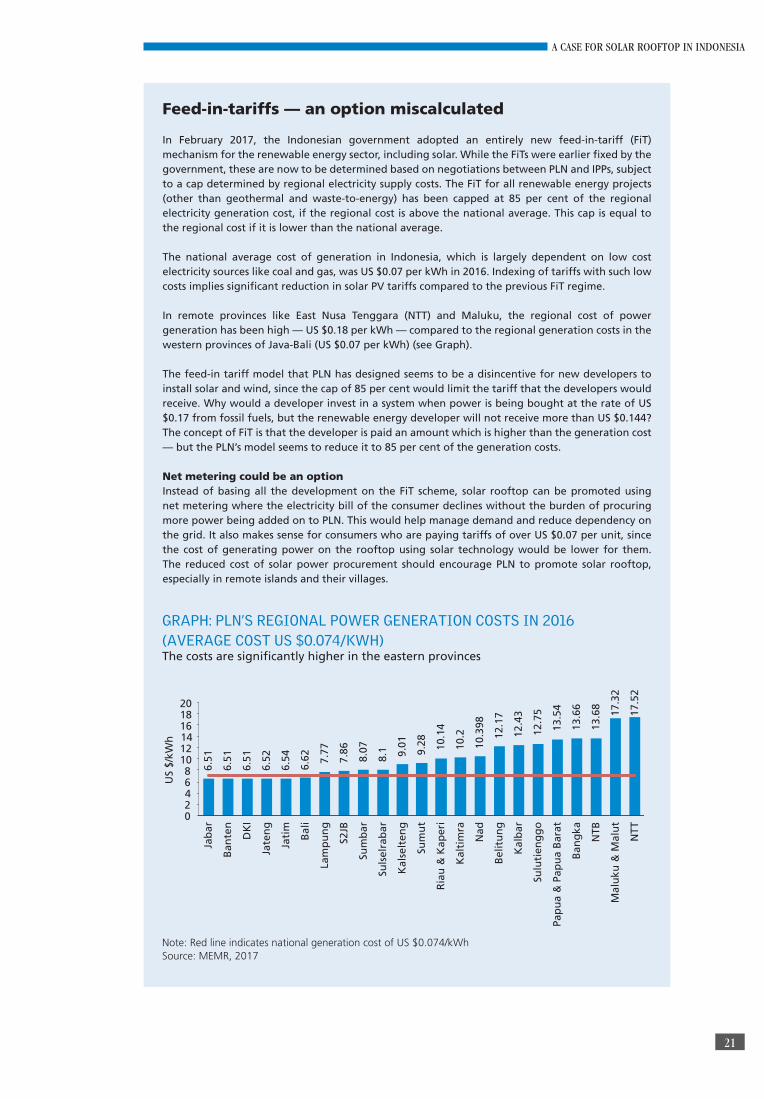
The national average cost of generation in Indonesia, which is largely dependent on low cost electricity sources like coal and gas, was US $0.07 per kWh in 2016. Indexing of tariffs with such low costs implies significant reduction in solar PV tariffs compared to the previous FiT regime. In remote provinces like East Nusa Tenggara (NTT) and Maluku, the regional cost of power generation has been high — US $0.18 per kWh — compared to the regional generation costs in the western provinces of Java-Bali (US $0.07 per kWh) (see Graph).
The feed-in tariff model that PLN has designed seems to be a disincentive for new developers to install solar and wind, since the cap of 85 per cent would limit the tariff that the developers would receive. Why would a developer invest in a system when power is being bought at the rate of US $0.17 from fossil fuels, but the renewable energy developer will not receive more than US $0.144? The concept of FiT is that the developer is paid an amount which is higher than the generation cost — but the PLN’s model seems to reduce it to 85 per cent of the generation costs.
Net metering could be an optionInstead of basing all the development on the FiT scheme, solar rooftop can be promoted using net metering where the electricity bill of the consumer declines without the burden of procuring more power being added on to PLN. This would help manage demand and reduce dependency on the grid. It also makes sense for consumers who are paying tariffs of over US $0.07 per unit, since the cost of generating power on the rooftop using solar technology would be lower for them. The reduced cost of solar power procurement should encourage PLN to promote solar rooftop, especially in remote islands and their villages.
GRAPH: PLN’S REGIONAL POWER GENERATION COSTS IN 2016 (AVERAGE COST US $0.074/KWH)The costs are significantly higher in the eastern provinces
6.51
6.51
6.51
6.52
6.54
6.62
7.77
7.86
8.07
8.1 9.01
9.28
10.1
4
10.2
10.3
98
12.1
7
12.4
3
12.7
5
13.5
4
13.6
6
13.6
8
17.3
2
17.5
2
0 2 4 6 8
10 12 14 16 18 20
Jab
ar
Ban
ten
DK
I
Jate
ng
Jati
m
Bal
i
Lam
pu
ng
S2JB
US
$/kW
h
Sum
bar
Suls
elra
bar
Kal
selt
eng
Sum
ut
Ria
u &
Kap
eri
Kal
tim
ra
Nad
Bel
itu
ng
Kal
bar
Sulu
tien
gg
o
Pap
ua
& P
apu
a B
arat
Ban
gka
NTB
Mal
uku
& M
alu
t
NTT
Note: Red line indicates national generation cost of US $0.074/kWhSource: MEMR, 2017
A Case for Solar Rooftop in Indonesia report.indd 21 11/01/18 10:29 AM
22
A CASE FOR SOLAR ROOFTOP IN INDONESIA
CONCLUSION
Rooftop solar should have a big and immediate role to play in the Indonesian energy sector. It
must not wait till 2022 when PLN thinks grid parity would be achieved. Grid parity is already
on the cusp and it is time to create support mechanism to help this sector grow.
1. The cost of solar rooftop has declined and is in the range of US $0.06-0.13 per unit,
according to some studies. In many places in Indonesia, the electricity tariff is much
higher than rooftop tariff, so installing these systems for personal use can yield financial
benefits for the consumers, especially if net metering is introduced in the country.
2. Electricity tariffs in Indonesia have gone through various revisions and have increased
every year — investing in solar rooftop systems makes sense because of this as well.
Segments of population which pay around US $0.10 per unit for electricity, should move
to solar rooftop to partially offset the electricity supply from the grid.
3. The supply from PLN is not reliable and differs in quality from place to place. Investing
in solar rooftop, therefore, makes sense to ensure cheaper and qualitatively better supply,
with reduced dependence on PLN. This can also save money for PLN, by providing it the
option of doing away with expensive solutions like the floating power plant.
4. For the 900 permanently inhabited Islands, solar rooftop or a mini-grid system is a far
better and cheaper option than expensive and polluting diesel power.
5. Solar rooftop can be an effective means for meeting the increasing demand for power,
without wasting money on large projects with high gestation periods and grid investments.
Decentralised generation can save money by reducing the T&D losses and the burden on
the land.
A Case for Solar Rooftop in Indonesia report.indd 22 11/01/18 10:29 AM
23
A CASE FOR SOLAR ROOFTOP IN INDONESIA
ANNEXURE
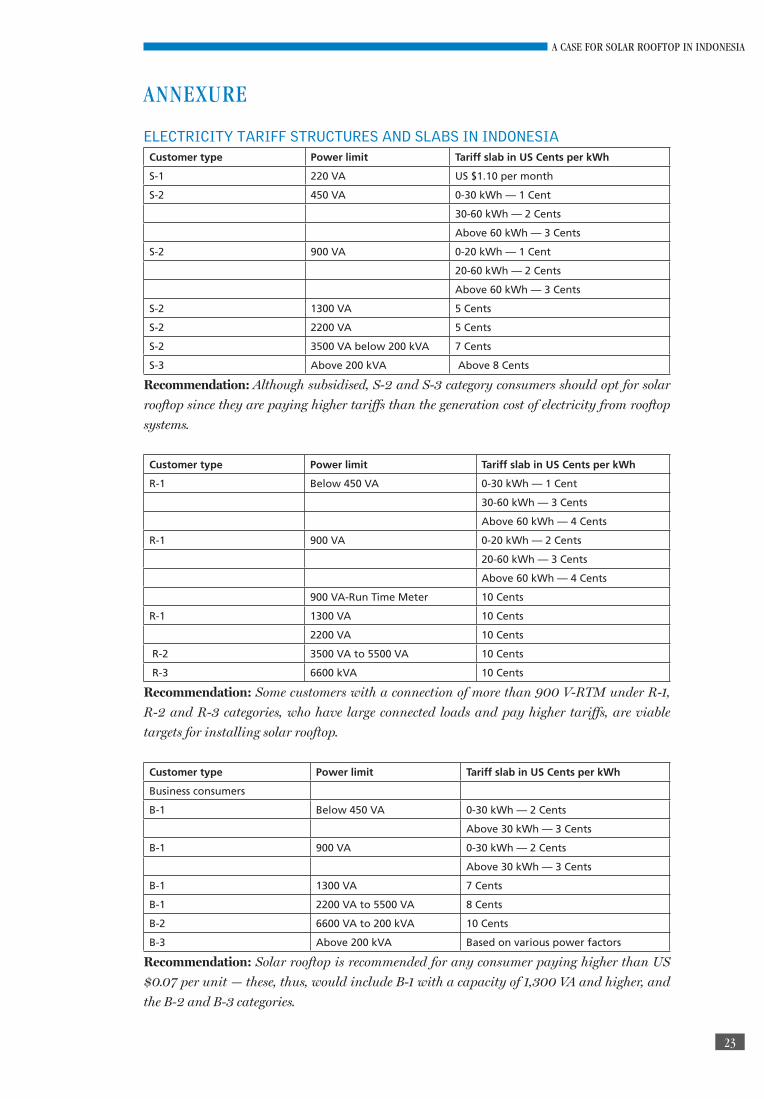
ELECTRICITY TARIFF STRUCTURES AND SLABS IN INDONESIACustomer type Power limit Tariff slab in US Cents per kWh
S-1 220 VA US $1.10 per month
S-2 450 VA 0-30 kWh — 1 Cent
30-60 kWh — 2 Cents
Above 60 kWh — 3 Cents
S-2 900 VA 0-20 kWh — 1 Cent
20-60 kWh — 2 Cents
Above 60 kWh — 3 Cents
S-2 1300 VA 5 Cents
S-2 2200 VA 5 Cents
S-2 3500 VA below 200 kVA 7 Cents
S-3 Above 200 kVA Above 8 Cents
Recommendation: Although subsidised, S-2 and S-3 category consumers should opt for solar
rooftop since they are paying higher tariffs than the generation cost of electricity from rooftop
systems.
Customer type Power limit Tariff slab in US Cents per kWh
R-1 Below 450 VA 0-30 kWh — 1 Cent
30-60 kWh — 3 Cents
Above 60 kWh — 4 Cents
R-1 900 VA 0-20 kWh — 2 Cents
20-60 kWh — 3 Cents
Above 60 kWh — 4 Cents
900 VA-Run Time Meter 10 Cents
R-1 1300 VA 10 Cents
2200 VA 10 Cents
R-2 3500 VA to 5500 VA 10 Cents
R-3 6600 kVA 10 Cents
Recommendation: Some customers with a connection of more than 900 V-RTM under R-1,
R-2 and R-3 categories, who have large connected loads and pay higher tariffs, are viable
targets for installing solar rooftop.
Customer type Power limit Tariff slab in US Cents per kWh
Business consumers
B-1 Below 450 VA 0-30 kWh — 2 Cents
Above 30 kWh — 3 Cents
B-1 900 VA 0-30 kWh — 2 Cents
Above 30 kWh — 3 Cents
B-1 1300 VA 7 Cents
B-1 2200 VA to 5500 VA 8 Cents
B-2 6600 VA to 200 kVA 10 Cents
B-3 Above 200 kVA Based on various power factors
Recommendation: Solar rooftop is recommended for any consumer paying higher than US
$0.07 per unit — these, thus, would include B-1 with a capacity of 1,300 VA and higher, and
the B-2 and B-3 categories.
A Case for Solar Rooftop in Indonesia report.indd 23 11/01/18 10:29 AM
24
A CASE FOR SOLAR ROOFTOP IN INDONESIA
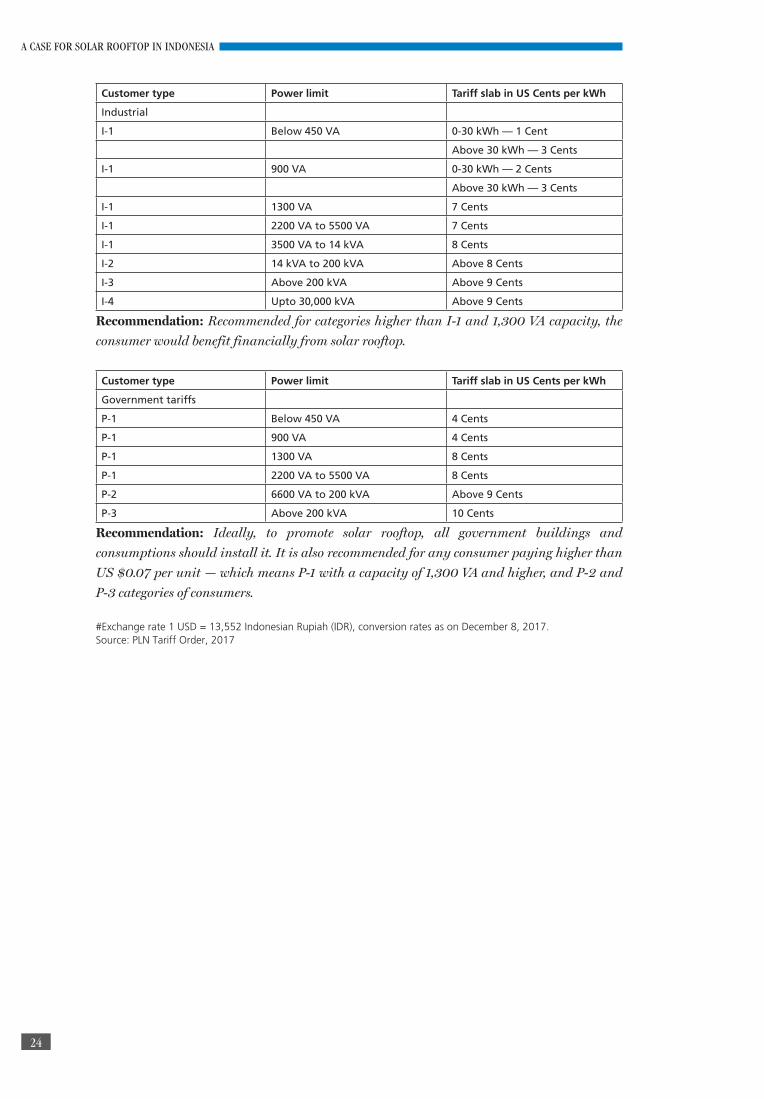
Customer type Power limit Tariff slab in US Cents per kWh
Industrial
I-1 Below 450 VA 0-30 kWh — 1 Cent
Above 30 kWh — 3 Cents
I-1 900 VA 0-30 kWh — 2 Cents
Above 30 kWh — 3 Cents
I-1 1300 VA 7 Cents
I-1 2200 VA to 5500 VA 7 Cents
I-1 3500 VA to 14 kVA 8 Cents
I-2 14 kVA to 200 kVA Above 8 Cents
I-3 Above 200 kVA Above 9 Cents
I-4 Upto 30,000 kVA Above 9 Cents
Recommendation: Recommended for categories higher than I-1 and 1,300 VA capacity, the
consumer would benefit financially from solar rooftop.
Customer type Power limit Tariff slab in US Cents per kWh
Government tariffs
P-1 Below 450 VA 4 Cents
P-1 900 VA 4 Cents
P-1 1300 VA 8 Cents
P-1 2200 VA to 5500 VA 8 Cents
P-2 6600 VA to 200 kVA Above 9 Cents
P-3 Above 200 kVA 10 Cents
Recommendation: Ideally, to promote solar rooftop, all government buildings and
consumptions should install it. It is also recommended for any consumer paying higher than
US $0.07 per unit — which means P-1 with a capacity of 1,300 VA and higher, and P-2 and
P-3 categories of consumers.
#Exchange rate 1 USD = 13,552 Indonesian Rupiah (IDR), conversion rates as on December 8, 2017.Source: PLN Tariff Order, 2017
A Case for Solar Rooftop in Indonesia report.indd 24 11/01/18 10:29 AM
25
A CASE FOR SOLAR ROOFTOP IN INDONESIA
REFERENCES
1. IEA (2014). National Energy Policy (Government Regulation No. 79/2014), Paris,
France, https://www.iea.org/policiesandmeasures/pams/indonesia/name-140164-en.
php
2. PwC (2016), Power in Indonesia-Investment and Taxation Guide 2016, PwC Network,
Jakarta, Indonesia
3. Cornot-Gandolphe, S. (2017), Indonesia’s electricity demand and the coal sector: export
or meet domestic demand,Oxford: Oxford Institute for Energy Studies, United Kingdom
4. Indonesia Investments (August 16, 2014). Electricity in Indonesia: Plenty Natural
Resources but Shortage of Electricity, Delft, the Netherlands. https://www.indonesia-
investments.com/news/todays-headlines/electricity-in-indonesia-plenty-natural-
resources-but-shortage-of-electricity/item2325
5. Tharakan, P. (2015), Summary of Indonesia’s Energy Sector Assessment, ADB Papers on
Indonesia, No. 09, December 2015, Manila, Philippines
6. PwC (2016). Power in Indonesia-Investment and Taxation Guide 2016, PwC Network,
Jakarta, Indonesia
7. Martinot, Eric et al (2006), Renewables global status report - 2006 Update (INIS-
FR—15-0646), France
8. Ibid
9. REN21 (2017), Renewables global status report - 2017, Renewable Energy Policy
Network, Paris, France, http://www.ren21.net/gsr-2017/pages/summary/summary/
10. GTM Research (2017), Global Solar Demand Monitor Q1 2017, Greentech Media,
Boston, USA.
11. IEA (2014). Technology Roadmap — Solar Photovoltaic Energy, 2014 edition, OECD/
IEA, Paris.
12. IbanVendrell (2017) Solar PV Rooftop Projects for Developing Countries in Asia:
Benchmarking of Generation Cost and Successful Development Approach, Presentation
Made on behalf of Mott MacDonald on 07/06/2017 in Jakarta, Indonesia.
13. IbanVendrell (2017) Solar PV Rooftop Projects for Developing Countries in Asia:
Benchmarking of Generation Cost and Successful Development Approach, Presentation
Made on behalf of Mott MacDonald on 07/06/2017 in Jakarta, Indonesia.
14. KarlisSalna (June 14, 2017), Indonesia Grapples With Inflation Dilemma as Subsidies
Cut, Bloomberg, https://www.bloomberg.com/news/articles/2017-06-13/indonesia-
subsidy-cuts-pit-inflation-risks-against-budget-goals
15. Reuters (June 11, 2014), Indonesia plans $720 mln cut to 2014 electricity subsidy
bill, Jakarta, Indonesia, https://af.reuters.com/article/commoditiesNews/
idAFL4N0OS2QA20140611
16. ASEAN (July 20, 2017), The Status of Electricity Subsidy Reform in Indonesia, ASEAN
Centre for Energy, Jakarta, Indonesia
17. Prayas-WRI (2017), Electricity Supply Monitoring Initiative (ESMI),by using the tool
meant for ESMI-monitored locations in Indonesia, http://www.watchyourpower.org/
location_map.php
18. Tharakan, P, (2015), Summary of Indonesia’s Energy Sector Assessment, ADB Papers on
Indonesia No.9, December 2015, ADB, Manila, Philippines
19. Muklis Ali and Ed Davis (July 28, 2008), ‘Creaking Indonesia power grid drags on
business’, Reuters, Jakarta, Indonesia, https://www.reuters.com/article/us-indonesia-
power/creaking-indonesia-power-grid-drags-on-business-idUSJAK16127820080728
A Case for Solar Rooftop in Indonesia report.indd 25 11/01/18 10:29 AM
26
A CASE FOR SOLAR ROOFTOP IN INDONESIA
20. GRES News (December 9, 2015), Indonesia Leases Turkish Floating Power Plants, http://
gres.news/news/economy/102319-indonesia-leases-turkish-floating-power-plants-/0/
21. World Bank (2016), Indonesia’s Urban Story, June 14, 2016, Published Online, http://
www.worldbank.org/en/news/feature/2016/06/14/indonesia-urban-story as accessed
on December 14, 2017
22. IEA-ETSAP and IRENA (April 2015), Renewable Energy Integration in Power Grids -
Technology Brief, IRENA, Abu Dhabi, UAE, http://www.irena.org/DocumentDownloads/
Publications/IRENA-ETSAP_Tech_Brief_Power_Grid_Integration_2015.pdf
23. Agora Energiewende (2015): The Integration Cost of Wind and Solar Power. An Overview
of the Debate on the Effects of Adding Wind and Solar Photovoltaic into Power Systems,
Berlin, Germany, https://www.agora-energiewende.de/fileadmin/Projekte/2014/
integrationskosten-wind-pv/Agora_Integration_Cost_Wind_PV_web.pdf
A Case for Solar Rooftop in Indonesia report.indd 26 11/01/18 10:29 AM

A Case for Solar Rooftop in Indonesia report.indd 27 11/01/18 10:29 AM

28
A CASE FOR SOLAR ROOFTOP IN INDONESIA
Centre for Science and Environment41, Tughlakabad Institutional Area, New Delhi 110 062, India Ph: +91-11-40616000 Fax: +91-11-29955879E-mail: [email protected] Website: www.cseindia.org
INTERNATIONAL SOLAR ALLIANCENational Institute of Solar EnergyGwalpahari, Gurugram, Haryana 122 005, IndiaPh: +91-124-2853068Website: www.isolaralliance.org
A Case for Solar Rooftop in Indonesia report.indd 28 11/01/18 10:29 AM