Embed Size (px)
Citation preview

IESE Business School-University of Navarra - 1
A CAPACITATED COMMODITY TRADING MODEL WITH MARKET POWER
Victor Martínez-de-Albéniz
Josep Maria Vendrell Simón
IESE Business School – University of Navarra Avda. Pearson, 21 – 08034 Barcelona, Spain. Tel.: (+34) 93 253 42 00 Fax: (+34) 93 253 43 43 Camino del Cerro del Águila, 3 (Ctra. de Castilla, km 5,180) – 28023 Madrid, Spain. Tel.: (+34) 91 357 08 09 Fax: (+34) 91 357 29 13 Copyright © 2008 IESE Business School.
Working Paper
WP no 728
January, 2008

IESE Business School-University of Navarra
A CAPACITATED COMMODITY TRADING
MODEL WITH MARKET POWER
Victor Martínez-de-Albéniz¹
Josep Maria Vendrell Simón²
Abstract
We consider in this paper the problem of a trader that may purchase a commodity in one
market and resell it in another. The trader is capacitated: the trading volume is limited by
operational constraints, e.g., logistics. The two markets quote different prices, but the
spread is reduced when trading takes place. We are interested in finding the optimal trading
policy across the markets so as to obtain the maximum profit in the long-term, taking into
account that the trading activity influences the price processes, i.e., market power. Similarly
to the no-market-power case, we find that the optimal policy is determined by three regions
where (1) move as much as possible from one market to the other; (2) the same in the
opposite direction; or (3) do nothing. We finally use the model to analyze the kerosene
price differences between New York and Los Angeles.
1 Professor, Production, Technology and Operations Management, IESE
2 Assistant Research, IESE
2 - IESE Business School-University of Navarra
A CAPACITATED COMMODITY TRADING MODEL WITH MARKET POWER
1 Introduction
Commodities are the building block of a large part of our economy. Examples include not only minerals, metals and agricultural products such as iron ore, aluminum, silver, gold, sugar, coffee, rice, wheat, but also energy sources such as coal, oil, and natural or liquified gas, and even intermediary or manufactured products such as chemicals or generic drugs. They are nowadays relatively easily traded, can be physically delivered anywhere in the world, and sometimes can be stored for a reasonable period of time. The volume of commodity trading in the world is colossal: in 2006, more than 91 million 60-kg coffee bags were traded, more than 84 million barrels of oil are daily consumed, etc. Commodities are traded in very active markets, such as the Chicago Board of Trade (CBOT), the New York Mercantile Exchange (NYMEX), or the London Metal Exchange (LME), to cite a few. Prices are usually determined by market forces, rather than by the large suppliers or large buyers, with the exception perhaps of the Organization of the Petroleum Exporting Countries (OPEC). Spot prices at commodity markets exhibit several salient features: they are highly autocorrelated, and very volatile with rare but violent explosions in price. The volatility has been explained by inventory holding dynamics: where speculators carry inventory, the price remains stable, but when they are out-of-stock, the price fluctuates wildly, see Deaton and Laroque (1992).

It is commonly assumed that the price of a commodity is the same in any point in the
world, as occurs for stocks or bonds. This is not so, as the price in each location is adjusted for
logistics costs and local market conditions (local balance of supply and demand) among others.
For example, a coffee producer with a several factories in Europe will pay the different prices
for deliveries in each one of the factories. One would assume that these differences are very
small, or at least stable over time. As a matter of fact, the opposite is true, and price spreads,
i.e., price difference between two locations, can be significant in the short term. As an example,
which we analyze in detail in §6.1, we show in Figure 1 the evolution of kerosene jet-fuel spot
prices, in New York and Los Angeles, over more than fifteen years. As can be seen in the left
figure, the evolution of the price in these two locations is very similar. This implies that in
the long-run the price spread is small. However, when examining, in the right figure, the price
differences over the period, it is surprising to see short-run spreads of tens of cents of a dollar.
Cents per Gallon (USD)
Cents per Gallon (USD)
Figure 1: Plot of kerosene jet-fuel daily spot prices on the left (in USD cents per Gallon) in New York and
Los Angeles, and the corresponding spread (price difference) Gt = PNYt − PLA
t .
In such market, there is a good opportunity for commodity traders to enter the market,
and, in the short-run, make a profit. In stock and bond markets, these constitute arbitrage
opportunities that disappear as soon as they appear. For commodities, however, it takes time
for traders to close the price spreads to its average levels. In order to understand the market,
it is important to elucidate how a trader should behave, according to its own trading capacity.
Trading capacity may consist of shipping from one market to the other, which may be costly, for
example. We must of course consider that the trading activity has an impact on the price levels
in each market, i.e., the price at a location increases if a trader buys from it, and decreases if
he sells to it: each trader has market power.
2

In the current paper, we propose an analytical model of commodity trading in the presence
of market power, which is new to the literature. We establish the rational behavior of traders
between two markets and derive price spread dynamics based on the trading volumes. We
consider two markets of commodities that quote different prices, and a trader is capable of
purchasing in one market to resell in the other, within a trading capacity. For simplicity, we
consider only two markets and assume that the inventory present between the two markets
is constant, i.e., the amount stored is fixed (and is directly linked to the trading capacity).
We first establish the structure of the optimal trading policy. This policy determines, given
a realization of the current price spread between the two markets, how much (if any) volume
must be bought/sold from/at the first market and sold/bought at/from the second market, so
that the long-run average profit is maximized. When optimizing, the trader takes into account
its impact on future spreads. We then describe the parameters of the optimal policy and we
apply our model to kerosene prices in New York and Los Angeles, and illustrate the insights
derived.
This model can be used for many different purposes. At an operational level, it allows the
trader to specify when and how much to trade. At a more tactical and strategic level, the
trader can predict the price spread distribution by looking at the trading capacity used for
each spread level, and evaluate the impact of trading capacity additions.
The rest of the paper is organized as follows. In §2, we review the previous literature and how
our paper is related to it. §3 describes in detail the model with its assumptions and notation.
Then, in §4 we present the results for different market situations (monopoly, oligopoly), together
with the optimality equations that characterize the optimal policy, and a numerical sensitivity
analysis. §5 discusses several extensions of the basic model set-up. Finally, in §6 we show an
application of our model to kerosene prices and discuss future research directions.
2 Literature Review
There is significant research on commodity prices and commodity trading, with at least two
different literature streams: the first one, from economics and finance, and the second one, from
operations management.
The first research stream studies the properties of commodity price evolution in established
markets. One of the first important papers in this area is Deaton and Laroque (1992), which
show that commodity prices have high autocorrelation and variability. They develop a rational
expectations model for commodity prices that explains these features. They base their model
on supply/demand forces and in particular on the existence of competitive speculators that hold
3

inventory of the commodity, with which they expect to buy low and sell high. This behavior
results in commodity prices normally staying within some limited range; here, speculators
will build inventory when the price is low, and deplete it when it is high. As a result, the
speculators act as regulators of the commodity prices. Sometimes, however, when supply and
demand shocks push the price high, the speculators may run out of inventory, and hence spikes
in prices will occur. Deaton and Laroque (1996) extend this work and find that speculation
only is not enough to explain the high positive autocorrelation in observed commodity prices
and that part of it is caused by the underlying processes of supply and demand.
Williams and Wright (1991), Chambers and Bailey (1996) and Routledge et al. (2000)
also use a competitive rational expectations model to explain the properties of commodity
prices in markets. They all consider the existence of convenience yield, which is defined in
Hull (2003) as a measure of the benefits from owning a commodity asset versus holding a long
futures contract on the asset. This is generally positive since carrying inventory allows the
owner to make profits from trading opportunities that may arise, for instance from temporary
local shortages; on the other hand, holding a futures contract does not allow it. For example,
an oil refiner is unlikely to regard a futures contract on crude oil as equivalent to crude oil
held in inventory: the crude oil in inventory can be an input to the refining process whereas
a futures contract cannot be used for this purpose. The convenience yield typically reflects
the market’s expectations concerning the future availability of the commodity. As noted in
Hull (2003), the greater the chances that shortages will occur, the higher the convenience
yield. One can describe spot prices evolution by modeling convenience yields and spot prices as
separate stochastic processes, possibly correlated, see Gibson and Schwartz (1990). Schwartz
(1997) develops three variations of a mean-reverting stochastic model driven by one, two or
three factors taking into account mean reversion of commodity prices, convenience yields and
stochastic interest rates. Schwartz and Smith (2000) provide a two-factor stochastic spot price
model determined by the combination of short-term and long-term factors, that allow volatility
in both terms. This two-factor model is equivalent to the stochastic convenience yield model
developed in Gibson and Schwartz (1990). These models are empirically validated for copper,
gold and crude oil. Our paper does not directly model mean-reverting spot price processes or
convenience yields, as in these papers, but focuses instead on modeling price spreads.
Routledge et al. (1998) consider the correlation between prices of different commodities
within broad families (e.g., natural gas and electricity in energy). They model the substitutabil-
ity of these commodities and find existence of equilibrium price processes, where rational agents
convert one commodity into the other. In particular, they focus on natural gas and electricity,
and analyze the spread (price difference) between these two commodities. This is known in the
4

industry as the spark spread, and is used extensively by commodity traders. The industry also
uses the dark spread, i.e., the spread between coal and electricity prices. In our paper, we focus
on price spreads between different geographical locations, although the work could be extended
to spreads between different commodities, as discussed in §6.2. We take a similar approach,
and specifically consider the individual operational actions of rational traders, which allows us
to describe in closed-form the agents’ actions.
A second stream of literature on commodities exists in operations management. The papers
in this group typically focus on the management of inventory of commodities, in the presence
of price uncertainty, with buy/sell decisions in a single market. There is extensive literature on
inventory management models, see for example Zipkin (2000). We refer readers to Goel and
Gutierrez (2004, 2006, 2007), and references therein for specific applications into commodities.
These papers try to incorporate the information given by the convenience yield in the inventory
and buy/sell decisions, e.g., Caldentey et al. (2007) for copper mining operations in Chile, where
they use the stochastic process in Schwartz (1997) to model copper spot prices. In this sense,
they try to combine finance and operations models.
In this group, Golabi (1985) models the prices of the commodity in future periods as random
variables with known distribution functions. Assuming constant demand, he proves that a
sequence of critical price levels at a given period determines the optimal ordering strategy. Wang
(2001) proves that a myopic inventory policy is optimal for a multi-period model with stochastic
demand and decreasing prices. Secomandi (2005) considers optimal commodity trading and
provides a much more detailed view of the operations involved in trading. He focuses on
storage assets, i.e. storage facilities or contracts that ensure that one will have the inventory at
a pre-determined time. His model is based on inventory and well-behaved flow constraints. He
shows that the optimal policy is, depending on the region, to buy and withdraw, to do nothing
or to sell and inject. This type of policy is used for contract valuation in Secomandi (2004) and
Wang et al. (2007).
Our work combines the ideas of price equilibrium, from economics and finance, together
with a more detailed view of operations, as in Secomandi (2005). We are specifically interested
in optimizing the inventory management policy, given that the trading activity may influence
the price spread process.
5

3 The Model
3.1 Two Markets
Consider the trading of a single commodity in two locations, A and B. Each one of these
locations has its own local dynamics, and as a result the price at which the commodity trades
in each place may be different. As mentioned in the introduction, for kerosene prices, these
local price differences can be significant, see the descriptive statistics presented in §6.1.
Trading may also occur between A and B. In particular, traders may choose to buy in
one place and ship the commodity, at a cost, to the other. In reality, shipping of physical
commodities cannot be done immediately, and is only feasible after a certain lead-time. For the
sake of simplicity (and tractability), however, we assume that this lead-time is zero. Implicitly,
we are assuming that at any given time, what is bought in one location is sold at the other.
Thus, our basic model describes a pipeline, where no intermediate storage is allowed. In other
words, a trader simply opens a faucet so that the commodity flows from A to B or vice-versa.
We consider in addition that the pipeline capacity is given by the maximum achievable flow,
in units per period. Note that the model could also handle a shipping process that does not
involve a pipeline, as long as the inventory level in each part of the route remains constant.
For instance, consider a set of trucks or ships that on each day can move towards A or towards
B (all together). The quantity originating in A and arriving in B will be identical, and will
be constrained by the maximum speed in the system. We denote by qAB the trading capacity
from A to B, per period, and qBA the one from B to A.
In addition, we consider constant linear trading costs. We denote cAB the cost of moving
one unit from A to B, and cBA from B to A. Using constant linear costs is a strong assumption,
since it is independent of the price of the commodity1, but it has been made before in the
literature, e.g., Goel and Gutierrez (2006).
Let uABt and uBA
t be the trading quantity from A to B and from B to A respectively, at
time t. The capacity constraint implies that
0 ≤ uABt ≤ qAB and 0 ≤ uBA
t ≤ qBA
and the trading cost incurred is equal to cABuABt + cBAuBA
t .
The trading policy, if decided rationally, should obviously depend on the prices quoted in A
and B. For example, when PBt −PA
t > cAB, it is profitable to trade from A to B. Clearly, if the1For instance, if the trading cost is a fraction of the dollar volume of trade, the cost would be a constant times the spot
price at the buying market times the trading quantity. While this is numerically solvable, the analysis becomes intractable,
see §5.2.
6

current trading activity does not influence the future prices, the trader would try to maximize
the present profit from trading at t, i.e.,
maxuAB ,uBA≥0
(PBt − PA
t )(uABt − uBA
t )− cABuABt − cBAuBA
t .
It is easy to see that the optimal policy is such that either uABt = 0 or uBA
t = 0 and
ut := uABt − uBA
t =
qAB if PBt − PA
t ≥ cAB
0 if cAB ≥ PBt − PA
t ≥ −cBA
−qBA otherwise.
In other words, we will trade at maximum capacity provided that the price spread is bigger
than the trading cost. As noted before, if PAt and PB
t are independent of the trading quantities,
this trading policy is optimal, as shown in Secomandi (2005).
Of course, if many traders follow this type of policy, the price at the cheaper market would
rise and the price at the other market would go down, so the spread would tend to close over
time. Hence, it is clear that the trading volume must impact the prices in the future. If this
was not the case, we would see large spreads between locations, and more importantly, that
these spreads may not close over time.
As a result, if the trading quantities do influence future prices, it is no longer clear what
type of policy is now optimal for the trader. This requires modeling the relationship between
global trading policies and the price spread process. This is done in the next section.
3.2 The Price Processes
We model time as a continuous variable, t ≥ 0, and we denote the price of the commodity in
markets A and B as PAt and PB
t respectively. In the previous section, we have defined the net
trading quantity at time t as ut := uABt − uBA
t . Using the same notation, vt := vABt − vBA
t
denotes what the other players in the market (competitors) trade from A to B. Of course, this
is positive when the quantity flows from A to B and negative otherwise.
We model the the price processes at A and B as correlated random walk, i.e.,
(dPA
t
dPBt
)=
(α(PA
t , PBt ) + βA(ut + vt)
α(PAt , PB
t )− βB(ut + vt)
)dt +
(σA1 σA2
σB1 σB2
)(dW 1
t
dW 2t
)(1)
where W 1t and W 2
t are independent Wiener processes, α can be any exogenous function, and
βA, βB, σ··· ≥ 0.
As we can observe, the trade between A and B has a direct impact on the prices process,
which captures the players’ market power. Specifically, the total net trade from A to B at t,
7

PIPELINE:capacity & costA B
!ABBAqqu ,"#
0 uAB qAB
traded from A to B
0 uBA qBA
traded from B to A
u := uBA-uAB
PA
t PB
t
Figure 2: Summary of model features. The trader can ship uAB units of commodity from A to B and uBA
units from B to A.
i.e., ut + vt, if positive, increases the price at A and decreases it at B. This is qualitatively
intuitive. Furthermore, we model this dependency as linear2.
Notice also that the proposed model could exhibit mean-reversion properties, as long as the
mean-reverting adjustment is the same in both markets. For example, one could let α(PAt , PB
t ) =
κ[µ− (θAPA
t + θBPBt )
], where µ would be the long-term mean price, defined as a weighted
average of prices at A and B.
Finally, in contrast with models in finance, e.g., Schwartz (1997), we consider linear random
walks, instead of geometric ones. Our assumption guarantees tractability of the trading prob-
lem. However, since geometric Brownian motions might be more appropriate, we explore an
alternative model in §5.2.2This is a strong assumption, which is related to having linear price-quantity demand curves.
8

Since the profit captured by the trader depends on the price spread, we define Gt := PBt −PA
t .
From Equation (1), we have that dGt = −(βA + βB)(ut + vt)dt + (σB2 − σA2)dW 2t − (σA1 −
σB1)dW 1t . Thus, Gt is a stochastic process that can be expressed as
dGt = −β(ut + vt)dt + σdWt, (2)
where β = βA + βB, σ2 = (σB2 − σA2)2 + (σA1 − σB1)2 and Wt a Wiener process.
In the remainder of the paper, we assume that the traded quantity vt (related to the rest of
the market) only depends on Gt. This assumption guarantees tractability. As a result, since
both revenue and cost depend only on Gt, it follows that, at optimality, the trader’s policy ut
should only be a function of the spread Gt.3
Hence, considering that ut and vt are functions of Gt only, i.e., ut = u(Gt) and vt = v(Gt),
the random variable G, satisfies the stochastic differential equation dGt = A(G)dWt + B(G)dt,
with A(G) = σ and B(G) = −β(u(G) + v(G)). If for a certain ε > 0, limG→−∞
B ≥ ε and
limG→+∞
B ≤ −ε, G has a stationary probability density function (p.d.f.), denoted f(G), which
satisfies
12A2(G)
∂2f
∂G2−B(G)
∂f
∂G= 0. (3)
This is known as the Kolmogorov equation, and is a backward parabolic partial differential3Thus, in a game setting, this would be a Nash equilibrium, since the best-response to a trading policy that depends only
on Gt is a trading policy that depends only on Gt. This is true when each trader in the market has operating costs cijuijt .
9

equation4. In our case, Equation (3) can be written as
12σ2 ∂2f
∂G2+ β(u(G) + v(G))
∂f
∂G= 0. (4)
Thus, the control u(G) has a direct influence on the p.d.f. of the spread. We denote it by
fu(G) to make that dependency apparent. As an illustration, we show in Figure 3 the stationary
p.d.f. for two controls u, where v ≡ 0.
−20 −15 −10 −5 0 5 10 15 200
0.001
0.002
0.003
0.004
0.005
0.006
0.007
0.008
0.009
0.01
G
Pro
bab
ility
den
sity
fu
nct
ion
−20 −15 −10 −5 0 5 10 15 200
2
4
6x 10
−4
G
Pro
bab
ility
Den
sity
Fu
nct
ion
Figure 3: Stationary p.d.f. of G, with v ≡ 0, β = 1 and σ = 1, where, in the figure on the left, u = −2 for
G < 0 and u = +2 for G ≥ 0; and, in the figure on the right, u = −2 for G < −10, u = 0 for −10 ≤ G < 10
and u = +2 for G ≥ 10.4As we see later on, we are interested in the long term average profits, and hence we do not consider the transients solutions
of the Kolmogorov equation, that involve∂f
∂t. To quickly justify the equation, we can consider the backward problem. The
probability that the spread is G at time t + dt, denoted as f(G, t + dt), depends only on where the spread was at time t, as
we deal with a Markovian process. So we have
f(G, t + dt) = Eφ
[f(G−B(G)dt−A(G)
√dtε, t)
]
where φ(ε) is a Gaussian distribution (Eφ[ε] = 0,Eφ[ε2] = 1, and∫∞−∞ φ(ε)dε = 1). When the p.d.f. is stationary, a second
order Taylor approximation yields
f(G) = f(G, t + dt) =
∫ ∞
−∞f(G−B(G)dt−A(G)
√dtε, t)φ(ε)dε
=
∫ ∞
−∞
[f(G)− ∂f
∂G[B(G)dt + A(G)
√dtε] +
1
2
∂2f
∂G2A(G)2dtε2
]φ(ε)dε
=
∫ ∞
−∞
[f(G)− ∂f
∂GB(G)dt
]φ(ε)dε−
∫ ∞
−∞
∂f
∂GA(G)
√dtεφ(ε)dε +
∫ ∞
−∞
1
2
∂2f
∂G2A(G)2dtε2φ(ε)dε
= f(G)− ∂f
∂GB(G)dt +
1
2
∂2f
∂G2A(G)2dt.
This yields Equation (3). For more references, see Wilmott (1997) for details on the methodology.
10
For simplicity5, we restrict our attention to having both u and v piecewise constant functions.
Now, if u(G) + v(G) is piecewise constant, Equation (4) can be rewritten6 as
u(G) = −σ2
2β
f ′u(G)fu(G)
− v(G). (5)
This explicitly links the traded quantity u to the price spread distribution fu.
3.3 Optimization of Trading Policies
Given a realization of the price spread at time t, Gt, and given capacities qAB, qBA, we are
interested in finding the optimal operating policy u that maximizes the trader’s long-run average
profits. The optimal policy provides, given a price spread between the two markets, where and
how much product to buy and sell. There are two components in the profit: the revenue, Gtut,
and the trading cost, cABu+t + cBAu−t , where a+ = max{a, 0} and a− = max{−a, 0}. In other
words,
J(u) := Eu
[Gtut − cABu+
t − cBAu−t]
(6)
where the expectation is taken with respect to fu, the stationary distribution of Gt. Hence,
the problem in (6) can be equivalently expressed as
J∗ = supu
J(u) =∫ ∞
−∞
(Gu(G)− cABu+(G)− cBAu−(G)
)fu(G)dG
subject to u(G) = −σ2
2β
f ′u(G)fu(G)
− v(G)
−qBA ≤ u(G) ≤ qAB
fu a p.d.f.
(7)
where fu(G) is the spread distribution that depends on our control. This formulation has
the advantage of being quite compact. Alternatively, we could have considered a discounted
profit model, where the control would again depend only on Gt. However, by examining the
alternative formulation,
J(u,G0) = E[∫ ∞
0
(Gtu(Gt)− cABu+(Gt)− cBAu−(Gt)
)e−rtdt
], (8)
one can observe that here we would need to consider the transient distribution of Gt, given
that at time t = 0, G0 is the spread. A discrete version of the problem would raise similar5The model can incorporate non-piecewise linear controls, but the analysis becomes significantly more complex.6As f(G) is a density function, the constant of integration must be 0.
11

complications:
J(G0) = max−qBA≤u≤qAB
{G0u− cABu+ − cBAu− + αEW
[J(G0 − β(u + v(G0))∆t + σ
√∆tW
)]}
(9)
The problem posed by maximizing J(u, G0) in Equation (8) can be solved using optimal control.
Interestingly, as we show in §5.1, the structure of the results that we derive for our basic problem
setting, i.e., focusing on average profits, Equation (7), hold for this alternative formulation.
4 Optimal Trading Policies
After relating the trading quantity to the price spread distribution, we are interested in finding
the optimal policy u that maximizes the trader’s problem (7). We first analyze the case of
“monopoly”, where there are no other traders between A and B (i.e., v ≡ 0) and then solve the
general case.
4.1 Monopoly: v ≡ 0
We consider here an extreme case of our problem: the trader has no competitors trading
between A and B. We call this a monopoly. Note that this does not mean that the trader is a
price-setter in A or B, but rather that he is the only player in the link between A and B. In
this case, Equation (5) can be written as u(G) = −σ2
2β
f ′(G)f(G)
. Intuitively, one would think that
this is the situation in which the trader can make highest profits. The next propositions show
that, in fact, it is optimal to trade as little as possible, unless the price spread is really large,
in order to maximize the average trading profit.
Proposition 1 If
(i) cAB = cBA = 0 and
(ii) v(G) = 0 ∀G,
then any policy is optimal in (7) and J∗ =σ2
2β.
This result is somehow surprising. Indeed, in the short term, it would be better to instantly
gain, at time t, GtqAB if Gt > 0 or −Gtq
BA if Gt < 0. However, by doing this every time, the
trader would quickly modify the spread p.d.f. and push Gt close to zero, which would reduce
future profits. Alternatively, the trader could delay the trade until |Gt| is large, in which case, he
would obtain higher profits, but in fewer occasions. The proposition shows that both strategies
will actually yield the same average profit in the long term when the trading cost is zero. In
12

other words, the overall average benefit does not depend on the concrete feasible policy: it is
the same to trade often, even with small spreads, or to delay the trade until spreads are large.
In contrast, the optimal policy does matter when there are trading costs.
Proposition 2 If
(i) cAB, cBA > 0 and
(ii) v(G) = 0 ∀G,
then the optimal policy for our trading problem (7) is the limit, when M −→∞, of
u(G) =
−qBA if G ≤ M
0 if −M < G ≤ M
qAB if G > M
and yields, at the limit, J∗ =σ2
2β.
Proposition 2 incorporates cost. Proposition 1 implied that when v ≡ 0, and cAB = cBA = 0,
then the average long-run profit is independent of the trading quantity. When the costs are
positive, the policy of not trading anything therefore yields the same average profit, and is
optimal. Since such a policy is actually not feasible (the p.d.f. is not well-defined), we show
that the same objective can be achieved as the limit of feasible policies.
4.2 Oligopoly: v(G) 6= 0
We have so far assumed that the trader was the only player with the ability to trade and
make profits from the price spread. We consider below a market with several competitors.
Competition might change the structure of the optimal policy because the distribution now
also depends on how the competitors influence the market. We have denoted this influence as
v(G), where v(G) is the total net quantity traded from A to B, by all the competitors. In that
case, the control satisfies, from Equation (5),
u(G) = −σ2
2β
f ′(G)f(G)
− v(G).
When there are no trading costs, i.e., cAB = cBA = 0, the objective function can be written
as ∫ ∞
−∞Gu(G)f(G)dG =
∫ ∞
−∞G
(−σ2
2β
f ′(G)f(G)
− v(G))
f(G)dG
=σ2
2β+
∫ ∞
−∞−Gv(G)f(G)dG
13

after integrating by parts Gf ′(G). Hence, the maximization problem is equivalent
supf
∫ ∞
−∞−Gv(G)f(G)dG
subject to −qBA ≤ −σ2
2β
f ′(G)f(G)
− v(G) ≤ qAB
f a p.d.f.
(10)
This reformulation has the advantage that the trading volume u is no longer present. We
can thus optimize directly taking f as the decision variable. The optimization problem can be
fully solved, with the support of a technical lemma (see appendix). In short, we find necessary
conditions that characterize the optimal function f . Since the p.d.f. and the trading quantity
u(G) are directly related, this is equivalent to finding the optimal trading policy.
Proposition 3 If
(i) cAB = cBA = 0 and
(ii) v(G) is non-decreasing, limG→+∞ v(G) > 0 and limG→−∞ v(G) < 0,
then there exists m such that the optimal policy for our trading problem (7) is
u(G) =
{−qBA if G ≤ m
qAB if G > m.
The proposition requires a regularity assumption on v, in order to have a well-defined optimal
policy, and avoid asymptotically optimal solutions, as in Proposition 2. Under such condition,
when there are no costs, we find that the optimal trading policy is to trade as much as possible
from one market to the other, with the trading direction depending on whether the spread G is
higher or lower that a threshold m. We show the result by establishing that, in problem (10),
one of the two constraints onf ′
fis always binding.
We next generalize the preceding results to the general case, with cAB, cBA > 0. In that
case, similarly to Equation (10), the trading problem (7) is equivalent to
supf
∫ ∞
−∞
[−Gv(G)− cBA
(−σ2
2β
f ′(G)f(G)
− v(G))−
− cAB
(−σ2
2β
f ′(G)f(G)
− v(G))+
]f(G)dG
subject to −qBA ≤ −σ2
2β
f ′(G)f(G)
− v(G) ≤ qAB
f a p.d.f.(11)
Solving the problem above yields the following theorem.
14

Theorem 1 If
(i) cAB, cBA > 0 and
(ii) v(G) is non-decreasing, limG→+∞ v(G) > 0 and limG→−∞ v(G) < 0,
then there exists mBA,mAB, such that mBA ≤ mAB, and the optimal policy for our trading
problem (7) is
u(G) =
−qBA if G ≤ mBA
0 if mBA < G ≤ mAB
qAB if G > mAB.
In essence, the optimal trading policy is determined by three regions: [−∞,mBA] where it is
optimal to move as much product as possible from market B to the market A; (mAB,∞], where
the same is true from A to B, the opposite direction; and (mBA,mAB] where it is optimal to do
nothing. This is the same structure as in the case with no market power. In our notation, with
no market power, mBA = −cBA and mAB = cAB. Hence, market power changes the optimal
trading policy by delaying the point where the traders begin to ship product from one market
to the other.
The theorem thus generalizes Propositions 1, 2 and 3. The proof of the theorem is interesting,
as it uses necessary conditions to determine the thresholds mBA, mAB. These conditions are
analyzed in more detail in the next section.
4.3 The Optimal Trading Thresholds
In this section, we establish how to compute the optimal trading policy, or equivalently, the
spread p.d.f. We show as well some properties of the problem depending on the function v(G).
Interestingly, the optimal policy derived in Theorem 1 is given by three optimality equations.
Knowing that the optimal policy is given by two thresholds mBA,mAB, since
−σ2
2β
f ′(G)f(G)
=
−qBA + v(G) if G ≤ mBA
v(G) if mBA < G ≤ mAB
qAB + v(G) if G > mAB
let
ϕ(G) =
e∫ G
mBA (−v(t)+qBA) 2β
σ2 dt if G ≤ mBA
e∫ G
mBA −v(t) 2β
σ2 dt if mBA < G ≤ mAB
e∫ mAB
mBA −v(t) 2β
σ2 dte∫ G
mAB (−v(t)−qAB) 2β
σ2 dt if G > mAB.
(12)
15

Hence, we have that f =ϕ∫∞
−∞ ϕ. We can express the objective function as
W :=
(1∫∞
−∞ ϕdG
)
∫ mBA
−∞
(−Gv(G)− cBAqBA)ϕ(G)dG
+∫ mAB
mBA
−Gv(G)ϕ(G)dG
+∫ ∞
mAB
(−Gv(G)− cABqAB)ϕ(G)dG
. (13)
Maximizing W with respect to mBA and mAB yields the following optimality conditions.
Proposition 4 Consider u be the optimal control as defined in Theorem (1). mBA, mAB and
W are jointly characterized by Equation (13) together with
W =
∫∞mAB −(G− cAB)v(G)ϕ(G)dG∫∞
mAB ϕ, (14)
W =
∫ mBA
−∞ −(G + cBA)v(G)ϕ(G)dG∫ mBA
−∞ ϕ. (15)
With the equations above, we can find numerically the value of the parameters and hence
the optimal function f(G). In addition, under some properties of v(G), the equations allow us
to derive some properties on the optimal thresholds.
Proposition 5 If cAB = cBA, qAB = qBA and v(G) is anti-symmetrical, i.e., v(−G) = −v(G)
for all G, then mBA = −mAB.
Furthermore, for the extreme case where the trader’s capacity is very small (very limited
market power) mBA and mAB are closer to the trading costs.
Proposition 6 If qAB, qBA → 0, then mBA → −cBA and mAB → cAB.
This result shows that our model is robust and that in the limit (when qAB = qBA = 0), our
optimal policy is the same as that of a rational trader with no market power. In addition, one
is able to obtain first-order approximations of mBA and mAB when the capacities qAB, qBA are
small, see Appendix.
Proposition 6 allows us to derive some interesting conclusions in a “perfect” market, where
all traders are small. In that situation, each trader is going to start trading when the spread is
beyond its transaction cost. As a result, there is a direct relationship between traders’ costs,
installed capacities and the market spread long-run distribution. We use this assumption later
16

on, in §6.1, in order to estimate the amount of capacity present in the market based on the
price spread distribution.
4.4 Sensitivity analysis
In this section we show some properties of the model with respect to small changes in the
parameters. We have done so numerically with MATLAB because the analytical expressions for
the partial derivatives are untractable. For this purpose, we have taken two different approaches.
We have implemented the explicit analytical function defined in §4.3 and compared the results
with explicit simulations of concrete policies. The results found in both cases are identical
so our model is robust. Figure 4 is an example of this: the simulated p.d.f. (with 10,000
data points) converges to the analytical p.d.f. Since both approaches yield similar results, we
have used below the analytical implementation because the computations are faster than with
simulations.
−3 −2 −1 0 1 2 30
0.1
0.2
0.3
0.4
0.5
0.6
0.7
0.8
Price Spread G
Pro
bab
ility
den
sity
fu
nct
ion
Simulated p.d.fAnalytical p.d.f
Figure 4: Comparison between the analytical pdf (red) in blue and the simulated pdf (blue).
For given cBA, cAB, qBA, qAB, β, σ, v(·), the optimal thresholds mBA,mAB are found, through
an exhaustive search, even though it would be computationally more efficient just to solve
Equations (13), (14) and (15). We also compute the average profit J∗ defined in (6).
Without lost of generality we have assumed thatσ2
2β= 1. This is a scaling assumption. In
addition, we have considered two main cases:
17

• the symmetric trader: cBA = cBA = c and qBA = qAB = q;
• the uni-directional trader: cBA = ∞, cAB = c and qBA = 0, qAB = q.
For both scenarios, we numerically show the impact of c and q on the optimal average profit
J∗ =σ2
2β−W , and on the thresholds mBA, mAB. Note that for the symmetric trader scenario,
we can apply Proposition 5 and hence mBA = −mAB.
0 1 2 3 4 5 6 7 8 9 100
1
2
3
4
5
6
7
8
9
10
Cost c
mA
B=−
mB
A
q=1q=2
0 1 2 3 4 5 6 7 8 9 101
1.2
1.4
1.6
1.8
2
2.2
2.4
2.6
2.8
3
Capacity q
mA
B=−
mB
A
c=1c=2
0 1 2 3 4 5 6 7 8 9 100
0.1
0.2
0.3
0.4
0.5
0.6
0.7
0.8
0.9
Cost c
J*
q=1q=2
0 1 2 3 4 5 6 7 8 9 100
0.05
0.1
0.15
0.2
0.25
Capacity q
J*
c=1c=2
Figure 5: The symmetric trader. The top figures depict the changes of the optimal mBA,mAB with
changes in c (left) and q (right). The bottom figures show the corresponding changes in average profit
J∗, again with changes in c (left) and q (right). In these figures, we consider that v(G) = 1 when G ≥ 1,
v(G) = −1 when G ≤ −1 and v(G) = 0 otherwise.
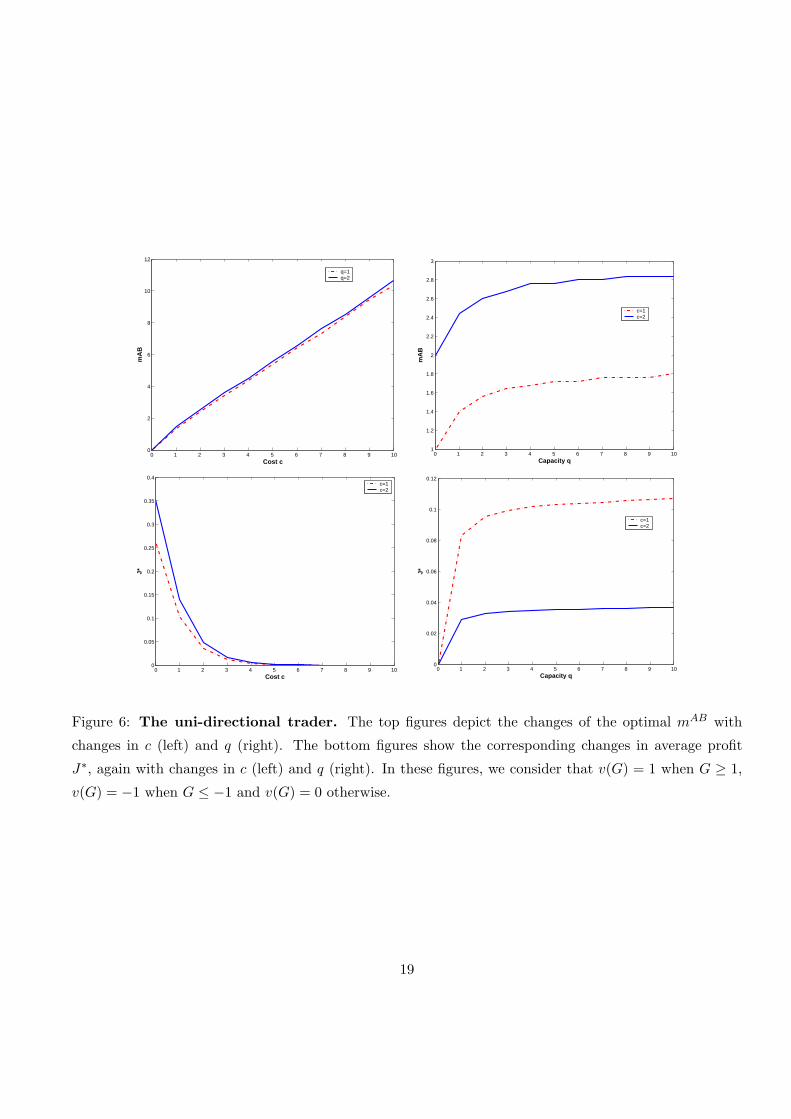
We observe in Figures 5 and 6 that, as one would expect, the trader’s average profit decreases
to zero with cost. Any capacity is actually useless for c ≥ 5, since, as the competitor starts
trading |v| = 1 for |Gt| ≥ 1, the spread never goes above c. The threshold at which the trader
begins to operate is actually very close to the cost, for the entire range.
In addition, the trader’s profit is concave in the capacity, implying decreasing marginal
18
0 1 2 3 4 5 6 7 8 9 100
2
4
6
8
10
12
Cost c
mA
B
q=1q=2
0 1 2 3 4 5 6 7 8 9 101
1.2
1.4
1.6
1.8
2
2.2
2.4
2.6
2.8
3
Capacity q
mA
B
c=1c=2
0 1 2 3 4 5 6 7 8 9 100
0.05
0.1
0.15
0.2
0.25
0.3
0.35
0.4
Cost c
J*
c=1c=2
0 1 2 3 4 5 6 7 8 9 100
0.02
0.04
0.06
0.08
0.1
0.12
Capacity q
J*
c=1c=2
Figure 6: The uni-directional trader. The top figures depict the changes of the optimal mAB with
changes in c (left) and q (right). The bottom figures show the corresponding changes in average profit
J∗, again with changes in c (left) and q (right). In these figures, we consider that v(G) = 1 when G ≥ 1,
v(G) = −1 when G ≤ −1 and v(G) = 0 otherwise.
19

returns on the capacity. The marginal value of capacity is very small for q ≥ 2, since more
capacity tends to reduce the price spreads. As the capacity grows, the threshold also increases,
and can be quite high compared to the cost, e.g., for the symmetric trader, when q = 5, c = 1
and mAB ≈ 1.6.
Interestingly, comparing Figures 5 and 6, one can see that the symmetric trader makes
slightly more than twice the profit for the unidirectional trader. The optimal trading thresholds
are very similar in both cases. This suggests that, in the case of a symmetric trader, the
thresholds could be computed independently, i.e., find mAB using cAB, qAB > 0 and qBA = 0,
and similarly for mBA. This policy would be close to optimal.
5 Extensions
5.1 Discounted Profit Maximization
One of the strong assumptions of our model is that the trader cares about long-term average
profit. This assumption does simplify the analysis, as it allows treating the objective in an
explicit way, and, as a result, computing closed-form thresholds for the optimal policy. In this
section, we complement the analysis with the discounted profit maximization case. We use
optimal control theory to solve the problem. Denoting as J(G0) the profit-to-go, function of
G0, the current price spread, the maximization problem can be written as
max−qBA≤ut≤qAB
J(G0) = E{∫ ∞
0e−rt
(Gtut − cBAu−t − cABu+
t
)dt
}(16)
where r is the instantaneous discount factor, and such that dGt = −β(ut + v(Gt))dt + σdWt
The optimality conditions, see Bertsekas [1], can be captured through the Hamilton-Jacobi-
Bellman (HJB) equation. First, the optimal control u∗(G) is given by
max−qBA≤u≤qAB
(Gu− cBAu− − cABu+
)− β
dJ
dGu.
This implies that u∗(G) = −qBA, 0, qAB. Hence, a bang-bang policy is optimal in this case
as well. In addition, if G − βdJ
dGis increasing when equal to −cBA, 0, cAB, then there exists
mBA,mAB such that u∗(G) = −qBA when G ≤ mBA; u∗(G) = qAB when G ≥ mAB; and
finally, u∗(G) = 0 when mBA ≤ G ≤ mAB 7.
7In that case, the HJB equation satisfies, when G ≤ mBA,σ2
2
d2J
dG2− β(−qBA + v)
dJ
dG− rJ − (G − cBA)qBA = 0; when
G ≥ mAB ,σ2
2
d2J
dG2− β(qAB + v)
dJ
dG− rJ + (G− cAB)qAB = 0; and when mBA ≤ G ≤ mAB ,
σ2
2
d2J
dG2− βv
dJ
dG− rJ = 0.
20

5.2 Alternative Price Processes, Cost Structures and Competitor Actions
One of the main advantages in our model is to be able to recast a problem with two stochastic
processes, PAt and PB
t , into a problem with a single stochastic process Gt = PBt − PA
t . This
can be done under three main assumptions:
• that dGt can be expressed only as a function of Gt (for instance, that the actions of the
competitors vt only depend on Gt, not on (PAt , PB
t ));
• and that the cost function of the trader is linear, which implies that it is independent of
(PAt , PB
t ).
When any of these two assumptions is not satisfied, then the approach developed in the
paper is significantly more complicated. We provide guidelines on how to deal with these more
general models. The generic formulation for the price processes, replacing Equation (1), is:
dPAt =
[αA(PA
t , PBt ) + βA(PA
t , PBt )
(ut + vt(PA
t , PBt )
)]dt + σA(PA
t , PBt )dWA
t
dPBt =
[αB(PA
t , PBt )− βB(PA
t , PBt )
(ut + vt(PA
t , PBt )
)]dt + σB(PA
t , PBt )dWB
t
(17)
One particular case of these is the geometric Brownian motion, where αi = 0, βi = P it β
i,
and σi = P it σ
i, with βi, σi constants.
The objective function thus becomes
J(u) = maxuE
{(PB
t − PAt )u− c
(PA
t , PBt , u
)}
= maxu
∫ ∫ +∞
−∞
[(pB − pA)u(pA, pB)− c
(pA, pB, u(pA, pB)
)]fu(pA, pB)dpAdpB,
where fu satisfies a partial differential equation similar to (3), but in two variables. In this
case, no closed form solution can be easily computed, and fu should be found numerically.
5.3 Trading in a Network
The model developed in this paper considers trading between two pre-determined locations.
However, in reality trading opportunities are possible between many potential origins and des-
tinations. For this purpose, in a network of n points (a connected graph), one can define the
trading quantities between i and j as uij , the existing trading capacity as qij and the trading
unit cost cij . We must also redefine the price process evolution from Equation (1) as
dP it =
α(Pt) +
∑
j 6=i
βij(uijt + vij
t )−∑
j 6=i
βji(ujit + vji
t )
dt + σidW i
t for all i ∈ {1, . . . , n} (18)
21

where Pt = (P 1t , . . . , Pn
t ), and W it are (possibly correlated) Wiener processes.
With this new formulation, similar to §5.2, it is impossible to transform the problem into a
single-dimension state space (the price spread). The analysis consequently becomes intractable,
and numerical methods must be used.
6 Conclusions
6.1 Application to Jet-Fuel (Kerosene) Prices
In this section, we analyze the data of jet-fuel (kerosene) spot prices in two locations: New
York Harbor (NY) and Los Angeles (LA). We have taken the data from the Energy Information
Administration from the U.S.Goverment, see http://www.eia.doe.gov. Our objective here is to
apply our model to the trading between these two locations. Trading, as we use it, can be done
in several forms. For example, one can imagine a dedicated trader that buys kerosene in one
market, loads it in a tank truck (which hold from 4000 to 9000 gallons), and ships it to the
other market. This is an expensive way of trading, and would yield per-gallon costs of the order
of 10 USD cents. The capacity available for this would probably be very large8. Our model can
be used by this trader to optimize his actions. We analyze below the outcome of the actions of
the traders: the spread price process.
The series reflects the spot price in USD cents per gallon from January 1991 to November
2007. We are using prices on markets that open from Monday to Friday, although in a few
cases we do not have data over the entire 5-days week, due to local holidays. As a result, when
calculating the spread series, we have removed the days where information of the price of one or
both locations was missing. These facts (week-ends, holidays and missing data) generate some
complications in our study. In fact, when calculating auto-correlations, i.e., correlations across
successive days, we have to take into account this phenomenon. In other words, although not
having information of the price spread in week-ends, trading on a pipeline or other shipping
systems (e.g., trucks) can occur, moving product from one location to the other. So as a result,
the system has three times more capacity between Friday and Monday than during the week.
Thus, we index the series using natural days, i.e., the time t is indexed from Monday to Sunday.
We have calculated the spread Gt = PNYt − PLA
t . Table 1 provides the basic statistics8One can also think of an airline that flies the NY-LA route and refuels its planes every day in both locations. By buying
a bit more in the cheaper market and a bit less in the more expensive market, this airline is effectively trading between the
two markets. This form of trading is also expensive: a B767-400 consumes 7400 liters per hour, weights 200 tons when fully
loaded, which implies that, shipping one gallon between NY and LA consumes about 0.2 gallons, around 40 USD cents per
gallon traded at 2007 kerosene prices.
22

summary of the series.
Table 1: Basic statistics of Gt = PNYt − PLA
t
Number of observations (market days) 4238
Minimum -53.50
Maximum 44.70
First quartile -6.17
Third quartile -0.25
Mean -3.33
Median -3.25
Variance 41.12
Standard deviation 6.42
Skewness -0.20
Kurtosis 8.28
Notice that the maximum and minimum value of the spread are highly significant as well as
the high variance. These facts are interesting for a player trading in these markets.
It is also interesting to examine the auto-correlation diagram, shown in Figure 7. Using
the time series terminology, the figure is equivalent to the autocorrelation function (ACF)
but taking in account the missing data. In other words, when calculating the autocorrelation
coefficients9 at lag k the terms where Gt and/or Gt+k are missing are not considered. The
slow exponential decay in the ACF is a feature that, for example, autoregressive models (AR)
exhibit, and so does ours. In fact, if the data was modeled with a simple AR(1) process, then
we would have a spread process as follows: Gt−µ = α(Gt−1−µ)+σεt where εt is a white noise,
with mean zero and standard deviation one. This is in some way an alternative to Equation
(2).
More importantly, we depict the spread distribution of the series. Figure (8) shows both
the p.d.f. and its logarithm. In our model, see Equation (5), the slope of the logarithm of
the p.d.f., f ′/f is equal to −2β(u(G) + v(G))/σ2. This can be calculated from the figure. In
other words, we can estimate −2β(u(G)+ v(G))/σ2 from the data. In a sense, this provides an
aggregate measure for the intensity with which the market brings an off-average spread back to
the average. Interestingly, this measure can be well approximated through a piecewise constant
function, as follows.9See Chatfield 2004 for more details.
23

0 5 10 15 20 25 30 35 40 45 500
0.1
0.2
0.3
0.4
0.5
0.6
0.7
0.8
0.9
1
lag
Au
toco
rrel
atio
n c
oef
fici
ent
Figure 7: The autocorrelations for the jet kerosene data taking in account the missing information. The
lag is measured in days.
f ′
f(G) = −2β(u(G) + v(G))
σ2=
0.29 for G ≤ −5.5
0.00 for − 5.5 < G ≤ −1.5
−0.31 for G > −1.5
−20 −15 −10 −5 0 5 10 150
0.02
0.04
0.06
0.08
0.1
0.12
Price Spread G
Pro
bab
ility
den
sity
fu
nct
ion
−20 −15 −10 −5 0 5 10 15−6.5
−6
−5.5
−5
−4.5
−4
−3.5
−3
−2.5
−2
Price Spread G
Log−
prob
abili
ty d
ensi
ty fu
nctio
n
Figure 8: On the left, the shape of the p.d.f. for the data of jet kerosene is similar to what we could have
expected when applying our trading policies. On the right, we show that the linear approximation (dashed
line) fits the logarithm of the p.d.f. well. The vertical line reflects the mean -3.33 USD cents of the data.
Finally, we plot the distribution for a data range of plus/minus two standard deviations.
The approximation fits the data well, as shown in Figure 8. Interestingly, it would be more
accurate than trying to model the spread series as an AR(1) process. Indeed, for an AR(1)
process, Equation (3) would yield to f ′′f ′ = −2(1−α)G
σ2 . Hence the logarithm of the p.d.f. (right-
24

hand side in Figure 8) would exhibit a much larger “convexity” in G, an approximation that
does not fit the data as well as our model.
If all traders are small compared to the market (which seems a reasonable assumption), then
our model would provide a way to estimate how much total trading capacity u(G) + v(G) is
available at each cost level G. This approach can be used to calibrate some of the parameters
of our model. Some more detailed estimates can be obtained by directly expressing all the price
variations, ∆G = Gt+1 −Gt, when Gt ∈ [G − δ,G + δ], as the sum of a constant plus a white
noise. This has the advantage of estimating directly −β(u(G)+v(G)) (the constant) and σ (the
standard deviation of the noise). However, it turns out that the estimates are very noisy, and
only look consistent when we aggregate them significantly (large δ), which is somehow similar
to the estimation performed on f ′/f .
6.2 Discussion
The model presented in this paper analyzes the optimal trading strategy for a capacitated
player between markets. We have focused on two markets only, A and B, where the prices
evolve following a correlated random walk, and are influenced by the trader’s actions. Under
this assumption, we show that it is possible to transform the trader’s decision, based on both
prices (PAt , PB
t ), into one that only depends on the price spread Gt = PBt −PA
t . We characterize
the optimal trading policy, which is described by two thresholds mBA ≤ mAB such that it is
optimal to trade as much as possible (at capacity) from B to A when Gt ≤ mBA, do nothing
when mBA < Gt ≤ mAB, and again trade as much as possible, from A to B this time, when
Gt > mAB. This sort of policy is intuitively optimal when the trader has no impact on future
prices. We show that the structure remains the same even when the trader moves the market.
Interestingly, the thresholds are very close to the trading costs cBA, cAB when the trading
capacity is small, confirming that when the trader is small in the market, then he can safely
assume that he has no market power (although his trading volume has an impact on the long-run
distribution of prices). On the other hand, when the trading capacity is large, the thresholds
can significantly deviate from the trading costs, as shown in §4.4.
In addition to the basic model, we formulate as well several extensions to more general
situations, in particular where the price processes follow other dynamics, e.g., geometric Brow-
nian motion, or the number of markets is larger than two. The trader optimization problem
can there be solved numerically. These extensions can be explored further, and constitute a
promising direction of future research.
Another extension of our model is to integrate the inventory aspect of the trade. We have
25

considered a shipping system where the quantity bought at A is equal to the one sold at B.
This is a fair assumption if we focus on a pipeline. However, if the shipping system is a serial
network of warehouses, then one could consider the possibility of storing inventory somewhere
in that network. The analysis becomes significantly more complex.
Furthermore, we have applied the insights of our model to the analysis of the price spreads
for kerosene, between New York and Los Angeles. While the average spread is of around
-3 dollar cents, the deviations are fairly significant: a standard deviation of 6 dollar cents,
maximum spreads of the order of half a dollar, and sometimes a positive spread for a full
month. Assuming that the market is liquid, i.e., that trader enter the market as soon as the
spread is higher than the transaction cost, our model can be helpful to estimate, for each level
of cost, how much trading capacity is available. Such information can also be used to estimate
the impact of any trading capacity addition into the price spread distribution. The specific
application to kerosene spreads is just an example of what can be achieved with the model, and
many alternative applications are possible, in other industries, such as LNG trade, e.g., using
data from Wang et al. (2007).
Finally, we have interpreted the markets A and B as locations where an identical commodity
is traded. The trading capacity represents the shipping capacity per period available, such as
a pipeline, a system of trucks, etc. Interestingly, there is an alternative interpretation of our
results: A and B could represent two different commodities priced in the same location. There,
the trading capacity would represent the transformation capacity per period. Consider for
example PAt being the price of natural gas, and PB
t the price of electricity, in the same market.
A power generation company could consider its generation capacity as trading capacity from A
to B. Our model would dictate the generation policy for this company, and the distribution of
the price spread (called the spark spread) could be found. Thus, our model is able to describe
analytically what the trader/generator should do. In that respect, our results complement
Routledge et al. (1998).
26

Proofs
Proposition 1
Proof.
E{
Gu(G)}
=∫ ∞
−∞Gu(G)f(G)dG =
∫ ∞
−∞G
(−σ2
2β
f ′(G)f(G)
)f(G)dG =
σ2
2β
∫ ∞
−∞−Gf ′(G)dG =
σ2
2β
after integrating by parts Gf ′(G) and remembering that∫ ∞
−∞f(G)dG = 1 as f is a p.d.f.
Proposition 2
Proof.
E{
Gu(G)− cABu+(G)− cBAu−(G)}
=∫ ∞
−∞
(Gu(G)− cABu+(G)− cBAu−(G)
)f(G)dG
=∫ ∞
−∞
(G
[−σ2
2β
f ′(G)f(G)
]− cAB
[−σ2
2β
f ′(G)f(G)
]+
− cBA
[−σ2
2β
f ′(G)f(G)
]−)f(G)dG
=σ2
2β− cAB
∫ ∞
−∞
[−σ2
2βf ′(G)
]+
dG− cBA
∫ ∞
−∞
[−σ2
2βf ′(G)
]−dG
≤ σ2
2β.
The profits obtained with the policy given by the proposition are:
∫ ∞
−∞Gu(G)f(G)dG− cAB
∫ ∞
MqABf(G)dG− cBA
∫ −M
−∞qBAf(G)dG
=σ2
2β− cABqAB
∫ ∞
Mf(G)dG− cBAqBA
∫ −M
−∞f(G)dG.
Now, at the limit for M →∞, this value isσ2
2β. Indeed, we have f(G) = f(−M)e
2βqBA(G+M)
σ2
for G < −M , f(G) = f(−M) = f(M) for −M < G < M and f(G) = f(M)e−2βqAB(G−M)
σ2
for G > M . Of course, f(−M) = f(M) is a constant such that f integrates to one. As a
result, limM→∞
∫ ∞
Mf = lim
M→∞
∫ −M
−∞f = 0. This implies that, regardless of the policy u(G), the
maximum long term profit we can possibly obtain isσ2
2β. This is achieved as the limit of the
proposed policy.
27

Theorem 1
In order to prove Theorem 1, we first need to prove the following lemma. Proposition 3 is
proved later using the optimality conditions of the theorem.
Lemma 1 Given functions v(G) and h(G) := −Gv(G), and an optimal solution f(G) of the
maximization problem (11)
If there is [g0, g0 + δ] such that−σ2
2β
f ′
f> −qBA + v(G) then we must have
∫∞g0
(h−cAB
[−σ2
2βf ′f−v
]+−cBA
[−σ2
2βf ′f−v
]−)f+σ2
2βf(g0)
cAB1(
−σ2
2βf ′f−v≥0
)−cBA1(−σ2
2βf ′f−v≤0
)
∫∞g0
f
≤∫∞−∞
(h−cAB
[−σ2
2βf ′f−v
]+−cBA
[−σ2
2βf ′f−v
]−)f
∫∞−∞ f
.
If there is [g0, g0 + δ] such that−σ2
2β
f ′
f< qAB + v(G) then we must have
∫∞g0
(h−cAB
[−σ2
2βf ′f−v
]+−cBA
[−σ2
2βf ′f−v
]−)f+σ2
2βf(g0)
cAB1(
−σ2
2βf ′f−v≥0
)−cBA1(−σ2
2βf ′f−v≤0
)
∫∞g0
f
≥∫∞−∞
(h−cAB
[−σ2
2βf ′f−v
]+−cBA
[−σ2
2βf ′f−v
]−)f
∫∞−∞ f
.
Proof. We consider an optimal f that satisfies (11) such that, within an interval [g0, g0 + δ],−σ2
2β
f ′
f> −qBA + v(G), or in other words,
σ2
2β
f ′
f< qBA − v(G). Define u(G) = u(G) + ε for
G ∈ [g0, g0 + δ], and equal to u(G) otherwise. The corresponding f satisfies
f ′(G)f(G)
=
f ′
f+ ε if G ∈ [g0, g0 + δ]
f ′
fotherwise
(19)
and hence
f(G) =
f∫ g0
−∞ f +∫ g0+δg0
eε(G−g0)f(G)dG + eεδ∫∞g0+δ f
if G < g0
feε(G−g0)
∫ g0
−∞ f +∫ g0+δg0
eε(G−g0)f(G)dG + eεδ∫∞g0+δ f
if G ∈ [g0, g0 + δ]
feδε
∫ g0
−∞ f +∫ g0+δg0
eε(G−g0)f(G)dG + eεδ∫∞g0+δ f
if G > g0 + δ
(20)
28

In G ∈ [g0, g0 + δ], for small ε > 0,[−σ2
2β
f ′(G)f(G)
− v(G)
]+
=[−σ2
2β
f ′(G)f(G)
− v(G)]+
− σ2ε
2β1(
−σ2
2βf ′(G)f(G)
−v(G)≥0)
and [−σ2
2β
f ′(G)f(G)
− v(G)
]−=
[−σ2
2β
f ′(G)f(G)
− v(G)]−
+σ2ε
2β1(
−σ2
2βf ′(G)f(G)
−v(G)≤0)
where 1Z = 1 if condition Z is satisfied and 0 otherwise. The objective using policy u can
be written as
Jε,δ(G) =∫ ∞
−∞
(h− cAB
[−σ2
2β
f ′(G)f(G)
− v(G)
]+
− cBA
[−σ2
2β
f ′(G)f(G)
− v(G)
]−)f(G)dG
=
∫ g0
−∞Hf + eεδ∫∞g0
Hf +∫ g0+δg0
σ2ε2β
(cAB1(
−σ2
2βf ′f−v≥0
) − cBA1(−σ2
2βf ′f−v≤0
))
feε(G−g0)dG
∫ g0
−∞ f +∫ g0+δg0
eε(G−g0)fdG + eεδ∫∞g0+δ f
where H =
(h− cAB
[−σ2
2β
f ′
f− v
]+
− cBA
[−σ2
2β
f ′
f− v
]−)to simplify notation.
A Taylor approximation with respect to ε and δ (hence considering that δ2 ¿ δ), yields that
Jε,δ(G) =
∫∞−∞Hf + εδ
{∫∞g0
Hf + σ2
2β f(g0)(
cAB1(−σ2
2βf ′f−v≥0
) − cBA1(−σ2
2βf ′f−v≤0
))}
∫∞−∞ f + εδ
∫∞g0
f+ o(εδ)
where limx→0
o(x)x
= 0.
Since f is optimal, we have Jε,δ ≤ J , for ε, δ small, which yields after some algebra, that
∫∞g0
Hf + σ2
2β f(g0)(
cAB1(−σ2
2βf ′f−v≥0
) − cBA1(−σ2
2βf ′f−v≤0
))
∫∞g0
f≤
∫∞−∞Hf∫∞−∞ f
.
The same argument applied with−σ2
2β
f ′
f< qAB +v(G) yields the second part of the lemma.
We are now ready to show the theorem.
Proof. Denote W the right-hand side of the expression in Lemma 1, i.e.,
W :=
∫∞−∞
(h− cBA
[−σ2
2βf ′f − v
]−− cAB
[−σ2
2βf ′f − v
]+)
fdG
∫∞−∞ f
< 0,
29

from assumption (ii) of the Theorem. Consider f the optimal solution of problem (11), and
u = −σ2
2β
f ′
f− v. We claim that
(i) u(G) = qAB when G →∞;
(ii) u(G) = qAB for G > mAB for some mAB;
(iii) u(G) = 0 for mBA < G < mAB for some mBA ≤ mAB; and
(iv) u(G) = −qBA for G < mBA.
We start with (i). If g0 →∞ and u(G) < qAB, Lemma 1 provides a necessary condition,
∫∞g0
(h−cAB
[−σ2
2βf ′f−v
]+−cBA
[−σ2
2βf ′f−v
]−)f+σ2
2βf(g0)
cAB1(
−σ2
2βf ′f−v≥0
)−cBA1(−σ2
2βf ′f−v≤0
)
∫∞g0
f≥ W.
The left-hand side expression of the necessary condition is bounded from above by
∫∞g0
hf + σ2
2β cABf(g0)∫∞g0
f=
∫∞g0
(−Gv(G)− σ2
2β cAB f ′(G)f(G)
)f(G)dG
∫∞g0
f
≤∫∞g0
(−Gv(G) + cAB(qAB + v(G)))f(G)dG∫∞
g0f
= cABqAB +
∫∞g0−(G− cAB)v(G)f(G)dG∫∞
g0f
Since, for g0 > cAB, −(G − cAB)v(G) is decreasing (because v(G) is positive when G is very
large), the right-hand side tends to −∞ as g0 → ∞. Hence this contradicts the necessary
condition from the lemma. As a result, for G large enough u(G) = qAB, and that implies (i).
Given (i), u(G) = qAB > 0 for large G implies for large g0,
∫∞g0
(h−cAB
[−σ2
2βf ′f−v
]+−cBA
[−σ2
2βf ′f−v
]−)f+σ2
2βf(g0)
cAB1(
−σ2
2βf ′f−v≥0
)−cBA1(−σ2
2βf ′f−v≤0
)
∫∞g0
f
=
∫∞g0
(−Gv(G)− cABqAB)f(G)dG + σ2
2β cABf(g0)∫∞g0
f
=
∫∞g0−(G− cAB)v(G)f(G)dG∫∞
g0f
where again we transformed f(g0) into∫∞g0
(−f ′/f)× f , and used Equation (5). As before, this
is continuous and hence it is optimal to set u(g0) = qAB for g0 > mAB, where mAB is such that∫∞mAB(−Gv(G)− cABqAB)f(G)dG + σ2
2β cABf(mAB)∫∞mAB f
=
∫∞mAB −(G− cAB)v(G)f(G)dG∫∞
mAB f= W
30

This proves (ii). For g0 = mAB − ε, we have that
∫∞g0
(h− cAB
[−σ2
2βf ′f − v
]+− cBA
[−σ2
2βf ′f − v
]−)f + σ2
2β cABf(g0)∫∞g0
f= W + ε′ > W,
for ε′ > 0 very small. Is is clear that u(g0) > 0 cannot be optimal, as the necessary condition
for u < qAB is not satisfied. Similarly, u(g0) < 0 cannot be optimal, since
∫∞g0
(h− cAB
[−σ2
2βf ′f − v
]+− cBA
[−σ2
2βf ′f − v
]−)f − σ2
2β cBAf(g0)∫∞g0
f= W+ε′−2
σ2
2βcBA f(g0)∫∞
g0f
< W.
Hence, it is optimal to set u(g0) = 0. This is true while
W >
∫ mAB
g0−Gv(G)f(G)dG +
∫∞mAB(−Gv(G)− cABqAB)f(G)dG− σ2
2β cBAf(g0)∫∞g0
f
=
∫∞g0−(G + cBA)v(G)f(G)dG +
∫∞mAB −(cAB + cBA)qABf(G)dG∫∞
g0f
and
W <
∫ mAB
g0−Gv(G)f(G)dG +
∫∞mAB(−Gv(G)− cABqAB)f(G)dG + σ2
2β cABf(g0)∫∞g0
f
=
∫∞g0−(G− cAB)v(G)f(G)dG∫∞
g0f
.
These equations hold until the first one becomes an equality (since the right-hand side of the
second equation is decreasing if equal to W , and the right-hand side of the first equation also
decreases). As a result, they are satisfied for g0 > mBA, which proves (iii). mBA is uniquely
defined by
∫ mAB
mBA −Gv(G)f(G)dG +∫∞mAB(−Gv(G)− cABqAB)f(G)dG− σ2
2β cBAf(mBA)∫∞mBA f
= W.
Finally, for G < mBA, the optimal decision is to set u(G) = −qBA, as the necessary condition
for u < −qBA is not satisfied.
Proposition 3
Proof. Consider mBA and mAB defined in the previous proof, when cAB = cBA = 0. Clearly,
the case of part (iii) is now empty, and hence mBA = mAB.
31

Proposition 4
Proof. W is the value of the trader’s problem for the optimal policy described at Theorem
1, and the equation for mAB is Equation (15), given in the proof of Theorem 1. In that same
proof, mBA is defined by∫ mAB
mBA −Gv(G)ϕ(G)dG +∫∞mAB(−Gv − cABqAB)ϕ(G)dG− σ2
2β cBAϕ(mBA)∫∞mBA ϕ
= W.
Now taking in account the expression for W , the following algebra yields Equation (14).
(∫ ∞
−∞ϕ
) W −
∫ mBA
−∞ (−Gv − cBAqBA)ϕ∫∞−∞ ϕ
− σ2
2βcBAϕ(mBA) =
(∫ ∞
mBA
ϕ
)W
⇒(∫ ∞
−∞ϕ−
∫ ∞
mBA
ϕ
)W −
∫ mBA
−∞(−Gv − cBAqBA)ϕ− σ2
2βcBAϕ(mBA) = 0
⇒∫ mBA
−∞ (−Gv − cBAqBA)ϕdG + σ2
2β cBAϕ(mBA)∫ mBA
−∞ ϕ= W.
Rewriting ϕ(mBA) as∫ mBA
−∞ (f ′/f)× f , and using Equation (5) yields
∫ mBA
−∞ (−Gv − cBAqBA)ϕdG + σ2
2β cBAϕ(mBA)∫ mBA
−∞ ϕ=
∫ mBA
−∞ (−Gv − cBAqBA − cBA(−qBA + v))ϕdG∫ mBA
−∞ ϕ
and hence Equation (14).
Proposition 5
Proof. We denote cAB = cBA = c, qAB = qBA = q. Let us consider the following change of
variables: G = −s, mBA = −mAB, mAB = −mBA and ϕ(s) = ϕ(−s) where mBA and mAB
are given by Equations (14) and (15) in Proposition 4. We claim that if v(−G) = −v(G) then
mBA, mAB and W = W also solve the optimality equations of Proposition 4.
Indeed, we have that
W =
∫ mBA
−∞ (−Gv(G)− cq)ϕ(G)dG +∫ mAB
mBA −Gv(G)ϕ(G)dG +∫∞mAB(−Gv(G)− cq)ϕ(G)dG∫∞
−∞ ϕ(G)dG
=
∫ −mBA
+∞ (sv(−s)− cq)ϕ(−s)(−ds) +∫ −mAB
−mBA sv(−s)(−ds)ϕ(−s)(−ds) +∫ −∞−mAB(sv(−s)− cq)ϕ(−s)(−ds)
∫ −∞+∞ ϕ(−s)(−ds)
=
∫∞mAB(−sv(s)− cq)ϕ(s)ds +
∫ mAB
mBA −sv(s)dsϕ(s)ds +∫ mBA
−∞ (−sv(s)− cq)ϕ(s)ds∫∞−∞ ϕ(s)ds
= W,
32

where we made the change of variables s = −G and used the fact that v is anti-symmetrical.
It is now clear that applying the change of variables,
∫ mBA
−∞ −(G + c)v(G)ϕ(G)dG∫ mBA
−∞ ϕ(G)dG=
∫∞mAB −(G− c)v(G)ϕ(G)dG∫∞
mAB ϕ(G)dG= W = W ,
i.e., satisfies Equation (14). Similarly, it satisfies Equation (15) as well. In conclusion, mBA, mAB
and W are also solutions of the optimality equations and hence, since the solutions are unique,
mBA = −mAB.
Proposition 6
Proof. When qAB = qBA = 0, thenσ2
2β
ϕ′
ϕ= −v and hence
W =
∫∞−∞−GvϕdG∫∞−∞ ϕdG
=
∫∞−∞G
(σ2
2β
ϕ′
ϕ
)ϕdG
∫∞−∞ ϕdG
= −σ2
2β
On the other hand, (14) is now
W =
∫ mBA
−∞ −(G + cBA)v(G)ϕ(G)dG∫ mBA
−∞ ϕdG
=
∫ mBA
−∞ (G + cBA)σ2
2β ϕ′(G)dG∫ mBA
−∞ ϕdG
=σ2
2β [(G + cBA)ϕ]mBA
−∞ − σ2
2β
∫ mBA
−∞ ϕ∫ mBA
−∞ ϕdG
= −σ2
2β+
σ2
2β
(cBA + mBA)ϕ(mBA)∫ mBA
−∞ ϕ
Thus as the optimal solution is unique, we have that mBA + cBA = 0 and hence mBA = −cBA.
Similarly mAB = cAB when qAB = qBA = 0.
When qAB, qBA > 0 but very small, we know that (mBA,mAB) are uniquely defined by
0 =
∫∞mAB −(G− cAB)v(G)ϕ(G)dG∫∞
mAB ϕ
−∫ mBA
−∞ (−Gv(G)−cBAqBA)ϕ(G)dG+∫ mAB
mBA −Gv(G)ϕ(G)dG+∫∞
mAB(−Gv(G)−cABqAB)ϕ(G)dG∫∞−∞ ϕdG
0 =
∫ mBA
−∞ −(G + cBA)v(G)ϕ(G)dG∫ mBA
−∞ ϕ
−∫ mBA
−∞ (−Gv(G)−cBAqBA)ϕ(G)dG+∫ mAB
mBA −Gv(G)ϕ(G)dG+∫∞
mAB(−Gv(G)−cABqAB)ϕ(G)dG∫∞−∞ ϕdG
.
33

This is a system of two equations ψ1(mBA,mAB, qBA, qAB) = 0 and ψ2(mBA,mAB, qBA, qAB) =
0 with two unknowns, and two parameters qBA, qAB. Since ψ is continuously differentiable,
then (mBA,mAB) is continuous in (qBA, qAB) around (0, 0). We thus have that, for small
qBA, qAB, the deviations around mBA = −cBA and mAB = cAB are respectively mBA + cBA
and mAB − cAB, and hence
dψ
dqBAqBA +
dψ
dqABqAB +
dψ
dmBA(mBA +cBA)+
dψ
dmAB(mAB−cAB)+o(qBA)+o(qAB) = 0, (21)
where o(x)/x → 0 when x → 0.
Interestingly, at qAB = 0,
1ϕ
∂ϕ
∂mBA=
2β
σ2v(−cBA) and
1ϕ
∂ϕ
∂mAB= 0.
Also,1ϕ
∂ϕ
∂qBA= −2β
σ2(−cBA −G)+ and
1ϕ
∂ϕ
∂qAB= −2β
σ2(G− cAB)+.
Hence, at qAB = qBA = 0, we have that
1ψ1
dψ1
dmBA=−ϕ(−cBA)∫ −cBA
−∞ ϕand
1ψ1
dψ1
dmAB= 0,
1ψ2
dψ2
dmAB=
ϕ(cAB)∫∞cAB ϕ
and1ψ2
dψ2
dmBA= 0.
In addition, using that W = −σ2
2β,
1ψ1
dψ1
dqBA=
(2β
σ2
)
2βσ2
∫−cBA
−∞ (G+cBA)2v(G)ϕ(G)dG∫−cBA
−∞ ϕ+
∫−cBA
−∞ −(G+cBA)ϕ(G)dG∫−cBA
−∞ ϕ
−cBA∫−cBA
−∞ ϕ∫∞−∞ ϕ
− 2βσ2
∫−cBA
−∞ G(G+cBA)v(G)ϕ(G)dG∫∞−∞ ϕ
−∫−cBA
−∞ −(G+cBA)ϕ(G)dG∫∞−∞ ϕ
,
1ψ1
dψ1
dqAB=
(2β
σ2
) [−cAB
∫∞cAB ϕ∫∞−∞ ϕ
+ 2βσ2
∫∞cAB G(G−cAB)v(G)ϕ(G)dG∫∞
−∞ ϕ−
∫∞cAB (G−cAB)ϕ(G)dG∫∞
−∞ ϕ
];
and
1ψ2
dψ2
dqBA=
(2β
σ2
)[−cBA
∫−cBA
−∞ ϕ∫∞−∞ ϕ
− 2βσ2
∫−cBA
−∞ G(G+cBA)v(G)ϕ(G)dG∫∞−∞ ϕ
−∫−cBA
−∞ −(G+cBA)ϕ(G)dG∫∞−∞ ϕ
],
1ψ2
dψ2
dqAB=
(2β
σ2
) −2β
σ2
∫∞cAB (G−cAB)2v(G)ϕ(G)dG∫∞
cAB ϕ+
∫∞cAB (G−cAB)ϕ(G)dG∫∞
cAB ϕ
−cAB∫∞
cAB ϕ∫∞−∞ ϕ
+ 2βσ2
∫∞cAB G(G−cAB)v(G)ϕ(G)dG∫∞
−∞ ϕ−
∫∞cAB (G−cAB)ϕ(G)dG∫∞
−∞ ϕ
.
34
As a result, we can express Equation (21) as
mBA = −cBA −(
ψ1
dψ1
dmBA
)(1ψ1
dψ1
dqBAqBA +
1ψ1
dψ1
dqABqAB
)+ o(qBA) + o(qAB)
and
mAB = cAB −(
ψ2
dψ2
dmAB
)(1ψ2
dψ2
dqBAqBA +
1ψ2
dψ2
dqABqAB
)+ o(qBA) + o(qAB).
References
[1] Bertsekas D. P. 2000. Dynamic Programming and Optimal Control. Athena Scientific,
Belmont, Massachusetts.
[2] Caldentey R., R. Epstein and D. Saure 2007. ”Optimal Explotation of Nonrenewable
Resource.” Working paper, Stern School, New York University.
[3] Chambers M. and R. Bailey 1996. ”A theory of commodity price fluctuations.” The Review
of Economic Studies, 104, pp. 429-441.
[4] Chatfield C. 2004. The Analysis of Time Series. An introduction. Sixth Edition. Chap-
man&Hall
[5] Deaton A. and G. Laroque 1992. ”On the Behaviour of Commodity Prices.” The Review
of Economic Studies, 59(1), pp. 1-23.
[6] Deaton A. and G. Laroque 1996. ”Competitive Storage and Commodity Price Dynamics.”
The Journal of Political Economy Studies, 104(5), pp. 896-923.
[7] Dong L. and H. Liu 2007. ”Equilibrium Forward Contracts on Nonstorable Commodities
in the Presence of Market Power”.Operations Research, 55(1), pp. 128-145.
[8] Gibson R. and E. Schwartz 1990. ”Stochastic convenience yield and the pricing of oil
contingent claims.”Journal of Finance, 45, pp. 959-976.
[9] Goel A. and G.J. Gutierrez 2004. ”Integrating Spot and Futures Commodity Markets
in the Optimal Procurement Policy of an Assemble-to-Order Manufacturer”. Working
paper, Department of Information Risk and Operations Management, University of Texas-
Austin.
[10] Goel A. and G.J. Gutierrez 2006. ”Integrating Commodity Markets in the Optimal Pro-
curement Policies of a Stochastic Inventory System”. Working paper, Department of
Information Risk and Operations Management, University of Texas-Austin.
35

[11] Goel A. and G.J. Gutierrez 2007. ”Procurement and Distribution Policies in a Distributive
Supply Chain in the Presence of Commodity Markets”. Working paper, Department of
Information Risk and Operations Management, University of Texas-Austin.
[12] Golabi K. 1985. ”Optimal Inventory Policies when Ordering Prices are Random.” Oper-
ations Research, 33(3), pp. 575-588.
[13] Hull J. 2003. Options, Futures and other Derivatives. Prentice Hall Upper Saddle River,
NJ.
[14] Routledge B. R., D. J. Seppi and C. S. Spatt 1998. ”The Spark Spread: An Equilibrium
Model of Cross-Commodity Price Relationships in Electricity”. Working paper, Graduate
School of Industrial Administration, Carnegie Mellon University.
[15] Routledge B. R., D. J. Seppi and C. S. Spatt 2000. ”Equilibrium Forward Curves for
Commodities”. The Journal of Finance, 50(3), pp. 1297-1338.
[16] Schwartz E. 1997. ”The Stochastic Behaviour of Commodity Prices: Implications for
Valuation and Hedging.” The Journal of Finance, 52 (3), pp. 923-973.
[17] Schwartz E. and J. E. Smith 2000. ”Short-Term Variations and Long-Term Dynamics in
Commodity Prices” Management Science, 46 (7), pp. 893-911.
[18] Secomandi N. 2004. ”Valuation of Contracts for Interstate Natural Gas Pipeline Trans-
portation Capacity by producers and Local Distribution Companies.” Working paper,
Tepper School of Business, Carnegie Mellon University.
[19] Secomandi N. 2005. ”Optimal Inventory-Trading Policy for Commodity Storage Assets.”
Working paper, Tepper School of Business, Carnegie Mellon University.
[20] Wang M. X., N. Secomandi, S. Kekre and A. Scheller-Wolf 2007. ”Valuation of Down-
stream Liquefied-Natural-Gas Storage.” Working paper, Tepper School of Business,
Carnegie Mellon University.
[21] Wang Y. 2001. ”The optimality of myopic stocking policies for systems with decreasing
purchasing prices.” European Journal of Operational Research, 133, pp.153-159
[22] Williams J. and B. Wright 1991. Storage and Commodity Markets. Cambridge Universtity
Press, Cambridge, England.
[23] Wilmot P., J. Dewynne and S. Howinson 1997. Option Pricing. Oxford Financial Press.
[24] Zipkin P. H. 2000. Foundations of Inventory Management. McGraw-Hill International
Editions.
36