Embed Size (px)
Citation preview
Africa Economic Brief
Chief Economist Complex | AEB Volume 6, Issue 8, 2015
Outline
1 | Introduction p.12 | Structural Transformation
versus Employment Creation p.23 | Structural Factors
Constraining Employment Creation in Nigeria p.5
4 | Summary and Conclusion p.10
The findings of this Brief reflectthe opinions of the authors and not those of the African Development Bank, its Board of Directorsor the countries they represent.
Steve Kayizzi-MugerwaAg. Chief Economist & Vice President (ECON)[email protected]+216 7110 2064
Charles Leyeka LufumpaDirectorStatistics Department (ESTA)[email protected]+216 7110 2175Abebe ShimelesAg. Director, Development ResearchDepartment (EDRE)[email protected]+225 2026 2420
Bernadette KamgniaAg. Director, African DevelopmentInstitute (EADI)[email protected]+225 2026 2109
Adeleke SalamiCoordinator, Development ResearchDepartment (EDRE)[email protected]+225 2026 2551
The Challenge of Job Creation in NigeriaZerihun G. Alemu*
* Zerihun Gudeta Alemu is Chief Country Economist at ORNG, African Development Bank ([email protected]).
Abstract
In this paper attempt is made to show the structural nature of jobless growth inNigeria. This is done from the perspective of, firstly, structural transformation and itseffect on the resultant sectoral composition; secondly, from labor market dynamics;and thirdly, from production organization of sectors that are driving GDP growth. Wefound that the rate of unemployment rose by 1.1% a year between 2000 and 2010.This is caused, on the supply side, by a 2.5% annual increase in the number of newentrants into the labor market; and on the demand side, by sectors’ inability to createsufficient number of jobs. Job creation increased only by 1.4% a year. We attributedthis to capital intensive growth as seven of the nine broad sectors studied are capitalintensive and together they accounted for 61% to 74% of the GDP growth. Inaddition, the structural nature of jobless growth is evident on country’s employmentintensity of growth. We found that, under business as usual scenario, the countryneed to grow by double digit to create 1.8 million jobs annually, equivalent to thosethat newly enter the labor force every year. The paper makes the following policyrecommendations: in the short term, more jobs can be created by targeting supportin sectors with proven high employment absorption capacity, demonstrated by theirhigh employment multiplier; in the medium term, by promoting Domestic Value ChainDevelopment/value addition guided by existing backward linkages and forwardlinkages; and in the longer term through a concerted effort that channels support toweakly integrated but deserving sectors to ensure their integration with other sectorsof the domestic economy. This will ensure that growth is broad based as it makessectoral growth contribute to overall growth over and above direct contribution tototal GDP growth.
1 | Introduction
Nigeria is one of the fastest growing
economies in Africa, with average GDP
growth rate of between 5% and 6%
between 2000 and 2011. This growth has
happened together with structural
transformation; however, it has not
translated into a reduction in rate of
unemployment; ironically unemployment
surged from about 11% in 2000 to over
23% in 2011.
The government of Nigeria, has put in
place various policy measures to reverse
this. It introduced policies to reform the
restrictive investment climate that
dominated the period between 1962 to
2 | Chief Economist Complex | AEB Volume 6, Issue 8, 2015
the return to democracy in 1999 which ushered private sector
led growth strategy. Recent policy measures that supported
this included the National Economic Empowerment
Development Strategy (NEEDS) adopted in 2003. NEEDS
gave way to Vision 20:2020 of 2009 which inspired
successive National Development Plans and the
Transformation Agenda of 2011-2015. The latter, among
others, made economic development and inclusive growth its
overarching development agenda which made job creation
an integral part of sector level reforms. In addition, programs
managed by the Federal Government level, aimed at
supporting job creation were introduced. This included, inter
alia, the Subsidy Re-investment and Empowerment Program
(SURE-P), which comprised Community Service Scheme and
Graduate Internship Scheme; and the Youth Enterprise with
Innovation in Nigeria (YouWiN!) program, which comprised the
Conditional Cash Transfer (CCT), vocational Training, Public
Works and Science and Technology. Many of the above policy
initiatives are new thus it is too early to assess their overall
employment impact. However, we believe that jobless growth
in Nigeria is structural in nature, thus a broader framework
that takes cognizance of this is required to reverse the
situation.
The remaining part of this paper is organized into three
sections. Section two looks into the role of sectoral
composition, during structural transformation, on employment
creation. This is done by reviewing the experiences of
successful comparator countries with a view to drawing useful
lessons. This is followed by section three where the structural
nature of jobless growth is explored from the perspectives of
labor market conditions and sector level production
organization. Further it gives policy options to reverse the
jobless growth situation. Finally, section four gives summary
and conclusions.
2 | Structural Transformation versus Employment Creation
Both theoretical and empirical literature establish that
structural transformation could be both the cause and effect
of economic growth (Timmer, 2012). It is the outcome of a
rise in capital accumulation in growing sectors which
eventually result in productivity differentials across sectors and
become a cause for flow of labor and resources out of the
primary to the secondary and tertiary sectors. These coupled
with changes in demand patterns (the workings of the Engle
law) would result in a reduction in the share of agriculture in
total GDP. The effect of this on employment would come from
a rise in demand for labor in the growing sectors. This would
alter existing distribution of employment in favor of growing
sectors and ultimately result in a rise in total employment. In
this section, common definition of structural transformation is
adopted to ascertain, the presence or lack thereof of
structural change in Nigeria. This is then followed by
comparison of Nigeria’s experience with comparator
countries in terms of the nature and pattern of structural
transformation.
A country is said to have undergone structural transformation
when the following four conditions are met: (1) declining share
of primary sector in both GDP and employment; (2) rapid
urbanization as people migrate from rural to urban areas; (3)
emergence of modern secondary and tertiary sectors; (4)
demographic transition from high to low rates of births and
deaths takes place. However, when this happens,
agriculture’s value added should increase in absolute terms.
This entails a rise in agriculture’s productivity; at a rate lower
than that in the growing sectors (industry and service) to allow
flow of labor from agriculture to high productivity sectors.
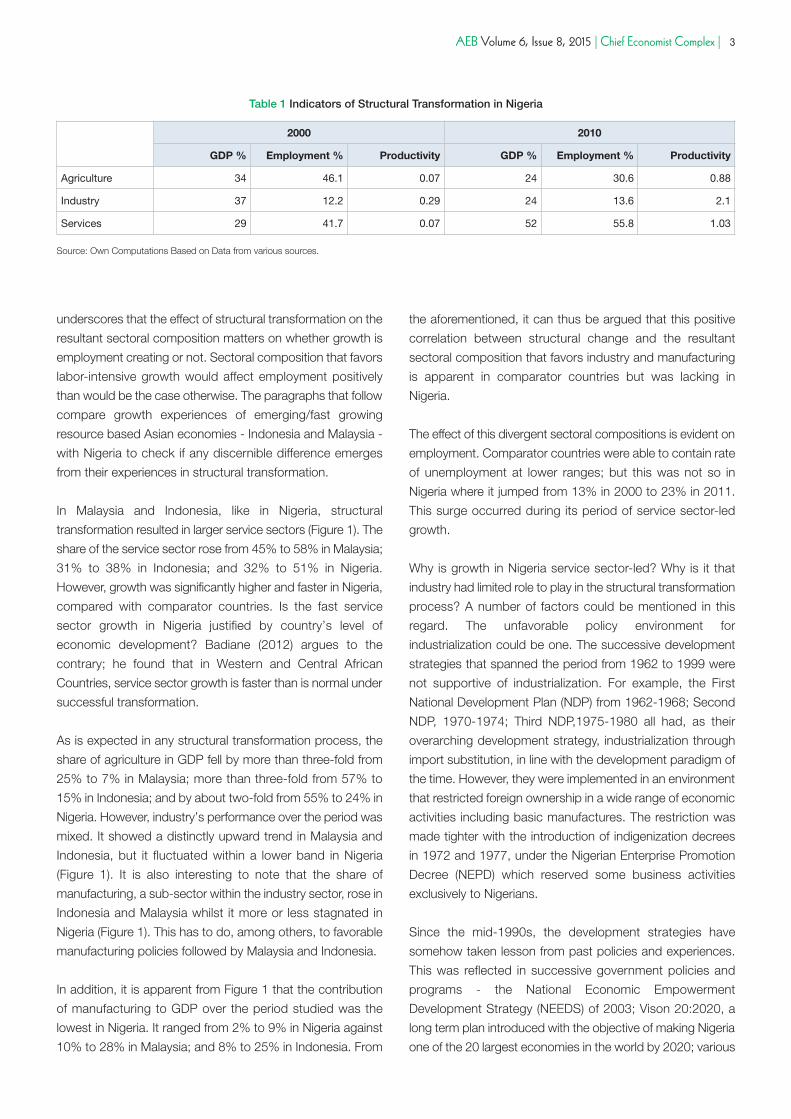
In Nigeria, many of the conditions for structural transformation
are met, though mildly. Table 1 shows that the share of the
primary sector in GDP and employment fell from 46% in 2000
to 30.6% in 2010 (condition 1); the country has seen
significant increase in rate of urbanization, it rose from 16% in
1970 to 40% in 2010 (condition 2); the service sector is
increasing in importance in GDP and employment, its share
rose significantly from 29% and 42% in 2000 to 52% and
56% respectively in 2000 and 2010 (condition 3); and the
country has undergone little demographic transition, birth and
death rates per 1000 population have fallen, but not
significantly so, from 46 & 20 in 1990 to 39.9 and 14.3 in 2012
(Trading Economics, 2014).
In addition, change in labor productivity, defined as the ratio
of sectoral output to input, driver of inter-sectoral flow of
resources and labor, and thus supposedly a root cause for
sectoral variations in GDP and employment shares has
occurred in anticipated direction. Table 1 shows that labor
productivity rose across sectors between 2000 and 2010; but
growth was relatively rapid in the service sector compared
with other sectors. It rose fifteen fold in services, much higher
than the seven fold increases in agriculture and industry.
Therefore, it can be argued based on the above data that
structural transformation is taking place and it is service-led.
Available literature does not dispute the link between
structural transformation and growth. The literature further
AEB Volume 6, Issue 8, 2015 | Chief Economist Complex | 3
underscores that the effect of structural transformation on the
resultant sectoral composition matters on whether growth is
employment creating or not. Sectoral composition that favors
labor-intensive growth would affect employment positively
than would be the case otherwise. The paragraphs that follow
compare growth experiences of emerging/fast growing
resource based Asian economies - Indonesia and Malaysia -
with Nigeria to check if any discernible difference emerges
from their experiences in structural transformation.
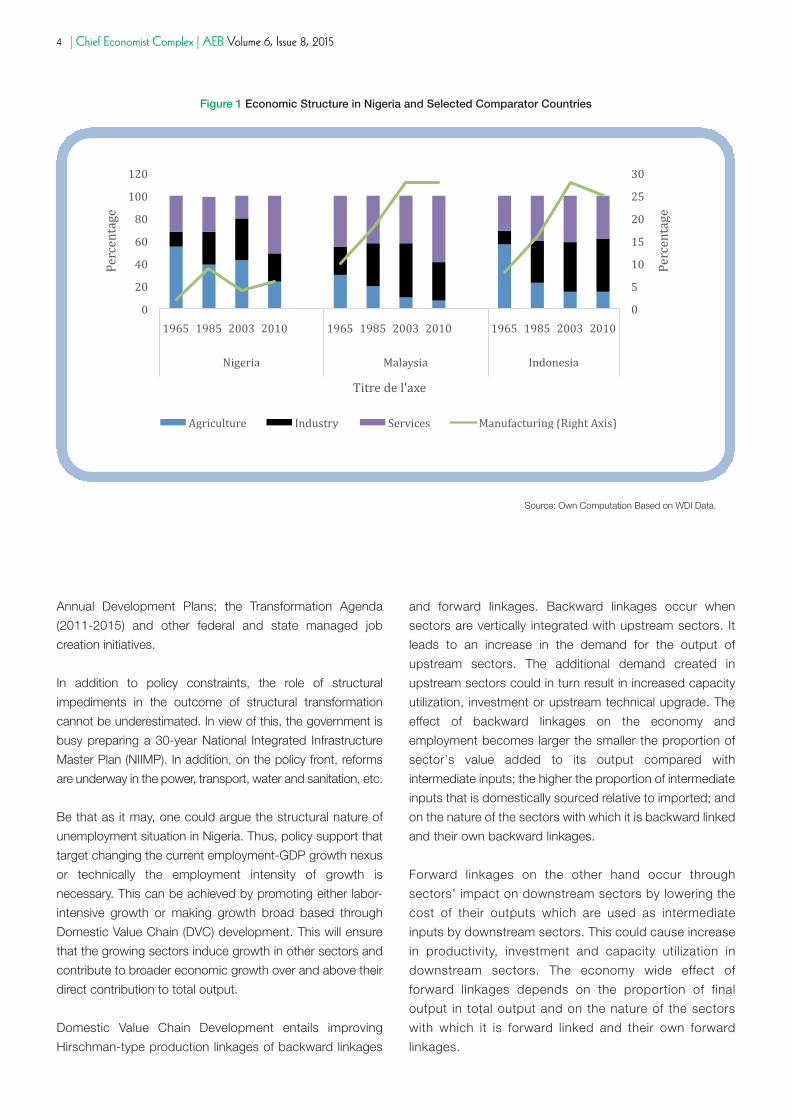
In Malaysia and Indonesia, like in Nigeria, structural
transformation resulted in larger service sectors (Figure 1). The
share of the service sector rose from 45% to 58% in Malaysia;
31% to 38% in Indonesia; and 32% to 51% in Nigeria.
However, growth was significantly higher and faster in Nigeria,
compared with comparator countries. Is the fast service
sector growth in Nigeria justified by country’s level of
economic development? Badiane (2012) argues to the
contrary; he found that in Western and Central African
Countries, service sector growth is faster than is normal under
successful transformation.
As is expected in any structural transformation process, the
share of agriculture in GDP fell by more than three-fold from
25% to 7% in Malaysia; more than three-fold from 57% to
15% in Indonesia; and by about two-fold from 55% to 24% in
Nigeria. However, industry’s performance over the period was
mixed. It showed a distinctly upward trend in Malaysia and
Indonesia, but it fluctuated within a lower band in Nigeria
(Figure 1). It is also interesting to note that the share of
manufacturing, a sub-sector within the industry sector, rose in
Indonesia and Malaysia whilst it more or less stagnated in
Nigeria (Figure 1). This has to do, among others, to favorable
manufacturing policies followed by Malaysia and Indonesia.
In addition, it is apparent from Figure 1 that the contribution
of manufacturing to GDP over the period studied was the
lowest in Nigeria. It ranged from 2% to 9% in Nigeria against
10% to 28% in Malaysia; and 8% to 25% in Indonesia. From
the aforementioned, it can thus be argued that this positive
correlation between structural change and the resultant
sectoral composition that favors industry and manufacturing
is apparent in comparator countries but was lacking in
Nigeria.
The effect of this divergent sectoral compositions is evident on
employment. Comparator countries were able to contain rate
of unemployment at lower ranges; but this was not so in
Nigeria where it jumped from 13% in 2000 to 23% in 2011.
This surge occurred during its period of service sector-led
growth.
Why is growth in Nigeria service sector-led? Why is it that
industry had limited role to play in the structural transformation
process? A number of factors could be mentioned in this
regard. The unfavorable policy environment for
industrialization could be one. The successive development
strategies that spanned the period from 1962 to 1999 were
not supportive of industrialization. For example, the First
National Development Plan (NDP) from 1962-1968; Second
NDP, 1970-1974; Third NDP,1975-1980 all had, as their
overarching development strategy, industrialization through
import substitution, in line with the development paradigm of
the time. However, they were implemented in an environment
that restricted foreign ownership in a wide range of economic
activities including basic manufactures. The restriction was
made tighter with the introduction of indigenization decrees
in 1972 and 1977, under the Nigerian Enterprise Promotion
Decree (NEPD) which reserved some business activities
exclusively to Nigerians.
Since the mid-1990s, the development strategies have
somehow taken lesson from past policies and experiences.
This was reflected in successive government policies and
programs - the National Economic Empowerment
Development Strategy (NEEDS) of 2003; Vison 20:2020, a
long term plan introduced with the objective of making Nigeria
one of the 20 largest economies in the world by 2020; various
Table 1 Indicators of Structural Transformation in Nigeria
2000 2010
GDP % Employment % Productivity GDP % Employment % Productivity
Agriculture 34 46.1 0.07 24 30.6 0.88
Industry 37 12.2 0.29 24 13.6 2.1
Services 29 41.7 0.07 52 55.8 1.03
Source: Own Computations Based on Data from various sources.
Annual Development Plans; the Transformation Agenda
(2011-2015) and other federal and state managed job
creation initiatives.
In addition to policy constraints, the role of structural
impediments in the outcome of structural transformation
cannot be underestimated. In view of this, the government is
busy preparing a 30-year National Integrated Infrastructure
Master Plan (NIIMP). In addition, on the policy front, reforms
are underway in the power, transport, water and sanitation, etc.
Be that as it may, one could argue the structural nature of
unemployment situation in Nigeria. Thus, policy support that
target changing the current employment-GDP growth nexus
or technically the employment intensity of growth is
necessary. This can be achieved by promoting either labor-
intensive growth or making growth broad based through
Domestic Value Chain (DVC) development. This will ensure
that the growing sectors induce growth in other sectors and
contribute to broader economic growth over and above their
direct contribution to total output.
Domestic Value Chain Development entails improving
Hirschman-type production linkages of backward linkages
and forward linkages. Backward linkages occur when
sectors are vertically integrated with upstream sectors. It
leads to an increase in the demand for the output of
upstream sectors. The additional demand created in
upstream sectors could in turn result in increased capacity
utilization, investment or upstream technical upgrade. The
effect of backward linkages on the economy and
employment becomes larger the smaller the proportion of
sector’s value added to its output compared with
intermediate inputs; the higher the proportion of intermediate
inputs that is domestically sourced relative to imported; and
on the nature of the sectors with which it is backward linked
and their own backward linkages.
Forward linkages on the other hand occur through
sectors’ impact on downstream sectors by lowering the
cost of their outputs which are used as intermediate
inputs by downstream sectors. This could cause increase
in productivity, investment and capacity utilization in
downstream sectors. The economy wide effect of
forward linkages depends on the proportion of final
output in total output and on the nature of the sectors
with which it is forward linked and their own forward
linkages.
4 | Chief Economist Complex | AEB Volume 6, Issue 8, 2015
Figure 1 Economic Structure in Nigeria and Selected Comparator Countries
Source: Own Computation Based on WDI Data.
AEB Volume 6, Issue 8, 2015 | Chief Economist Complex | 5
3 | Structural Factors Constraining Employment Creation in Nigeria
In this section, the conceptual template introduced towards
the last part of the previous section is used to examine causes
of jobless growth in Nigeria. This will be done in two ways.
Firstly by examining the situation from the perspective of labor
market dynamics – broad analysis of demand for and supply
of labor. Secondly, by treating the structure of the Nigerian
economy as possible cause for the poor GDP growth and
employment mix.
The situation in the labor market will be examined using
employment data obtained from various sources – National
Bureau of statistics (NBS), World Development Indicators
(WDI) and other sources. On the other hand, the structure of
the Nigerian economy and its effect on employment will be
examined using a Social Accounting Matrix (SAM) to calculate
multipliers, among others, output, demand, GDP,
employment, backward and forward linkage indices, etc. Here
the 46 sectors are grouped into nine broad sectors:
agriculture (4); manufacturing (13); Oil & Gas (1); Mining (3);
Construction (1): Utility (2), constituting electricity and water
supply; transport (10); trade (2) constituting, trade and
accommodation and food services; and ‘other services’ (10).
In addition, we calculate the coefficient for employment
intensity of growth for Nigeria which will be used to run
scenarios to have a glimpse of the difficulty of creating the
required number of jobs every year under business as usual
assumption.
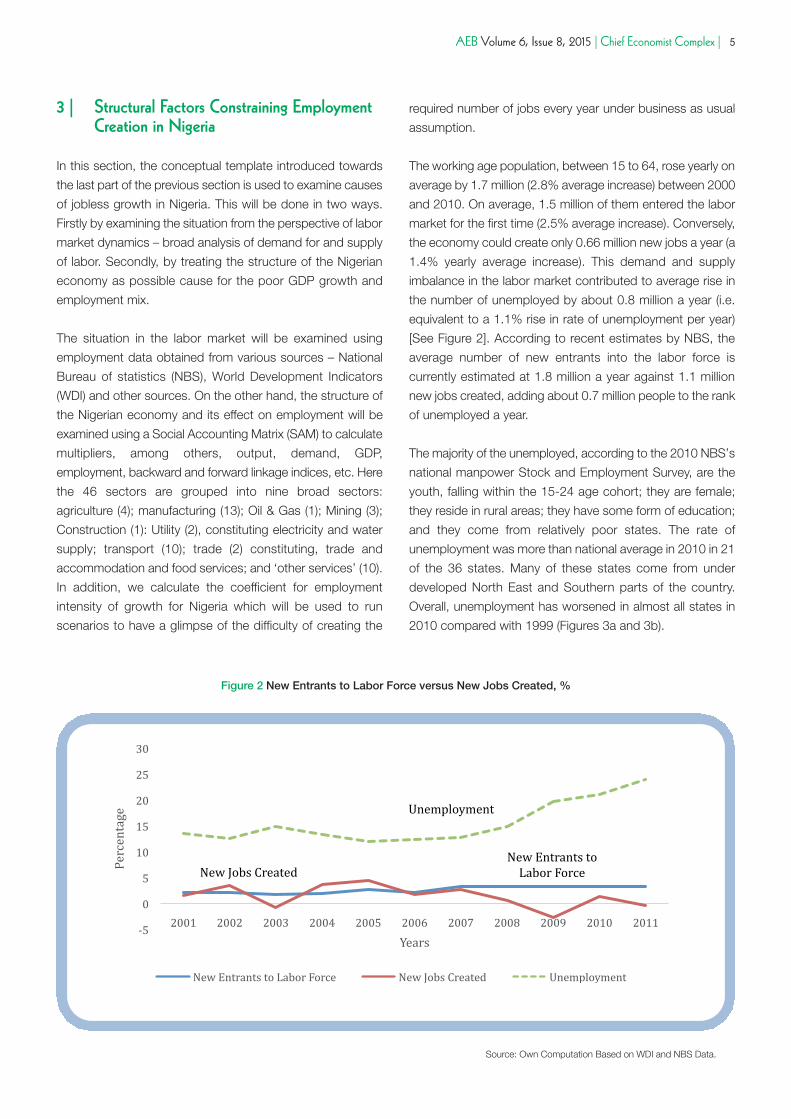
The working age population, between 15 to 64, rose yearly on
average by 1.7 million (2.8% average increase) between 2000
and 2010. On average, 1.5 million of them entered the labor
market for the first time (2.5% average increase). Conversely,
the economy could create only 0.66 million new jobs a year (a
1.4% yearly average increase). This demand and supply
imbalance in the labor market contributed to average rise in
the number of unemployed by about 0.8 million a year (i.e.
equivalent to a 1.1% rise in rate of unemployment per year)
[See Figure 2]. According to recent estimates by NBS, the
average number of new entrants into the labor force is
currently estimated at 1.8 million a year against 1.1 million
new jobs created, adding about 0.7 million people to the rank
of unemployed a year.
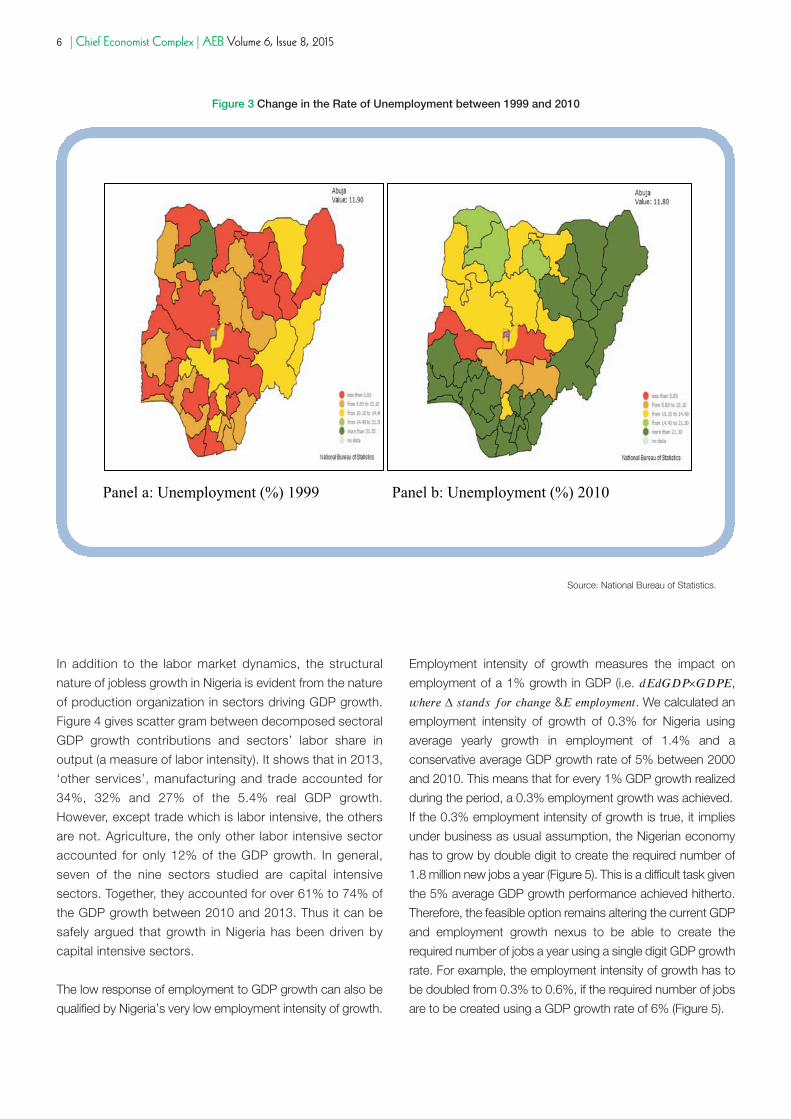
The majority of the unemployed, according to the 2010 NBS’s
national manpower Stock and Employment Survey, are the
youth, falling within the 15-24 age cohort; they are female;
they reside in rural areas; they have some form of education;
and they come from relatively poor states. The rate of
unemployment was more than national average in 2010 in 21
of the 36 states. Many of these states come from under
developed North East and Southern parts of the country.
Overall, unemployment has worsened in almost all states in
2010 compared with 1999 (Figures 3a and 3b).
Figure 2 New Entrants to Labor Force versus New Jobs Created, %
Source: Own Computation Based on WDI and NBS Data.
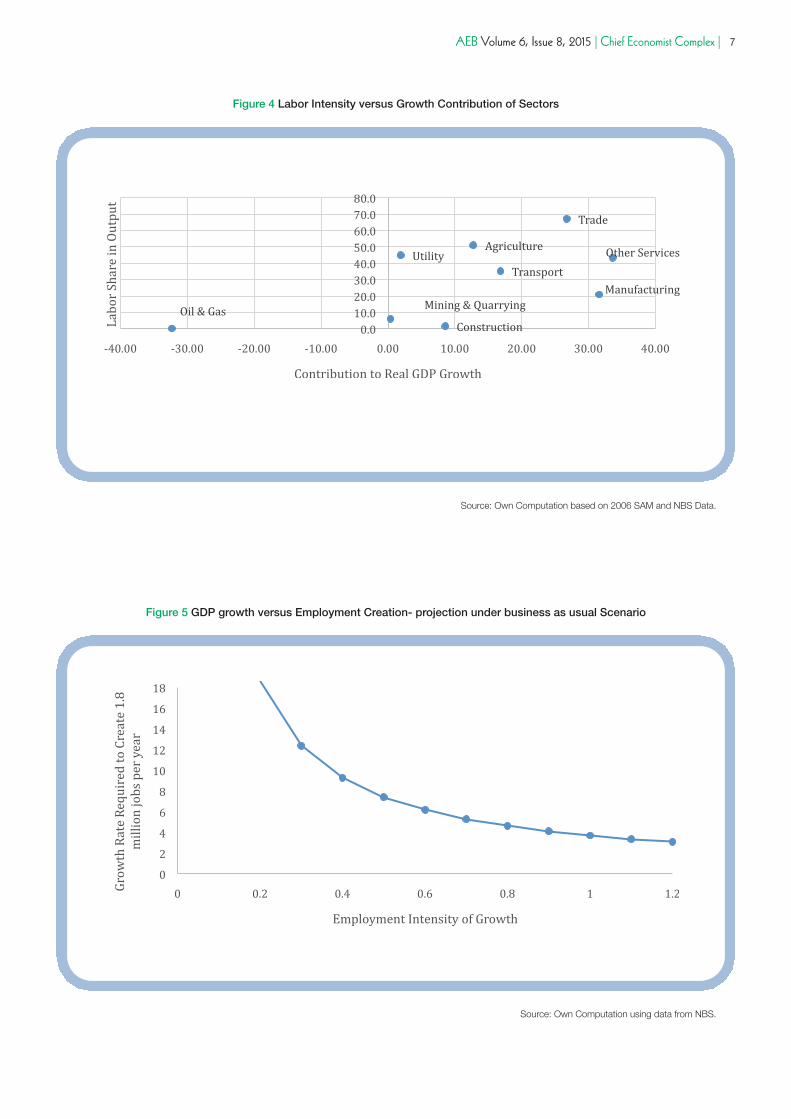
In addition to the labor market dynamics, the structural
nature of jobless growth in Nigeria is evident from the nature
of production organization in sectors driving GDP growth.
Figure 4 gives scatter gram between decomposed sectoral
GDP growth contributions and sectors’ labor share in
output (a measure of labor intensity). It shows that in 2013,
‘other services’, manufacturing and trade accounted for
34%, 32% and 27% of the 5.4% real GDP growth.
However, except trade which is labor intensive, the others
are not. Agriculture, the only other labor intensive sector
accounted for only 12% of the GDP growth. In general,
seven of the nine sectors studied are capital intensive
sectors. Together, they accounted for over 61% to 74% of
the GDP growth between 2010 and 2013. Thus it can be
safely argued that growth in Nigeria has been driven by
capital intensive sectors.
The low response of employment to GDP growth can also be
qualified by Nigeria’s very low employment intensity of growth.
Employment intensity of growth measures the impact on
employment of a 1% growth in GDP (i.e. 𝑑𝐸𝑑𝐺𝐷𝑃×𝐺𝐷𝑃𝐸,
𝑤ℎ𝑒𝑟𝑒 ∆ 𝑠𝑡𝑎𝑛𝑑𝑠 𝑓𝑜𝑟 𝑐ℎ𝑎𝑛𝑔𝑒 &𝐸 𝑒𝑚𝑝𝑙𝑜𝑦𝑚𝑒𝑛𝑡. We calculated an
employment intensity of growth of 0.3% for Nigeria using
average yearly growth in employment of 1.4% and a
conservative average GDP growth rate of 5% between 2000
and 2010. This means that for every 1% GDP growth realized
during the period, a 0.3% employment growth was achieved.
If the 0.3% employment intensity of growth is true, it implies
under business as usual assumption, the Nigerian economy
has to grow by double digit to create the required number of
1.8 million new jobs a year (Figure 5). This is a difficult task given
the 5% average GDP growth performance achieved hitherto.
Therefore, the feasible option remains altering the current GDP
and employment growth nexus to be able to create the
required number of jobs a year using a single digit GDP growth
rate. For example, the employment intensity of growth has to
be doubled from 0.3% to 0.6%, if the required number of jobs
are to be created using a GDP growth rate of 6% (Figure 5).
6 | Chief Economist Complex | AEB Volume 6, Issue 8, 2015
Figure 3 Change in the Rate of Unemployment between 1999 and 2010
Source: National Bureau of Statistics.
AEB Volume 6, Issue 8, 2015 | Chief Economist Complex | 7
Figure 4 Labor Intensity versus Growth Contribution of Sectors
Source: Own Computation based on 2006 SAM and NBS Data.
Figure 5 GDP growth versus Employment Creation- projection under business as usual Scenario
Source: Own Computation using data from NBS.
8 | Chief Economist Complex | AEB Volume 6, Issue 8, 2015
Given that unemployment is a structural problem in Nigeria,
what policy options need to be pursued in the short, the
medium to the longer term to reverse the jobless growth
situation? In the short-run, policy options could focus on
supporting sectors with high labor absorptive capacity or with
demonstrated high employment multiplier effects. This was
pursued, for example, in South Africa to reverse jobless
growth experienced in the mid to end 2000s (Alemu, 2011).
The program targeted investing in infrastructure in selected
sectors with high labor absorptive capacity. Similarly, targeted
investments were made by some developed economies to
stimulate their economies during recessions and in times of
sluggish growth in the years that followed.
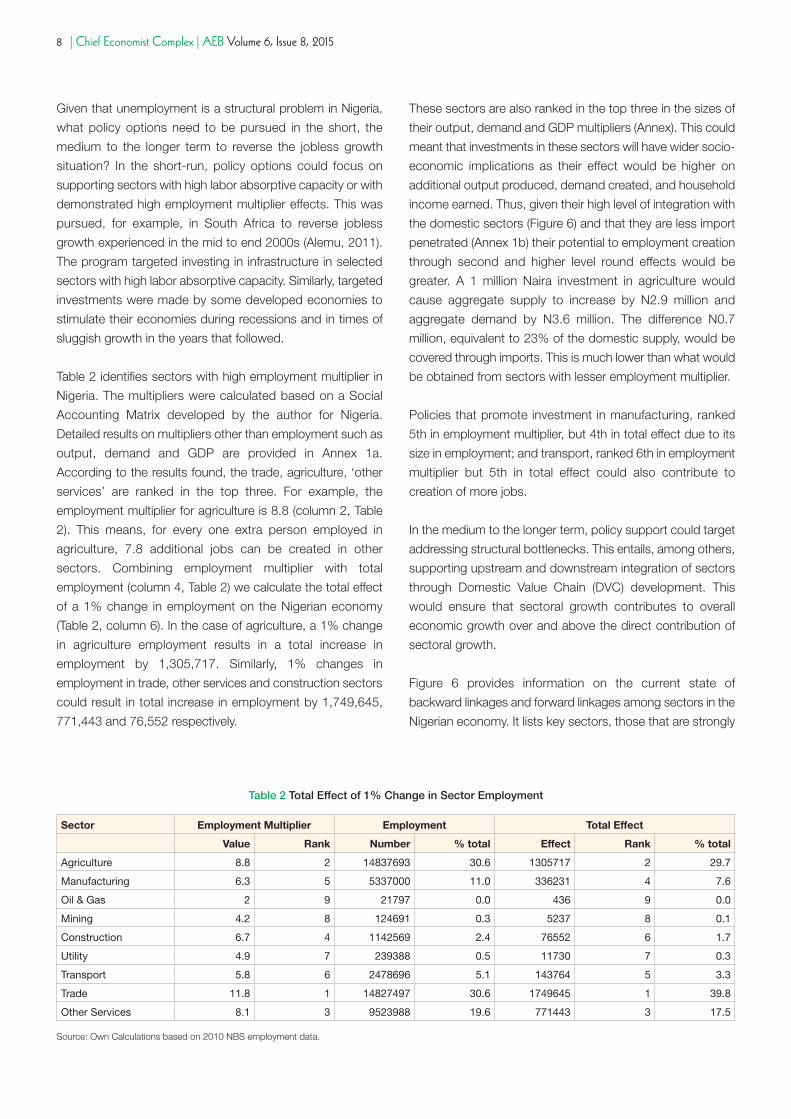
Table 2 identifies sectors with high employment multiplier in
Nigeria. The multipliers were calculated based on a Social
Accounting Matrix developed by the author for Nigeria.
Detailed results on multipliers other than employment such as
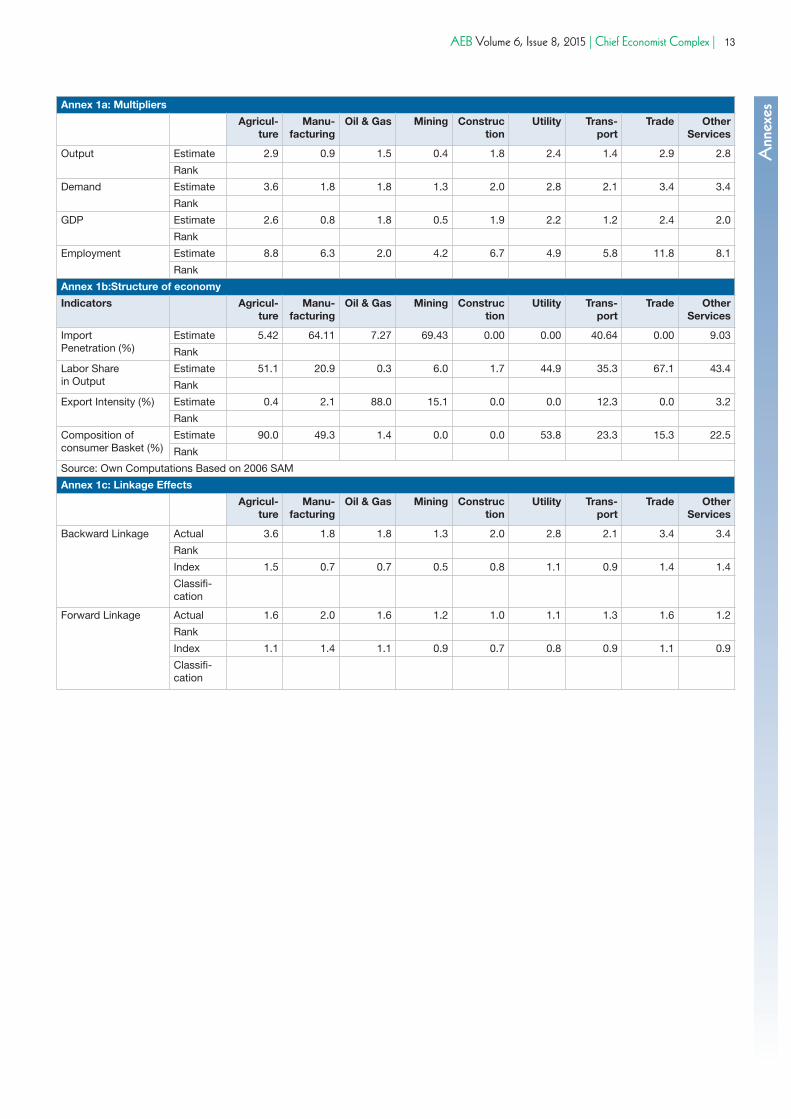
output, demand and GDP are provided in Annex 1a.
According to the results found, the trade, agriculture, ‘other
services’ are ranked in the top three. For example, the
employment multiplier for agriculture is 8.8 (column 2, Table
2). This means, for every one extra person employed in
agriculture, 7.8 additional jobs can be created in other
sectors. Combining employment multiplier with total
employment (column 4, Table 2) we calculate the total effect
of a 1% change in employment on the Nigerian economy
(Table 2, column 6). In the case of agriculture, a 1% change
in agriculture employment results in a total increase in
employment by 1,305,717. Similarly, 1% changes in
employment in trade, other services and construction sectors
could result in total increase in employment by 1,749,645,
771,443 and 76,552 respectively.
These sectors are also ranked in the top three in the sizes of
their output, demand and GDP multipliers (Annex). This could
meant that investments in these sectors will have wider socio-
economic implications as their effect would be higher on
additional output produced, demand created, and household
income earned. Thus, given their high level of integration with
the domestic sectors (Figure 6) and that they are less import
penetrated (Annex 1b) their potential to employment creation
through second and higher level round effects would be
greater. A 1 million Naira investment in agriculture would
cause aggregate supply to increase by N2.9 million and
aggregate demand by N3.6 million. The difference N0.7
million, equivalent to 23% of the domestic supply, would be
covered through imports. This is much lower than what would
be obtained from sectors with lesser employment multiplier.
Policies that promote investment in manufacturing, ranked
5th in employment multiplier, but 4th in total effect due to its
size in employment; and transport, ranked 6th in employment
multiplier but 5th in total effect could also contribute to
creation of more jobs.
In the medium to the longer term, policy support could target
addressing structural bottlenecks. This entails, among others,
supporting upstream and downstream integration of sectors
through Domestic Value Chain (DVC) development. This
would ensure that sectoral growth contributes to overall
economic growth over and above the direct contribution of
sectoral growth.
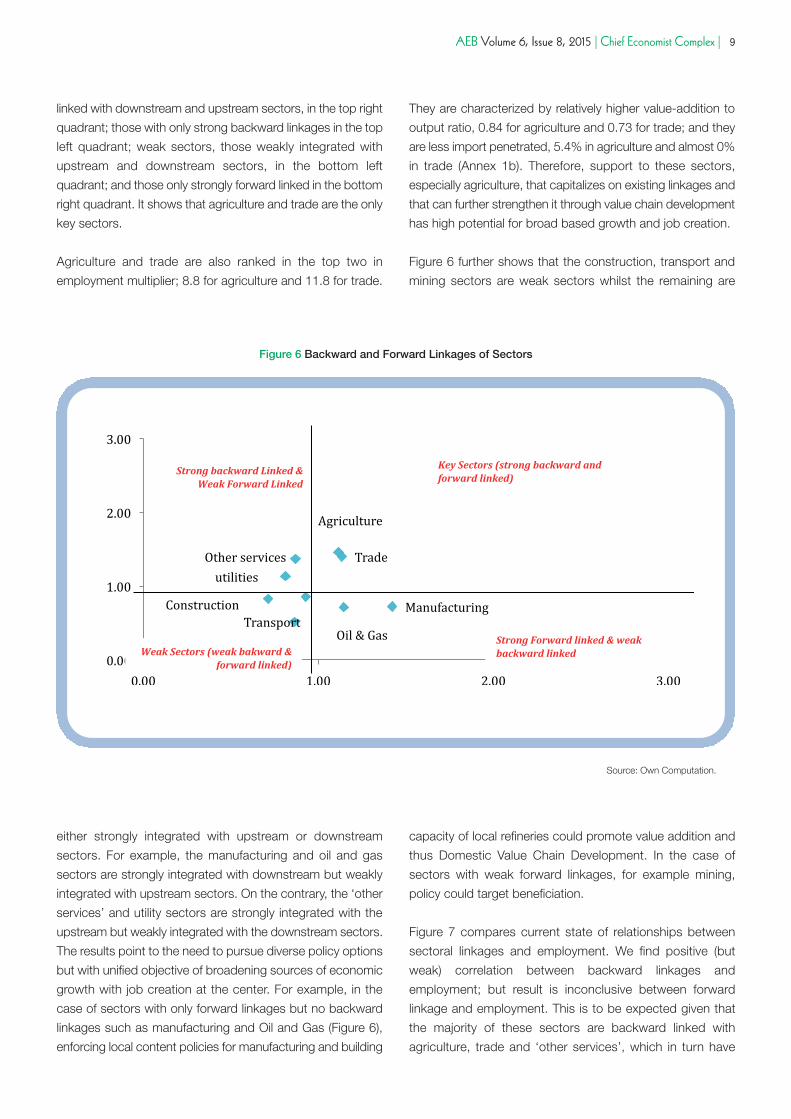
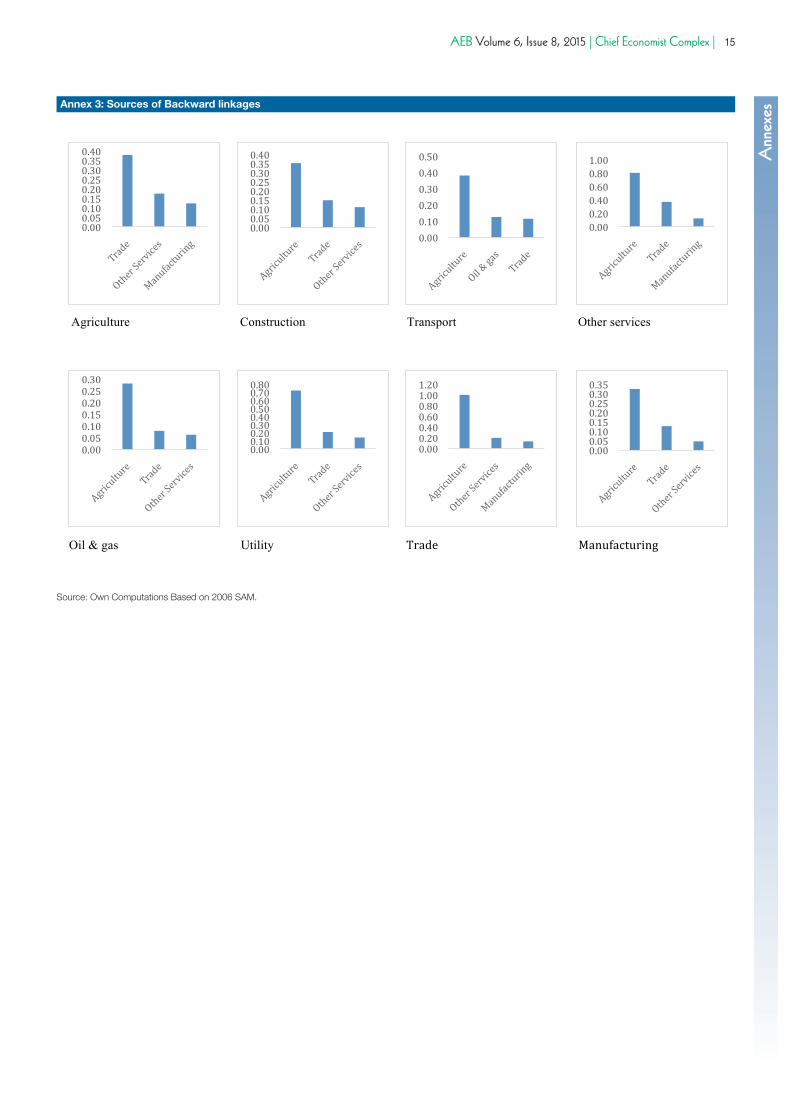
Figure 6 provides information on the current state of
backward linkages and forward linkages among sectors in the
Nigerian economy. It lists key sectors, those that are strongly
Sector Employment Multiplier Employment Total Effect
Value Rank Number % total Effect Rank % total
Agriculture 8.8 2 14837693 30.6 1305717 2 29.7
Manufacturing 6.3 5 5337000 11.0 336231 4 7.6
Oil & Gas 2 9 21797 0.0 436 9 0.0
Mining 4.2 8 124691 0.3 5237 8 0.1
Construction 6.7 4 1142569 2.4 76552 6 1.7
Utility 4.9 7 239388 0.5 11730 7 0.3
Transport 5.8 6 2478696 5.1 143764 5 3.3
Trade 11.8 1 14827497 30.6 1749645 1 39.8
Other Services 8.1 3 9523988 19.6 771443 3 17.5
Table 2 Total Effect of 1% Change in Sector Employment
Source: Own Calculations based on 2010 NBS employment data.
AEB Volume 6, Issue 8, 2015 | Chief Economist Complex | 9
linked with downstream and upstream sectors, in the top right
quadrant; those with only strong backward linkages in the top
left quadrant; weak sectors, those weakly integrated with
upstream and downstream sectors, in the bottom left
quadrant; and those only strongly forward linked in the bottom
right quadrant. It shows that agriculture and trade are the only
key sectors.
Agriculture and trade are also ranked in the top two in
employment multiplier; 8.8 for agriculture and 11.8 for trade.
They are characterized by relatively higher value-addition to
output ratio, 0.84 for agriculture and 0.73 for trade; and they
are less import penetrated, 5.4% in agriculture and almost 0%
in trade (Annex 1b). Therefore, support to these sectors,
especially agriculture, that capitalizes on existing linkages and
that can further strengthen it through value chain development
has high potential for broad based growth and job creation.
Figure 6 further shows that the construction, transport and
mining sectors are weak sectors whilst the remaining are
Figure 6 Backward and Forward Linkages of Sectors
Source: Own Computation.
either strongly integrated with upstream or downstream
sectors. For example, the manufacturing and oil and gas
sectors are strongly integrated with downstream but weakly
integrated with upstream sectors. On the contrary, the ‘other
services’ and utility sectors are strongly integrated with the
upstream but weakly integrated with the downstream sectors.
The results point to the need to pursue diverse policy options
but with unified objective of broadening sources of economic
growth with job creation at the center. For example, in the
case of sectors with only forward linkages but no backward
linkages such as manufacturing and Oil and Gas (Figure 6),
enforcing local content policies for manufacturing and building
capacity of local refineries could promote value addition and
thus Domestic Value Chain Development. In the case of
sectors with weak forward linkages, for example mining,
policy could target beneficiation.
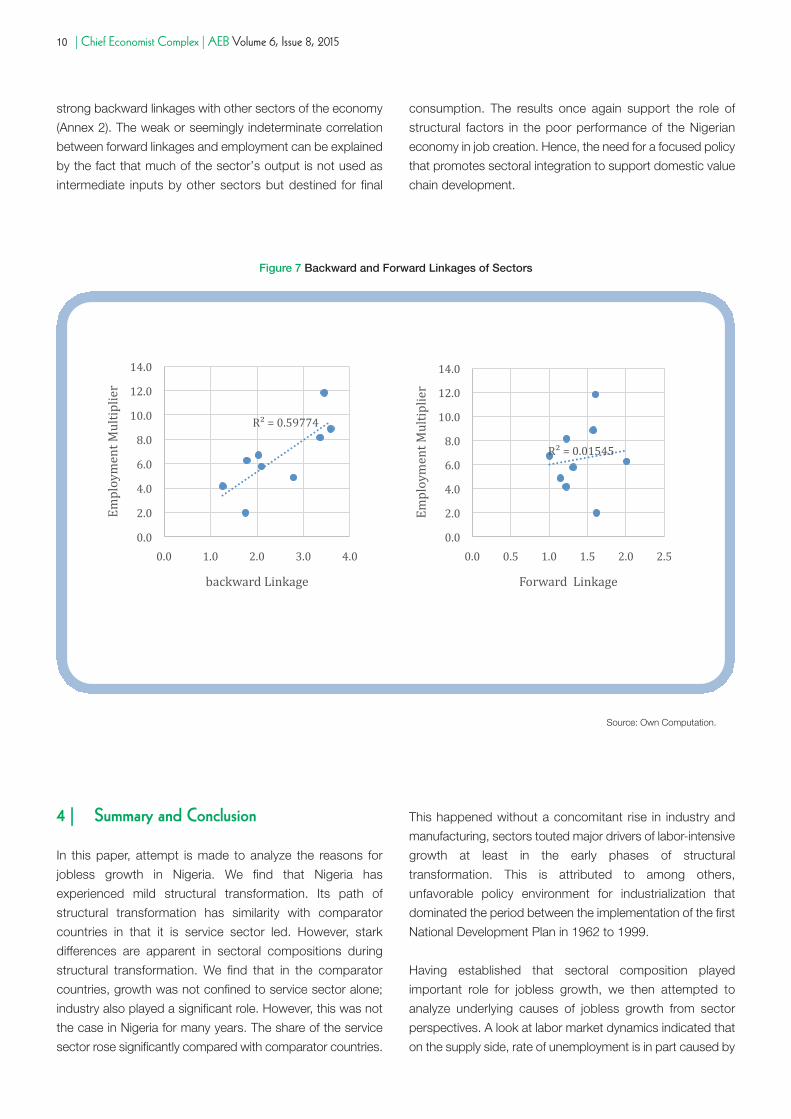
Figure 7 compares current state of relationships between
sectoral linkages and employment. We find positive (but
weak) correlation between backward linkages and
employment; but result is inconclusive between forward
linkage and employment. This is to be expected given that
the majority of these sectors are backward linked with
agriculture, trade and ‘other services’, which in turn have
10 | Chief Economist Complex | AEB Volume 6, Issue 8, 2015
strong backward linkages with other sectors of the economy
(Annex 2). The weak or seemingly indeterminate correlation
between forward linkages and employment can be explained
by the fact that much of the sector’s output is not used as
intermediate inputs by other sectors but destined for final
consumption. The results once again support the role of
structural factors in the poor performance of the Nigerian
economy in job creation. Hence, the need for a focused policy
that promotes sectoral integration to support domestic value
chain development.
Figure 7 Backward and Forward Linkages of Sectors
Source: Own Computation.
4 | Summary and Conclusion
In this paper, attempt is made to analyze the reasons for
jobless growth in Nigeria. We find that Nigeria has
experienced mild structural transformation. Its path of
structural transformation has similarity with comparator
countries in that it is service sector led. However, stark
differences are apparent in sectoral compositions during
structural transformation. We find that in the comparator
countries, growth was not confined to service sector alone;
industry also played a significant role. However, this was not
the case in Nigeria for many years. The share of the service
sector rose significantly compared with comparator countries.
This happened without a concomitant rise in industry and
manufacturing, sectors touted major drivers of labor-intensive
growth at least in the early phases of structural
transformation. This is attributed to among others,
unfavorable policy environment for industrialization that
dominated the period between the implementation of the first
National Development Plan in 1962 to 1999.
Having established that sectoral composition played
important role for jobless growth, we then attempted to
analyze underlying causes of jobless growth from sector
perspectives. A look at labor market dynamics indicated that
on the supply side, rate of unemployment is in part caused by
AEB Volume 6, Issue 8, 2015 | Chief Economist Complex | 11
demographic factors. Our estimates show that between 2000
and 2010, the number of new entrants into the labor force
increased by 2.5% per year. This was much less than the
1.4% average increase in the number of new jobs created,
contributing to a 1.1% per year increase in rate of
unemployment.
We also looked at the effect of structural factors on job
creation potential of sectors. We found that growth in Nigeria
has been less of labor intensive sector driven. For example
between 2010 and 2013, the period after rebasing of Nigerian
GDP, seven out of the nine broad sectors studied are less
labor intensive and they accounted for 61% to 74% of the
GDP growth realized during the period. In addition, to see the
extent of the impact of structural constraints in job creation,
we computed employment intensity of growth of 0.3 for
Nigeria. A 0.3 employment intensity of growth implies that
under a business as usual scenario, Nigeria’s GDP must grow
by double digit to create at least 1.8 million new jobs a year.
This is a difficult task considering the average 5% GDP growth
that has been realized since 2000.
Based on the above results, we provide the following policy
recommendations to reverse the jobless growth situation
and ensure that sectoral growth contributes to overall
economic growth over and above the direct contribution of
the sectoral growth to output. Firstly, in the short term, policy
should target supporting sectors with proven high
employment creation potential. The agriculture sector should
be major beneficiary of such programs because of its
relatively high output and employment multiplier effects. The
latter resulting from its relatively labor intensive production
organization and its strong linkage effects, upstream and
downstream, with almost all sectors of the economy.
Secondly, in the medium term, focus should center on
domestic value chain development guided by existing
backward and forward linkages. This requires nurturing
sectors with proven strong backward and/or forward
linkages. Ongoing efforts by the Federal Ministry of
Agriculture, guided by its Agricultural Transformation Agenda
(ATA), to create Staple Crop Processing Zones (SCPZ) is a
move in the right direction. However, such effort need to be
sustained and expanded to other sectors of the economy
as well. Lastly, in the longer term, support should be
extended to less linked sectors due to structural constraints
and lack of conducive policy environment by designing
policies that address their circumstances to ensure their
integration with other sectors of the domestic economy. One
policy implemented by many countries, including members
of World Trade Organization (WTO), to promote employment
creation, is a procurement policy that promotes local
content. In Nigeria, there is a local content policy; however,
its implementation is limited to certain sectors. In addition, it
is one of those policies less enforced.

12 | Chief Economist Complex | AEB Volume 6, Issue 8, 2015
Alemu, Z. (2011). Employment Intensity of Growth in South Africa, Development Bank of Southern Africa.
Badiane, O. (2012). Beyond Economic Recovery: the Agenda for Economic Transformation in Africa, Thematic Research Note
02, West & Central Africa Office, International Food Policy Research Institute.
Kingombe, C. & te Velde, D.W (2013). Structural Transformation and Employment Creation: the role of growth facilitation process
in Sub-Saharan Africa, background paper for the World Development Report.
McMillan, M. (2012). Global Patterns of Structural Change, Thematic Research Note 02, West & Central Africa Office,
International Food Policy Research Institute.
National Planning Commission (2011). Nigeria Vision 20:2020: Economic Transformation Blueprint, Abuja: 1st October
Publishing.
Office of the Secretary to the Government of the Federation (2014). Reviewing Progress, Marching Forward 2013-2014, Abuja:
Office of the Secretary to the Government of the Federation.
Teal, F. (2011). Structural Transformation, Employment Creation, and Labor Markets: the implications for poverty reduction in
Sub-Saharan Africa, paper prepared for Annual Bank Conference on Development Economics, Paris, France.
Timmer, P. (2012). The Mathematics of Structural Transformation, Thematic Research Note 02, West & Central Africa Office,
International Food Policy Research Institute.
United Nations Conference on Trade and Development, (2009). Investment Policy Review Nigeria, United Nations, New York and
Geneva.
Trading Economics (2014). Birth and Death Rates, accessed online from http://www.tradingeconomics.com/nigeria/birth-rate-
crude-per-1-000-people-wb-data.html on August 14, 2014.
References
AEB Volume 6, Issue 8, 2015 | Chief Economist Complex | 13
AnnexesAnnex 1a: Multipliers
Agricul-ture
Manu-facturing
Oil & Gas Mining Construction
Utility Trans-port
Trade OtherServices
Output Estimate 2.9 0.9 1.5 0.4 1.8 2.4 1.4 2.9 2.8
Rank
Demand Estimate 3.6 1.8 1.8 1.3 2.0 2.8 2.1 3.4 3.4
Rank
GDP Estimate 2.6 0.8 1.8 0.5 1.9 2.2 1.2 2.4 2.0
Rank
Employment Estimate 8.8 6.3 2.0 4.2 6.7 4.9 5.8 11.8 8.1
Rank
Annex 1b:Structure of economy
Indicators Agricul-ture
Manu-facturing
Oil & Gas Mining Construction
Utility Trans-port
Trade OtherServices
Import Penetration (%)
Estimate 5.42 64.11 7.27 69.43 0.00 0.00 40.64 0.00 9.03
Rank
Labor Share in Output
Estimate 51.1 20.9 0.3 6.0 1.7 44.9 35.3 67.1 43.4
Rank
Export Intensity (%) Estimate 0.4 2.1 88.0 15.1 0.0 0.0 12.3 0.0 3.2
Rank
Composition ofconsumer Basket (%)
Estimate 90.0 49.3 1.4 0.0 0.0 53.8 23.3 15.3 22.5
Rank
Source: Own Computations Based on 2006 SAM
Annex 1c: Linkage Effects
Agricul-ture
Manu-facturing
Oil & Gas Mining Construction
Utility Trans-port
Trade OtherServices
Backward Linkage Actual 3.6 1.8 1.8 1.3 2.0 2.8 2.1 3.4 3.4
Rank
Index 1.5 0.7 0.7 0.5 0.8 1.1 0.9 1.4 1.4
Classifi-cation
Forward Linkage Actual 1.6 2.0 1.6 1.2 1.0 1.1 1.3 1.6 1.2
Rank
Index 1.1 1.4 1.1 0.9 0.7 0.8 0.9 1.1 0.9
Classifi-cation
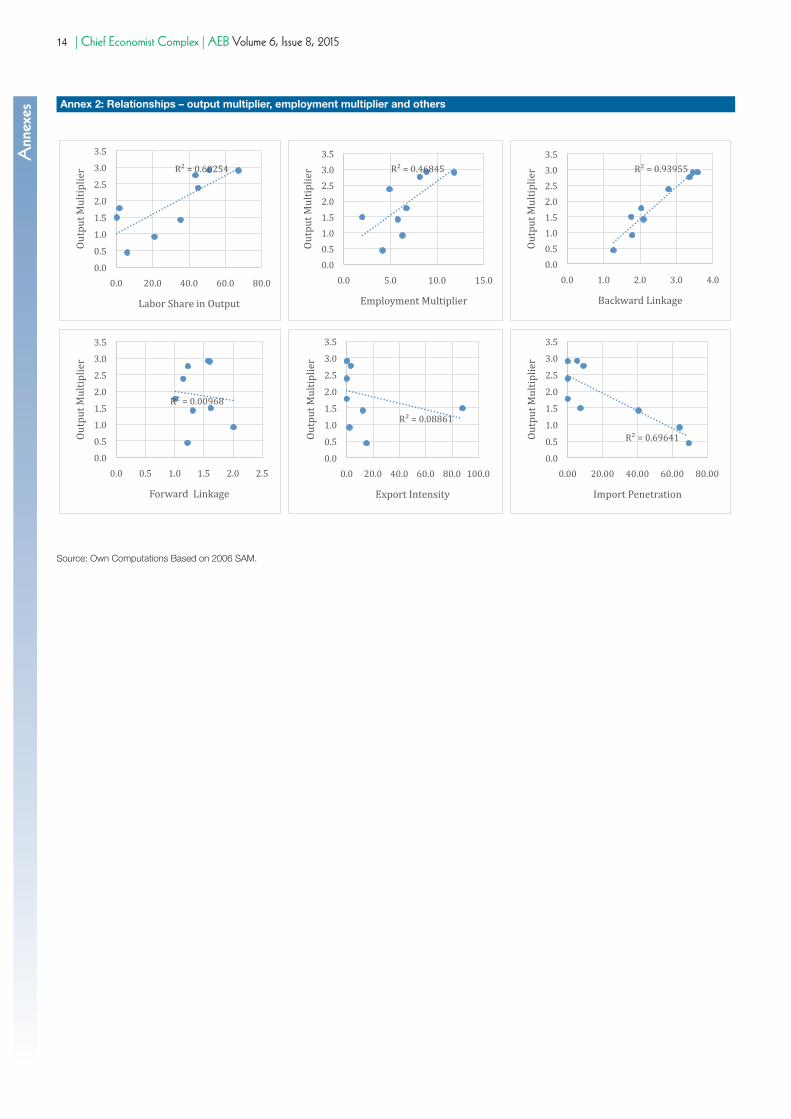
14 | Chief Economist Complex | AEB Volume 6, Issue 8, 2015Annexes Annex 2: Relationships – output multiplier, employment multiplier and others
Source: Own Computations Based on 2006 SAM.
AEB Volume 6, Issue 8, 2015 | Chief Economist Complex | 15
AnnexesAnnex 3: Sources of Backward linkages
Source: Own Computations Based on 2006 SAM.
16 | Chief Economist Complex | AEB Volume 6, Issue 8, 2015Annexes
© AfDB 2015 - DESIGN CERD/YAL
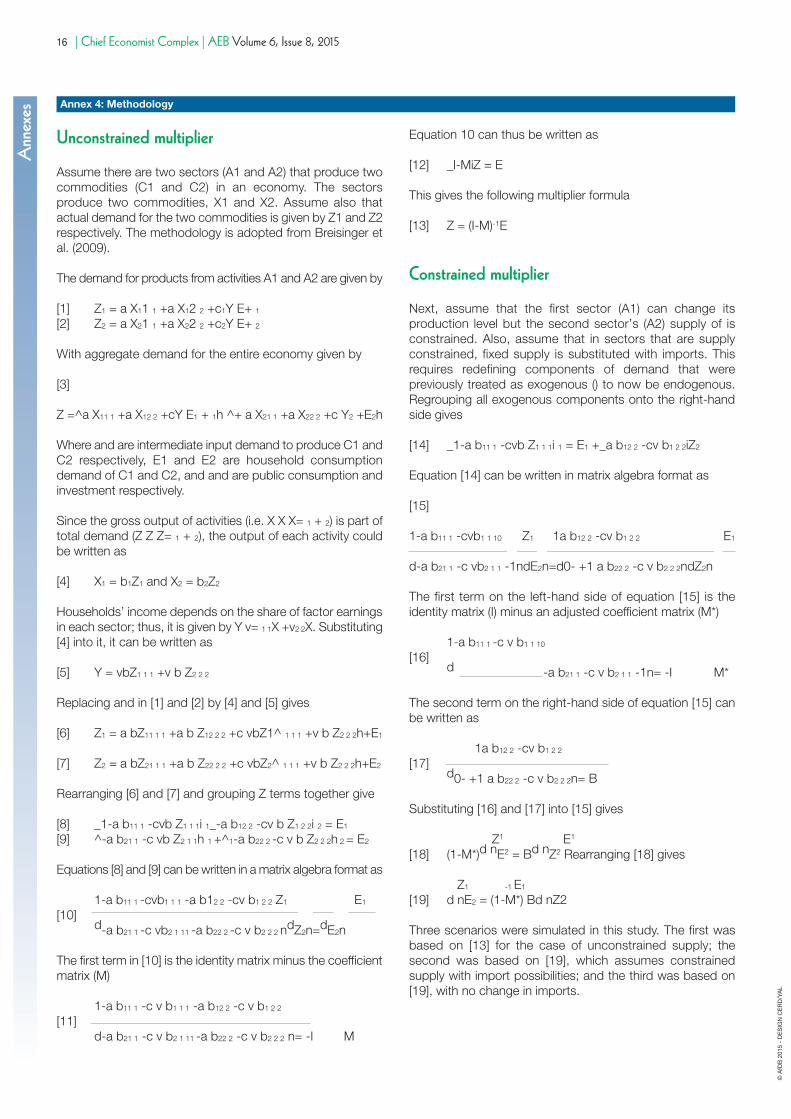
Annex 4: Methodology
Unconstrained multiplier
Assume there are two sectors (A1 and A2) that produce twocommodities (C1 and C2) in an economy. The sectorsproduce two commodities, X1 and X2. Assume also thatactual demand for the two commodities is given by Z1 and Z2respectively. The methodology is adopted from Breisinger etal. (2009).
The demand for products from activities A1 and A2 are given by
[1] Z1 = a X11 1 +a X12 2 +c1Y E+ 1[2] Z2 = a X21 1 +a X22 2 +c2Y E+ 2
With aggregate demand for the entire economy given by
[3]
Z =^a X11 1 +a X12 2 +cY E1 + 1h ^+ a X21 1 +a X22 2 +c Y2 +E2h
Where and are intermediate input demand to produce C1 andC2 respectively, E1 and E2 are household consumptiondemand of C1 and C2, and and are public consumption andinvestment respectively.
Since the gross output of activities (i.e. X X X= 1 + 2) is part oftotal demand (Z Z Z= 1 + 2), the output of each activity couldbe written as
[4] X1 = b1Z1 and X2 = b2Z2
Households’ income depends on the share of factor earningsin each sector; thus, it is given by Y v= 1 1X +v2 2X. Substituting[4] into it, it can be written as
[5] Y = vbZ1 1 1 +v b Z2 2 2
Replacing and in [1] and [2] by [4] and [5] gives
[6] Z1 = a bZ11 1 1 +a b Z12 2 2 +c vbZ1^ 1 1 1 +v b Z2 2 2h+E1
[7] Z2 = a bZ21 1 1 +a b Z22 2 2 +c vbZ2^ 1 1 1 +v b Z2 2 2h+E2
Rearranging [6] and [7] and grouping Z terms together give
[8] _1-a b11 1 -cvb Z1 1 1i 1_-a b12 2 -cv b Z1 2 2i 2 = E1
[9] ^-a b21 1 -c vb Z2 1 1h 1 +^1-a b22 2 -c v b Z2 2 2h 2 = E2
Equations [8] and [9] can be written in a matrix algebra format as
1-a b11 1 -cvb1 1 1 -a b12 2 -cv b1 2 2 Z1 E1
[10]d-a b21 1 -c vb2 1 11 -a b22 2 -c v b2 2 2 ndZ2n=dE2n
The first term in [10] is the identity matrix minus the coefficientmatrix (M)
1-a b11 1 -c v b1 1 1 -a b12 2 -c v b1 2 2
[11]d-a b21 1 -c v b2 1 11 -a b22 2 -c v b2 2 2 n= -I M
Equation 10 can thus be written as
[12] _I-MiZ = E
This gives the following multiplier formula
[13] Z = (I-M)-1E
Constrained multiplier
Next, assume that the first sector (A1) can change itsproduction level but the second sector’s (A2) supply of isconstrained. Also, assume that in sectors that are supplyconstrained, fixed supply is substituted with imports. Thisrequires redefining components of demand that werepreviously treated as exogenous () to now be endogenous.Regrouping all exogenous components onto the right-handside gives
[14] _1-a b11 1 -cvb Z1 1 1i 1 = E1 +_a b12 2 -cv b1 2 2iZ2
Equation [14] can be written in matrix algebra format as
[15]
1-a b11 1 -cvb1 1 10 Z1 1a b12 2 -cv b1 2 2 E1
d-a b21 1 -c vb2 1 1 -1ndE2n=d0- +1 a b22 2 -c v b2 2 2ndZ2n
The first term on the left-hand side of equation [15] is theidentity matrix (I) minus an adjusted coefficient matrix (M*)
1-a b11 1 -c v b1 1 10
[16]d -a b21 1 -c v b2 1 1 -1n= -I M*
The second term on the right-hand side of equation [15] canbe written as
1a b12 2 -cv b1 2 2
[17]d0- +1 a b22 2 -c v b2 2 2n= B
Substituting [16] and [17] into [15] gives
Z1 E1
[18] (1-M*)d nE2 = Bd nZ2 Rearranging [18] gives
Z1 -1 E1
[19] d nE2 = (1-M*) Bd nZ2
Three scenarios were simulated in this study. The first wasbased on [13] for the case of unconstrained supply; thesecond was based on [19], which assumes constrainedsupply with import possibilities; and the third was based on[19], with no change in imports.