Embed Size (px)
Citation preview

EV METTL3
CD11b-APC
EVMETTL3
METTL3-CD0
20
40
60
80
100
120
140
Col
ony
num
ber
GMGEMM
BFU-ECFU-E
0.00
0.25
0.50
0.75
1.00
1.25
1.50
1.75
norm
aliz
ed %
of p
aren
tal c
ells
METTL3-KD METTL3-OV
* *
*
***
CD34
contr
olsh
RNA#9sh
RNA#12
METTL3
METTL3
-CD
Control shRNA#9 shRNA#12
CD14-PE
Control shRNA#9 shRNA#12
k
h
CD11b-APC
g
Control #9 #120
10
20
30
40
50
60
70
Col
ony
num
ber
GMGEMMBFU-ECFU-E
METTL3-KD
**
Control
f
ea c
d
shRNA#9
METTL3-CDEV METTL3 i
shRNA#12
CD34-PE-Cy7
b
EV METTL3-CD
CD11b-APC
EV METTL3-CD
coun
tco
unt
EV METTL3
CD14-PE
CD14-PE
METTL3
FLAG
ACTIN
control
METTL3
METTL3-CD
0
2
4
6
8
Rel
ativ
e ex
pres
sion
(nor
mal
ized
to A
CTI
N)
***
***
EVMETTL3METTL3-CD
j l
HSCMPP
CMPGMP
MEP
Myeloi
d cell
s
B cells
T cells
0.00
0.01
0.02
0.03
0.04
0.05
0.06
rela
tive
mR
NA
expr
essi
on
(nor
mal
ized
to a
ctin
)
***
***
*
ns
Mettl3
pApC
pUpm A p lj
pGm
pG
6
A
B
10 um
Supplementary Figure 1
m6A is required to maintain hematopoietic stem/progenitor cells in an undifferentiated state.
(a) Representative TLC imagines of Figure 1b. (b) Colony forming assay of HSPCs in Figure 1(a-e). 104 CD34+ cells were plated from
control or METTL3 knockdown cells four days post-transduction. The total number of colony forming units (CFUs) was scored two
weeks after plating. Macrophage (light blue), Erythroid (red), GEMM =Granulocyte/Erythrocyte/Macrophage/Megakaryocyte (dark blue),
and GM = Granulocyte/Macrophage (grey). n=3 independent experiments. ** p <0.01 two tailed t -test. (c-d) Myeloid differentiation of
HSPCs in Figure 1(a-e). Representative FACS analysis used to quantify differentiation of HSPCs in Figure 1e. (e) Morphological
analysis of HSPCs in Figure 1(a-e). Cytospins of control and METTL3 knockdown normal hematopoietic cells were prepared and
stained with GIEMSA. (f) Expression of stem/progenitor cells CD34+ surface marker. Representative FACS analysis used to quantify
differentiation of HSPCs in Supplemental figure 1i. (g) Representative TLC imagines of Figure 1f.(h) Colony forming assay of HSPCs
in Figure 1 (f-h). n=2 independent experiments. (i) Quantitative summary of FACS analysis of CD34+ expression in control and
METTL3-knockdown and in HSPCs transduced with EV and wild type METTL3 and METTL-CD. *p < 0.05, **p < 0.01, two-tailed t test.
(j) Immunoblot analysis of METTL3 expression in HSPCs in figure 1 (f-h). Top: representative immunoblot images. Bottom:
doi:10.1038/nm.4416

quantitative summary of the immunoblots. n=3 independent experiments; error bars, s.e.m. * p<0.05, **p<0.01,***p<0.001 two-tailed t
test(k) Representative FACS analysis used to quantify differentiation of HSPCs in Figure 1h. (l) Mettl3 mRNA expression in mouse
hematopoietic cells. Bone marrow cells from n=4 wild type C57BL/6J mice were harvest. Cells from different population were sorted
based on surface markers previously reported1. HSC: Hematopoietic stem cells; MPP: Multi-potent progenitor; GMP: Granulocyte
Macrophage progenitor; CMP: Common Myeloid progenitor; MEP: Megakaryocyte-Erythrocyte progenitor; Myeloid cells (Gr1+Mac1+);
B cells (B220+) and T cells (IgM+). n=4 independent experiments; error bars, s.e.m. * p<0.05, **p<0.01,***p<0.001 two-tailed t test
doi:10.1038/nm.4416

Annexin V
DA
PI
control shRNA#9 shRNA#12
CD11b
0
5
10
15
20
25
30
35
% C
D14
hig
h ce
lls
*
#9 #12METTL3-KD
control
CB-CD34
+
MOLM13
Nomo-1NB4
Kasumi-1
OCI-AML3
TF-1THP-1
KG1
KCL-22K562U 93
70
2
4
6
8
MET
TL3
mR
NA
(Rel
ativ
e to
AC
TIN
)
*
**
**
*
****
**
*
Control
CD14
o p
shRNA#9 shRNA#12
METTL3
ACTIN
control #9 #12
METTL3-KD
0 D1 D2 D3 D40
25
50
75
100
125
cell
num
ber
x10
4 ControlshRNA#9shRNA#12
0
10
20
30
% A
nnex
in p
ositi
ve c
ells
**
*
#9 #12METTL3-KD
control 0 D1 D2 D3 D40
25
50
75
100
125
150
cell
num
ber
x10
4 control#9#12
0
5
10
15
20
% A
nnex
in p
ositi
ve c
ells
*
**
#9 #12METTL3-KD
control
METTL3
ACTIN
cont
rol
#9
#12
METTL3-KD
METTL3
ACTIN
cont
rol
#9
#12
METTL3-KD
0
20
40
60
80
% C
D14
hig
h ce
lls **
*
#9 #12METTL3-KD
control
NOMO-1
NB4
METTL14
ACTIN
CB-CD34
+ M
OLM13
NOM
O-1
THP-
1 KA
SUM
I-1
NB4
K562
KC
L-22
KG
-1
TF-1
U-9
73
Uveal
melano
ma
Mesoth
eliom
a
pRCCDLB
C
Bladde
r
Cholan
gioca
rcino
ma
Uterine
CS
Ovaria
n
Uterine
Lung
squGBM
Colorec
tal
Cervica
lACC
Head&
Neck
Sarcom
aLiv
er
Pancre
as
Melano
maPCPG
Testi
cular
germ
cell
Lung
aden
o
Glioma
Prostat
e
Thymom
a
ccRCC
AML
Thyroi
d
chRCC
Breast
0
2
4
6
8
10
12
METTL14
mR
NA
expr
essi
on lo
g2
****
** ** **** ns ns
****b
ed
f
h
g
i
j lk m
n
a
Normal
Karyotyp
e
Complex K
aryotyp
e
Inv(16)
t(15;1
7)
t(8;12
)
t(11q
23)/M
LLMDS
0
2
4
6
8
10
12
Log2
mR
NA
expr
essi
onAML
nsc
0.0
0.4
0.8
1.2
Rel
ativ
e ex
pres
sion
(nor
mal
ized
to A
CTI
N)
******
0.0
0.4
0.8
1.2
Rel
ativ
e ex
pres
sion
(nor
mal
ized
to A
CTI
N)
******
1 0.6 1.2 0.4 1.2 0.5 0.7 0.8 0.3 0.6 1.1
1 0.85 0.84 0.96 0.74 1.1
CD14-PE
CD11b-APC
Annexin V-PE
10 um
doi:10.1038/nm.4416

Supplementary Figure 2
METTL3 is essential for acute myeloid leukemia cells
(a) mRNA expression of METTL3 in 11 AML cell lines versus control HSPCs. RNA was extracted from cells and METTL3 mRNA was
quantified by qPCR. ACTIN serves as control. (b) METTL3 mRNA expression AML patients. The graph shows the log2 expression of
METTL3 from patients with various subtypes of AML and MDS. Normal karyotype, n=989; Complex karyotype, n=87; AML Inv(16),
n=77; AML t(15;17), n=87; AML t(8;12), n=98, AML t(11q23)/MLL, n=58; MDS, n=228. (BloodPool data of METTL3 probe 209265_s_at
from U133 Plus 2.0 array)2. (c) METTL14 mRNA expression in AML compared to other cancers. **** p<0.00001, ** p<0.01 ns not
significant, ANOVA with multiple comparisons. (d) METTL14 protein levels in normal HSPCs and AML cell lines. Quantitative summary
is shown. (e) Representative FACS analysis used to quantify apoptosis of MOLM13 cells in Figure 2f. (f) Representative FACS
analysis used to quantify differentiation of MOLM13 cells in Figure 2g. (g) Morphological analysis of HSPCs in Figure 2(g). Cytospins
of control and METTL3 knockdown MOLM13 cells were prepared and stained with GIEMSA. (h-o) METTL3 depletion multiple AML cell
lines induces differentiation and apoptosis. Immunoblot of METTL3 expression four days post-transduction with shRNA lentivirus in
NOMO-1 cells (h) and NB4 cells (l). Quantitative summary is shown. Knockdown of METTL3 reduced proliferation in NOMO-1 cells (i)
and NB4 cells (m). NOMO-1 and NB4 cells had increased apoptosis (j and n, respectively) and increased myeloid differentiation (k and
o, respectively) following METTL3 depletion. n=3 independent experiments; error bars, s.e.m. * p<0.05, **p<0.01,***p<0.001 two-tailed t
test. (p) Immunoblot analysis of MOLM13 METTL3 knockdown cells that outgrow in moribund leukemic mice. Leukemia cells were
sorted for human CD45 positive (a marker for hematopoietic cells) from leukemic mice in Figure 2h. ACTIN servers as loading control.
Quantitative summary is shown.
doi:10.1038/nm.4416

control #12 control #120
1
2
3
4
5
Rel
ativ
e ex
pres
sion
(nor
mal
ized
to A
CTI
N)
EV METTL3-R
***
***
0
2
4
6
8
10
Fold
dep
letio
n of
GFP
pos
itive
cel
ls
Mettl3-TSS
Mettl3-Enzymatic domain
#1 #2 #3 #1 #2 #3 #1 #2
EVcontrol
***
ns
0
10
20
30
40
50
% C
D33
hig
h ce
lls
*
0.8
1.0
1.2
1.4
1.6
1.8
norm
aliz
ed M
FI
control#12 control #12EV METTL3-12R
**
ns
*CD11b - MFI
control #12METTL3-R
0
10
20
30
% p
aren
tal c
ells
control #12EV
****
CD11b
ns
d
0
10
20
30
% A
nnex
in p
ositi
ve c
ells
control #12 control #12EV METTL3-R
**
ns
**
0
10
20
30
40
50
60
% C
D11
b hi
gh c
ells *
0
10
20
30
40
% A
nnex
in V
pos
itive
cel
ls *
Control sg1 sg2
f
hg
e
ba c
Control sg1 sg2 Control sg1 sg2
j
METTL3
ACTIN
control #12 control #12
EV METTL3-R
METTL3
ACTIN
cont
rol
sg1
sg2
i kAnnexin V-PE CD11b-APC
C17orf89
2500 5000 7500 10000 12500 15000 17500 20000
-7
-6
-5
-4
-3
-2
-1
0
1
2
3
C1orf27
FTO
METTL3METTL14
WTAP
ALKHB5
Genes ranked by average CRISPR SCORE
Aver
age
CR
ISPR
SC
OR
E
MOLM13
KIAA1429
MOLM-13HEL
MonoMac1MV4;11
NB4 (replicate 1)
NB4 (replicate 2)
OCI-AML2
OCI-AML3
OCI-AML5
P31/FUJPL-21
SKM-1 TF-1THP-1
EOL-1-3
-2
-1
0
1
Aver
age
CR
ISPR
SC
OR
E
METTL3 METTL14 WTAP KIAA1429 FTO ALKBH5
l m
doi:10.1038/nm.4416

Supplementary Figure 3
METTL3 is required for survival of acute myeloid leukemia cells
(a) Immunoblot of control or knockdown MOLM13 cells previously transduced with empty vector (EV) or METTL3-12R resistant to
targeting by shRNA#12. Top: representative immunoblot images. Bottom: quantitative summary of the immunoblots. n=3 independent
experiments; error bars, s.e.m. * p<0.05, **p<0.01,***p<0.001 two-tailed t test. (b-d) Overexpression of the shRNA-resistant METTL3-
12R rescues survival and differentiation defects of MOLM13 cells depleted of endogenous METTL3. Quantitative summary of Annexin
V staining (b), percentage of CD11b cells (c) and MFI of CD11b expression (d). n=3 independent experiments, error bars, s.e.m. *
p<0.05, **p<0.001 two-tailed t test. (e-f) Representative FACS analysis used to quantify apoptosis of MOLM13 cells in Supplemental
Figure 2b and differentiation in Supplemental Figure 2c-d. (g-j) CRISPR/Cas9 mediated- deletion of METTL3 in MOLM13 cells. (g)
Immunoblot showing METTL3 expression in MOLM13 cells upon CRISPR/Cas9-mediated deletion with two independent sgRNAs (sg1
and sg2) three days post transduction. ACTIN serves as loading control. Cells were assayed for Annexin V positivity and (h) and
differentiation (i-j) as previously described with METTL3 shRNAs. n=3 independent experiments; error bars, s.e.m. * p<0.05, **p<0.001,
*** p <0.0001 two-tailed t test. (k) The enzymatic domain of METTL3 is essential for AML cell viability. Mouse MLL-AF9 NRASG12D
constitutively expressing Cas9 (RN2-Cas9) cells were transduced with guide RNAs (gRNAs) that specifically target regions of METTL3.
Targeted regions include the transcription start site (TSS, black bars), METTL3 enzymatic domain (blue bars), or an empty virus control
(grey bars). Viability was measured as the fold depletion of GFP positive cells (gRNAs transduced cells) beginning two days post-
transduction. n=4 independent experiments, error bars, s.e.m. * p<0.05, **p<0.001 two-tailed t test. (l) CRISPR score rank of members
of the RNA methylation “writers” complex and “erasers” in MOLM13 cells. CRISPR score (CS) is the average log2 fold-change in the
abundance of all single guide (sg)RNAs targeting the gene after 14 population doublings3. Members of the “writer” complex METTL3,
METTL14, WTAP, and KIAA1429 were highlighted in red. The “erasers” were highlighted in blue. C1orf27 and C17orf89, highlighted in
purple, were genes previously reported to be essential for survival of leukemia cells. (m) CRISPR score of members of the RNA
methylation “writers” complex and “erasers” across all 14 tested leukemia cell lines3.
doi:10.1038/nm.4416

a b
0 1 2 3 4 5 5 6 7 8 910 10152025303540455055606570758002468
10
200400600800
1000150020002500
# of m6A sites per gene#
of g
enes
PTEN
BCL-2
MYC
c d
e f
MOLM13 MOLM13
HELA HELA m6A CLIPg
Monocytes vs. HSC genes up
p=0.259
Ranked m6A sites
NES=1.89
Supplementary Figure 4
Mapping m6A in MOLM13 at single-nucleotide resolution (a) The distribution of m6A in MOLM13 cells compared to the distribution of HEK293T cells (b) Plot showing the number of m6A sites
per gene (x-axis) versus the number of genes (y-axis). (c) Correlation between the number of m6A sites and mRNA expression.
Transcripts were binned based on the number of m6A sites: no sites, 1 site, 2-7 sites, or 8+ sites and analyzed their expression. n=3
independent replicates per condition, **** p<2.2e-16, one-way ANOVA with Tukey’s post-hoc test. (d) Translational efficiency is
correlated with the number of m6A sites per transcript. Transcripts were binned based on the number of m6A sites: no sites, 1 site, 2-7
doi:10.1038/nm.4416

sites, or 8+ sites and analyzed their translational efficiency. n=3 independent replicates per condition, **** p<2.2e-16, one-way ANOVA
with Tukey’s post-hoc test. (e) Correlation between m6A sites and mRNA expression after METTL3 knockdown in HeLa cells. n=1
independent replicate per condition, **** p<2.2e-16, one-way ANOVA with Tukey’s post-hoc test. (f) Correlation between m6A sites and
translational efficiency (TE) after METTL3 knockdown in HeLa cells. n=1 independent replicate per condition, **** p<2.2e-16, one-way
ANOVA with Tukey’s post-hoc test. (g) The Gene set promoting monocyte differentiation enrichment analysis for m6A ranked lists.
doi:10.1038/nm.4416

Spike-in controls
A IVT RNA m6A IVT RNA0.00.20.40.60.81.010
20
30
40
50
% re
cove
ry (n
orm
aliz
ed to
inpu
t)
ControlshRNA#9shRNA#12
CD14-PE
shRNA#12Control shRNA#9
CD11b-APC
shRNA#12Control shRNA#9
DMSO
PI3Ki
AKTi
Con
trol
#9
#12
BIM
ACTIN
METTL3-KD
contr
ol #9 #12
0
2
4
6
8
10
Rel
ativ
e ex
pres
sion
(nor
mal
ized
to A
CTI
N) control
#9
#12***
***
METTL3-KD
a b
c4 days post transduction
Con
trol
#9
#12
BIM
ACTIN
METTL3-KD
3 days post transduction
contr
ol #9 #12
0
2
4
6
8
Rel
ativ
e ex
pres
sion
(Nor
mal
ized
to A
CTI
N) control
#9#12
METTL3-KD
* **
Myc-1 Myc-2 Myc-3
PTEN-1 PTEN-2
BCL2-1 BCL2-2
d
10.4 37.5 17.1
5.89 24.1 12.7
5.66 26.2 11.3
9.41 24.2 17
6.73 13.9 11.3
6.97 14.9 10.8
doi:10.1038/nm.4416

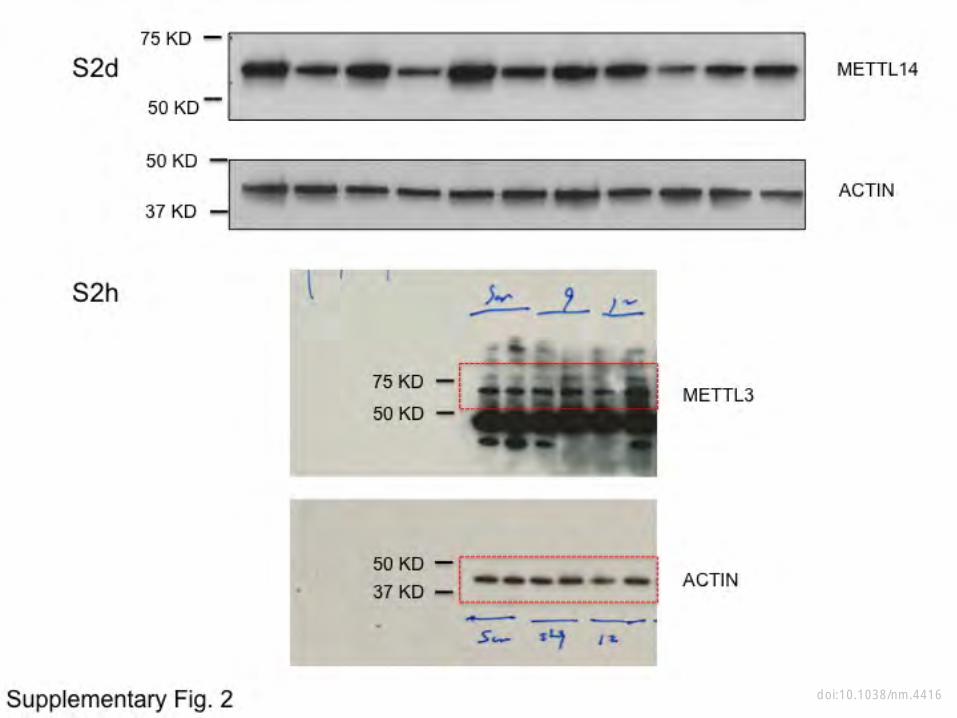
Supplementary Figure 5
M6A modulates expression of targets c-MYC, PTEN and BCL2 and attenuation of the AKT pathway.
(a) m6A sites in MYC, PTEN, and BCL2. Reads (unique tags per millions) from miCLIP in MOLM13 with called m6A sites indicated with
black vertical bars. Zoomed-in areas show individual m6A sites called based on CàT transitions. (b) Validation of meRIP-qPCR with
spike-in RNA controls. Negative and positive control RNAs were in vitro transcribed with either ATP or m6ATP in the reaction. 100 ng
of each RNA were added to poly-A+ purified RNA from MOLM-13 cells immediately before immunoprecipitation with an anti-m6A
antibody. Plots represent the recovery of the control RNAs after immunoprecipitation as a percentage of the total input. (c) Immunoblot
analysis for the protein level of BIM upon METTL3 depletion in MOLM13 cells. The panels are representative blots from three days or
four days post-transduction of MOLM13 cells with 2 shRNAs targeting METTL3. ACTIN serves as loading control. Left: representative
immunoblot images. Right: quantitative summary of the immunoblots. n=3 independent experiments; error bars, s.e.m. * p<0.05,
**p<0.01,***p<0.001 two-tailed t test. (d) Inhibition of the AKT pathway inhibits myeloid differentiation of MOLM13 METTL3 knocked
down cells. Representative FACS analysis used to quantify differentiation of MOLM13 cells in Figure 4g-h.
doi:10.1038/nm.4416

doi:10.1038/nm.4416

doi:10.1038/nm.4416

doi:10.1038/nm.4416

doi:10.1038/nm.4416

doi:10.1038/nm.4416

doi:10.1038/nm.4416

doi:10.1038/nm.4416

doi:10.1038/nm.4416
doi:10.1038/nm.4416

doi:10.1038/nm.4416

doi:10.1038/nm.4416

doi:10.1038/nm.4416

Supplementary Figure 6
Original un-cropped imagines of western blots Each blot is depicted corresponding to the cropped blots shown in main figures.
Reference: 1. Kharas, M.G., et al. Musashi-2 regulates normal hematopoiesis and promotes
aggressive myeloid leukemia. Nat Med 16, 903-908 (2010). 2. Bagger, F.O., et al. BloodSpot: a database of gene expression profiles and
transcriptional programs for healthy and malignant haematopoiesis. Nucleic acids research 44, D917-924 (2016).
3. Wang, T., et al. Gene Essentiality Profiling Reveals Gene Networks andSynthetic Lethal Interactions with Oncogenic Ras. Cell 168, 890-903 e815 (2017).
doi:10.1038/nm.4416