Embed Size (px)
Citation preview

S u S t a i n i n g P a t h w a y S t o D i v e r S i t y ®
A Comprehensive exAminAtion of Diversity DemogrAphiCs, initiAtives, AnD poliCies in CorporAte legAl DepArtments

M C C A Pat h way s R e s e A R C h
8
From Compliance to Inclusion

w w w. M C C A . C O M
i
Copyright 2011 by the Minority Corporate Counsel Association (MCCA). All rights reserved. No part of this document may be copied, reproduced, referenced without appropriate citation to MCCA, stored in a retrieval system, or transmitted in any form or by any means, including via the Internet, without the written permission of MCCA.
sustaining Pathways to Diversity:®
A Comprehensive examination of Diversity Demographics, Initiatives, and Policies in Corporate Legal Departments

M C C A Pat h way s R e s e A R C h
ii
Corporate Law Department Members
The Minority Corporate Counsel Association (MCCA) acknowledges the support of the following law department members and our Firm Affiliate Network (FAN) law firms whose financial contributions have helped to advance the goal of furthering diversity in the legal profession. For information about both
groups, please contact MCCA’s Director of Membership at (202)739-5906, or visit mcca.com
Corporate Law Department Members3M Company
Accenture LLP
AECOM
Allstate Insurance Company
American Airlines
AON Corporation
Astrazeneca
Bank of America
Benistar Admin Services, Inc.
Boehringer Ingelheim Corporation
Booz Allen Hamilton
BP America Inc.
Capital One
Caraustar Industries, Inc.
Cargill Inc.
Catalent Pharma Solutions
Chevron Corporation
CIGNA Corporation
CITGO Petroleum Corporation
Computer Sciences Corporation
ConAgra Foods, Inc.
ConocoPhillips
Consolidated Edison Company of New York
Constellation Energy
Cox Communications, Inc.
Deere & Company
Del Monte Foods Corporation
DHL Express
Diageo North America
Duke Energy Corporation
DuPont Company
Eaton Corporation
Eli Lilly & Company
Entergy Corporation
Exelon Business Services Company
Federal Home Loan Bank of San Francisco
Freddie Mac
Gap Inc.
Genentech, Inc.
General Electric Company
General Mills
GlaxoSmithKline
Graduation Management Admission Council
GTSI Corporation
H.J. Russell & Company
Halliburton
Harley-Davidson Motor Company
Hewlett-Packard Company
Honeywell
IBM Corporation
Intel Corporation
International Paper Company
ITT Corporation
JC Penney Company, Inc.
JetBlue Airways Corporation
JM Family Enterprises, Inc.
JPMorgan Chase Bank NA
Kaiser Permanente.
KeyCorp
Kraft Foods Inc.
Kroll, Inc.
Leo Burnett Company, Inc
Liberty Mutual Insurance Company
LifeLock, Inc.
Liquidity Services, Inc.
Macy’s Inc.
Marriott International, Inc.
MassMutual Financial Group
McDonald’s Corporation
Merck & Co., Inc.
National Grid
Navistar, Inc.
New York Life Insurance Company
Newegg Inc.
Nike Inc.
Pepco Holdings, Inc.
PepsiCo. Inc
Pfizer Inc.
Pitney Bowes Inc.
Porzio Pharmaceutical Services, LLC
PPG Industries, Inc.
PRAXAIR, Inc.
Premier Media Inc.
Prudential Financial
Quest Diagnostics Incorporated
Qwest Communications International Inc.
Reckitt Benckiser Inc.
Reed Elsevier Inc.
Rockwell Collins
Rolls Royce North America
Sara Lee
Scripps Networks Interactive, Inc
Sears Holding Company
Sempra Energy
Shell Oil Company
SMG Consulting, Inc.
Sodexo, Inc
Sony Electronics Inc.
Southern California Edison Company
Staples, Inc.
Starbucks Coffee Company
Starwood Hotels & Resorts Worldwide
Taco Bell Corporation
Target Corporation
The Brookings Institution
The Church Pension Fund
The Clorox Company
The Dow Chemical Company
The Juilliard School
The Vanguard Group, Inc.
UBS AG
UnitedHealth Group
United Technologies Corporation
U.S. Foodservice, Inc.
Verizon
Wal-Mart Stores, Inc.
Waste Management
WellPoint, Inc.
Wells Fargo & Company
Xerox Corporation
XO Holdings, Inc.
Firm Affiliate Network (FAN)Bressler, Amery & Ross, PC
Bricker & Eckler LLP
Buchanan, Ingersoll & Rooney, PC
Butler, Snow, O’Mara, Stevens & Cannada, PLLC
DeMahy Labrador & Drake, PA
Davis & Gilbert, LLP
Epstein, Becker & Green, PC
Finnegan, Henderson, Farabow, Garrett & Dunner, LLP
Fitzpatrick, Cella, Harper & Scinto
Frost Brown Todd LLP
Goldberg Segalla, LLP
Ice Miller, LLP
Igbanugo Partners International Law Firm
Kenyon & Kenyon, LLP
King Branson, LLC
Lathrop & Gage, LLP
Leader & Berkon LLP
McGuireWoods, LLP
Montgomery, Barnett, Brown, Read, Hammond & Mintz, LLP
Morgan, Lewis & Bockius, LLP
Pepper Hamilton, LLP
Porzio, Bromberg & Newman, PC
Rivero Mestre, LLP
Rooney Rippie & Ratnaswamy, LLP
Sanchez & Amador, LLP
Shook, Hardy & Bacon, LLP
Steptoe & Johnson, LLP
Sughrue Mion, PLLC
Sutherland Asbill & Brennan LLP
Thompson Hine LLP
Waas Campbell Rivera Johnson & Velasquez LLP
Winston & Strawn LLP
Zuber & Taillieu, LLP

w w w. M C C A . C O M
iii
MCCA Board of Directors
Richard AmadorPartnerSanchez & Amador, LLP
Michelle BanksExecutive Vice President, General Counsel, Corporate Secretary & Chief Compliance OfficerGap Inc.
Clarissa CerdaSenior VP, General Counsel & SecretaryLifeLock, Inc.
A.B. Cruz, IIIChief Legal Officer & Corporate SecretaryScripps Networks Interactive, Inc.
Anthony K. GreeneDirectorJamison Insurance Group
Gary F. KennedySenior Vice President, General Counsel & Chief Compliance OfficerAmerican Airlines
Don h. LiuSenior Vice President, General Counsel& SecretaryXerox Corporation
hinton J. Lucas Vice President & Assistant General CounselDuPont Company
Robbie e. B. NarcisseVice President of Global Ethics and Business Practices Pitney Bowes Inc.
samuel M. ReevesSenior Vice President, General Counsel Walmart US Legal
Thomas L. sager Senior Vice President & General CounselDuPont Company
Robin sangstonVP, Legal Affairs and Chief Compliance OfficerCox Communications, Inc.
Kenneth s. siegelExecutive Vice President andGeneral CounselStarwood Hotels & Resorts Worldwide, Inc.
Mary e. snappCorporate VP, Deputy General CounselLegal and Corporate AffairsMicrosoft Corporation
Lawrence P. TuSenior Vice President & General CounselDell Inc. Legal Department
simone wuSenior Vice President and General CounselXO Holdings, Inc.
Joseph K. westPresident & CEOMinority Corporate Counsel Association

M C C A Pat h way s R e s e A R C h
iv
special Donor Appreciation
MCCA thanks the following donors to its 10x10x10 Campaign, an effort to expand research, education, and training services. Their financial generosity provided underwriting for this research and the publication and distribution of this report.
$500,000Microsoft
$250,000Bartlit Beck Herman Palenchar & Scott LLP Cravath, Swaine & Moore LLPDickstein Shapiro LLPMcGuireWoods LLP
$150,000Arnold & Porter LLP Boies, Schiller & Flexner LLP Crowell & Moring LLPDay Pitney LLP DuPont Company Nixon Peabody LLPWalmart Stores, Inc.
$100,000Xerox Corporation
$50,000Shook, Hardy & Bacon L.L.P.
$40,000Marriott InternationalVinson & Elkins LLP
$30,000Gap Inc.Kilpatrick Stockton LLP
$25,000Sidley Austin LLP
$10,000Kelly Hart & Hallman LLPReeves & Brightwell LLP
$5,000Murtha Cullina LLP Porzio, Bromberg & Newman, P.C.
w w w. M C C A . C O M
v
Forward
ForwardIt is very exciting to see this research study come to fruition. Four years ago, I had the honor of making an
introduction between Veta T. Richardson, then the Executive Director of MCCA, and Tammy Patterson and
Pam Malone, the administrative leadership team for the NALP Foundation. Both of these organizations
further their missions through the collection and dissemination of information about the legal profession.
MCCA’s mission is to advance the hiring, retention, and promotion of diverse attorneys in legal departments
and the law firms that serve them. The NALP Foundation, through research, publication and professional
exchange, seeks to improve upon legal leadership, professional growth and development, ethics awareness
and education, professionalism, and diversity within our profession. Having served on Boards for MCCA
and the NALP Foundation, it was my belief that collaboration between the two organizations could produce
very valuable benchmark data about the state of diversity within our industry.
Soon after the introduction, work began to design and distribute a survey to corporate legal departments
across the United States in an attempt to gather new information on our progress towards the Call to
Action mandate and mission. The response rate was exceptional. Over 700 legal departments utilized this
survey to share their attorney demographics as well as diversity initiatives and/or best practices—an
illustration of the widespread desire to achieve and support our goal of a more diverse legal workplace.
The collaborative efforts and commitment to this project are apparent in this report. The findings and their
underlying issues are of great personal and professional interest to me. My sincere hope is that these results
will inform and assist all who are involved in creating and leading the legal workforce of the future.
Thomas L. Sager
Senior Vice President & General Counsel
DuPont Company

M C C A Pat h way s R e s e A R C h
vi
Table of Contents
Acknowledgments ............................................................................................................... 1
Introduction .......................................................................................................................... 2
executive summary ............................................................................................................. 4
Corporate Legal Department Diversity Demographics ..................................................... 6
Corporate Legal Department Diversity Program structures and Administration ......... 11
Tracking and Measuring Diversity efforts of Outside Counsel ........................................16
Appendices ......................................................................................................................... 21
Appendix A — About the Participating Law Departments ...................................... 21
Appendix B — Research Methodology and Acknowledgements ............................. 24
Appendix C — The Survey Instrument........................................................................ 26
Table of Contents

w w w. M C C A . C O M
vii
Index of Charts and Tables
Table 1 Size of U.S. Corporate Legal Departments of Participating Companies ................. 6
Table 2 Diversity Demographics of Top Legal Officers in Participating Companies .......... 8
Table 3 Diversity Demographics of U.S. Direct Reports in Participating Companies .......... 9
Table 4 Diversity Demographics of Other Legal Department Attorneys in Participating Companies .........................................................................................10
Table 5 Has your legal department established a formal or informal diversity program or initiatives aimed at increasing diversity and inclusion? .................................... 11
Table 6 Is the program or set of initiatives independent to the legal department or part of a larger organization-wide program? ........................................................11
Table 7 Top Five Positions Most Commonly Responsible for Diversity Program ................12
Table 8 Does your legal department have a formal or informal diversity committee separate from any company-wide diversity committee? ..................................... 12
Table 9 Frequency for Reviewing Results and Progress of Legal Department’s Diversity Program or Initiatives .............................................................................................. 13
Table 10 Are the results and progress of your department’s diversity program reviewed by or with the top legal officer of your company? ............................................... 13
Table 11 Does your legal department have any special outreach or recruiting efforts directed at attracting diverse attorneys? ....................................................14
Chart 1 External Diversity Partner Organizations ................................................................15
Table 12 Does your legal department survey or meet with outside counsel to track their diversity progress and results? ....................................................................... 16
Table 13 Frequency of Surveying or Meeting with Outside Counsel to Track Diversity Progress and Results .................................................................................................17
Table 14 Are the results and progress of outside counsel diversity programs reviewed by or with the top legal officer of your company? ............................................... 17
Table 15 Measuring or Tracking Hours Billed by Diverse Attorneys in Outside Law Firms .................................................................................................... 17
Table 16 Measuring and Tracking Work Performed (beyond billable hours) by Outside Counsel: Gender, Race/ethnic Minority, LGBT, and Physically Challenged or Disabled .......18
Chart 2 Tracking Diversity Efforts and Results of Outside Counsel .....................................18
Table 17 Has your company changed its relationship with any law firm based on its internal diversity metrics or efforts? ....................................................................... 19
Table 18 Ways in Which Legal Departments Have Changed Relationships with Outside Counsel Based on Diversity Metrics or Efforts ........................................................ 20
Appendices
Table A1 Size of U.S. Corporate Legal Departments of Participating Companies ............... 21
Table A2 Headquarters Location ............................................................................................ 22
Table A3 Respondent Profile – Industry ................................................................................. 22
Index of Charts and Tables

M C C A Pat h way s R e s e A R C h
viii

w w w. M C C A . C O M
1
Acknowledgements
The Minority Corporate Counsel Association and the NALP Foundation are pleased to have had the opportunity
to work together to provide new groundbreaking benchmark research spotlighting diversity demographics
within corporate legal departments. This important and timely study also examines specific efforts and
initiatives undertaken by these companies to support and promote diversity and inclusion throughout the
legal industry. This research project is the first of its kind on a subject of significant importance to both
corporations and their outside counsel. We are grateful for the support of many experienced leaders in the
profession who contributed to this endeavor, including the leaders of the Association of Corporate Counsel
(ACC) for assisting with the dissemination of the research survey to ACC’s membership of more than
26,000 in-house counsel.
More specifically, we extend special thanks to Tom Sager, Senior Vice President and General Counsel for
DuPont Legal for initiating the introduction and partnership of our organizations. Tom’s passion for
improving diversity and inclusion in our industry led him to suggest this collaboration which draws on
the strengths of both organizations.
Additionally, the research data and this report have been made possible by the participation of many key
groups and individuals, all of whom are due recognition and words of appreciation. First among them are
the lawyers and administrators who participated in development and reviews of the draft survey instruments
for this study. Their input and insights were invaluable to the effort to create a concise, targeted inquiry into
the major facets of this study. Thanks are extended to all who contributed to our effort.
Our sincere appreciation is also extended to each of the 765 corporate legal departments for their candid,
comprehensive responses to the survey questions. Using the latest online technology, we were able to
acquire many new insights and ideals related to the promotion and support of diversity. We offer our
sincere appreciation for their time as well as their insights and candor.
In addition to those participating in the study as respondents, our research was made possible by the
contributions and membership of leading legal employers, corporations, and other donors who support
the ongoing efforts of both MCCA and the NALP Foundation. In particular, we extend special appreciation
to the law firm of Sidley Austin LLP for underwriting the design, printing and distribution of this report.
The contributions by everyone mentioned by group or by name have been essential in this effort.
Sincere thanks are extended to everyone.
Acknowledgements
Tammy Patterson
CEO/President
NALP Foundation
Joseph K. West
President and CEO
Minority Corporate Counsel Association

M C C A Pat h way s R e s e A R C h
2
Introduction
The message delivered in this excerpt from a 2008 white paper on the progression of diversity in the legal
profession, a follow-up to the Call To Action mandate signed and endorsed by prominent general counsel
at some of America’s leading legal departments, serves as the basis for this study and represents the need
for and importance of benchmark research in this arena. While much has been written and discussed about
private law firms and their commitment to and advancement of diversity in our industry, little is known
about the diversity demographics, initiatives and standards that exist in the corporate legal departments
that provide much of the legal work performed by the private sector.
This survey seeks to provide a new perspective on diversity and inclusion in the profession by examining
efforts within the legal departments of corporations in the U.S. and in other countries. As a starting point, it
Introduction
“ while recognizing the need for change, many elements within the legal profession
have been very slow to adapt to the evolving workforce and competitive non-legal
business environment. Too often, there has been a preference on both the corporate
and firm side to adhere to the traditional way of doing things. For instance, many
firms employ the same business model used since their inception, which includes
billable hour structures, habitual recruiting practices and the established associate/
partner career track.
“ similarly, corporate legal departments often continue to seek out many of the same
firms and individuals for their outside counsel needs. The notion is that these firms
and individuals are proven and offer comforting assurances when dealing with
critical legal matters. And many corporate legal departments go to the same groups
in the same firms to recruit their new hires. Yet, this tradition comes at a cost.
“ The traditional way of doing things does not necessarily lend itself to attracting
and retaining diverse talent. Nor does it acknowledge the need for cultivating
strong environments that support and nurture individual attorneys, offering
opportunities for growth and advancement across all races and genders. The
consequence is many people leaving the profession after a few years, which in
turn results in a lack of minority, female and non-traditional mentors at the
upper echelons of the profession, who could help guide younger lawyers through
the course of their careers. A shift must be made in both mindset and practices
if the profession is to succeed going forward.”1
1. A Call to Action: Diversity in the Legal Profession

w w w. M C C A . C O M
3
Introduction
was necessary to take a close look at the diversity metrics inside these legal departments including
the percentage of diverse individuals who hold the top legal officer and “direct report” positions.
The second phase of the survey explored the structures, administration and scopes of the diversity
programs and special outreach efforts and collaborative initiatives of the participating companies.
Finally, we examined how these legal departments measure and track the diversity demographics
and progress of their outside counsel law firms.
While it is clear that there is much more to be done to improve and support a more diverse legal
profession, we believe this study and the results are an important step toward identifying and
highlighting the actions being taken and the progress made by corporate America and in other
countries. The benchmarking data provided in this report are much needed and anticipated and
will help build awareness, encourage innovation, and support new efforts to create a greater
awareness of the successes and challenges that are present as we continue down the pathway of
creating a more diverse legal workforce.

M C C A Pat h way s R e s e A R C h
4
executive summary
Supporting and improving diversity and inclusion in the legal industry has been an important and
challenging business strategy for corporations and their legal departments for a number of years. The
findings in this report reflect data collected in the first quarter of 2011 from online surveys completed
by 765 corporate legal departments. Three percent of the responding legal departments had headquarters
outside of the United States, with approximately two-thirds of those located in Canada.
The report on this study of diversity and inclusion is segmented into three major sections: (1) diversity
demographics, (2) diversity program structures and administration, and (3) tracking and measuring
outside counsel efforts. The major findings are summarized below.
Corporate Legal Department Diversity Demographics
Initially, respondents were asked to provide the
number of attorneys in their U.S. legal departments
as well as a breakdown of those attorneys by primary
diversity measures including race/ethnic minority,
gender, sexual orientation and physically challenged
or disabled status. The respondents consisted of
law departments of various sizes. Approximately
62% of the responding legal departments employed
10 or fewer attorneys, while 17% reported legal
departments of more than 50 attorneys.
Overall, 20% of the responding legal departments
reported that their top legal officer position was
held by an individual who is a race/ethnic minority.
Thirty-six percent of the respondents reported
that their top legal officer was a woman, while only
9% reported that that the position was held by a
race/ethnic minority woman.
Thirty-one percent of the legal departments with
only one employee (who would most commonly
also be considered the top legal officer) reported that those individuals were race/ethnic minority attorneys.
In contrast, only 10% of the responding departments of more than 75 attorneys reported that their top
legal officer was a race/ethnic minority.
Sixteen percent of the total U.S. direct reports to the chief legal officer represented in the study were
race/ethnic minority attorneys, with departments of two to five employees holding the highest percentage
executive summary

w w w. M C C A . C O M
5
executive summary
of race/ethnic minority direct reports to the chief legal officer (23%). Overall, a slightly higher percentage
of race/ethnic minority women (9%) were reported to hold direct report positions than race/ethnic minority
men (7%).
Legal departments of two to five attorneys reported the highest percentage of total other attorneys who are
race/ethnic minorities (21%). Departments of 26 to 75 attorneys reported the lowest percentage of
total other attorneys who are race/ethnic minorities (15%).
Corporate Legal Department Diversity Program structures and Administration
Overall, only 30% of responding legal departments reported having some type of diversity and inclusion
program. However, the larger the department, the more likely they were to have a program in place. For
example, only 14% of the departments with two to five attorneys reported having a diversity program,
while 87% of respondents with more than 75 attorneys favorably responded to having a formal or
informal program.
Thirty-one percent of the legal departments of 11 to 25 attorneys reported having special outreach or
recruiting efforts to attract race/ethnic minority attorneys, while departments of 26 to 75 and 76 or more
attorneys reported having these outreach efforts in place at much higher percentages, 52% and 74%,
respectively. Overall, only 13% of the responding legal departments stated that they had special outreach
efforts in place for attracting women attorneys, yet 54% of the largest departments of more than 75
attorneys have these efforts as part of their diversity plan.
Tracking and Measuring Diversity efforts of Outside Counsel
Over one-half of the departments with 26 attorneys or more reported that they survey or meet with their
outside counsel to track results and measure progress.
Ninety-one percent of respondents, overall, said that they did not track hours billed for specific diversity
groups, yet 53% of the largest legal departments ( i.e., more than 75 attorneys) stated that they tracked
billable hours for race/ethnic minority attorneys, and one-half stated that they track hours for women
attorneys. Only 18% of these largest departments track hours billed for LGBT attorneys, and even fewer
(11%) track hours for physically challenged or disabled attorneys.
Overall, only 8% of responding legal departments reported that they have changed their relationship with
any law firm based on the diversity metrics or efforts of the firm. Those departments that did implement
some type of change most commonly reported that the change resulted in a decrease or increase in work
assigned to the firm.

M C C A Pat h way s R e s e A R C h
6
Corporate Legal Department Diversity Demographics
Measuring the progress of diversity initiatives or programs within an industry or even an individual organization
is not always an easy task. Most often we use quantitative measures which focus on the amount or number
of persons in an organization based on traditional affirmative action definitions. For purposes of this study,
respondents were asked to provide the overall number of attorneys in the company’s U.S. legal department
as well as a more detailed demographic perspective of the department using traditional primary dimensions
of diversity such as race/ethnicity, gender, physical ability, and sexual orientation.
Corporate Legal Department Diversity Demographics
Table 1: size of U.s. Corporate Legal Departments of Participating Companies
size of U.s. Legal Department Number of Respondents Percent 1 114 15 % 2 86 11 % 3 59 8 % 4 68 9 % 5 33 4 % 6 31 4 % 7 29 4 % 8 23 3 % 9 13 2 % 10 16 2 % 11-15 53 7 % 16-20 24 3 % 21-25 29 4 % 26-30 16 2 % 31-35 11 1 % 36-40 13 2 % 41-50 20 3 % 51-60 16 2 % 61-70 15 2 % 71-100 23 3 % 101-150 23 3 % 151-200 14 2 % 201-300 8 1 % 301 - 500 21 3 % > 500 7 1 % Total 765 100%Percentages may not sum to 100% due to rounding.
w w w. M C C A . C O M
7
Corporate Legal Department Diversity Demographics
At the onset, it is important to establish the overall size of the U.S. legal departments of the participating
corporations in order to assess the representation of diverse employees. Interestingly, approximately
62% (472) of the corporations responding to the survey reported having 10 or fewer attorneys in their legal
department, while only 17% (127) reported legal departments with more than 50 employees.
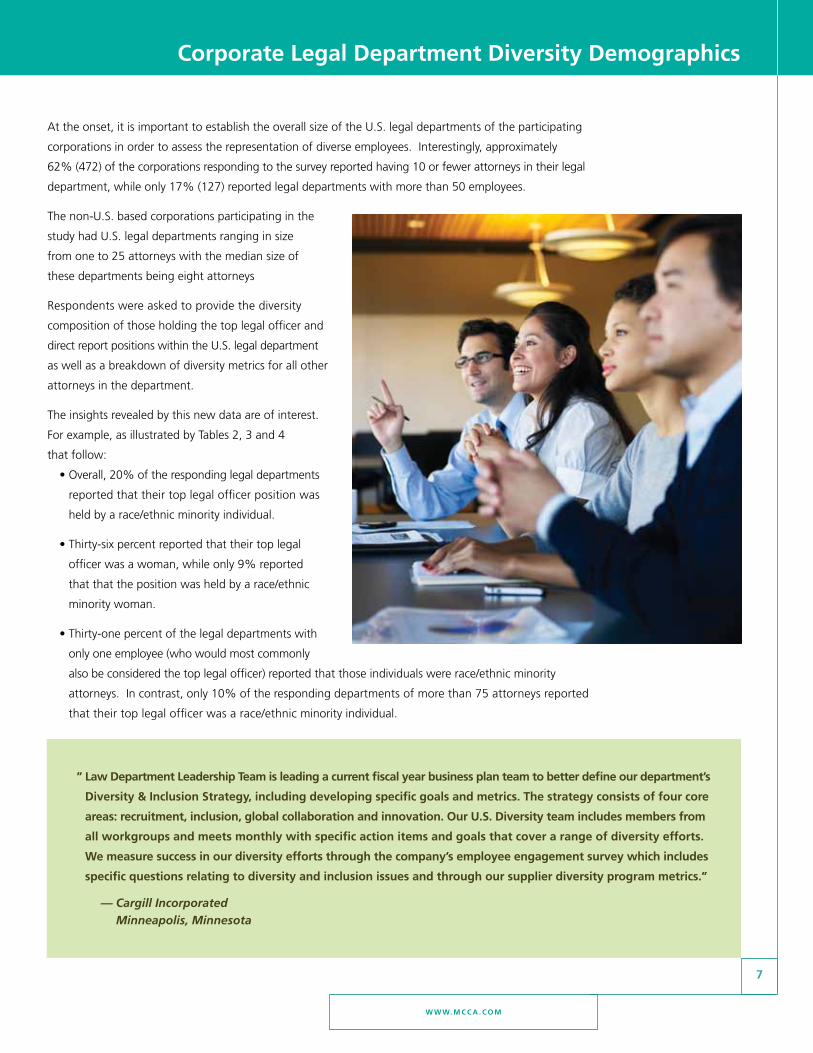
The non-U.S. based corporations participating in the
study had U.S. legal departments ranging in size
from one to 25 attorneys with the median size of
these departments being eight attorneys
Respondents were asked to provide the diversity
composition of those holding the top legal officer and
direct report positions within the U.S. legal department
as well as a breakdown of diversity metrics for all other
attorneys in the department.
The insights revealed by this new data are of interest.
For example, as illustrated by Tables 2, 3 and 4
that follow:
• Overall, 20% of the responding legal departments
reported that their top legal officer position was
held by a race/ethnic minority individual.
• Thirty-six percent reported that their top legal
officer was a woman, while only 9% reported
that that the position was held by a race/ethnic
minority woman.
• Thirty-one percent of the legal departments with
only one employee (who would most commonly
also be considered the top legal officer) reported that those individuals were race/ethnic minority
attorneys. In contrast, only 10% of the responding departments of more than 75 attorneys reported
that their top legal officer was a race/ethnic minority individual.
” Law Department Leadership Team is leading a current fiscal year business plan team to better define our department’s
Diversity & Inclusion strategy, including developing specific goals and metrics. The strategy consists of four core
areas: recruitment, inclusion, global collaboration and innovation. Our U.s. Diversity team includes members from
all workgroups and meets monthly with specific action items and goals that cover a range of diversity efforts.
we measure success in our diversity efforts through the company’s employee engagement survey which includes
specific questions relating to diversity and inclusion issues and through our supplier diversity program metrics.”
— Cargill Incorporated Minneapolis, Minnesota
M C C A Pat h way s R e s e A R C h
8
Corporate Legal Department Diversity Demographics
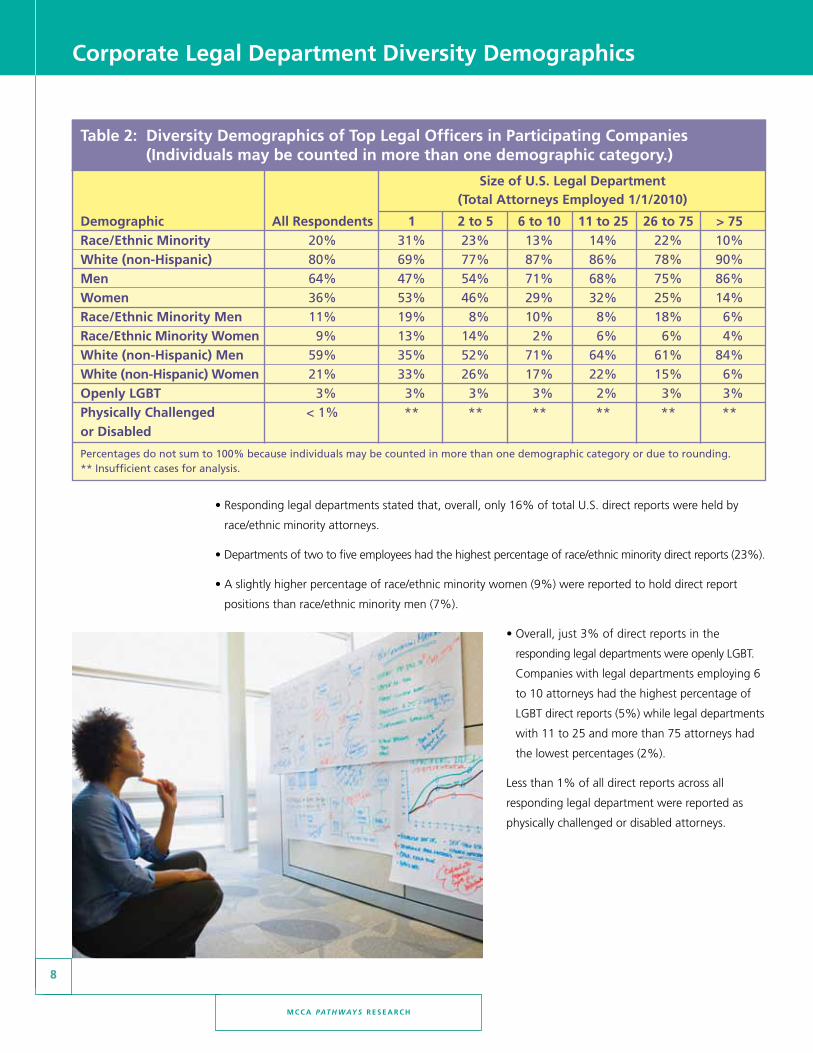
Table 2: Diversity Demographics of Top Legal Officers in Participating Companies (Individuals may be counted in more than one demographic category.)
size of U.s. Legal Department (Total Attorneys employed 1/1/2010)
Demographic All Respondents 1 2 to 5 6 to 10 11 to 25 26 to 75 > 75 Race/ethnic Minority 20% 31% 23% 13% 14% 22% 10%white (non-hispanic) 80% 69% 77% 87% 86% 78% 90%Men 64% 47% 54% 71% 68% 75% 86%women 36% 53% 46% 29% 32% 25% 14%Race/ethnic Minority Men 11% 19% 8% 10% 8% 18% 6%Race/ethnic Minority women 9% 13% 14% 2% 6% 6% 4%white (non-hispanic) Men 59% 35% 52% 71% 64% 61% 84%white (non-hispanic) women 21% 33% 26% 17% 22% 15% 6%Openly LGBT 3% 3% 3% 3% 2% 3% 3%Physically Challenged < 1% ** ** ** ** ** **or Disabled
Percentages do not sum to 100% because individuals may be counted in more than one demographic category or due to rounding. ** Insufficient cases for analysis.
• Responding legal departments stated that, overall, only 16% of total U.S. direct reports were held by
race/ethnic minority attorneys.
• Departments of two to five employees had the highest percentage of race/ethnic minority direct reports (23%).
• A slightly higher percentage of race/ethnic minority women (9%) were reported to hold direct report
positions than race/ethnic minority men (7%).
• Overall, just 3% of direct reports in the
responding legal departments were openly LGBT.
Companies with legal departments employing 6
to 10 attorneys had the highest percentage of
LGBT direct reports (5%) while legal departments
with 11 to 25 and more than 75 attorneys had
the lowest percentages (2%).
Less than 1% of all direct reports across all
responding legal department were reported as
physically challenged or disabled attorneys.

w w w. M C C A . C O M
9
Corporate Legal Department Diversity Demographics
• Again, legal departments of two to five attorneys reported the highest percentage of total other attorneys
(i.e., attorneys who are neither the top legal officers nor his/her direct reports) who are race/ethnic
minorities (21%). Departments of 26 to 75 attorneys reported the lowest percentage of total other
attorneys who are race/ethnic minorities (15%).
• Forty-four percent of the total other attorneys employed by the legal departments participating in
the study are women, with 34% being white (non-Hispanic) women and 10% being race/ethnic
minority women.
• Legal departments of 11 to 25 attorneys employed the highest percentage of women categorized as
other legal department attorneys.
Table 3: Diversity Demographics of U.s. Direct Reports in Participating Companies (Individuals may be counted in more than one demographic category.)
size of U.s. Legal Department
Percent of U.s. Direct (Total Attorneys employed 1/1/2010)
Reports who Are: All Respondents 2 to 5 6 to 10 11 to 25 26 to 75 > 75 Race/ethnic Minority* 16 % 23 % 16 % 15 % 13 % 17 %white (non-hispanic)* 84 % 77 % 84 % 85 % 87 % 83 %Men* 56 % 41 % 49 % 59 % 62 % 68 %women* 44 % 59 % 51 % 41 % 38 % 32 %Race/ethnic Minority Men 7 % 6 % 6 % 9 % 6 % 11 %white (non-hispanic) Men 49 % 35 % 43 % 50 % 55 % 57 %Race/ethnic Minority women 9 % 17 % 11 % 6 % 6 % 6 %white (non-hispanic) women 35 % 42 % 41 % 35 % 32 % 27 %Openly LGBT 3 % 3 % 5 % 2 % 3 % 2 %Physically Challenged <1 % ** ** ** ** **or Disabled
* Results for race/ethnic minority vs. white and men vs. women are based on 390 companies with complete data on these categories. These 390 companies had 2,330 direct reports to the top legal officer. Results for Openly LGBT are based on 335 companies which provided data in this category, and these 335 companies employed 1,902 direct reports. Results for physically challenged or disabled are based on 326 companies which provided data in this category, and these 326 companies employed 1,781 direct reports.
** Insufficient cases for analysis.

M C C A Pat h way s R e s e A R C h
10
Corporate Legal Department Diversity Demographics
Table 4: Diversity Demographics of Other Legal Department Attorneys in Participating Companies (Individuals may be counted in more than one demographic category.)
size of U.s. Legal Department
Percent of Total Other (Total Attorneys employed 1/1/2010)
Attorneys who Are: All Respondents 2 to 5 6 to 10 11 to 25 26 to 75 > 75 Race/ethnic Minority* 18 % 21 % 20 % 17 % 15 % 19 %white (non-hispanic)* 82 % 79 % 80 % 83 % 85 % 81 %Men* 56 % 57 % 59 % 52 % 58 % 56 %women* 44 % 43 % 41 % 48 % 42 % 44 %Race/ethnic Minority Men 8 % 7 % 7 % 7 % 6 % 9 %white (non-hispanic) Men 48 % 50 % 53 % 45 % 52 % 47 %Race/ethnic Minority women 10 % 14 % 13 % 10 % 8 % 11 %white (non-hispanic) women 34 % 29 % 27 % 38 % 34 % 34 %Openly LGBT 2 % ** ** ** ** **Physically Challenged <1 % ** ** ** ** **or Disabled
* Results for race/ethnic minority vs. white and men vs. women are based on 344 companies with complete data on these categories. These 344 companies employed 7,507 other attorneys in all U.S. legal departments. Results for openly LGBT are based on 314 compa-nies which provided data in this category, and these 314 companies employed 4,660 other attorneys in their legal departments. Re-sults for physically challenged or disabled are based on 304 companies which provided data in this category, and these 304 companies employed 4,992 other attorneys.
** Insufficient cases for analysis.

w w w. M C C A . C O M
11
Diversity Programs structures and Administrations
Bearing in mind that 62% of the legal departments participating in this survey reported having 10 or fewer
attorneys, it is not surprising that, overall, only 30% of respondents report having some type of diversity
and inclusion program. Our research has found that the need for and prevalence of diversity programs is
higher among larger law departments. In fact, the data reveals that the larger the department the more
likely they are to have a diversity program in place. For example, only 14% of the departments with two
to five attorneys reported having a diversity program, whereas 87% of respondents with more than 75
attorneys reported having a formal or informal diversity program.
Approximately one quarter of the non-U.S. based legal departments participating in the study cited that
they had established a formal or informal diversity program.
The question about who is responsible for the department’s diversity program yielded a wide range of responses,
and the many variations in job titles, managerial level, and reporting relationships were not always clear and
thus made it difficult to draw comparisons. However, it was most frequently reported that the general counsel
Corporate Legal Department Diversity Program structures and Administration
Table 5: has your legal department established a formal or informal diversity program or initiatives aimed at increasing diversity and inclusion?
size of U.s. Legal Department All Repondents (Total Attorneys employed 1/1/2010)
(n=619) 1 2 to 5 6 to 10 11 to 25 26 to 75 > 75 Yes 30 % 9 % 14 % 22 % 48 % 76 % 87 %No 70 % 91 % 86 % 78 % 52 % 24 % 13 %
Table 6: Is the program or set of initiatives: (select all that apply.)
size of U.s. Legal Department All Repondents (Total Attorneys employed 1/1/2010)
(n=175) 1 2 to 5 6 to 10 11 to 25 26 to 75 > 75
Independent to the legal department 46 % 33 % 10 % 11 % 57 % 72 % 54 %
Part of a larger organization-wide program 70 % 67 % 83 % 78 % 62 % 72 % 60 %Other 9 % 0 % 7 % 11 % 8 % 2 % 22 %
Percentages do not sum to 100% because more than one response could be selected.
M C C A Pat h way s R e s e A R C h
12
Diversity Programs structures and Administrations
or chief legal officer is the person who bears responsibility for the law department’s diversity program.
Other frequently mentioned titles included assistant or deputy general counsel, and diversity officer or chair.
When asked about the existence of a formal or informal diversity committee, again these structures were
more likely to exist in the larger departments. In fact, 91% of departments with more than 75 attorneys
reported having some form of diversity committee.
Table 7: Top Five Positions Most Commonly Responsible for Diversity Program
1. General Counsel/executive or senior Vice President/Chief Legal Officer
2. Assistant General Counsel/Deputy General Counsel
3. Diversity Officer or Chair
4. human Resources Director
5. Compliance Officer
Table 8: Does your legal department have a formal or informal diversity committee separate from any company-wide diversity committee?
size of U.s. Legal Department All Repondents (Total Attorneys employed 1/1/2010)
(n=169) 1 2 to 5 6 to 10 11 to 25 26 to 75 > 75 Yes 42 % 0 % 7 % 0 % 22 % 69 % 91 %No 58 % 100 % 93 % 100 % 78 % 31 % 9 %
” In 2008, exelon introduced a new diversity and inclusion strategy to ensure that the articulated commitment
to diversity and inclusion also defined ownership, accountability, goals, and behavioral expectations for all
employees. To implement this strategy, our legal department developed the following three goals to build on
the company’s and the legal department’s commitment to diversity and inclusion: 1) To attract, develop and
retain key talent that reflects the realities of the market place, our communities and the relevant labor market;
2) to create a culture of inclusion through consistent and sustained execution of the diversity and inclusion
strategy, including progress measurement and accountability for results; and 3) to achieve a diverse range of
contract suppliers, vendors and service providers. As of July 2011, 42% of our legal department’s attorneys
were female and 19% were persons of color. Diverse lawyers are enlisted to assume leadership roles on special
initiatives within our legal department and the company. These assignments provide opportunities for diverse
lawyers to develop relationships with business representatives as well as with outside counsel who serve as
preferred providers. These leadership opportunities also provide visibility within the company including direct
exposure to management, and often provide the lifeblood for later career development.“
— Exelon Corporation Chicago, Illinois

w w w. M C C A . C O M
13
Diversity Programs structures and Administrations
Of those departments that review progress of their program, 86% reported that the results were
reviewed by or with the top legal officer of the company. In fact, 100% of the responding legal departments
with more than 75 attorneys stated that the top legal officer was a part of the review process.
Table 11, on the next page, details the outreach and/or recruiting efforts specifically directed at attracting
diverse attorneys. While overall only 17% of the participating legal departments reported having special
efforts for outreach and recruiting diverse attorneys, it is important to keep in mind that at the time this
survey was conducted, hiring throughout the entire legal industry was at its lowest point in many years.
Significant differences do exist, however, when comparing the responses of the smallest legal departments
with those of the largest. For example:
• Thirty-one percent of the legal departments of 11 to 25 attorneys reported having special outreach
or recruiting efforts to attract race/ethnic minority attorneys, while departments of 26 to 75 and
76 or more attorneys reported having these efforts in place at much higher percentages, 52% and
74%, respectively.
• Overall, only 13% of the responding legal departments stated that they had special efforts in place
for attracting women attorneys, yet 54% of the largest departments have these efforts as part of
their diversity plan.
Table 10: Are the results and progress of your department’s diversity program reviewed by or with the top legal officer of your company?
size of U.s. Legal Department All Repondents (Total Attorneys employed 1/1/2010)
(n=162) 1 2 to 5 6 to 10 11 to 25 26 to 75 > 75 Yes 86 % 63 % 73 % 65 % 91 % 93 % 100 %No 14 % 37 % 27 % 35 % 9 % 7 % 0 %
Table 9: Frequency for reviewing results and progress of legal department’s diversity program or initiatives
size of U.s. Legal Department All Repondents (Total Attorneys employed 1/1/2010)
(n=153) 1 2 to 5 6 to 10 11 to 25 26 to 75 > 75 Annually 37 % 33 % 42 % 33 % 58 % 27 % 30 %Bi-Annually 7 % 0 % 8 % 0 % 10 % 7 % 9 %Quarterly 21 % 17 % 13 % 0 % 10 % 29 % 39 %Other 35 % 50 % 37 % 67 % 23 % 37 % 21 %
Percentages may not sum to 100% due to rounding.
Most commonly, legal departments reported that the results and progress of their diversity efforts were re-
viewed annually, although 35% of respondents stated that results were reviewed on “other” timeframes rang-

M C C A Pat h way s R e s e A R C h
14
Diversity Programs structures and Administrations
• Ultimately, 75% of the legal departments reported having no specific diversity outreach or recruiting efforts.
Outreach efforts often involve some type of partnership or collaboration with outside organizations. As part
of this study, legal departments were asked to provide the names of outside organizations they partner with
to further their diversity efforts. Of the 167 departments who answered this question, 12% said they did
not partner with any outside organizations, and 88% listed one or more organizations. Over 500 organizations
were mentioned by respondents.
National bar associations, including diversity bar associations dedicated to the interests of a specific demographic
group (e.g., national bar associations focused on women and/or specific race/ethnic groups), were the most
frequently cited outside organizations used to enhance corporate diversity efforts. Local, metro, county, and
regional bar associations, including bars aimed at promoting the interest of race/ethnic minority attorneys,
Table 11: Does your legal department have any special outreach or recruiting efforts directed at attracting diverse attorneys?: (select all that apply.)
size of U.s. Legal Department All Repondents (Total Attorneys employed 1/1/2010)
(n=531) 1 2 to 5 6 to 10 11 to 25 26 to 75 > 75
Minorities 17 % 1 % 4 % 8 % 31 % 52 % 74 %women 13 % 2 % 3 % 4 % 23 % 36 % 54 %LGBT 5 % 0 % 1 % 1 % 10 % 14 % 28 %Physically challenged or disabled 2 % 1 % 1 % 1 % 1 % 2 % 10 %No special outreach/ recruiting efforts 75 % 90 % 90 % 84 % 62 % 36 % 21 %Other 8 % 8 % 6 % 6 % 10 % 12 % 10 %
Percentages do not sum to 100% because more than one response could be selected.
” UPs participated in the Corporate Legal Diversity Pipeline program which gave 60 students from a public high school
the opportunity to explore legal careers, interact with professional role models, and learn about key legal concepts
that impact their everyday lives. The team of legal professionals from UPs taught students about employment law,
contracts, and intellectual property and provided a window into the lives of corporate lawyers. students ended the
program with a more comprehensive understanding of these important legal concepts. Through interactions with
caring and enthusiastic adults, the students were able to consider career options, envision a pathway to legal careers,
and lay the groundwork for the pursuit of that pathway. After the program, almost 90% of the students said that
they were more interested in legal careers than they had been beforehand. we will continue this program in 2011
along with sponsored internships from local legal associations.“
— United Parcel service atlanta, Georgia

w w w. M C C A . C O M
15
Diversity Programs structures and Administrations
were the second most common type of organization the responding corporations utilized in their diversity
efforts —17% of all the organizations used by the responding legal departments in their diversity efforts
were bars of this type. The Minority Corporate Counsel Association (MCCA) was the most commonly cited
non-bar related association used by legal departments to assist their diversity efforts.
Though less frequently mentioned than national and local/regional bars groups, state-wide associations of
attorneys were also widely used by the responding corporations. Ten percent of the organizations that used
outside resources to further corporate diversity programs turned to state-wide attorney associations. These
associations include traditional state bars where membership is mandated for or open to all attorneys in a
state and specialty bars serving attorneys of various races/ethnicities in that state.
Chart 1: external Diversity Partner Organizations(n=507 organizations mentioned by responding corporations)
Various National Bar Associations 25%
Various Local, Metro, County, Regional Bar Associatons 17%
Various State Bar Associations 10%
MCCA10%
ACC 1%
Law Firm and Cross-Sector Initiatives 7%
Law School Programs 4%
Other 14%
None 12%
251710101741412

M C C A Pat h way s R e s e A R C h
16
Tracking and Measuring Diversity efforts of Outside Counsel
The Call to Action mandate established in 1999 encouraged many corporate legal departments, especially
those who were original signatories on the document, to take greater steps toward advancing diversity
in the profession by imposing criteria for improving diversity in the law firms they do business with. To that
end, many of the larger legal departments have implemented methods for tracking and measuring the
results of their outside counsel.
Over one-half of the departments with 26 attorneys or more reported that they survey or meet with their
outside counsel to track results and measure progress. Of the non-U.S. based legal department respondents,
only 13% reported that they monitor the diversity efforts and results of their outside counsel.
The majority of responding legal departments that do track or measure diversity efforts of their outside
counsel, regardless of size, reported doing so on an annual basis, and almost all respondents (91%)
who have some type of tracking process in place reported that the results are reviewed with their chief
legal officer.
Tracking and Measuring Diversity efforts of Outside Counsel
” Microsoft Corporation collects official diversity data from our Premier Providers. On a quarterly basis,
these firms report on the hours billed by ’diverse‘ attorneys (per our specific definition and categories)
and we compare such performance against the firms’ historical marks and our own internal diversity
ratio. we also ask the firms to provide monthly impressions regarding the ratio of diverse-to-total hours
billed on our matters.“
— Microsoft Corporation Redmond, washington
Table 12: Does your legal department survey or meet with outside counsel to track their diversity progress and results?
size of U.s. Legal Department All Repondents (Total Attorneys employed 1/1/2010)
(n=564) 1 2 to 5 6 to 10 11 to 25 26 to 75 > 75 Yes 18 % 2 % 7 % 7 % 27 % 53 % 77 %No 82 % 98 % 93 % 93 % 73 % 47 % 23 %

w w w. M C C A . C O M
17
Tracking and Measuring Diversity efforts of Outside Counsel
The majority of responding legal departments that do track or measure diversity efforts of their outside counsel,
regardless of size, reported doing so on an annual basis, and almost all respondents (91%) who have some
type of tracking process in place reported that the results are reviewed with their chief legal officer.
Overall, 88% of responding legal departments reported that they did not track the work performed by
diverse attorneys beyond billable hours.
Table 14: Are the results and progress of outside counsel diversity programs reviewed by or with the top legal officer of your company?
size of U.s. Legal Department All Repondents (Total Attorneys employed 1/1/2010)
(n=99) 1 2 to 5 6 to 10 11 to 25 26 to 75 > 75 Yes 91 % 100 % 80 % 100 % 90 % 86 % 100 %No 9 % 0 % 20 % 0 % 10 % 14 % 0 %
Table 13: Frequency of surveying or Meeting with Outside Counsel to Track Diversity Progress and Results
size of U.s. Legal Department All Repondents (Total Attorneys employed 1/1/2010)
(n=100) 1 2 to 5 6 to 10 11 to 25 26 to 75 > 75 Annually 54 % 50 % 67 % 50 % 53 % 50 % 54 %Bi-Annually 6 % 0 % 0 % 0 % 10 % 7 % 7 %Quarterly 3 % 0 % 0 % 0 % 0 % 4 % 7 %Other 37 % 50 % 33 % 50 % 37 % 39 % 32 %
Percentages may not sum to 100% due to rounding.
Table 15: Measuring or Tracking hours Billed by Diverse Attorneys in Outside Law Firms
size of U.s. Legal Department All Repondents (Total Attorneys employed 1/1/2010)
(n=551) 1 2 to 5 6 to 10 11 to 25 26 to 75 > 75
Race/ethnic Minorities 9 % 3 % 0 % 4 % 10 % 30 % 53 %women 8 % 3 % 0 % 4 % 7 % 30 % 50 %LGBT 3 % 0 % 0 % 1 % 3 % 13 % 18 %Physically challenged or disabled 2 % 0 % 0 % 1 % 0 % 8 % 11 %No - do not measure or track hours billed by outside counsel in this manner 91 % 97 % 100 % 96 % 90 % 70 % 47 %
Percentages do not sum to 100% because more than one response could be selected.

M C C A Pat h way s R e s e A R C h
18
Tracking and Measuring Diversity efforts of Outside Counsel
Chart 2 below illustrates the various ways in which the legal departments that do track or measure the
diversity efforts and progress of their outside counsel approach the issue.
Yet, despite all the pledges signed by general counsel over the years, relatively few legal departments,
only 8% overall, reported that they have changed their relationship with any law firm based on the
diversity metrics or efforts of the firm. However, in departments with more than 10 attorneys, that average
climbs to a little more than 20% indicating that for corporations with bigger departments and presumably
larger outside counsel budgets, failure to meet the client’s diversity expectations will impact whether the
firm retains its business relationship with the law department.
Table 16: Measuring and Tracking work Performed (beyond billable hours) by Outside Race/ethnic Minority, LGBT, and Physically Challenged or Disabled Counsel
size of U.s. Legal Department All Repondents (Total Attorneys employed 1/1/2010)
(n=544) 1 2 to 5 6 to 10 11 to 25 26 to 75 > 75 Yes 12 % 6 % 5 % 8 % 18 % 26 % 40 %No 88 % 94 % 95 % 92 % 82 % 74 % 60 %
Chart 2: Tracking Diversity efforts and Results of Outside Counsel
Formal Tracking* 28%
Informal Tracking* 23%
Surveys of Outside Counsel 13%
Meetings with Outside Counsel 11%
No Tracking 25%
* Formal tracking includes any organized system for track-
ing work performed by outside counsel other than a survey.
Ex: through billing system, in a database, other formal
records.
** Informal tracking includes encouragement to work with
diverse outside counsel, actively looking for diverse outside
counsel, making sure lead outside counsel is a minority.

w w w. M C C A . C O M
19
Tracking and Measuring Diversity efforts of Outside Counsel
The legal departments who
stated that they have changed
relationships with outside counsel
based on diversity metrics or
efforts were asked to describe the
ways in which these relationships
were changed. Most often these
legal departments reported they
either decreased work or awarded
more work based on diversity
metrics. In addition, 18% of these
respondents reported that they
terminated their outside counsel
for poor diversity results or efforts.
Table 17: has your company changed its relationship with any law firm based on their internal diversity metrics or efforts?
size of U.s. Legal Department All Repondents (Total Attorneys employed 1/1/2010)
(n=544) 1 2 to 5 6 to 10 11 to 25 26 to 75 > 75 Yes 8 % 1 % 2 % 5 % 21 % 22 % 19 %No 92 % 99 % 98 % 95 % 79 % 78 % 81 %
” The senior leadership of General Mills’ Law Department is accountable for yearly objectives that contain
diversity metrics, including raising the bar on what we will require from outside law firms in order to do
business with General Mills. The annual objectives of all other members of the Law Department (including
paralegals, legal administrative assistants and other specialists) must also contain a diversity component
against which performance is measured. General Mills’ Law Department’s Diversity and Inclusion Council is
charged with implementing the Law Department’s diversity strategic plan and mission, which is as follows:
’we will leverage the value of diversity by influencing and measuring law firms’ efforts to attract, retain
and promote diverse legal professionals, by increasing internal appreciation and ownership of diversity and
inclusion, and by meeting minority vendor spending goals.‘ we regularly benchmark and share ideas with
other corporate law departments and law firms about diversity and inclusion initiatives and best practices.“
— General Mills Corporation Chicago, Illinois

M C C A Pat h way s R e s e A R C h
20
Tracking and Measuring Diversity efforts of Outside Counsel
Table 18: ways in which Legal Departments have Changed Relationships with Outside Counsel Based on Diversity Metrics or efforts
size of U.s. Legal Department All Repondents (Total Attorneys employed 1/1/2010)
(n=44) 1 2 to 5 6 to 10 11 to 25 26 to 75 > 75
Terminated the law firm 18 % 0 % 0 % 25 % 20 % 17 % 14 %Terminated a specific partner within the law firm 5 % 0 % 0 % 25 % 7 % 0 % 0 %Reassigned work to another attorney within the same firm 23 % 0 % 25 % 25 % 27 % 17 % 29 %
Decreased the amount of work being given to the firm or partner 55 % 100 % 25 % 50 % 53 % 75 % 43 %
Awarded additional work to the firm or partner for meeting expectations 55 % 100 % 50 % 25 % 67 % 42 % 71 %Imposed a probationary period in which the firm had to improve efforts 11 % 0 % 0 % 25 % 13 % 8 % 14 %
Other 23 % 0 % 0 % 50 % 20 % 17 % 43 %Percentages do not sum to 100% because more than one response could be selected.
” Annually, the law department establishes goals for achieving a certain percentage of our U.s. outside counsel
spend with certified minority-owned, certified women-owned and “non-certified” law firms. Non-certified
firms are firms that do not meet the criteria for minority or women-owned certification, but nonetheless
further the cause of excellence through diversity. The process involves analyzing data, reviewing the company’s
goals with supply Chain Management and discussing adjustments with the Law Department’s senior
management based on business conditions/strategic plans. Quarterly, the department tracks certified and
non-certified spend of our principal law firms as compared to total quarterly spend for the firm. These
quarterly results are shared with all Law Department members.“
— Eaton Corporation
Cleveland, Ohio

w w w. M C C A . C O M
21
Appendices
Appendix A — About the Participating Law DepartmentsAn email invitation to participate in this study was disseminated to approximately 10,000 legal departments of
leading corporations, which make up the membership rosters of the Minority Corporate Counsel Association
(MCCA) and the Association of Corporate Counsel (ACC). A total of 765 corporate legal departments provided
partial or complete responses to the survey. Information regarding the demographics and composition of
the respondent law departments follows in Tables A1 (Size), A2 (Headquarters Location), and A3 (Industry).
Respondent Demographics
Appendices
Table A1: size of U.s. Corporate Legal Departments of Participating Companies
size of U.s. Legal Department Number of Respondents Percent 1 114 15 % 2 86 11 % 3 59 8 % 4 68 9 % 5 33 4 % 6 31 4 % 7 29 4 % 8 23 3 % 9 13 2 % 10 16 2 % 11-15 53 7 % 16-20 24 3 % 21-25 29 4 % 26-30 16 2 % 31-35 11 1 % 36-40 13 2 % 41-50 20 3 % 51-60 16 2 % 61-70 15 2 % 71-100 23 3 % 101-150 23 3 % 151-200 14 2 % 201-300 8 1 % 301 - 500 21 3 % > 500 7 1 % Total 765 100%Percentages may not sum to 100% due to rounding.

M C C A Pat h way s R e s e A R C h
22
Appendices
Table A2: headquarters Location (n=259)
Domestic vs. Foreign Based Number of Respondents Percent of Respondents Headquartered in USA 251 97 % Headquartered Outside of USA 8 3 %Percentages may not sum to 100% due to rounding.
Table A3: Respondent Profile - Industry
Industry Number of Respondents (n=182) Percent Agricultural 2 1 % Automotive 2 1 % Aviation 4 2 % Banking 8 4 % Biological Products 1 <1% Biotechnology 1 <1% Business Equipment 3 2 % Chemical 1 <1% Commercial Construction 2 1 % Compliance 1 <1% Consumer Packaged Goods 3 2 % Distribution 2 1 % Do not know 1 <1% Education 4 2 % Electronics 2 1 % Employment Agencies 1 <1% Energy 10 5 % Engineering 4 2 % Financial 12 7 % Grocery 1 <1% Healthcare 11 6 % Hospital Construction 1 <1% Hospitality 2 1 % Industrial 2 1 % Insurance 12 7 % Internet 3 2 % IT Services 8 4 % Management 3 2 % Manufacturing 14 8 % Many 1 <1% Marketing and Advertising 1 <1% Media 1 <1% Medical Devices 1 <1% National Security 1 <1%

w w w. M C C A . C O M
23
Appendices
Table A3: Respondent Profile - Industry (cont.)
Industry Number of Respondents (n=182) Percent Non-profit 3 2 % Outsourcing 1 <1% Patent Owners and Lessors 1 <1% Pharmaceuticals 8 4 % Professional Services 5 3 % Real Estate 6 3 % Retail 11 6 % Social Services 1 <1% Technology 6 3 % Telecommunications 5 3 % Trade Association 2 1 % Transportation 2 1 % Travel 1 <1% Utility 4 2 % Total 182 100%Percentages may not sum to 100% due to rounding.
M C C A Pat h way s R e s e A R C h
24
Appendices
Appendix B — Research Methodology and AcknowledgementsThis report continues the research that MCCA has published as part of its Sustaining Pathways to Diversity®
series, which addresses a variety of issues concerning diversity and inclusion in corporate legal departments.
MCCA’s work on the corporate law department survey instrument began more than four years ago, but
two prior distributions of the early survey instrument failed to yield a sufficiently robust response rate. The
establishment of a collaborative working relationship with two leading organizations — the Association of
Corporate Counsel (ACC) and the NALP Foundation — proved instrumental to the success of this survey, as
measured by the overwhelming response rate and the quality and depth of analysis of the findings.
The survey had multiple objectives:
• Collect diversity demographic information specifically concerning the chief legal officer (CLO), direct reports
to the CLO, and all other attorneys in the law department;
• Obtain insight regarding the prevalence of formal or informal diversity and inclusion initiatives as well as
who bears primary responsibility for the success of these programs;
• Examine how diversity impacts the selection, retention, and management of outside counsel including
whether work has been reassigned based upon a firm’s diversity performance.
MCCA retained The NALP Foundation as an independent research consultant to work with MCCA to collect
the data necessary to meet the stated objectives. The survey was administered online by the NALP Foundation
using Zoomerang® and was comprised of 26 questions. (See Appendix C for survey instrument.) Given
the expertise of MCCA concerning diversity and corporate legal departments and of the NALP Foundation
concerning the administration and review of large-scale surveys, this project presented a unique opportunity
for each organization to play to its respective strengths. In addition, MCCA tapped its longstanding relationship
with ACC, which enabled the survey to be disseminated to tens of thousands of in-house counsel around the
world, thereby achieving an unprecedented number of responses and making this report the largest and most
comprehensive ever published about in-house legal departments and diversity.
An electronic invitation with a link to the survey was distributed by ACC and MCCA to approximately 10,000
in-house law departments. The survey data was collected from December 2010 through April 2011. Only
one response per law department was accepted. Responses were received from a total of 765 unique law
departments. Participants did not receive a financial incentive for participating and participation was purely
voluntary. However, in appreciation for participation in the survey, MCCA and the NALP Foundation will
provide an individual, customized report for each respondent allowing the law department to benchmark
against the overall findings.
All information collected in the survey was self-reported by respondents with the understanding that all
response data would be reported solely in the aggregate and that appropriate steps would be taken to
maintain confidentiality of individual responses. MCCA did not engage in independent verification of any
reported data.

w w w. M C C A . C O M
25
Appendices
About the Research Team
Veta T. Richardson, in her capacity as former Executive Director of MCCA, served as project director, and as
such had general oversight and financial responsibility for production of this research report. In addition,
Ms. Richardson contributed substantively to development of the survey instrument, analysis of the data,
and preparation of the final report. Lori L. Garrett served as project manager for MCCA, and as such had
responsibility for finalizing, designing and printing this research report.
Tammy Patterson served as project manager and the primary draftsperson for this report. Her many
contributions also included data design for the survey instrument, managing the logistics for distribution
and data collection, as well as supervision of other research consultants. In addition to Ms. Patterson,
other NALP Foundation staff that were instrumental to the completion of this report include Cynthia Spanhel,
PhD., who served as a research analyst and statistician, and Pamela Malone, who assisted with corporate
relations and project coordination.
Acknowledgements
MCCA and NALP Foundation extend appreciation to the law firm of Sidley Austin LLP for its generous financial
support of this project, which helped to defray MCCA’s costs regarding the design and printing of this report.
In addition, a debt of gratitude is extended to the Association of Corporate Counsel because without its
collaboration and commitment, the survey would not have reached such a broad cross-section of in-house
legal departments.

M C C A Pat h way s R e s e A R C h
26
Appendices
Page 1 – heading
Definitions: On this survey, “minority” refers to people who are members of racial/ethnic groups traditionally considered in the minority of the U.S. population (e.g., Hispanic/Latino(a), African American or Black, Asian or Asian Pacific American, Native American or Indian, or persons who are of mixed racial/ethnic heritage.)
Page 1 – Question 1 – Open ended – One Line
As of January 1, 2010 how many attorneys were employed in all of your company’s legal departments in the United States? (Please enter a whole number only.)
Page 1 – Question 2 – Choice – Multiple Answers (Bullets)
As of January 1, 2010, was your company’s top legal officer: (Select all that apply. The individual may be counted in more than one demographic category.)
o Minority
o White (non-Hispanic)
o A Man
o A Woman
o Openly Lesbian, Gay, Bisexual or Transgendered (LGBT)
o Physically Challenged or Disabled
Page 2 – Question 3 – Open ended – One or More Lines with Prompt
As of January 1, 2010, how many of your company’s U.S. Direct Reports to the top legal officer were: (Please enter whole numbers only, and enter a zero if there are no individuals in the listed category. Individuals may be counted in more than one category.)
o Minority Men _________________________________
o White (non-Hispanic) Men ______________________
o Minority Women ______________________________
o White (non-Hispanic) Women ___________________
o Openly Gay, Lesbian, Bisexual or Transgendered (LGBT) __________________________
o Physically Challenged or Disabled ________________
Page 3 – Question 4 – Open ended – One or More Lines with Prompt
As of January 1, 2010, how many of your company’s other attorneys in all U.S. legal departments were: (Please enter whole numbers only, and enter a zero if there are no individuals in the listed category. Individu-als may be counted in more than one category.)
o Minority Men _________________________________
o White (non-Hispanic) Men ______________________
o Minority Women ______________________________
o White (non-Hispanic) Women ___________________
o Openly Gay, Lesbian, Bisexual or Transgendered (LGBT) __________________________
o Physically Challenged or Disabled ________________
Page 4 – Question 5 – Choice – One Answer (Bullets)
Has your legal department established a formal or informal diversity program or initiatives aimed at increasing diversity and inclusion?
o Yes
o No
Page 5 – Question 6 – Choice – Multiple Answers (Bullets)
Is the program or set of initiatives (Select all that apply.):
• Independent to the legal department?
• Part of a larger organization-wide program?
• Other (Please describe.)
_______________________________________________
Page 5 – Question 7 – Open ended – One or More Lines with Prompt
Who has the primary responsibility for leading the di-versity plan and initiatives within the legal department?
o Name _______________________________________
o Title _________________________________________
Page 6 – Question 8 – Choice – One Answer (Bullets)
Does your legal department have a formal or informal diversity committee separate from any company-wide diversity committee?
o Yes
o No
Page 6 – Question 9 – Choice – One Answer (Bullets)
How often are the results and progress of your legal department’s diversity program or initiatives reviewed?
o Annually
o Bi-Annually
o Quarterly
o Other (Please describe.)
_______________________________________________
Page 6 – Question 10 – Choice – One Answer (Bullets)
Are the results and progress of your firm’s diversity program reviewed by or with the top legal officer of your company?
o Yes
o No
Page 7 – Question 11 – Choice – Multiple Answers (Bullets)
Does your legal department have any special outreach or recruiting efforts directed at attracting attorneys who are: (Select all that apply.)
o Minorities
o Women
o LGBT
o Physically Challenged or Disabled
o No special outreach/recruiting efforts
o Other (Please describe.)
_______________________________________________
Page 7 – Question 12 – Open ended – Comments Box
Please list names of any outside organizations you are currently involved with or partnering with to further your diversity efforts.
_______________________________________________
_______________________________________________
Page 7 – Question 13 – Open ended – Comments Box
Please list names of any internal committees, affinity groups, programs and related entities designed to further your diversity efforts.
_______________________________________________
_______________________________________________
Page 8 – heading
Outside Counsel Diversity Programs
Page 8 – Question 14 – Choice – One Answer (Bullets)
Does your legal department survey or meet with outside counsel to track their diversity progress and results?
o Yes
o No
Page 9 – Question 15 – Choice – One Answer (Bullets)
How often do you survey or meet with outside counsel to track diversity progress and results?
o Annually
o Bi-annually
o Quarterly
o Other (Please describe.)
_______________________________________________
Page 9 – Question 16 – Choice – One Answer (Bullets)
Are the results and progress of outside counsel diversity programs reviewed by or with the top legal officer of your company?
o Yes
o No
Page 10 – Question 17 – Choice – Multiple Answers (Bullets)
Does your company measure or track hours being
Appendix C — The survey Instrument

w w w. M C C A . C O M
27
Appendices
billed for work performed by outside counsel by attorneys who are: (Select all that apply.)
o Minorities
o Women
o LGBT
o Physically Challenged or Disabled
o No — do not measure or track hours billed by out-side counsel in this manner
Page 11 –- Question 18 – Open ended – One or More Lines with Prompt
What percentage of work billed by outside counsel for your company is billed by: (Percentages will not add up to 100% as it is possible for individuals to be listed in more than one category. Please enter whole numbers only, and enter a zero if there are no individuals in the listed category.)
o Minority Men _________________________________
o Minority Women ______________________________
o White (Non-Hispanic) Men ______________________
o White (Non-Hispanic) Women ___________________
o Openly LGBT Men and Women __________________
o Physically Challenged or Disabled Men and Women _
Page 12 – Question 19 – Choice – One Answer (Bullets)
Beyond hours billed, does your company formally or informally track the work performed by outside minority, LGBT, and physically challenged or disabled counsel?
o Yes
o No
Page 13 – Question 20 – Open ended – One or More Lines with Prompt
Aside from billing work as members of the outside counsel team, it is important for attorneys in law firms to serve as the engagement or relationship managers who assemble and/or lead the outside counsel team that does the work for the corporate clients.
What percentage of work billed by outside counsel for your company is managed or led by law firm engage-ment or relationship managers who are: (Percentages will not add up to 100% as it is possible for individuals to be listed in more than one category. Please enter whole numbers only, and enter a zero if there are no individuals in the listed category.)
o Minority Men Partner(s) ________________________
o Women Partner(s) _____________________________
o White (Non-Hispanic) Women Partner(s) __________
o White (Non-Hispanic) Men Partner(s) _____________
o Openly LGBT Partner(s) _________________________
o Physically Challenged or Disabled Partner(s) ________
o Minority Men Non-partner Attorney(s) ____________
o Minority Women Non-partner Attorney(s) _________
o White (Non-Hispanic) Men Non-partner Attorney(s) ___________________________________
o White (Non-Hispanic) Women Non-partner Attorney(s) ___________________________________
o Openly LGBT Men or Women Non-partner Attorney(s) ___________________________________
o Physically Challenged or Disabled Non-partner Attorney(s) ___________________________________
Page 13 – Question 21 – Open ended – Comments Box
Please describe what your company does to track the work managed by outside counsel who are minori-ties, women, LGBT, and/or physically challenged or disabled?
_______________________________________________
_______________________________________________
Page 14 – Question 22 – Choice – One Answer (Bullets)
Has your company changed its relationship with any law firm based on their internal diversity metrics or efforts?
o Yes
o No
Page 15 – Question 23 – Choice – Multiple Answers (Bullets)
How have these relationships changed? (Select all that apply.)
o Terminated the law firm
o Terminated a specific partner within the law firm
o Reassigned work to another attorney within the same firm
o Decreased the amount of work being given to the firm or partner
o Awarded additional work to the firm or partner for meeting expectations
o Imposed a probationary period in which the firm had to improve efforts
o Other (Please describe.)
_______________________________________________
Page 16 – heading
Best Practices
Page 16 – Question 24 – Open ended – Comments Box
Please describe any internal best practices in any of the following categories you would like to share and have published in the survey results. Examples may include:
Commitment from Senior Management
A Broadened Interpretation of Diversity
Measuring Diversity in the Legal Department
Targeted Recruiting Efforts/Pipeline Programs
Retention
Inclusion in Succession Planning
Compensation Tied to Diversity Efforts
_______________________________________________
_______________________________________________
Page 16 - Question 25 - Open ended - Com-ments Box
Please describe any external best practices in the areas of influencing and measuring diversity of outside law firms you would like to share and have published in the survey results. Examples may include:
Outreach efforts to diverse outside counsel
Requiring diverse attorneys for RFPs
Diversity metrics
Holding in-house attorneys accountable
_______________________________________________
_______________________________________________
Page 17 – Question 26 – Open ended – One or More Lines with Prompt
Respondent Profile: (needed to send you a report of the survey’s key findings):
o Company name _______________________________
o Headquarters City and State ____________________
o Industry or SIC code ___________________________
o Name of person completing survey _______________
o Title of person completing survey ________________
o Email address of person completing survey ________
o Telephone number of person completing survey ____

M C C A Pat h way s R e s e A R C h
28
Notes

w w w. M C C A . C O M
29
Additional resources from
MCCA’s Pathways Research series
The Myth of the
Meritocracy: A Report
On the Bridges and
Barriers to Success
in Large Law Firms
Metrics for Success:
Measurement in
Diversity Initatives
From Lawyer to
Business Partner:
Career Advancement
in Corporate Law
Departments
Perspectives From
The Invisible Bar: Gay
& Lesbian Attorneys
in the Profession
A Study of Law
Department
Best Practices
(2nd Edition)
The Next Steps in
Understanding and
Increasing Diversity
& Inclusion in Large
Law Firms
The New Paradigm
of LBGT Inclusion:
A Recommended
Resource for Law Firms
Mentoring Across
Differences: A Guide
to Cross-Gender and
Cross-Race Mentoring
A Set of Recommended Practices for Law Firms
A Study of Law Department Best Practices (1st Edition)