Embed Size (px)
Citation preview
A Brief Introduction to the ProClarity Enrollment Reports
O f f i c e o f I n s t i t u t i o n a l R e s e a r c h
Page 1
ACCESS TO THE REPORTS
First Step: Open the recommended browser, Internet Explorer, go to the Compatibility View
Settings on the Tools menu & select the Display all websites in Compatibility View checkbox.
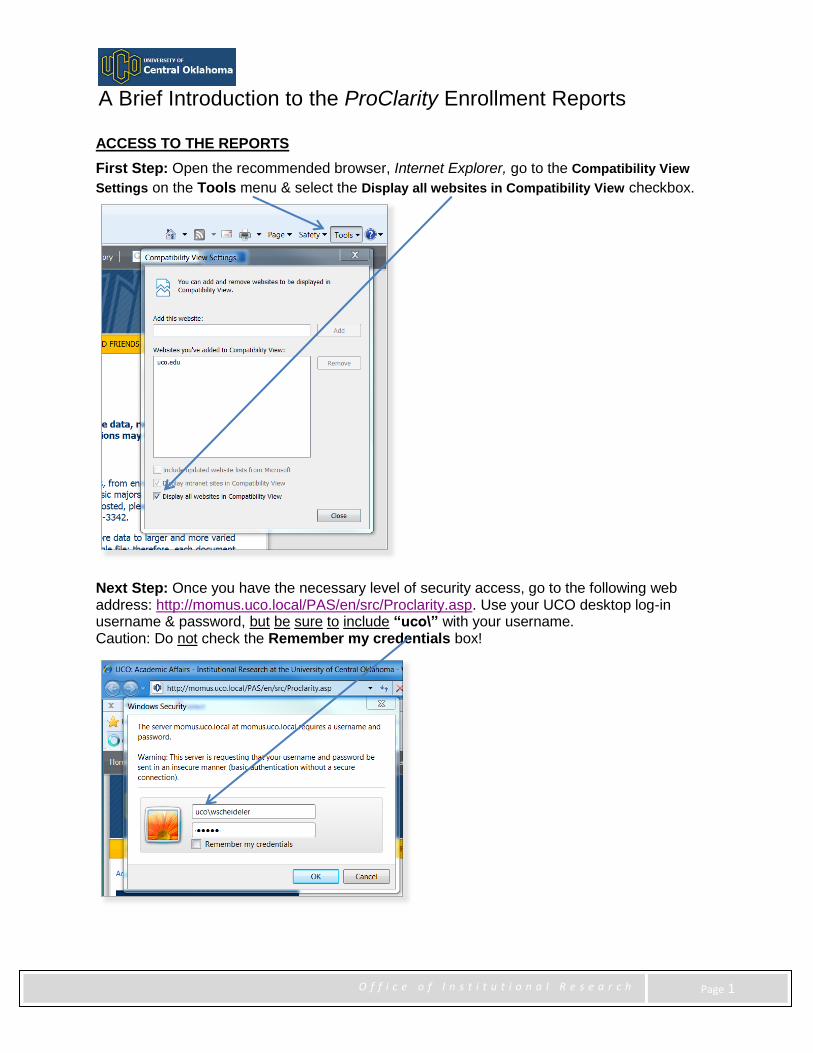
Next Step: Once you have the necessary level of security access, go to the following web address: http://momus.uco.local/PAS/en/src/Proclarity.asp. Use your UCO desktop log-in username & password, but be sure to include “uco\” with your username. Caution: Do not check the Remember my credentials box!

A Brief Introduction to the ProClarity Enrollment Reports
O f f i c e o f I n s t i t u t i o n a l R e s e a r c h
Page 2
LOCATING THE DATA
Select the UCO Prototypes library. . .
Notice My Views where you can save your own customized reports. More on this later.
By the way, this training is intended only for users of the Standard version.
Select the Enrollment Reports briefing book. . .
A Brief Introduction to the ProClarity Enrollment Reports
O f f i c e o f I n s t i t u t i o n a l R e s e a r c h
Page 3
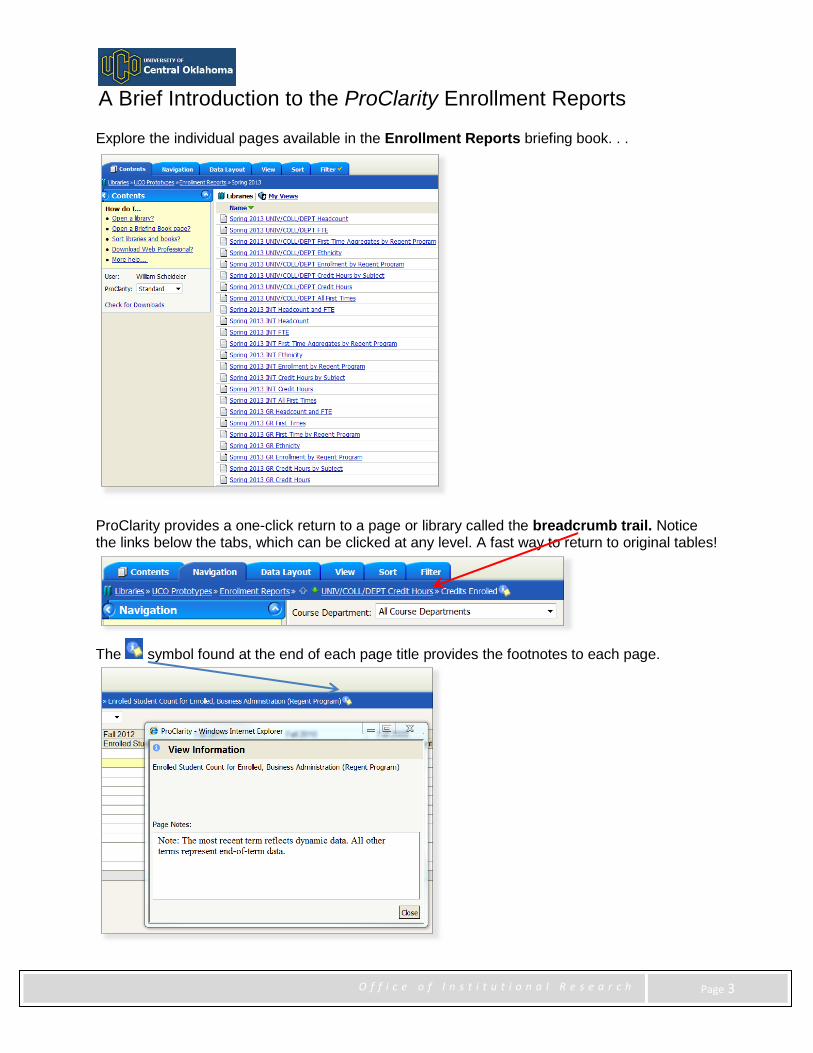
Explore the individual pages available in the Enrollment Reports briefing book. . .
ProClarity provides a one-click return to a page or library called the breadcrumb trail. Notice the links below the tabs, which can be clicked at any level. A fast way to return to original tables!
The symbol found at the end of each page title provides the footnotes to each page.

A Brief Introduction to the ProClarity Enrollment Reports
O f f i c e o f I n s t i t u t i o n a l R e s e a r c h
Page 4
ARRANGING THE DATA
Options available on the NAVIGATION tab include use of the drop-down menu which, in this
case, allows users to select an individual college or department. Notice that the arrows in the
table below indicate whether the Drill Down, Drill Up, or Expand features are available.
The Show Only and Hide options also provide a way to customize the table to your needs.
Drill To Detail feature extracts the records behind a given cell in the table for viewing or
copying to an Excel file for more analysis. Note: extracts often initially offer just the first 1,000
data rows and ask users to choose the option to extract all records.
A Brief Introduction to the ProClarity Enrollment Reports
O f f i c e o f I n s t i t u t i o n a l R e s e a r c h
Page 5
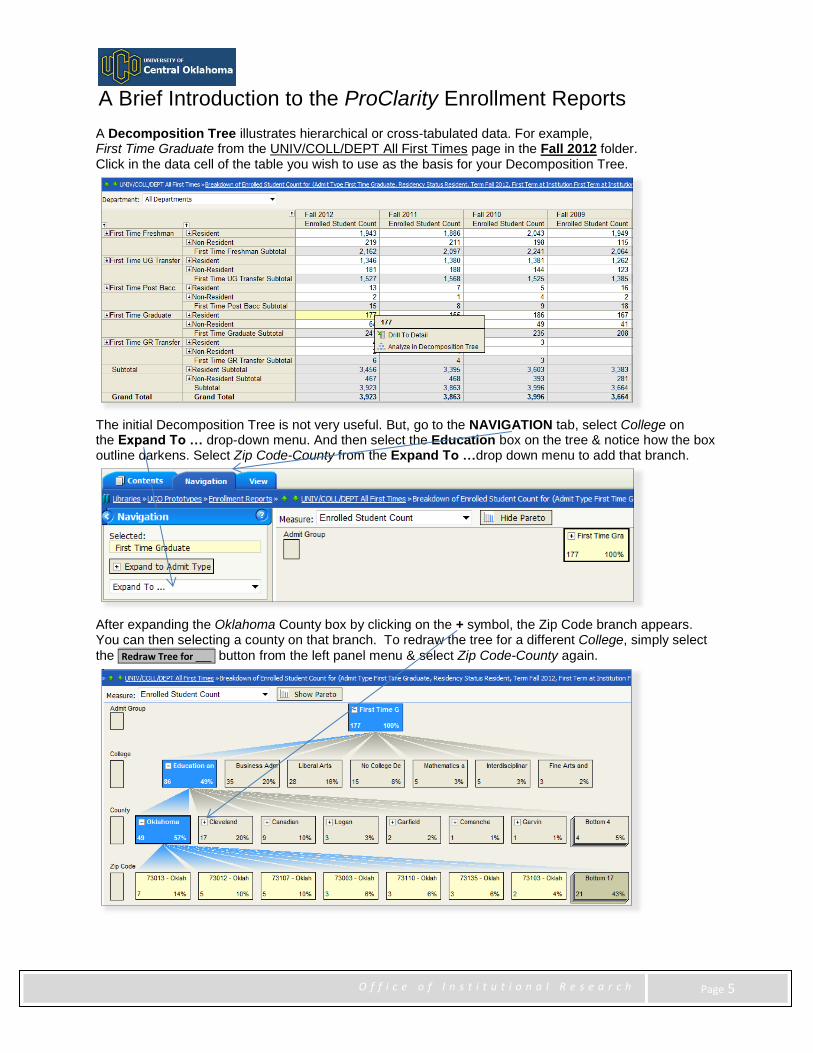
A Decomposition Tree illustrates hierarchical or cross-tabulated data. For example, First Time Graduate from the UNIV/COLL/DEPT All First Times page in the Fall 2012 folder. Click in the data cell of the table you wish to use as the basis for your Decomposition Tree.
The initial Decomposition Tree is not very useful. But, go to the NAVIGATION tab, select College on the Expand To … drop-down menu. And then select the Education box on the tree & notice how the box outline darkens. Select Zip Code-County from the Expand To …drop down menu to add that branch.
After expanding the Oklahoma County box by clicking on the + symbol, the Zip Code branch appears. You can then selecting a county on that branch. To redraw the tree for a different College, simply select
the Redraw Tree for ___ button from the left panel menu & select Zip Code-County again.
A Brief Introduction to the ProClarity Enrollment Reports
O f f i c e o f I n s t i t u t i o n a l R e s e a r c h
Page 6
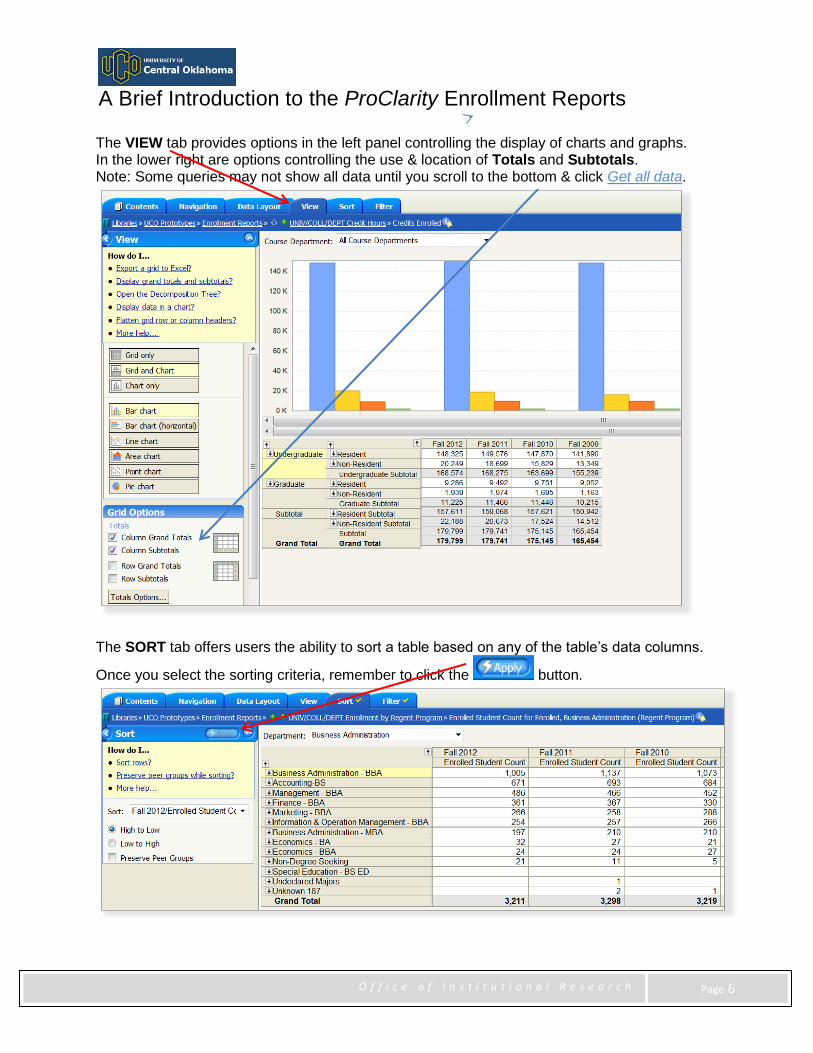
The VIEW tab provides options in the left panel controlling the display of charts and graphs. In the lower right are options controlling the use & location of Totals and Subtotals. Note: Some queries may not show all data until you scroll to the bottom & click Get all data.
The SORT tab offers users the ability to sort a table based on any of the table’s data columns.
Once you select the sorting criteria, remember to click the button.
A Brief Introduction to the ProClarity Enrollment Reports
O f f i c e o f I n s t i t u t i o n a l R e s e a r c h
Page 7
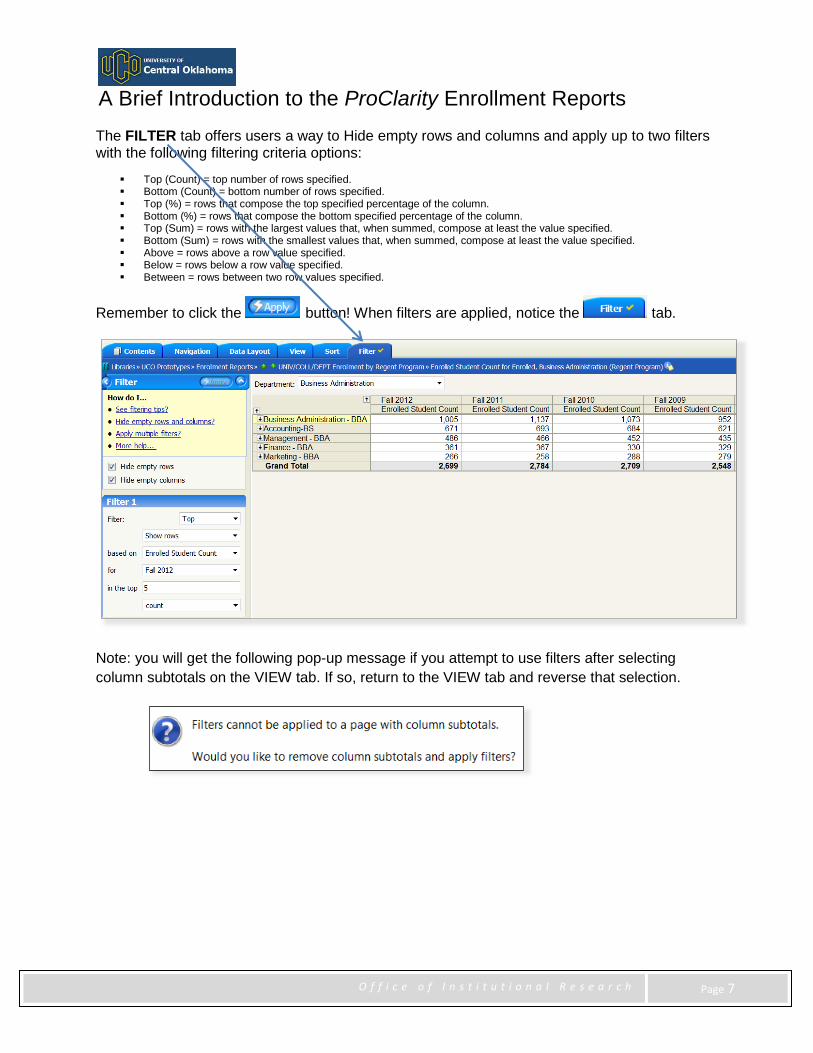
The FILTER tab offers users a way to Hide empty rows and columns and apply up to two filters with the following filtering criteria options:
Top (Count) = top number of rows specified. Bottom (Count) = bottom number of rows specified. Top (%) = rows that compose the top specified percentage of the column. Bottom (%) = rows that compose the bottom specified percentage of the column. Top (Sum) = rows with the largest values that, when summed, compose at least the value specified. Bottom (Sum) = rows with the smallest values that, when summed, compose at least the value specified. Above = rows above a row value specified. Below = rows below a row value specified. Between = rows between two row values specified.
Remember to click the button! When filters are applied, notice the tab.
Note: you will get the following pop-up message if you attempt to use filters after selecting
column subtotals on the VIEW tab. If so, return to the VIEW tab and reverse that selection.
A Brief Introduction to the ProClarity Enrollment Reports
O f f i c e o f I n s t i t u t i o n a l R e s e a r c h
Page 8
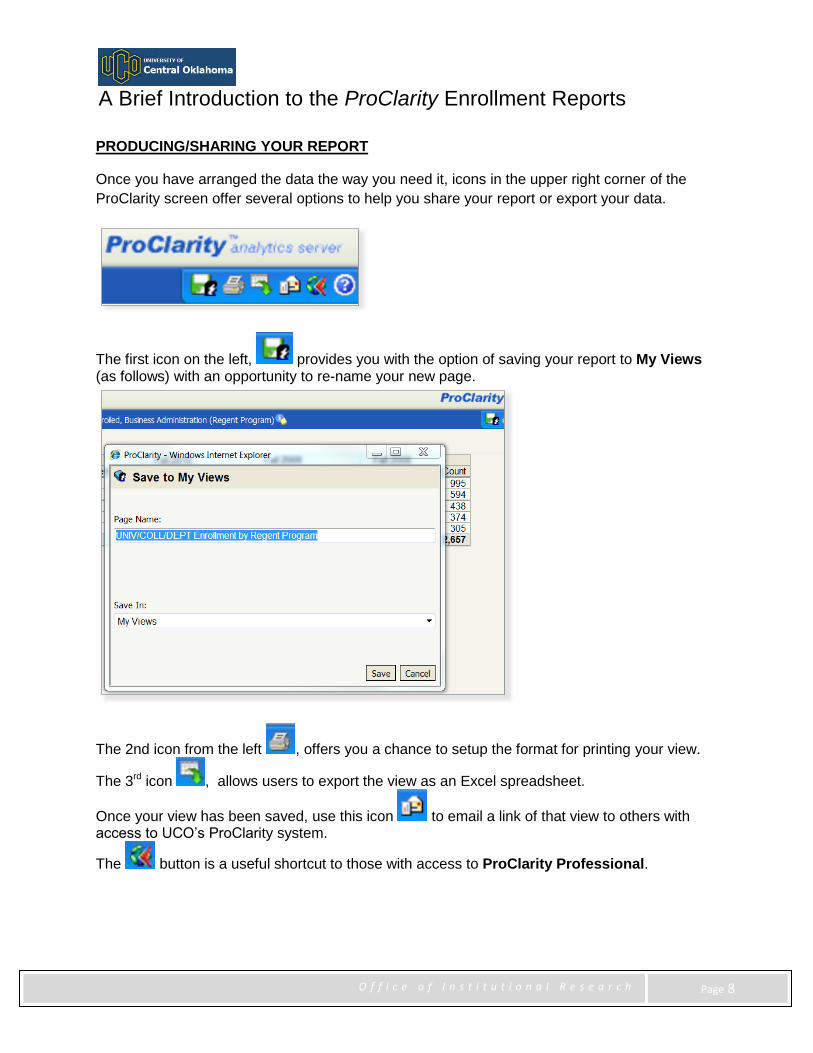
PRODUCING/SHARING YOUR REPORT
Once you have arranged the data the way you need it, icons in the upper right corner of the
ProClarity screen offer several options to help you share your report or export your data.
The first icon on the left, provides you with the option of saving your report to My Views (as follows) with an opportunity to re-name your new page.
The 2nd icon from the left , offers you a chance to setup the format for printing your view.
The 3rd icon , allows users to export the view as an Excel spreadsheet.
Once your view has been saved, use this icon to email a link of that view to others with access to UCO’s ProClarity system.
The button is a useful shortcut to those with access to ProClarity Professional.
A Brief Introduction to the ProClarity Enrollment Reports
O f f i c e o f I n s t i t u t i o n a l R e s e a r c h
Page 9
ADDITIONAL OPTIONS
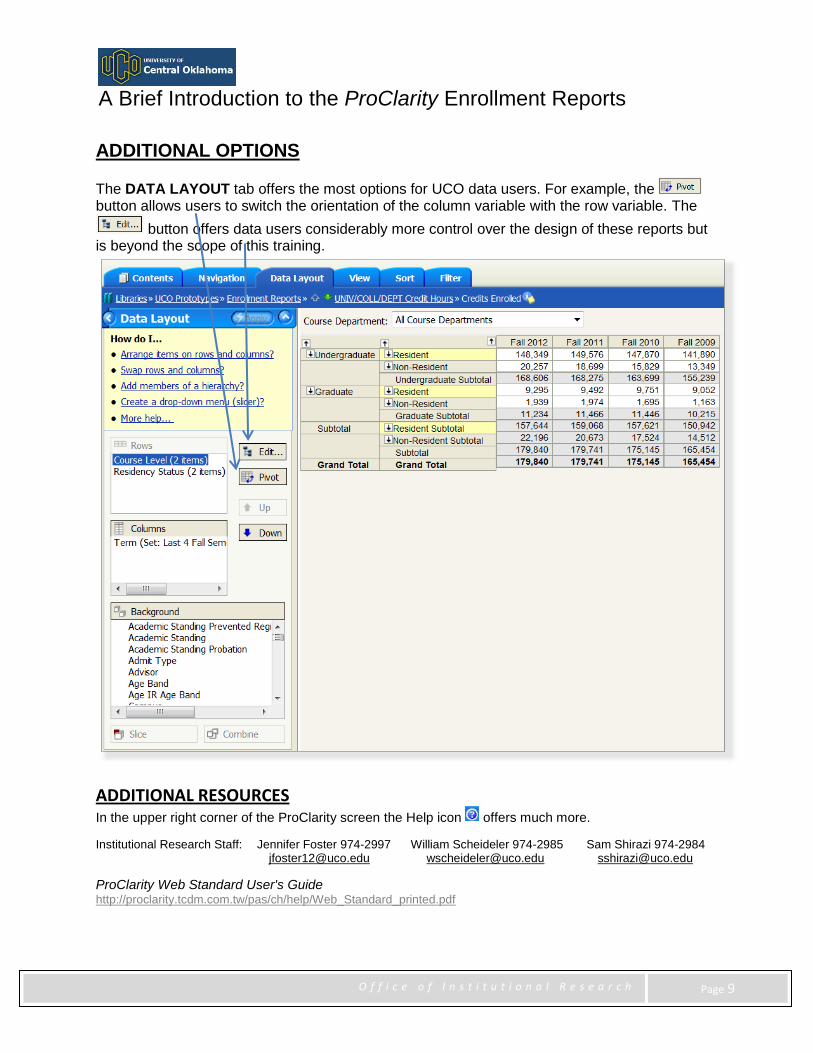
The DATA LAYOUT tab offers the most options for UCO data users. For example, the button allows users to switch the orientation of the column variable with the row variable. The
button offers data users considerably more control over the design of these reports but is beyond the scope of this training.
ADDITIONAL RESOURCES In the upper right corner of the ProClarity screen the Help icon offers much more.
Institutional Research Staff: Jennifer Foster 974-2997 William Scheideler 974-2985 Sam Shirazi 974-2984 [email protected] [email protected] [email protected]
ProClarity Web Standard User's Guide http://proclarity.tcdm.com.tw/pas/ch/help/Web_Standard_printed.pdf