Embed Size (px)
Citation preview

Munich Personal RePEc Archive
A brief future of Time in the monopoly
of scientific knowledge
Asongu, Simplice A
1 May 2013
Online at https://mpra.ub.uni-muenchen.de/46959/
MPRA Paper No. 46959, posted 14 May 2013 05:26 UTC

1
A brief future of Time in the monopoly of scientific knowledge
Simplice A. Asongu
African Governance and Development Institute,
P.O. Box 18 SOA/ 1365 Yaoundé, Cameroon.
E-mail: [email protected]
Abstract
This seminal paper provides global empirical evidence on catch-up processes in
scientific and technical publications. Its purpose is to model the future of scientific knowledge
monopoly in order to understand whether the impressive growth experienced by latecomers in
the industry has been accompanied by a similar catch-up in scientific capabilities and
knowledge contribution. The empirical evidence is based on 41 catch-up panels which
together consist of 99 countries. The richness of the dataset allows us to disaggregate
countries into fundamental characteristics based on income-levels (high-income, lower-
middle-income, upper-middle-income and low-income), legal-origins (English common-law,
French civil-law, German civil-law and, Scandinavian civil-law) and, regional proximity
(South Asia, Europe & Central Asia, East Asia & the Pacific, Middle East & North Africa,
Latin America & the Caribbean and, Sub-Saharan Africa). Three main issues are
investigated: the presence or not of catch-up processes, the speed of the catch-up processes
and, the time needed for full (100%) catch-up. The findings based on absolute and conditional
catch-up patterns broadly show that advanced countries will continue to dominate in scientific
knowledge contribution. Policy implications are discussed.
Keywords: Research and Development; Catch-up
JEL Classification: F42; O10; O30; O38; O57
1. Introduction
Catch-up has been referred to as the process through which once backward countries
successfully narrow the gap in productivity and income with frontier countries.
Accordingly, the process has been historically associated with the adoption and transfer of
existing techniques from mature industries in leading countries to backward ones. As a
complex process, catch-up entails many different aspects, actors and dimensions of an
economic system; among them universities and public research centers have been regarded as
central players in recent and past experiences in the catch-up processes (Mazzoleni 2008).

2
These organizations make-up the supporting infrastructure for the acquisition and building of
scientific and technological capabilities, provide the general and specialized training,
equipment and instrumentation, scientific and technological information and also contribute to
the design of new products and processes (Morrison et al., 2009).
Comparative literature on scientific and research productivity of advanced countries
has flourished in recent years, depicting how different context and strategies enable countries
to mitigate the gap with the frontier countries. Less attention has been paid to the evolution of
universities and research organizations in backward regions. Accordingly, we know very little
about whether and how cross-country gaps in scientific productivity are narrowing or
expanding. This paper intends to contribute to this latter stream of the literature by providing
seminal empirical evidence of catch-up processes in knowledge contribution from scientific
and technical journal articles publication. The purpose is to understand whether the
impressive growth experienced by latecomers in this industry has been accompanied by a
similar catch-up process in scientific capabilities.
As far as we have reviewed, there is currently no empirical study that has analyzed or
modeled global trends in scientific and technical publications. In this seminal contribution
three main issues are investigated: the presence or not of catch-up processes, the speeds of the
catch-up processes and, the time needed for full (100%) catch-ups. The empirical evidence is
based on 41 catch-up panels which together consist of 99 countries. The richness of the
dataset allows us to disaggregate countries into fundamental characteristics based on income-
levels (high-income, lower-middle-income, upper-middle-income and low-income), legal-
origins (English common-law, French civil-law, German civil-law and, Scandinavian civil-
law) and, regional proximity (South Asia, Europe & Central Asia, East Asia & the Pacific,
Middle East & North Africa, Latin America & the Caribbean and, Sub-Saharan Africa).

3
The rest of the paper is organized as follows. Section 2 provides the intuition for the
catch-up framework. Data and methodology are discussed and outlined respectively in
Section 3. Section 4 covers the empirical analysis while we conclude with Section 5.
2. Catch-up processes in scientific publications
Since the 1990s, there has been growing emphasis on the relevance of scientific
publications in knowledge economy (KE), a phenomenon that has been central in the reports
of most influential organizations as the engine for long-term economic prosperity (World
Bank, 2007; Weber, 2007). Europe and North America that have mastered the dynamics of
scientific publications have been steering development in the global arena. Other regions like
East Asia and Latin America have been responding in calculated that underscore the relevance
of scientific know-how in their current pursuits of national, regional and local initiatives
(Asongu, 2013a). The pattern of Japan has set the course for governments of the Newly
Industrialized Asian Economies (China, Korea, Hong Kong, Singapore, Malaysia and
Taiwan) that have begun marching towards knowledge-based economies from the product-
based economies (Chandra & Yokoyama, 2011). In Africa and the Middle East, KE items
have recently been taking a substantial portion of the agenda on development discussions
(Asongu, 2013b). Consistent with Wantchékon (2013), of the 258 impact evaluation studies in
2004, only 11% included African authors. He has also stressed that, since the year 2002, only
7% of the 401 African related publications in the Journal of Development Economics are co-
authored by Africans. Accordingly, it is still widely disputed whether universities and public
research organizations in developing countries should be encouraged to undertake frontier
research (Mazzoleni, 2008). There is however consensus that local-focused research is
necessary to support indigenous capabilities and to build national absorptive capacity.
The role of universities and public research organizations in catch-up is straight
forward. They contribute to development in various ways. First and foremost, their key

4
mission is education and training as shown by the early experiences of Germany in the 19th
century and late experiences of Asian countries (Japan, South Korea and Taiwan). The
availability of skilled workers and teachers, the migration of technicians from leading
countries and the training of students abroad are relevant in enabling conditions for building-
up indigenous technological capabilities (Kim & Nelson, 2000; Mowery & Sampat, 2005;
Morrison et al., 2009). Moreover, beside education, universities and public research
organizations contribute to a country’s development by undertaking basic and applied
research. Consistent with Morrison et al. (2009), what matters today in the catch-up processes
is that basic and applied research represent along with other ingredients, a key determinant for
building scientific capabilities which are inputs for innovation and growth (Balconi et al.,
2010). This assertion is true today in the context of developing countries more than ever. In
line with Mazzoleni & Nelson (2007), two reasons have been advanced to substantiate this
claim: (1) the changing nature of technology and science and; (2) the impact of globalization
on the diffusion of knowledge and the relative importance of scientific actors.
With respect to the changing nature of technology and science, in line with Morrison
et al. (2009), knowledge as well as products and technologies have nowadays a much shorter
life cycle. The distinction between what is a scientific input and technology in several
scientific domains is not clear-cut, which means that scientific discoveries are often
intertwined with technological development in a manner that the lag between discoveries and
the product development is quite of short span. Additionally, new industrial sectors and
technologies have stronger scientific underpinnings for the most part. Hence, the two
communities are increasingly interacting as substantially documented in the literature (D’Este
& Patel, 2007). These studies are consistent with the position that catch-up countries, along
with firms and universities therein, need to be well equipped to rapidly adapt to the changing
and evolving external environmental conditions. In order to realize this objective, they have to

5
set up a scientific infrastructure which would enable them to renew their repertories or
competence and knowledge or at least to identify the relevant sources of knowledge timely.
Hence, all these efforts are needed for the nurturing and development of indigenous scientific
capabilities, both in terms of research activity and skills formation. On the premise of similar
arguments, several approaches have claimed that a third mission of universities is to directly
contribute to industrial research (Morrison et al., 2009). In a nutshell, Albuquerque (2000) has
pointed four roles of science for the catch-up process: source of technological opportunities,
sources of trained researchers, development and improved research techniques and, sources of
tacit and public knowledge.
Regarding the other dimension, the forces of globalization have imposed to catch-up
countries a new regulatory framework in which they have to operate. Accordingly, the access
to knowledge is today more restricted owing to tight intellectual property rights (IPRs) which
further constrain the ability of backward countries to catch-up with the technological and
scientific frontier. Hence, consistent with Mazzoleni & Nelson (2007), in this stricter
regulatory framework the adoption of external technology has become more difficult and
costly; similar policies aimed at supporting national industries must comply with more
stringent competition rules that prohibit the standardization of industries. In this context, the
support for science training, education and infrastructure has become a viable alternative for
the promotion of indigenous technological capabilities. Accordingly, globalization has also
meant that the worldwide scientific community is more interconnected that ever. Hence,
scientists in less developed countries have higher opportunities to interact with their peers in
the frontier countries and this contributes to giving them access to relevant scientific sources.
In light of the above motivations, the present paper seeks to assess whether the gap
between less developed and developed countries is reducing in terms of contribution to
scientific knowledge.

6
3. Data and Methodology
3.1 Data
We examine a sample of 99 countries with data from the World Bank Development
Indicators (WDI), the Global Market Information Database (GMID) and the World
Intellectual Property Organization (WIPO) for the period 1994-2010. The limitations to 99
countries and 17 year annual periodicity are due to constraints in data availability on scientific
publications. The dependent variable is the number of scientific and technical journal articles
published annually.
3.1.1 Determination of fundamental characteristics and catch-up panels
We now devote space to discussing the determination of fundamental characteristics
and corresponding catch-up panels. Consistent with Asongu (2012a), it is unlikely to find
catch-up processes within a heterogeneous set of countries. Recent studies have stressed the
relevance of a variety of contexts and historical periods (Mazzoleni, 2008; Mazzoleni &
Nelson, 2007) and geographical areas (Morrison et al., 2009) in the catch-up process.
Accordingly, the determination of fundamental characteristics should be based on factor that
naturally determine scientific and technical publications such as research and development
budgets, degree of IPRs protections, rate of higher education…etc. However as cautioned by
Asongu (2012a), macroeconomic fundamental characteristics have the draw-back of being
time-dynamic. Hence, the same threshold may not be consistent over time, especially in a
horizon of 17 years. In accordance with the literature (Narayan et al., 2011; Asongu, 2012a),
we shall take a minimalistic approach in the determination of fundamental characteristics and
control for fundamental determinants of scientific publications in the estimations. The main
fundamental characteristics are based on: legal origins, income-levels and regional proximity
while corresponding catch-up panels are derived from the fundamental characteristics.

7
Firstly, the foundation of legal origin as a fundamental characteristic of scientific
publication is based on the emphasis legal origins place on private property rights vis-à-vis
those of the state (La Porta et al., 1998) and education (Agbor, 2011). According to Agbor,
the educational channel substantially explains variations in economic performance among
countries with different legal traditions in sub-Saharan Africa (SSA). In essence, the
underlying logic for this segmentation is that the institutional web of informal norms, formal
rules and enforcement characteristics affect the educational and research environments. The
legal origins include: English common-law, French civil-law, German civil-law and
Scandinavian civil-law.
Secondly, assessing scientific publications with income-level dynamics is deeply
rooted in the intuition that wealthy nations have the tendency to allocate more funds to
research activities. The income-levels include: High-income, Upper-middle-income, Lower-
middle-income and, Low-income.
Thirdly, regional proximity is also fundamental in the catch-up process because
Morrison et al. (2009) has postulated that differences over time and across geographical areas
also explain the catch-up process. Moreover the inclusion of this characteristic is broadly
consistent with the empirical underpinnings of the catch-up literature (Narayan et al., 2011;
Asongu, 2013c; Andrés & Asongu, 2013). The regions include: South Asia, Europe &
Central Asia, East Asia & the Pacific, Middle East & North Africa, Sub-Saharan Africa and,
Latin America & the Caribbean.
From the fundamental characteristics, 41 catch-up panels on which the empirical
analysis will be based are derived. These include: 10 on wealth-effects (High-income, High-
income and Upper-middle-income, High-income and Lower-middle-income, High-income
and Low-income, Upper-middle-income, Upper-middle-income and Lower-middle-income,
Upper-middle-income and Low-income, Lower-middle-income, Lower-middle-income and

8
Low-income, Low-income); 10 on legal origins (English common-law, English common-law
and French civil-law, English common-law and German civil-law, English common-law and
Scandinavian civil-law, French civil-law, French civil-law and German civil-law, French
civil-law and Scandinavian civil-law, German civil-law, German civil-law and Scandinavian
civil-law and, Scandinavian civil-law) and; 21 on regional proximity (South Asia, South Asia
and Europe & Central Asia, South Asia and East Asia & the Pacific, South Asia and Middle
East & North Africa, South Asia and Latin America & the Caribbean, South Asia and Sub-
Saharan Africa, Europe & Central Asia, Europe & Central Asia and East Asia & the Pacific,
Europe & Central Asia and Middle East & North Africa, Europe & Central Asia and Latin
America & the Caribbean, Europe & Central Asia and Sub-Saharan Africa, East Asia & the
Pacific, East Asia & the Pacific and Middle East & North Africa, East Asia & the Pacific and
Latin America & the Caribbean, East Asia & the Pacific and Sub-Saharan Africa, Middle East
& North Africa, Middle East & North Africa and Latin America & the Caribbean, Middle
East & North Africa and Sub-Saharan Africa, Latin America & the Caribbean, Latin
America & the Caribbean and Sub-Saharan Africa and, Sub-Saharan Africa).
3.1.2 Choice of control variables
The choice of control variables is contingent on the theoretical underpinnings of
conditional convergence which state that, if countries differ in characteristics that determined
scientific publications, it is possible for conditional convergence to take place. Hence, we
control for such factors that determine scientific publications which include: research and
development (R&D) expenditure, tertiary school enrolment, internet penetration1 and
protection of IPRs (Main IPRs law and WIPO2 Treaties). Accordingly, the potential for IPRs
to stimulate the diffusion of scientific knowledge is at the heart several contemporary issues: a
1 The rising cost of traditional scientific scholarly communication coupled with the increase of widely available
internet communication tools such as the World Wide Web (www) have provided a catalyst for a revolution in
the exchange of scientific and technical information (Esler & Nelson, 1998). 2 World Intellectual Property Organisation.
9
central agenda is how IPRs over a given piece of knowledge affects the propensity of future
researchers to build upon that knowledge in their own scientific research activities (Murray &
Stern, 2005). From intuition, R&D expenditure, tertiary school enrolment and degree of
internet penetration naturally favor scientific activities. The control variables are broadly
consistent with the factors central in the production of knowledge that have recently been
identified by Amavilah (2009).
Details about the summary statistics (with presentation of countries), correlation
analysis (showing the basic correlations between key variables used in this paper) and
variable definitions (with corresponding data sources) are presented respectively in Appendix
1, Appendix 2 and Appendix 3. The descriptive statistics of the variables show that, there is
quite some degree of variation in the data utilized so that one should be comfortable and
confident that reasonable estimated relationships would emerge. The purpose of the
correlation matrix is to mitigate concerns of overparametization and multicolinearity. Based
on the correlation coefficients, there do not appear to be any major issues in terms of the
relationships to be estimated.
3.2 Methodology
The estimation procedure typically follows modeling of the future of KE by Asongu
(2013a). Consistent with recent literature (Asongu, 2012a, 2013a; Andrés & Asongu, 2013),
the estimation approach is based on β-convergence due to constraints in the data set. The use
of cointegration and unit roots tests are not convenient due to limited degrees of freedom in
homogenous panels or fundamental characteristics. Additionally, the alternative type of
convergence (σ-convergence) which is of the view that, a group of economies converge when
the cross-sectional variance of the variable under consideration declines, is also inappropriate
because the data structure of the paper is panel. Our estimation procedure typically follows
the evidence of income convergence across countries that have been investigated in the

10
context of pioneering works in neoclassical growth models (Baumol, 1986; Barro & Sala-i-
Martin, 1992, 1995; Mankiw et al., 1992).
In accordance with the convergence literature (Fung, 2009, p. 3; Asongu, 2012a), the
two equations below are the standard approaches for investigating conditional convergence if
tiW , is taken as strictly exogenous.
titititititi WYYY ,,,,, )ln()ln()ln( (1)
tititititi WYY ,,,, )ln()ln( (2)
Where tiY , is the proxy for the rate of scientific publications in country i at period t. σ = 1+ β.
tiW , is a vector of determinants of publications, i is a country-specific effect, t is a time-
specific constant and ti , an error term. According to the neo-classical growth model, a
statistically significant negative coefficient on in Eq. (1) suggests that, countries relatively
close to their steady state in ‘scientific publications growth’ will experience a slowdown in
the growth of scientific publications, known as conditional convergence (Narayan et al., 2011,
p. 2). In the same line of thinking, according to Fung (2009, p. 3) and recent catch-up
literature (Asongu, 2012a, 2013a; Andrés & Asongu, 2013), if 10 in Eq. (2), then tiY ,
is dynamically stable around the path with a trend of publication rate the same as that of tW ,
and with a height relative to the level of tW . The variables incorporated in tiW , and the
individual effect i are measures of the long-term level the publications market is converging
to. Hence, the country-specific effect i emphasizes other determinants of a country’s steady
state not captured by tiW , .
Conditions for convergence outlined above are valid if and only if, tiW , exhibits strict
exogeneity. Unfortunately, this is not the case in the real world because, while R&D, internet
penetration, tertiary school enrolment and IPR laws (components of tiW , ) influence the rate of

11
scientific publication, the reverse effect is also true. Hence, we are faced with the issue of
endogeneity in which control variables ( tiW , ) are correlated with the error term ( ti , ).
Moreover, country- and time-specific effects could be correlated with other variables in the
model, which is very probable with lagged endogenous variables included in the equations. A
means of tackling the problem of the correlation between the individual specific-effect and the
lagged dependent variables consists of eliminating the individual effect by first differencing.
Thus Eq. (2) becomes:
)()()())ln()(ln()ln()ln( ,,2,,2,,,, tititttitititititi WWYYYY (3)
However Eq. (3) presents another issue; estimates by Ordinary Least Square (OLS) are
still biased because there remains a correlation between the lagged endogenous independent
variable and the error term. To tackle this concern, we estimate the regression in differences
jointly with the regression in levels using the Generalized Method of Moments (GMM)
estimation. Arellano & Bond (1991) has suggested an application of the Generalized Method
of Moments (GMM) that exploits all the orthogonality conditions between the lagged
dependent variables and the error term. The process employs lagged levels of the regressors as
instruments in the difference equation, and lagged differences of the regressors as instruments
in the levels equation, therefore exploiting all the orthogonality conditions between the lagged
dependent variables and the error term. Between the difference GMM estimator (Arellano &
Bond, 1991) and system GMM estimator (Arellano & Bover, 1995; Blundell & Bond, 1998),
we choose the latter in accordance with Bond et al. (2001, pp. 3-4)3.
3 “We also demonstrate that more plausible results can be achieved using a system GMM estimator suggested by
Arellano & Bover (1995) and Blundell & Bond (1998). The system estimator exploits an assumption about the
initial conditions to obtain moment conditions that remain informative even for persistent series, and it has been
shown to perform well in simulations. The necessary restrictions on the initial conditions are potentially
consistent with standard growth frameworks, and appear to be both valid and highly informative in our
empirical application. Hence we recommend this system GMM estimator for consideration in subsequent
empirical growth research”. Bond et al. (2001, pp. 3-4).

12
The GMM estimation approach has been substantially applied in the catch-up
literature. In model specification, we choose the two-step GMM because it corrects the
residuals for heteroscedasticity4. The hypothesis of no auto-correlation in the residuals is
crucial as lagged variables are to be used as instruments for the dependent variables.
Accordingly, the estimation depends on the assumption that the lagged values of the
dependent variable and other independent variables are valid instruments in the regression.
When the error terms of the level equation are not auto-correlated, the first-order auto-
correlation of the differenced residuals should be significant whereas their second-order auto-
correlation should not be. The validity of the instruments is examined with the Sargan over-
identifying restrictions (OIR) test.
In accordance with Islam (1995, p. 14), yearly time spans are too short to be
appropriate for studying catch-up processes, as short-run disturbances may loom substantially
in such brief time spans. Therefore, considering the data span of 17 years, we are consistent
with Asongu (2012a) in using two-year non-overlapping intervals (NOI)5. This implies in our
analysis, τ is set to 26. We also compute the implied rate of convergence by calculating σ/2.
Accordingly, the estimated coefficient of the lagged differenced endogenous variable is
divided by 2 because we have used a two year interval to absorb the short-term disturbances.
When the absolute value of the estimated autoregressive coefficient is greater than zero but
less than one ( 10 ), we establish evidence of catch-up. The broader interpretation
4 In the one-step approach, the residuals are assumed to be homoscedastic.
5 We have 9 two-year non-overlapping intervals: 1994; 1995-1996; 1997-1998; 1999-2000; 2001-2002; 2003-
2004; 2005-2006; 2007-2008; 2009-2010. Owing to data and periodical constraints, the first interval is short of
one year. 6 Consistent with Asongu (2013a), beside the two justifications provided above, we may cite three additional
premises on which this choice of the two-year NOI is based. Firstly, NOI with a higher numerical value (say
three-year NOI) absorbs more short-run disturbances at the cost of weakening the model. Hence the preference
for the two-year NOI over the three/four/five-year NOI is further justified by the need to exploit the time series
dimensions as much as possible. Secondly, a corollary to the above point is the positive side of additional
degrees of freedom necessary for conditional convergence modeling. Hence, given the time span of 17 years, a
higher order of NOI will greatly limit conditional convergence analysis. Thirdly, heuristically from a visual
analysis, the rate of scientific publications does not show evidence of persistent business cycles (short-term)
disturbances that require higher NOI.

13
suggests, past variations have a less proportionate impact on future differences, implying the
variation on the left hand side of Eq. (3) is decreasing overtime as the country is converging
to a steady state (Asongu, 2012a).
4. Empirical analysis
4.1 Presentation of results
This section looks at three principal concerns: (1) investigation of the presence of
catch-ups; (2) computation of the catch-up speeds and; (3) determination of the time needed
for full (100%) catch-ups. The summary of overall findings is presented in Tables 1-2 in
which, the three issues are addressed. Results for absolute (unconditional) and conditional
catch-ups are reported in Table 3 and Table 4 respectively.
Whereas, absolute catch-up is estimated with just the lagged difference of the
endogenous variable as independent variable, conditional catch-up is with respect to Eqs. (2)
and (3) in the presence of control variables. Hence, unconditional convergence is estimated in
the absence of tiW , : vector of determinants (R&D, internet penetration, tertiary school
enrolment and IPRs laws) of scientific publications. To assess the validity of the model and
indeed the catch-up hypothesis, we perform two tests, notably the Sargan-test which examines
the over-identification restrictions and, the Arellano and Bond test for autocorrelation which
assesses the null hypothesis of no autocorrelation. The Sargan-test investigates if the
instruments are uncorrelated with the error term in the equation of interest. The null
hypothesis is the position that, the instruments as a group are strictly exogenous (do not suffer
from endogeneity) that is needed for the validity of the GMM estimates. The p-values of
estimated coefficients are reported in brackets in the line following the reported values of the
estimated coefficients. But for a few exceptions, we notice that the Sargan-test statisitics often
appear with a p-value greater than 0.10. Hence, its null hypothesis is not rejected for the most
part. We also report the second order autocorrelation test and notice that for an overwhelming
majority of estimated models, we are unable to reject the null hypothesis for the absence of

14
autocorrelation. Not specifically applicable (nsa) is used where we are unable to model due to
issues in degrees of freedom while ‘not applicable’ (na) is employed in situations of
insignificant evidence of catch-up.
Summaries of the results in Tables 3-4 are reported in Tables 1-2. These include
results for Absolute Catch-up (AC), Conditional Catch-up (CC), the Speed of Absolute Catch-
up (SAC), the Speed of Conditional Catch-up (SCC) and, the rate required to achieve full
(100%) catch-up for both AC and CC.
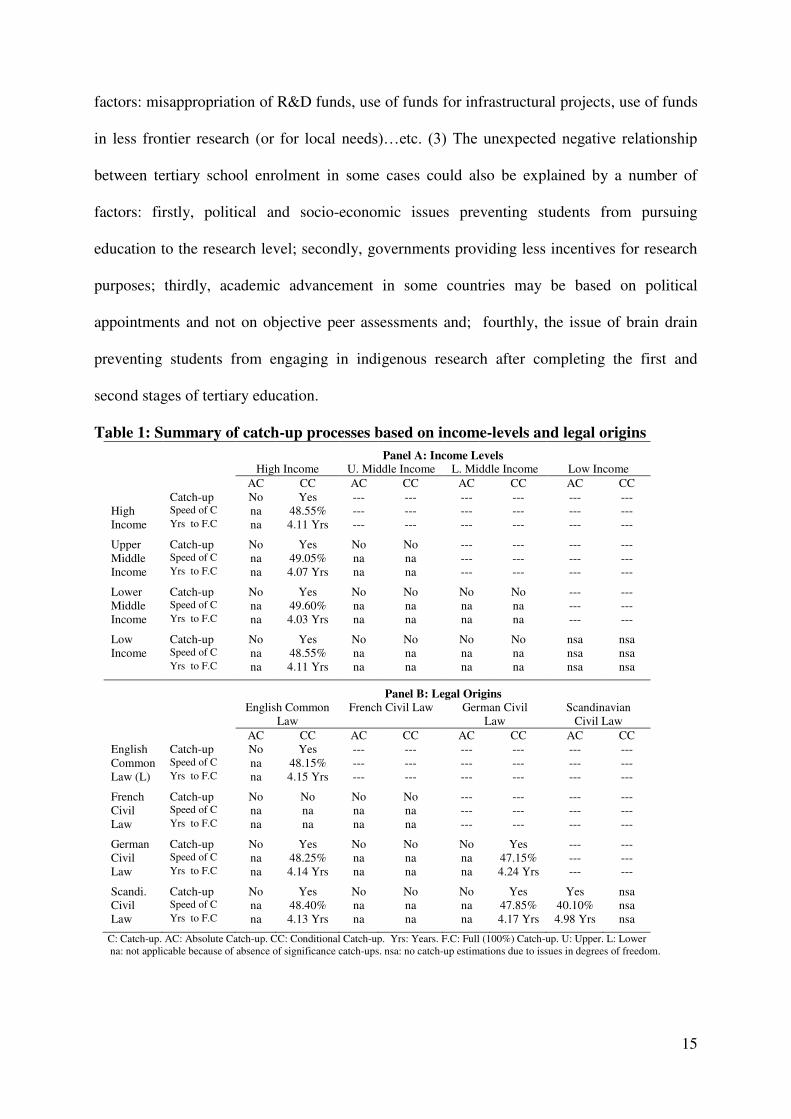
From a general perspective, the following conclusions could be drawn. (1) But for
evidence of conditional catch-ups between High-income and other income classes, there is
overwhelming absence of catch-ups based on wealth-effects (Panel A of Table 1). (2) There
is an isolated evidence of AC among Scandinavian civil law countries and some traces of CC
among English common-law countries, between English common-law and German civil-law
countries, English common-law and Scandinavian civil law countries, among German civil
law countries, between German civil-law and Scandinavian civil-law countries (Panel B of
Table 1). (3) There is evidence of AC among countries of the same region (South Asia, Latin
American & the Caribbean (LAC), SSA) and between countries of different regions ( South
Asia and LAC, LAC & SSA); CC between South Asia and Europe & Central Asia on the one
hand and, between the latter and all other regions (Table 2). (4) The speed of catch-up hovers
between 48-49% with an average time for full catch-up in the neighborhood of 4 years. For
example, with an initial value of 0.973, the rate of convergence is 48.65% ((0.789/2)*100)
and the time needed to achieve full convergence is 4.11 years (200%/48.65%). Hence, 4.11
years is required to achieve a 100% convergence for an estimated lagged value of 0.973.
Most of the significant control variables have the expected signs. (1) Internet
penetration consistently increases the rate of publications. (2) The negative incidence of R&D
funds on publications in LAC and Lower-middle-income countries is contingent on many
15
factors: misappropriation of R&D funds, use of funds for infrastructural projects, use of funds
in less frontier research (or for local needs)…etc. (3) The unexpected negative relationship
between tertiary school enrolment in some cases could also be explained by a number of
factors: firstly, political and socio-economic issues preventing students from pursuing
education to the research level; secondly, governments providing less incentives for research
purposes; thirdly, academic advancement in some countries may be based on political
appointments and not on objective peer assessments and; fourthly, the issue of brain drain
preventing students from engaging in indigenous research after completing the first and
second stages of tertiary education.
Table 1: Summary of catch-up processes based on income-levels and legal origins
Panel A: Income Levels High Income U. Middle Income L. Middle Income Low Income
AC CC AC CC AC CC AC CC
High
Income
Catch-up No Yes --- --- --- --- --- --- Speed of C na 48.55% --- --- --- --- --- --- Yrs to F.C na 4.11 Yrs --- --- --- --- --- ---
Upper
Middle
Income
Catch-up No Yes No No --- --- --- --- Speed of C na 49.05% na na --- --- --- --- Yrs to F.C na 4.07 Yrs na na --- --- --- ---
Lower
Middle
Income
Catch-up No Yes No No No No --- --- Speed of C na 49.60% na na na na --- --- Yrs to F.C na 4.03 Yrs na na na na --- ---
Low
Income
Catch-up No Yes No No No No nsa nsa Speed of C na 48.55% na na na na nsa nsa Yrs to F.C na 4.11 Yrs na na na na nsa nsa
Panel B: Legal Origins
English Common
Law
French Civil Law German Civil
Law
Scandinavian
Civil Law
AC CC AC CC AC CC AC CC
English
Common
Law (L)
Catch-up No Yes --- --- --- --- --- --- Speed of C na 48.15% --- --- --- --- --- --- Yrs to F.C na 4.15 Yrs --- --- --- --- --- ---
French
Civil
Law
Catch-up No No No No --- --- --- --- Speed of C na na na na --- --- --- --- Yrs to F.C na na na na --- --- --- ---
German
Civil
Law
Catch-up No Yes No No No Yes --- --- Speed of C na 48.25% na na na 47.15% --- --- Yrs to F.C na 4.14 Yrs na na na 4.24 Yrs --- ---
Scandi.
Civil
Law
Catch-up No Yes No No No Yes Yes nsa Speed of C na 48.40% na na na 47.85% 40.10% nsa Yrs to F.C na 4.13 Yrs na na na 4.17 Yrs 4.98 Yrs nsa
C: Catch-up. AC: Absolute Catch-up. CC: Conditional Catch-up. Yrs: Years. F.C: Full (100%) Catch-up. U: Upper. L: Lower
na: not applicable because of absence of significance catch-ups. nsa: no catch-up estimations due to issues in degrees of freedom.

16
Table 2: Summary of catch-up processes based on regions
Regions
South Asia ECA EAP MENA LAC SSA
AC CC AC CC AC CC AC CC AC CC AC CC
South
Asia
(SA)
Catch-up Yes nsa --- --- --- --- --- --- --- --- --- ---
Speed of C 48.65% nsa --- --- --- --- --- --- --- --- --- ---
Yrs to F.C 4.11Yrs nsa --- --- --- --- --- --- --- --- --- ---
Europe
& CA Catch-up No Yes No Yes --- --- --- --- --- --- --- ---
Speed of C na 48.25% na 48.6% --- --- --- --- --- --- --- ---
Yrs to F.C na 4.14 Yrs na 4.11Yrs --- --- --- --- --- --- --- ---
East
Asia &
the P
Catch-up No No No Yes No No --- --- --- --- --- ---
Speed of C na na na 48.7% na na --- --- --- --- --- ---
Yrs to F.C na na na 4.10Yrs na na --- --- --- --- --- ---
MENA Catch-up No No No Yes No No No No --- --- --- ---
Speed of C na na na 48.5% na na na na --- --- --- ---
Yrs to F.C na na na 4.12Yrs na na na na --- --- --- ---
LAC Catch-up Yes No No Yes No No No No Yes No --- ---
Speed of C 49.55% na na 49.9% na na na na 49.2% na --- ---
Yrs to F.C 4.03 Yrs na na 4Yrs na na na na 4.06 Yrs na --- ---
SSA Catch-up No nsa No Yes No No No No Yes No Yes nsa Speed of C na nsa na 48.9% na na na na 49.1% na 49.05% nsa Yrs to F.C na nsa na 4.08 Yrs na na na na 4.07 Yrs na 4.07 Yrs nsa
C: Catch-up AC: Absolute Catch-up. CC: Conditional Catch-up. Yrs: Years. F.C: Full (100%) Catch-up. ECA: Europe and Central Asia.
EAP: East Asia and the Pacific. MENA: Middle East and North Africa. SSA: Sub-Saharan Africa. LAC: Latin America and the Caribbean.
na: not applicable because of absence of significance catch-ups. nsa: no catch-up estimation due to issues in degrees of freedom.
Table 3: Absolute catch-ups
Panel A: Income Levels High Income (HI) Upper Middle Income (UMI) L M Income (LMI) Lower I
HI UMI LMI LI UMI LMI LI LMI LI LI
Initial 1.015*** 1.018*** 1.011*** 1.015*** 1.024*** 1.017*** 1.023*** 1.009*** 1.007*** nsa
(0.000) (0.000) (0.000) (0.000) (0.000) (0.000) (0.000) (0.000) (0.000)
AR(2) 0.372 0.658 -1.202 0.776 0.586 -0.436 0.700 -1.349 -1.198 nsa
(0.709) (0.510) (0.229) (0.437) (0.557) (0.662) (0.483) (0.177) (0.230)
Sargan 40.372 54.81** 51.80** 41.731 28.852 46.593* 30.196 23.466 25.375 nsa
(0.209) (0.013) (0.025) (0.170) (0.718) (0.073) (0.654) (0.912) (0.857)
Wald 82834*** 62249*** 23020*** 82474*** 15450*** 11936*** 15869*** 4280*** 4065*** nsa
(0.000) (0.000) (0.000) (0.000) (0.000) (0.000) (0.000) (0.000) (0.000)
Countries 41 70 65 43 29 53 31 24 26
Obs 328 547 519 344 219 410 235 191 207
Panel B: Legal Origins English Common Law French Civil Law(CL) German Civil Law Scan CL
English French German Scan. French German Scan. German Scan. Scan.
Initial 1.019*** 1.017*** 1.018*** 1.018*** 1.015*** 1.015*** 1.014*** 1.016*** 1.016*** 0.802***
(0.000) (0.000) (0.000) (0.000) (0.000) (0.000) (0.000) (0.000) (0.000) (0.000) AR(2) -0.242 -0.440 0.087 -0.248 -0.369 -0.175 -0.372 0.844 0.826 -0.644
(0.808) (0.659) (0.930) (0.803) (0.712) (0.860) (0.709) (0.398) (0.408) (0.519)
Sargan 24.983 53.501** 40.566 28.903 39.575 45.753* 40.824 15.884 20.999 2.779 (0.869) (0.0179) (0.203) (0.715) (0.235) (0.085) (0.195) (0.996) (0.960) (1.000)
Wald 31794*** 28448*** 29526*** 36342*** 14545*** 25286*** 15882*** 22941*** 28685*** 7.051***
(0.000) (0.000) (0.000) (0.000) (0.000) (0.000) (0.000) (0.000) (0.000) (0.000) Countries 25 75 42 29 50 67 54 17 21 4
Obs 200 592 330 232 392 522 424 130 162 32
Panel C: Regions South Asia (SA) Europe and Central Asia (ECA) SA ECA EAP MENA LAC SSA ECA EAP MENA LAC SSA
Initial 0.973*** 1.02*** 1.02*** 1.030*** 0.99*** 1.00*** 1.02*** 1.02*** 1.02*** 1.00*** 1.01***
(0.000) (0.000) (0.000) (0.000) (0.000) (0.000) (0.000) (0.000) (0.000) (0.000) (0.000) AR(2) 0.186 0.722 1.141 0.798 -0.835 -0.182 0.720 0.803 0.965 -0.403 0.332
(0.852) (0.470) (0.253) (0.424) (0.403) (0.855) (0.471) (0.421) (0.334) (0.686) (0.739)
Sargan 1.865 42.090 11.472 14.902 19.999 9.740 40.148 45.448* 47.836* 51.69** 45.27*
(1.000) (0.160) (0.999) (0.998) (0.973) (1.000) (0.216) (0.090) (0.058) (0.026) (0.093)
Wald 16.73*** 30548*** 27751*** 17355*** 2116*** 1059*** 27747*** 51887*** 33704*** 10407*** 23077***
(0.000) (0.000) (0.000) (0.000) (0.000) (0.000) (0.000) (0.000) (0.000) (0.000) (0.000) Countries 2 45 12 15 20 10 43 53 56 61 51
Obs 16 348 96 119 159 80 332 412 435 475 396

17
East Asia and the Pacific (EAP) Middle East & North Africa LAC SSA EAP MENA LAC SSA MENA LAC SSA LAC SSA SSA
Initial 1.024*** 1.026*** 1.004*** 1.020*** 1.032*** 1.003*** 1.021*** 0.984*** 0.982*** 0.981***
(0.000) (0.000) (0.000) (0.000) (0.000) (0.000) (0.000) (0.000) (0.000) (0.000) AR(2) 1.120 0.986 -0.794 -0.114 0.795 -0.654 0.086 -0.836 -0.808 -0.173
(0.262) (0.323) (0.427) (0.909) (0.426) (0.512) (0.931) (0.402) (0.418) (0.861)
Sargan 9.798 22.996 27.787 17.596 12.337 30.822 20.472 17.982 25.923 7.964 (1.000) (0.923) (0.765) (0.990) (0.999) (0.624) (0.967) (0.989) (0.838) (1.000)
Wald 35277*** 103991*** 7175*** 47575*** 15072*** 5135*** 30772*** 1579*** 1819*** 35.343***
(0.000) (0.000) (0.000) (0.000) (0.000) (0.000) (0.000) (0.000) (0.000) (0.000) Countries 10 23 28 18 13 31 21 18 26 8
Obs 80 183 223 144 103 246 167 143 207 64
***,**,*: significance levels of 1%, 5% and 10% respectively. AR(2): Second Order Autocorrelation test. OIR: Overidentifying
Restrictions test. Initial: lagged endogenous estimated coefficient. Wald: test for the joint significance of estimated coefficients. HI: High
Income. UMI: Upper Middle Income. LMI: Lower Middle Income. LI: Low Income. English: English Common-law. French: French Civil-
law. German: German Civil-law. Scan: Scandinavian Civil-law. SA: South Asia. ECA: Europe and Central Asia. EAP: East Asia and the
Pacific. MENA: Middle East and North Africa. SSA: Sub-Saharan Africa. LAC: Latin America and the Caribbean. The significance of bold
values is twofold. 1) The significance of estimated coefficients and the Wald statistics. 2) The failure to reject the null hypotheses of: a) no
autocorrelation in the AR(2) tests and; b) the validity of the instruments in the Sargan OIR test. nsa: no catch-up estimation due to issues in
degrees of freedom. Obs: Observations.
Table 4: Conditional catch-ups
Income Levels High Income (HI) Upper Middle Income (UMI) L M Income (LMI) Lower I
HI UMI LMI LI UMI LMI LI LMI LI LI
Initial 0.971*** 0.981*** 0.992*** 0.971*** 1.006*** 1.049*** 1.006*** 1.076*** 1.076*** nsa
(0.000) (0.000) (0.000) (0.000) (0.000) (0.000) (0.000) (0.000) (0.000)
Constant 0.214*** 0.143*** 0.086 0.214*** 0.073 -0.138 0.073 -0.271 -0.271 nsa
(0.000) (0.000) (0.453) (0.000) (0.525) (0.313) (0.525) (0.410) (0.410)
R& D -0.007 -0.007 -0.013 -0.007 -0.095 -0.206* -0.095 -0.308 -0.308 nsa
(0.000) (0.438) (0.258) (0.529) (0.327) (0.064) (0.327) (0.382) (0.382)
Internet 0.025 0.027 0.026 0.025 0.046 0.034 0.046 0.041 0.041 nsa
(0.216) (0.100) (0.162) (0.216) (0.245) (0.248) (0.245) (0.370) (0.370)
TSE -0.0003 -0.0008 -0.000 -0.0003 -0.002 -0.002 -0.002 0.0004 0.0004 nsa
(0.568) (0.277) (0.965) (0.568) (0.184) (0.257) (0.184) (0.901) (0.901)
Main IPL 0.002 0.001 0.0006 0.002 -0.010 -0.005 -0.010 -0.067 -0.067 nsa
(0.457) (0.622) (0.858) (0.457) (0.272) (0.658) (0.272) (0.317) (0.317)
WIPO 0.005 0.006 -0.008 0.005 0.002 -0.0005 0.002 -0.005 -0.005 nsa
(0.533) (0.381) (0.435) (0.533) (0.839) (0.963) (0.839) (0.883) (0.883)
AR(2) 0.481 -1.128 -0.422 0.481 -1.280 -1.519 -1.280 -1.044 -1.044 nsa
(0.629) (0.258) (0.672) (0.629) (0.200) (0.128) (0.200) (0.296) (0.296)
Sargan 29.839 36.240* 32.425 29.839 13.301 30.000 13.301 15.143 15.143 nsa
(0.274) (0.087) (0.179) (0.274) (0.981) (0.267) (0.981) (0.954) (0.954)
Wald 53512*** 36056*** 8310*** 53512*** 7289*** 7935*** 7289*** 2053*** 2053*** nsa
(0.000) (0.000) (0.000) (0.000) (0.000) (0.000) (0.000) (0.000) (0.000)
Countries 36 56 53 36 20 37 20 17 17
Obs 215 328 288 215 113 186 113 73 73
Legal Origins English Common Law French Civil Law(CL) German Civil Law Scan CL
English French German Scan. French German Scan. German Scan. Scan.
Initial 0.963*** 1.003*** 0.965*** 0.968*** 1.051*** 1.010*** 1.025*** 0.943*** 0.957*** nsa
(0.000) (0.000) (0.000) (0.000) (0.000) (0.000) (0.000) (0.000) (0.000)
Constant 0.180*** 0.035 0.195*** 0.182*** -0.144 -0.016 -0.093 0.341** 0.264* nsa
(0.000) (0.714) (0.000) (0.000) (0.288) (0.912) (0.508) (0.017) (0.091)
R& D -0.0081 -0.033 0.011 -0.009 -0.135 -0.031 -0.038 0.011 -0.0005 nsa
(0.390) (0.206) (0.462) (0.250) (0.160) (0.475) (0.242) (0.650) (0.980)
Internet 0.050* 0.024 0.065*** 0.043 -0.003 0.025 0.012 0.109 0.092*** nsa
(0.095) (0.234) (0.000) (0.173) (0.917) (0.336) (0.636) (0.000) (0.000)
TSE -0.0006 -0.0008 -0.001** -0.001* -0.0015 -0.001 -0.001 -0.003** -0.001 nsa
(0.377) (0.406) (0.027) (0.063) (0.327) (0.491) (0.302) (0.025) (0.183)
Main IPL -0.002 -0.002 0.0008 -0.0008 0.006 -0.004 -0.002 0.001 0.003 nsa
(0.200) (0.493) (0.743) (0.634) (0.766) (0.637) (0.825) (0.894) (0.469)
WIPO T 0.020 0.007 -0.001 0.019 0.007 0.005 0.012 -0.010 -0.015 nsa
(0.106) (0.515) (0.852) (0.168) (0.633) (0.721) (0.355) (0.387) (0.283)
AR(2) -0.851 -1.269 -1.017 -0.860 -1.234 -1.401 -1.270 -0.794 -0.819 nsa
(0.394) (0.204) (0.309) (0.389) (0.217) (0.161) (0.203) (0.426) (0.412)
Sargan 11.416 39.267** 26.448 16.267 29.310 40.846** 32.737 10.096 11.291 nsa
(0.994) (0.046) (0.438) (0.929) (0.297) (0.032) (0.169) (0.997) (0.994)
Wald 148953*** 11508*** 93913*** 87536*** 9289*** 5744*** 5910*** 11919*** 9559*** nsa
(0.000) (0.000) (0.000) (0.000) (0.000) (0.000) (0.000) (0.000) (0.000)
Countries 16 54 31 20 38 53 42 15 15
Obs 87 284 178 113 197 288 223 91 117

18
Regions South Asia (SA) Europe and Central Asia (ECA)
SA ECA EAP MENA LAC SSA ECA EAP MENA LAC SSA
Initial nsa 0.96*** 1.310* 1.073*** 1.05*** nsa 0.97*** 0.97*** 0.97*** 0.99*** 0.978*** (0.000) (0.080) (0.000) (0.000) (0.000) (0.000) (0.000) (0.000) (0.000)
Constant nsa 0.144 -2.074 -0.488 -0.174 nsa 0.123* 0.134** 0.144 0.020 0.103
(0.064) (0.700) (0.683) (0.628) (0.095) (0.049) (0.181) (0.837) (0.129)
R& D nsa 0.014 -0.434 -0.086 -0.258 nsa 0.009 0.0006 0.006 -0.015 0.007
(0.433) (0.629) (0.608) (0.511) (0.600) (0.972) (0.733) (0.549) (0.666)
Internet nsa 0.07*** 0.079 0.025 -0.003 nsa 0.05** 0.06*** 0.045* 0.033 0.054**
(0.000) (0.172) (0.671) (0.935) (0.000) (0.010 (0.063) (0.160) (0.012)
TSE nsa -0.001** 0.005 0.002 0.004 nsa -0.001 -0.001 -0.0009 -0.0008 -0.001*
(0.028) (0.701) (0.768) (0.490) (0.112) (0.167) (0.347) (0.381) (0.085)
Main IPL nsa 0.005 -0.004 --- 0.002 nsa 0.005 0.0006 0.007 -0.001 0.005
(0.314) (0.857) (0.960) (0.233) (0.833) (0.164) (0.894) (0.269)
WIPO T nsa 0.001 -0.125 --- -0.015 nsa 0.002 0.0009 0.002 0.002 0.001
(0.849) (0.505) (0.525) (0.777) (0.934) (0.814) (0.848) (0.852)
AR(2) nsa -0.563 0.050 -0.551 -0.982 nsa -0.624 -0.675 -0.763 -0.934 -1.179
(0.573) (0.959) (0.581) (0.326) (0.532) (0.499) (0.445) (0.350) (0.238)
Sargan nsa 31.745 8.254 5.524 9.969 nsa 29.152 33.941 32.869 37.92* 28.833
(0.201) (0.999) (1.000) (0.998) (0.304) (0.136) (0.165) (0.061) (0.318)
Wald nsa 14678*** 432.9*** 3872*** 5691*** nsa 17657*** 19742*** 7057*** 10520*** 20742***
(0.000) (0.000) (0.000) (0.000) (0.000) (0.000) (0.000) (0.000) (0.000) Countries 41 9 9 17 39 46 46 54 40
Obs 249 50 41 75 239 279 270 304 244
East Asia and the Pacific (EAP) Middle East & North Africa LAC SSA
EAP MENA LAC SSA MENA LAC SSA LAC SSA SSA
Initial 1.214*** 1.041*** 1.094*** 1.024*** -0.032 1.086*** 0.350 1.086*** 1.058*** nsa
(0.000) (0.000) (0.000) (0.000) (0.984) (0.000) (0.252) (0.000) (0.000)
Constant -1.372 -0.051 -0.303 -0.073 4.187 -0.188 3.152** -0.152 0.007 nsa
(0.593) (0.869) (0.368) (0.924) (0.601) (0.481) (0.044) (0.612) (0.976)
R& D -0.467 -0.054 -0.202* -0.097 0.222 -0.099 0.209 -0.398 -0.270 nsa
(0.587) (0.185) (0.097) (0.684) (0.737) (0.141) (0.254) (0.340) (0.201)
Internet 0.071* 0.009 -0.017 0.053** 0.736 -0.065 -0.011 -0.039 -0.012 nsa
(0.076) (0.801) (0.674) (0.049) (0.715) (0.243) (0.908) (0.556) (0.834)
TSE 0.0008 -0.0001 0.0002 --- -0.052 0.001 0.034** 0.002 0.001 nsa
(0.918) (0.955) (0.934) (0.783) (0.811) (0.022) (0.642) (0.831)
Main IPL --- -0.009 -0.006 -0.014 -0.871 0.002 0.028 0.008 0.003 nsa
(0.273) (0.549) (0.151) (0.602) (0.956) (0.842) (0.819) (0.933)
WIPO T --- -0.023 -0.003 0.003 1.619 -0.004 -0.076 -0.024 -0.028* nsa
(0.509) (0.911) (0.954) (0.134) (0.873) (0.659) (0.327) (0.094)
AR(2) -0.768 -0.752 -1.265 -1.010 -0.092 -0.967 -0.157 -1.231 -1.199 nsa
(0.442) (0.451) (0.205) (0.312) (0.926) (0.333) (0.874) (0.218) (0.230)
Sargan 5.718 11.777 18.67 9.945 0.000 17.675 0.368 7.595 10.421 nsa
(0.999) (0.992) (0.850) (0.998) (1.000) (0.887) (1.000) (0.999) (0.997)
Wald 441.25*** 3180*** 4759*** 5727*** 3252*** 6348*** 8674*** 1434*** 3247*** nsa
(0.000) (0.000) (0.000) (0.000) (0.000) (0.000) (0.000) (0.000) (0.000)
Countries 7 14 22 11 7 22 8 15 16
Obs 40 71 105 63 31 96 36 65 70
***,**,*: significance levels of 1%, 5% and 10% respectively. AR(2): Second Order Autocorrelation test. OIR: Overidentifying
Restrictions test. Initial: lagged endogenous estimated coefficient. Wald: test for the joint significance of estimated coefficients. HI: High
Income. UMI: Upper Middle Income. LMI: Lower Middle Income. LI: Low Income. English: English Common-law. French: French Civil-
law. German: German Civil-law. Scan: Scandinavian Civil-law. SA: South Asia. ECA: Europe and Central Asia. EAP: East Asia and the
Pacific. MENA: Middle East and North Africa. SSA: Sub-Saharan Africa. LAC: Latin America and the Caribbean. R & D: Research and
Development expenditure. TSE: Tertiary School Enrolment. IPL: Intellectual Property Law. WIPO T: World Intellectual Property
Organization Treaties. The significance of bold values is twofold. 1) The significance of estimated coefficients and the Wald statistics. 2)
The failure to reject the null hypotheses of: a) no autocorrelation in the AR(2) tests and; b) the validity of the instruments in the Sargan OIR
test. nsa: no catch-up estimation due to issues in degrees of freedom. Obs: Observations.
4.2 Discussion of results
Before diving into the discussion of results, it is important to understand the economic
intuition motivating absolute and conditional catch-ups in scientific publications. Absolute
catch-up in publications takes place when countries share similar fundamental characteristics

19
with regard to factors governing scientific publications such that, only variations across
countries in initial levels of publications exist. Absolute catch-up therefore results from
factors such as: the formulation of laws protecting scientific IPRs within a legal system;
wealth-effects (or income-levels) expressing how the prosperity of nations influences their
orientation towards research for more development; regional proximity, since cross-regional
differences determine scientific activity (Morrison et al., 2009); among others. Absolute
catch-up also occurs because of adjustments common to the fundamental characteristics of
scientific publications. Hence based on intuition, differences in initial conditions may
significantly affect the absolute catchi-up processes due to the following. Firstly, the
beginning of the catch-up process has a precondition: a certain level of scientific internal
development which may significantlty differ across countries within the same homogenous
panel; (2) the diffusion of legal cultures transmitted by colonial powers over time through
regionalization and globalization such that, the legal origin fundamental holds less ground; (3)
high growth low-income countries allocating significantly more budget to scientific activities
than some of their middle-income counterparts and; (4) non-uniformity of scientific
publications within a country as well as variations from city to city, industry to industry and,
demography to demography. Hence, the overwhelming absence of absolute catch-up in the
findings is traceable to the above factors.
On the other hand, conditional catch-up is that which depends on structural
characteristics that determine scientific publications. It depicts the type of catch-up whereby,
one’s own long-term steady state (equilibrium) is contingent on structural characteristics of
the economy. Hence, within a fundamental characteristic (say Low-income countries), cross-
country differences in factors that explain scientific publications could facilitate conditional
convergence. Accordingly, in our models conditional convergence has been contingent on
characteristics that determined scientific publications, notably: R&D expenditure, internet

20
penetration, tertiary school enrolment and, IPRs laws. Therefore the findings are contingent
on the variables we choose and empirically test. Unfortunately, owing to constraints in
degrees of freedom, we have not been able to employ more than five components of the
conditional information set in modeling the fundamental characteristics. This is not much of a
concern because as far as we have reviewed, some models in the literature are not conditioned
beyond two macroeconomic control variables (Bruno et al., 2012).
Our results have shown overwhelmingly absence of absolute catch-up in the processes.
While we have already discussed possible reasons for the outcome in the first paragraph of
this section, it is interesting to discuss the findings in relation to the traditional catch-up
processes in per capita income. The role of science in the periphery may not fit the classical
catch-up per capita income model because the interplay between science and technology at
the periphery indicates that from the beginning of the catch-up process, investment should be
made in scientific infrastructure. Accordingly, as a focusing device, the scientific
infrastructure could spot the avenues of technological development that are feasible to the
country, given the international and national conditions. Owing to the wasteful nature of
‘blind research’, this is very relevant in less developed countries with huge resource scarcity.
This view is consistent with the position of Albuquerque (2000) who strongly thinks that,
given the scarce resources for scientific activities, catch-up countries might concentrate their
scientific development in key disciplines, especially in scientific fields that are sources of
industrial development and that have high impact upon industrial firms. Hence, the
distribution of scientific activities before and during catch-up processes might be more
concentrated than in other stages of development.

21
4.3 Policy implications
4.3.1 Encouraging indigenous scientific research and fighting brain drain
Though there is consensus that local-focused research is necessary to build national
absorptive capacity and support indigenous capabilities, it will be interesting to require the
locally tailored research to be of publishable scientific standard. This would facilitate
publication and hence, the catch-up process. Moreover, external peer-review should provide
some checks on the scientific rigor and thus, validate the soundness of local-focused policy
implications. In the same vein, incentives should be provided to researchers from developing
countries to be more involved in the contribution to scientific knowledge, especially on that
directly targeting the development of these countries. For instance, Wantchékon (2013) has
postulated that, of the 258 impact evaluation studies in 2004, only 11% included African
authors. He has further stressed that since 2004, only 7% of the 401 African related
publications in the Journal of Development Economics are co-authored by Africans.
If observations on scientific publications used in this study were to be based on
authors’ region/country/continent of origin, the dynamics of the results might have changed in
favor of catch-up evidences. Unfortunately, it is hard to verify this hypothesis because of
brain drain. Most scientists are fleeing developing countries in search for greener pastures and
better working conditions abroad. A great proportion of students from poor countries trained
abroad in fields that lead to scientific publications never return after obtaining their diplomas.
We propose the following measures in the fight against brain drain.
Firstly, we present some recommendations for source-countries: improve job security
and researcher planning by easing re-entry for researchers seeking temporary employment
abroad; improve registration, examination and deployment procedures for foreign-trained
researchers; ensure the training curricula meet local needs and develop mid-level researchers
capable of meeting local needs and less likely to migrate; ameliorate retention incentives in

22
academic institutions by providing benefits (extra pay for instance), better management and
career paths; decrease political factors that determined academic promotions and; increase
public-good contribution from the Diaspora through tax incentives.
Secondly, recommendations for receiving countries include: creation of bilateral
agreements to regulate the recruiting process, ensure that the cost of migration are borne by
the receiving and not the source country and take measures to improve country-of-origin
development contribution of the Diaspora; adoption and enforcement of ethical codes of
conduct in the recruitment of imported researchers; improve self-sufficiency in researchers
through increased training and better use of existing researchers; increased contributions to
educational systems of source countries through guaranteed salaries for remaining researchers
and sustained targeting of educational aid; bilateral agreements creating new tax measures
through which public-good remittance can improve financing of educational training systems;
and improve ‘return’ or two-way human resources flows through time-limited visas or
guaranteed return privileges for emigrants returning home after service-leaves7.
Thirdly, recommendations for regional and international institutions include: ensure
the monitoring of human rights and political instability factors pushing researchers to
emigrate; support for global research workforce alliances that seek to identify and resolve
issues surrounding researcher professional migration; re-examine macroeconomic conditions
that may impede local-focused research in developing countries and; develop cross-border
public research agreements.
4.3.2 Support for regional research and innovation
The absence of absolute catch-up in ‘technical and scientific journals’ means
fundamental characteristics enabling countries with lower levels of publications to catch-up
7 Equality in the two-way staff flow will ensure the source countries do not experience a loss of staff and at the
same time would benefit from new knowledge brought by research professionals from recipient countries. This
will minimize the negative externalities of professionals’ flows from source to receiving countries.

23
with their counterparts of higher levels are dissimilar. Hence, there should be encouragement
and validation activities targeting local and regional initiatives to promote development of
new innovating businesses and ‘transfer and exchange’ of best practices as well as the
establishment of an environment more conducive to innovation. The focus should preferably
be on: trans-regional cooperation to facilitate the development of research and innovation;
strategies and initiation of programs involving local actors and corresponding activities should
be developed in close coordination with inclusive regional policies and; particular attention
should be focused on the participation of sampled countries’ regions, notably in relation to the
transfer of schemes that have been successful at local and national levels.
The development of research and innovation strategies, as well as inter-regional
technology transfer could greatly benefit less developed countries. This should include,
supporting the development of regional scientific infrastructure. Thus, specific attention
should be paid to the development and valorization of new scientific infrastructure in the
regions, in collaboration and synergy with activities of the regional investment banks (funds).
The example of the European Union has shown that modern scientific infrastructure is a key
enabler of regional economic development. For researchers within the regions to be able to
cooperate under state-of-the-art conditions with their counterparts in advanced regions as well
as with the rest of the world, much needs to be considered (for instance, technical and
scientific parks for efficient cooperation and clustering between academia and industry, or
high-speed electronic networks and related facilities as a key gateway to the information
economy). A good example is the broadband electronic interconnection backbone that could
link various regional electronic research and education networks.
As far as the context of research training networks and knowledge transfer is
concerned, fellowships could be developed to target more and better scientific and technical
human resources. Hence, more opportunities should be offered to researchers originating

24
from less favored countries. This will ease the catch-up processes. Special attention should
also be devoted to the number of factors affecting socioeconomic conditions of researchers,
notably linguistic balance, gender equity and career structure. Ultimately, in view of further
reinforcing the human potential for research in regions, human resource and mobility actions
should target the best and most promising researchers from undeveloped countries, promote
the training of regional researchers abroad and stimulate the return of scientists established
outside, especially state-funded researchers who have a patriotic duty towards nation building
after receiving tax payers funds.
Last but not the least, improving communication between experts and policymakers by
supporting the establishment of joint work and communication platforms between them at the
regional level. Clear statistical indicators: able to describe the structure, characteristics and
performance of knowledge-based economy should be developed at national and regional
levels.
4.4 Caveats and future research directions
Two main caveats have been retained: draw-backs in the methodology and, doubts
about the ‘legal origin and property rights theory’ on which one of the fundamental
characteristics is based. Firstly, as already discussed in Section 3.2, the choice of the catch-up
approach (which is constrained by the data structure) has some drawbacks. Consistent with
Apergis et al. (2010), critics of β-convergence argue that if countries converge to a common
equilibrium with identical internal structures, then the dispersion of the variable under
consideration should disappear in the long-run as all countries converge to the same long-run
path. More so, if countries converge to ‘convergence clubs’ or to their own unique
equilibrium, the dispersion of this measure will not approach zero (Miller & Upadhyay,
2002). Accordingly, in the latter case of country-specific equilibrium, the movements of the
dispersion will be contingent on the initial distribution of the variable under investigation with

25
regard to their final long-run outcomes. Secondly, in accordance with Asongu (2012b) some
doubts have been documented about the ‘law and property rights theory’ which postulates that
British common-law supports innovative development to a greater extend than civil-law
systems. However, this drawback does not pose much of an issue because of the plethora of
catch-up panels employed.
In light of the above, it will be interesting to use the alternative approach of
convergence to assess catch-up processes in scientific publications. Another future research
direction could be to replicate the analysis in the context of innovations with the growth rates
in patents and trademark applications as dependent variables.
5. Conclusion
This seminal paper has provided global empirical evidence on catch-up processes in
scientific and technical publications. Its purpose has been to model the future of scientific
knowledge monopoly in order to understand whether the impressive growth experienced by
latecomers in the industry has been accompanied by a similar catch-up in scientific
capabilities and knowledge contribution. The empirical evidence is based on 41 catch-up
panels which together consist of 99 countries. The richness of the dataset has allowed us to
disaggregate countries into fundamental characteristics based on income-levels (high-income,
lower-middle-income, upper-middle-income and low-income), legal-origins (English
common-law, French civil-law, German civil-law and, Scandinavian civil-law) and, regional
proximity (South Asia, Europe & Central Asia, East Asia & the Pacific, Middle East & North
Africa, Latin America & the Caribbean and, Sub-Saharan Africa). Three main issues have
been investigated: the presence or not of catch-up processes, the speed of the catch-up
processes and, the time needed for full (100%) catch-up. The findings which are based on
absolute and conditional catch-up patterns broadly show that advanced countries will continue
to dominate in scientific knowledge contribution. Policy implications have been discussed.

26
Appendices
Appendix 1: Summary statistics and presentation of countries Panel A: Summary statistics
Variables Mean S.D Min. Max. Obs
Dependent
Variable
Scientific and Technical Journal Articles (STJA) 6.312 2.471 -0.051 12.261 851
Control
Variables
Research & Development (R & D) 1.050 0.955 0.000 4.811 481
Internet Penetration 20.409 24.219 0.000 93.887 840
Tertiary School Enrolment (TSE) 37.879 21.798 0.000 94.577 703
Main Intellectual Property Rights Law (Main IPL) 2.081 2.518 0.000 20.000 882
WIPO Treaties (WIPO T) 3.396 1.849 0.000 7.000 882
Fundamental
Characteristics
High Income (HI) 0.438 0.496 0.000 1.000 882
Upper Middle Income (UMI) 0.295 0.456 0.000 1.000 882
Lower Middle Income (LMI) 0.243 0.429 0.000 1.000 882
Low Income (LI) 0.020 0.141 0.000 1.000 882
English Common Law (English) 0.275 0.447 0.000 1.000 882
French Civil Law (French) 0.509 0.500 0.000 1.000 882
German Civil Law (German) 0.173 0.378 0.000 1.000 882
Scandinavian Civil Law (Scandi) 0.040 0.197 0.000 1.000 882
South Asia (SA) 0.030 0.172 0.000 1.000 882
Europe and Central Asia (ECA) 0.438 0.496 0.000 1.000 882
East Asia and the Pacific (EAP) 0.102 0.302 0.000 1.000 882
Middle East and North Africa (MENA) 0.132 0.339 0.000 1.000 882
Sub-Saharan Africa (SSA) 0.081 0.273 0.000 1.000 882
Latin America and the Caribbean (LAC) 0.192 0.394 0.000 1.000 882
Panel B: Presentation of countries
Albania, Algeria, Argentina, Armenia, Australia, Austria, Azerbaijan, Bahrain, Belgium, Bolivia, Bosnia, Botswana,
Brazil, Bulgaria, Cameroon, Canada, Chile, China, Colombia, Costa Rica, Croatia, Cyprus, Czech Republic,
Denmark, Dominican Republic, Ecuador, Egypt, El Salvador, Estonia, Finland, France, Germany, Greece,
Guatemala, Honduras, Hong Kong, Hungary, Iceland, India, Indonesia, Ireland, Israel, Italy, Japan, Jordan,
Kazakhstan, Kenya, Kuwait, Latvia, Lebanon, Lithuania, Luxembourg, Macedonia, Malaysia, Malta, Mauritius,
Mexico, Moldova, Montenegro, Morocco, Netherlands, New Zealand, Nicaragua, Nigeria, Norway, Oman, Pakistan,
Panama, Paraguay, Peru, Philippines, Poland, Portugal, Puerto Rico, Qatar, Romania, Russia, Saudi Arabia,
Senegal, Serbia, Singapore, Slovakia, Slovenia, South Africa, South Korea, Spain, Sweden, Switzerland, Thailand,
Tunisia, Turkey, Ukraine, UAE, United Kingdom, United States, Uruguay, Venezuela, Vietnam, Zambia.
S.D: Standard Deviation. Min: Minimum. Max: Maximum. ICT: Information and Communication Technology. Scandi: Scandinavian. Obs:
Observations. WIPO: World Intellectual Property Organization.
Appendix 2: Correlation analysis
R& D Internet TSE Main IPL WIPO T. STJA
1.000 0.436 0.566 0.200 0.068 0.631 R&D
1.000 0.506 0.351 0.335 0.631 Internet
1.000 0.394 0.355 0.576 TSE
1.000 0.328 0.349 Main IPL
1.000 0.181 WIPO T.
1.000 STJA
R&D: Research & Development. Internet: Internet Penetration. TSE: Tertiary School Enrolment. Main IPL: Main Intellectual Property Law.
WIPO T. World Intellectual Property Organization Treaties. STJA: Scientific and Technical Journal Articles.

27
Appendix 3: Variable definitions Variables Signs Variable definitions (Measurement) Sources
Journal Articles STJA Logarithm of number of Scientific and Technical Journal
Articles
World Bank (WDI)
Research and
Development
R & D Research and Development Expenditure (% of GDP) World Bank (WDI)
Internet Penetration Internet Logarithm of Internet Users per 1000 GMID
Literacy TSE Tertiary School Enrolment (% of Gross) GMID
IPRs Law Main IPL Main Intellectual Property Law WIPO
WIPO Treaties WIIPO T World Intellectual Property Organization WIPO
WDI: World Bank Development Indicators. GMID: Global Market Information Database.. Log: Logarithm. WIPO: World Intellectual Property
Organization. IPRs: Intellectual Property Rights.
References
Agbor, J. A., (2011). “How Does Colonial Origin Matter for Economic Performance in
Sub-Saharan Africa”, World Institute for Development Economics Research, Working
Paper, No. 2011/27.
Albuquerque, E. M., (2000). “Scientific Infrastructure and Catching-up Process: Notes about
a Relationship Illustrated by Science and Technology Statistics”, The Latin American and
Caribbean Economic Association.
Amavilah, V. H. S., (2009). “Knowledge of African countries: production and value of
doctoral dissertations”, Applied Economics, 41 (8), pp. 977-989.
Andrés, A. R., & Asongu, S. A., (2013). “Global dynamic timelines for IPRs harmonization
against software piracy”, Economics Bulletin, 33(1), pp. 874-880.
Apergis, N., Christou, C., & Miller, S. M., (2010). “Country and Industry Convergence in
Equity Markets: International Evidence from Club Convergence and Clustering”, Department
of Banking and Financial Management, University of Piraeus, Greece.
Arellano, M., & Bond, S., (1991). “Some tests of specification for panel data: Monte Carlo
evidence and an application to employment equations”, The Review of Economic Studies, 58,
pp. 277-297.

28
Arellano, M., & Bover, O., (1995). “Another look at the instrumental variable estimation of
error-components models”, Journal of Econometrics, 68, pp. 29-52.
Asongu, S. A., (2013a). “Modeling the future of Knowledge Economy: Modeling the future
of knowledge economy: evidence from SSA and MENA countries”, Economics Bulletin,
33(1), pp. 612-624.
Asongu, S. A., (2013b). “The ‘Knowledge Economy’-finance nexus: how do IPRs matter in
SSA and MENA countries?”, Economics Bulletin, 33(1), pp. 78-94.
Asongu, S. A., (2013c). “Real and monetary policy convergence: EMU crisis to the CFA
zone”, Journal of Financial Economic Policy, 5(1), pp. 20-38.
Asongu, S. A., (2012a). “Harmonizing IPRs on Software Piracy: Empirics of Trajectories in
Africa”, Journal of Business Ethics, http://link.springer.com/article/10.1007%2Fs10551-012-
1552-7
Asongu, S. A., (2012b). “Fighting software piracy in Africa: how do legal origins and IPRs
protection channels matter?” Journal of the Knowledge Economy: Forthcoming.
http://link.springer.com/article/10.1007/s13132-012-0137-0
Balconi, M., Brusoni, S., & Orsenigo, L., (2010). “In Defense of the Linear Model: An
Essay”, Research Policy, 39(1), pp. 1-13.
Barro, R. J., & Sala-i-Martin, X., (1992). “Convergence”, Journal of Political Economy, 100,
pp. 223-251.
Barro, R. J., & Sala-i-Martin, X., (1995). Economic Growth. The MIT Press, Cambridge, MA.
Baumol, W. J., (1986). “Productivity, growth, convergence and welfare: what the long run
data show”, American Economic Review, 76, pp. 1072-1085.
Blundell, R., & Bond, S., (1998). “Initial conditions and moment restrictions in dynamic
panel data models”, Journal of Econometrics, 87(1), pp. 115-143.
Bond, S., Hoeffler, A., & Tample, J., (2001). “GMM Estimation of Empirical Growth
Models”, University of Oxford.
29
Bruno, G., De Bonis, R., & Silvestrini, A., (2012). “Do financial systems converge? New
evidence from financial assets in OECD countries”, Journal of Comparative Economics,
40(1), pp. 141-155.
Chandra, D. S., & Yokoyama, K., (2011). “The role of good governance in the knowledge-
based economic growth of East Asia – A study on Japan, Newly Industrialized Economies,
Malaysia and China”, Graduate School of Economics, Kyushu University.
D’Este, P., & Patel, P., (2007). “University-Industry Linkages in the UK: What are the factors
underlying the variety of interactions with industry?”, Research Policy, 36(9), pp. 1295-1313.
Esler, S. L., & Nelson, M. L., (1998). “Evolution of Scientific and Technical Information
Distribution”, Journal of the American Society of Information Science, 49(1), pp. 82-91.
Fung, M. K., (2009). “Financial development and economic growth: convergence or
divergence?”, Journal of International Money and Finance, 28, pp. 56-67.
Islam, N., (1995). “Growth Empirics: A Panel Data Approach”, The Quarterly Journal of
Economics, 110, (4), pp. 1127-1170.
Kim, L., & Nelson, R., (2000). “Technology, Learning and Innovation: Experiences of Newly
Industrializing Economies”, Cambridge University Press.
La Porta, R., Lopez-de-Silanes, F., Shleifer, A., & Vishny, R. W., (1998). “Law and finance”,
Journal of Political Economy, 106, pp. 1113-1155.
Mankiw, N. G., Romer, D., & Weil, D. N., (1992). “A contribution to the empirics of
economic growth”, Quarterly Journal of Economics, 107, pp. 407–437.
Mazzoleni, R., (2008). “Catching Up and Academic Institutions: A Comparative Study of
Past National Expericences”, The Journal of Development Studies, 44(5), pp. 678-700.
Mazzoleni, R., & Nelson, R., (2007). “Public research institutions and economic catch-up”,
Research Policy, 36(10), pp. 1512-1528.
Miller, S. M., & Upadhyay, M. P., (2002). “Total factor productivity and the convergence
hypothesis”, Journal of Macroeconomics 24, 267-286.

30
Morrison, A., Cassi, I., & Rabellotti, R., (2009). “Catching-up countries and the geography of
science in the wine industry”, Copenhagen Business School, 2009 Summer Conference.
Mowery, D. C., & Sampat, B. N., (2005). “Universities and Innovation”, The Oxford
Handbook on Innovation Ed. Fagerberg, J. Mowery, D., and Nelson, R., Oxford University
Press.
Murray, F., & Stern, S., (2005). “Do Formal Intellectual Property Rights Hinder the Free
Flow of Scientific Knowledge? An Empirical Test of the Anti-Commons Hypothesis”, NBER
Working Paper No. 11465.
Narayan, P. K., Mishra, S., & Narayan, S., (2011). “Do market capitalization and stocks
traded converge? New global evidence”, Journal of Banking and Finance, 35(10), pp. 2771-
2781.
Wantchékon, L., (2013). African School of Economics Academic Project. Princeton
University (USA) & IERPE (Benin).
Weber, A. S., (2011). “The role of education in knowledge economies in developing
countries”, Procedia Social and Behavioral Sciences, 15, pp. 2589-2594.
World Bank (2007). Building Knowledge Economies. Advanced Strategies for Development.
World Bank Institute Development Studies. Washington DC.