Embed Size (px)
Citation preview

1
AsiaRealizing our potentialAnil Wadhwani, President and CEO, Manulife Asia
June 29, 2021

Agenda
2
• Overview of Manulife’s Asia business
• Strong track record of execution
• Our strategic focus
– Grow and digitize agency
– Deepen penetration in exclusive bancassurance
partnerships
– Accelerate China and South-East Asia
• Showcase of Hong Kong

Key Messages
3
• We are the fastest growing of the Top 3 pan-Asian life insurers
• Asia is a primary growth engine for Manulife
• Our key strength is the diversified nature of our markets, distribution channels,
and products
• Growing and digitizing agency, deepening bancassurance penetration, and
accelerating China and South-East Asia represent our biggest opportunity to grow
value and earnings
• Track record of consistent growth on our value metrics

Overview of Manulife’sAsia business
4

China
Malaysia
Taiwan
Indonesia
Cambodia
Hong Kong
Philippines
Singapore
Vietnam
Japan
MyanmarIndia
Manulife is a pan-Asian leader with
deep roots and a bright future
5
120
100
years in Asia
Over
employees2
customers bank partners,
10 exclusive3
Over
12.5M
19KOver
13markets1
strong agency force
Over
115K
Note: Figures are as of December 31, 2020.1 Hong Kong includes Macau; India and Taiwan: Manulife Investment Management business only; Cambodia and Myanmar: Insurance business only. 2 Includes 7K employees from global shared services centres. 3 Exclusive bancassurance partnership with VietinBank is pending regulatory approval.

Our diverse geographic footprint and distribution channels
generate quality business
6Note: Figures are for full year 2020, unless otherwise stated. APE sales is a Non-GAAP measure. See slide entitled “Performance and Non-GAAP Measures” in 2021 Investor Day Legal Slides. 1 13th month policy persistency.
Asia Insurance geographic mix Distribution mix
Product mix with focus on Health
and Protection
High persistency ratio1 High regular premium mix ratio
Diversified
Quality
Vietnam 12%
Hong Kong 27%
China 14%
Japan 21%
Singapore 17%
Other Emerging Markets 9%
Agency 53%
Other 21%
Bancassurance 26%
Par and adjustable 38%
Health and protection 35%
Non-par savings 11%
Investment-linked 16%
Persistency ratio 93% Regular 83%
Single 17%
APE
Sales
APE
Sales
APE
Sales
APE
Sales

Our diversified distribution, digitally enabled solutions,
and unique asset management capabilities
underpin our right to win
7
Right to win
• Customer-centric, digital leader: Simplified, digitized customer journeys supported by high-impact digital assets and strategic
partnerships have delivered an improvement of >20 points in relationship net promoter score since 2017
• Diversified distribution: Leading professional agents stand at >115K complemented by >100 bancassurance partnerships,
of which 10 are exclusive1
• Product and ecosystem differentiation: A comprehensive suite of products supported by ManulifeMOVE, our differentiated
behavioural ecosystem, and strategic partners including HaoDF, 111 Inc.’s online pharmacy and Dacadoo
• Manulife Investment Management: Unique asset management capabilities combined with our insurance distribution is key to our
leading market position in pension and investment-linked product offerings
• Execution culture: Proven track record of growing core earnings throughout different economic cycles is supported by diverse,
top-tier talent, our winning mindset, and strong execution culture
Note: Figures are as of December 31, 2020 unless otherwise stated.1 Exclusive bancassurance partnership with VietinBank is pending regulatory approval.

Strong track recordof execution
8

9
We have a proven model to drive growth and value across our diverse markets
Note: APE sales and new business value are Non-GAAP measures. See slide entitled “Performance and Non-GAAP Measures” in 2021 Investor Day Legal Slides.1 New business value.
NBV1
>US$100m
APE Sales >US$100m
Hong Kong Japan Indonesia
2014 2016 2019-2020
VietnamSingapore PhilippinesChina
Hong Kong
Hong Kong Japan Indonesia Hong Kong Japan Indonesia
Hong Kong Japan Hong Kong Japan
VietnamSingaporeChina
VietnamSingapore PhilippinesChina

The fundamentals of our business
have never been stronger…
10
NBV Margin
(%)
Core Earnings
(US$ millions)
New Business Value
(US$ millions)
APE Sales
(US$ millions)
997
1,5111,576
2016 2019 2020
+15% CAGR
Note: Percentage changes for core earnings, new business value, and APE sales are stated on a constant exchange rate basis. Core earnings, new business value, new business value margin, APE sales, and constant exchange rate basis are Non-
GAAP measures. See slide entitled “Performance and Non-GAAP Measures” in 2021 Investor Day Legal Slides.
754
1,202
1,037
2016 2019 2020
+17% CAGR
32
40 39
20192016 2020
+8 pps
2,498
3,224
2,892
20202016 2019
+9% CAGR
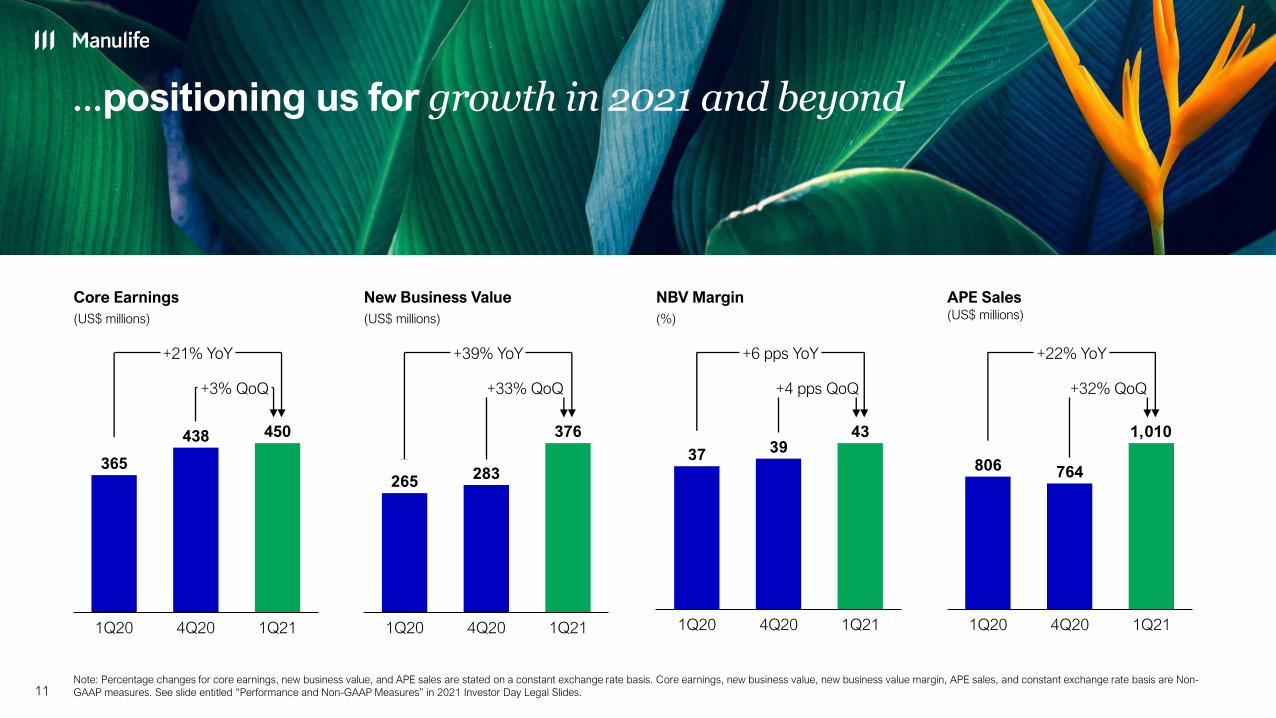
...positioning us for growth in 2021 and beyond
11
NBV Margin
(%)
Core Earnings
(US$ millions)
New Business Value
(US$ millions)
APE Sales(US$ millions)
365
438 450
4Q201Q20 1Q21
+21% YoY
+3% QoQ
265283
376
1Q20 4Q20 1Q21
+39% YoY
+33% QoQ
3739
43
1Q20 4Q20 1Q21
+6 pps YoY
+4 pps QoQ
806 764
1,010
1Q20 1Q214Q20
+22% YoY
+32% QoQ
Note: Percentage changes for core earnings, new business value, and APE sales are stated on a constant exchange rate basis. Core earnings, new business value, new business value margin, APE sales, and constant exchange rate basis are Non-
GAAP measures. See slide entitled “Performance and Non-GAAP Measures” in 2021 Investor Day Legal Slides.

Manulife Asia emerged from 2020 in a stronger position,
with increased market share in 6 markets
12Note: Data for full year 2020. For Manulife, new business sales is the same as APE sales. Source: Local regulators, competitors’ website, insurance association and informal (industry exchange) market share. 1 Mandatory Provident Fund. MPF market
share is measured by share of assets under management and estimated net cash flows by scheme sponsor. 2 China pertains to agency business (foreign insurers only).
Total New Business Sales Rank YoY Market Share
Japan #11
Indonesia #7
Philippines #5
Malaysia #8
Total New Business Sales Rank YoY Market Share
Hong Kong
Hong Kong MPF1
#6
#1
China2 #2
Singapore #3
Vietnam #1
Cambodia #1
▲
▼ ▼
▼
▲
▲
▲
▲
▲
▲

13 Note: Ranking based on new business sales. For Manulife, new business sales refers to APE sales. Data based on publicly available information and sourced from local regulators and competitors’ websites.
Manulife is a leading pan-Asian life insurer
Pan-Asian Life Insurers, 2020 New Business Sales(US$ billions)
6
4
3
1
2
5
7
Peer H Peer FPeer I Peer G Peer E Peer D Peer C Manulife Peer B Peer A

Our strategic focus14

Trends in Asia are fueling a significant opportunity
15
1 Source: Brookings, the unprecedented expansion of the global middle class (2017). 2 Source: Allianz insurance report 2020. Asia excludes Japan. 3 Source: Swiss Re Institute, Sigma 04/2020: Closing Asia’s mortality protection gap (July 2020).4 Source: Swiss Re Institute, World insurance: riding out the 2020 pandemic storm. 5 Based on 2020 APE sales levels, assuming market growth to 2025 based on GDP forecasts (Source: IMF, World Economic Outlook, April 2021), and penetration rate
increasing to 3%.
There is a growing mortality
protection gap in Asia-Pacific3
(US$ trillions) (US$ billions)
The Asia middle class is
growing rapidly…
(Billions in Asia-Pacific1 middle class)
Insurance penetration rates are
very low in many of our markets4
(Life premiums as % of GDP, 2019)
77
119
Mortality
Protection Gap
55%
2019 2030F
224
350
Additional annual
life insurance
premiums if gap
is closed
56% 1.21.41.42.3
3.46.06.7
18.3
Singapore
Philippines
Malaysia
Indonesia
Japan
Vietnam
China
Hong Kong
2.0
3.5
2020 2030
73%
8.1
3.2
Asia
North America
…driving high expected growth
of gross written premiums
(%, 2020-2030 expected gross written
premium CAGR2)
In a scenario where insurance penetration rates increase to 3% in China, Vietnam, Indonesia and the Philippines by 2025, the estimated
impact would be an incremental ~US$1 billion in annual APE sales based on forecasted GDP growth and our current market share5

Our strategy is focused and designed to accelerate growth in shareholder value
16
Value Drivers
Grow and digitize agencyHighly productive and professional digitally-enabled agency force with a flexible
agency model to adapt to local market opportunities
Grow and maximize potential
with bancassurance partnersDeepen penetration in exclusive bancassurance partners
Accelerate China and South-East Asia Increasing scale in the fastest growing economies in Asia
Leverage Manulife Investment
Management
Unique asset management capabilities combined with our insurance distribution is key to our leading market position in pension and investment-linked product offerings
Digital, customer leader High performing team
Enabled by…

17
High performing agency platform – Top 3 ranking in 6 markets1
with a significant opportunity to enhance value through
industry leading training and digitization
Accelerate growth in headcount and active
agents enabled by:
• Training and activating agents through
our newly launched industry leading
Manulife Business Academy
• Increasing productivity and performance
management with end-to-end digital
agency journey
• Data driven insights and lead generation
resulting in greater cross-sell and upsell
• Deploying the right agency model
(e.g.: financial advisory model in
Singapore and general agency model
in Indonesia)
948
67,614
115,706
0
20,000
40,000
60,000
80,000
100,000
120,000
0
200
400
600
800
1,000
1,200
1,400
1,600
2017
95,639
70,391
2016
1,166
79,568
1,278
2018
1,467
2019
1,529
2020
CAGR
# of agents: +14%
Agency APE2: +13%
Sustainable quality agency growth Drivers of growth The opportunity3
Agency APE Sales
(US$ millions)
# of Agents • Aiming to increase active agents by 15%
every year would result in APE sales of
~US$2.7B by 2024
(exclusive of further productivity)
Agency APE Sales
(US$ billions)
Note: Figures are as of 2020 unless otherwise stated. APE sales and new business value are Non-GAAP measures. See slide entitled “Performance and Non-GAAP Measures” in 2021 Investor Day Legal Slides. 1 Source: Local regulators, competitors’ websites, insurance association and informal (industry exchange) market share. China ranking pertains to foreign insurers only. Ranking is based on new business sales. 2 Percentage changes are stated on a constant
exchange rate basis, a Non-GAAP measure. 3 See slide entitled “Caution regarding forward-looking statements” in the 2021 Investor Day Legal Slides. 4 The bar on productivity is not at scale. 5 Productivity refers to agency productivity.
16% NBV CAGR2
(2016-2020)
Ag
en
cy
2024E2020 Active
agents
growth
~2.7
Productivity4,5
1.5

• Region-wide Online Selection
System (LIMRA Career
Choice) with targeted
recruitment of quality talent
• First 100 Days for new agents
and leaders to equip and activate
new agents
73% new business digital submission3
76% auto-underwriting• Data driven activity and leads
management enabling new
customer cross-sell and upsell
Digitally enabled
recruitment process
focused on building a
quality agency force
18
Recruit Train Manage Sell
21%YoY increase in
number of agents
9%YoY1 increase in
new agent activity ratio
14%YoY2 increase in APE Sales
from digital leads
Our differentiated digital journey provides agents with tools to
understand and satisfy the full range of customer needs
Ag
en
cy
Launched
Manulife
Business
Academy
region wide
End-to-end
mobile based sales
management tool
Faster sales turnaround time; and
improved case size productivity
(e.g. 21% improvement in Vietnam4)
Note: Figures are as of 2020 unless otherwise stated. APE sales is a Non-GAAP measure. See slide entitled “Performance and Non-GAAP Measures” in 2021 Investor Day Legal Slides. 1 New agent activity ratio for April 2020 YTD vs. April 2021 YTD (calculation excluded Japan Manulife Financial Advisors and based on average agency activity ratio). 2 APE sales from digital leads for April 2020
YTD vs. April 2021 YTD. 3 New business digital submission as of April 2021. 4 ePOS case size improvement refers to ePOS cases vs. non ePOS cases in 2020.

Our exclusive bancassurance partnerships are
fueling growth across markets
19
Exclusive bank partners Our growth drivers
• Increase penetration with existing partners enabled by:
– Developing segment-specific propositions & solutions
– Building on our strength in high net worth
– Embedding our products within the bank’s digital eco-
system
• Continue to selectively add new partnerships
26%
>100
10
30M
bank partners
are exclusive bancassurance
partners1
customers
of our total Asia APE sales in 2020
Our exclusive bancassurance partners
give us access to
We have
of which
Bancassurance channel provided us
The opportunity3
• Aiming to double the number of customers
within our existing exclusive bancassurance
partnerships will be a key driver to improve
APE sales to >US$1.3B p.a. (exclusive of
tailwinds from productivity gains and new
partners)
Exclusive bancassurance
(APE Sales US$ millions)
Note: Figures are as of 2020 unless otherwise stated. APE sales is a Non-GAAP measure. See slide entitled “Performance and Non-GAAP Measures” in 2021 Investor Day Legal Slides. 1 Exclusive bancassurance partnership with VietinBank is pending regulatory approval. 2 Percentage changes are stated on a constant exchange rate basis, a Non-GAAP measure. 3 See slide entitled “Caution regarding forward-looking statements” in the
2021 Investor Day Legal Slides. 4 The bar on productivity gains/new partners is not at scale.
Exclusive bancassurance2
(APE Sales US$ millions)
Ba
nc
assu
ran
ce
2020 Customer
growth
2024E Productivity
gains/New
partners4
>1,300
648444
724648
162239
20192016 2020 1Q20 1Q21
+18% CAGR
+43% YoY

Note: Figures are as of 2020 unless otherwise stated. 1 Across 15 provinces including 4 direct municipalities. Includes Shaanxi province for which we have received regulatory
approval to begin preparation to establish a new branch. 2 Source: Swiss Re Institute, sigma 4/2020: World insurance: riding out
the 2020 pandemic storm. 3 Source: National Insurance Industry Communication Club. Ranking is based on agency new
business sales (foreign insurers only). 4 Percentage changes are stated on a constant exchange rate basis, a Non-GAAP
measure. See slide entitled “Performance and Non-GAAP Measures” in 2021 Investor Day Legal Slides.
• Accelerate growth in premium agency distribution
– Drive quality recruitment, enhance productivity and digitalization
– Build scale in high-priority branches by replicating
large-city success
• Capitalize on the health and retirement opportunity
– Build differentiated health and retirement ecosystem with
innovative products and value-added services
• Expand bancassurance partnerships with high net worth focus
• Continue to enhance digital capabilities to further improve
operational efficiency and customer experience
• Drive greater synergies among life, health, and asset management
in manufacturing and distributing products
Market priorities
20
China: High quality health and
retirement business in the
largest market in Asia
Agency
18Kagents
with market leading
productivity
#2ranking in agency
APE sales among
foreign insurers3
Market presence and
opportunity
52cities
presence across
15 provinces1
2.3% life insurance
penetration2
Health eco-system
28%CAGR
2016 – 2020
health & protection
NBV4
>30ecosystem partners
(including HaoDF,
111 Inc.’s online
pharmacy)
Digital and customers
100%new business
electronic
submission
+46Top quartile NPS,
up 27 points in
2020 vs. 2016
Ch
ina
& S
ou
th-E
ast A
sia

2016 2020
Shanghai
APE Sales (US$ millions)
• GDP: ~US$ 600B
• Population: ~25M
• New business sales
ranking1,3: #4
• APE sales 2016-2020 CAGR:
40% vs. market 15%3
• GDP: ~US$ 270B
• Population:~16M
• New business sales
Ranking2,3: #1
• APE sales 2016-2020 CAGR:
23% vs. market +1%3
APE Sales(US$ millions)
21
Note: Figures are as of 2020 unless otherwise stated. APE sales is a Non-GAAP measure. Percentage changes are stated on a constant exchange rate basis, a Non-GAAP measure. See slide entitled “Performance and Non-GAAP Measures” in 2021 Investor Day Legal Slides. 1 Ranking is based on agency new business sales amongst all insurers in 2020. 2 Ranking is based on agency new business sales amongst foreign insurers in 2020. 3 Source: The Insurance Association of China. 4 See slide entitled “Caution regarding forward-looking statements” in the 2021 Investor Day Legal Slides.
Successful branch operations…
2016 2020
+40%CAGR
Chengdu
+23%CAGR
# of agents
2016 2020
2.9X
# of agents
2016 2020
3.0X
GWPPopulationGDP
…will be replicated for scaled growth
2016 2020 20244
Core branches
Focus branches
Manulife has access to
Strong agency foundation with significant growth potential
Ch
ina
& S
ou
th-E
ast A
sia
70%70% 60%

Bancassurance
45%CAGR
2016-2020
bancassurance
APE sales3
Partnered with top tier banks in the
country4:
• Further expand and professionalize our #1 best-in-class agency force1:
– Full time agency roadmap and digitization
• Maximize our exclusive bancassurance partnership opportunities:
– Deepen customer penetration of existing bancassurance
partnerships (Saigon Commercial Bank and Techcombank)
– Operationalize and accelerate new partnership (VietinBank)
• Deliver a seamlessly connected customer journey utilizing digital
capabilities across search & buy, manage & review and claims
experiences
• Increase health & protection mix via a differentiated health & wellness
value proposition and platform
Market priorities
Market position1 and
opportunity
20%market share
• #1 ranking in
overall
• #1 ranking in
agency
• #2 ranking in
bancassurance
1.4% life insurance
penetration rate2
Agency
32%CAGR
2016-2020
Agency APE sales3
54Kagents
The most
productive
agency force
Vietnam: #1 player1 in the fastest growingeconomy in Asia. Best-in-class distribution
driving exponential growth
Note: Figures are as of 2020 unless otherwise stated.1 Source: Informal (industry exchange) market share. Ranking is based on new business sales. 2 Source: Swiss Re Institute, sigma
4/2020: World insurance: riding out the 2020 pandemic storm. 3 Percentage changes are stated on a constant exchange rate basis, a
Non-GAAP measure. See slide entitled “Performance and Non-GAAP Measures” in 2021 Investor Day Legal Slides. 4 Exclusive
bancassurance partnership with VietinBank is pending regulatory approval. See slide entitled “Caution regarding forward-looking
statements” in the 2021 Investor Day Legal Slides.
Products
8.6XNBV
health and
protection mix
vs. 2016
15.8pps
2016-2020
NBV margin
improvement
22
Ch
ina
& S
ou
th-E
ast A
sia

Showcase of Hong Kong
23

• Expand our agency platform by continuing to build scale and
productivity of our agency force
• Deepen bancassurance penetration and grow our HNW
customer base
• Accelerate health and retirement business:
– Establish leadership position in the health market through product
innovation and best-in-class claims experience
– Reinforce MPF3 leadership through new acquisition and tap
into consolidation opportunities
• Capitalize on the GBA5 opportunity to strengthen our position
in the marketNote: Figures are as of December 31, 2020 unless otherwise stated.1 Source: HK Insurance Authority 4Q20 statistics. Ranking is based on new business sales. 2 Source: Pi Financial Services
Intelligence Dec 2020. 3 Mandatory Provident Fund. Source: Mercer MPF Market Share Report as at 4Q20, MPF market share is
measured by share of assets under management and estimated net cash flows by scheme sponsor. 4 Source: YouGov Brand
Tracking, YouGov BrandIndex 2018-2020 (insurance sector). 5 Greater Bay Area. 6 This figure is as of 2020.
Market position and
opportunity
>1/3 of adult population
are our customers
Lowlife insurance
penetration in
Greater Bay Area
(GBA) cities
Agency
#1ranking in agency
new business
growth among
major insuers1
>10Kagents
• #3 ranking
in agency
headcount2
• headcount grew
ahead of market
HK MPF
#1ranking in MPF3
in terms of net cash
flows and AUM
Products
#1ranking in
Investment-Linked
Assurance Scheme
(ILAS)1
60% of NBV6 is health
and protection
Market priorities
Hong Kong: Leading agency insurance player,
our most profitable market in Asia
24
Customer
#1Customer
satisfaction and
brand advocacy
for 3 consecutive
years4

Key Messages
25
• We are the fastest growing of the Top 3 pan-Asian life insurers
• Asia is a primary growth engine for Manulife
• Our key strength is the diversified nature of our markets, distribution channels,
and products
• Growing and digitizing agency, deepening bancassurance penetration, and
accelerating China and South-East Asia represent our biggest opportunity to grow
value and earnings
• Track record of consistent growth on our value metrics

Appendix: Market information
26

27
• Continue to capitalize on our successful DBS partnership:
– Deepen customer penetration
– Harness the combined digital capabilities of Manulife and
the world’s best bank3
• Accelerate growth in financial advisory channel via strategic partnerships
and investments
• Broaden our individual retirement product suite to capture additional share
of the underserved market
• Continue to build on market leadership in HNW proposition
Market opportunity
US$
65KGDP per capita,
highest in Asia1
46%forecast growth in
HNW population by
2025 in Asia, driven
by South-East Asia2
Distribution
#1 ranking in
bancassurance
#2 ranking in financial
advisory channel
Digital
4X
2020 digital APE
sales vs. 2019;
6 direct to customer
products available
through DBS digital
platform
75%new business digital
submission (up from
68% in 2019)
Market priorities
Singapore: #1 in bancassurance, #2 in financial
advisory channels in Asia’s premier financial hub
Note: Figures are as of 2020 unless otherwise stated. Ranking is based on new business sales. 1 Source: World Bank. 2 Source: KnightFrank, The Wealth Report 2021. 3 Source: Global Finance.
Products and Customers
#1ranking in
• Regular premium
investment-linked
product
• Retirement
68%growth in the number
of customers since
2016

Expense Management
3.6pps
improvement in
expense efficiency
ratio in 2H20
vs. 1H20
-9% total general
expenses vs. 2019
28
Distribution
70%increase in
independent agency
relationships since
2016
235Manulife financial
advisors (launched
in 2019)
In-force Management
95%persistency ratio1.
Strong focus on
in-force management
driving earnings
growth
1.4Xrenewal premiums
vs. 2016
Digital
88% tied agency ePOS
adoption rate (up
from 68% in 2019)2
100 % digital claims
payment
Note: Figures are as of 2020 unless otherwise stated. 1 13th month policy persistency. 2 Calculated based on month of December 2020.
Japan: In-force and expense management focus driving earnings and cash generation
• In-force book optimization:
– Focus on persistency management and optimize investment return
• Continue strategic expense management:
– Drive automation and self-service digital solutions
– Optimize our real estate footprint
– Promote agile ways of working to deliver greater process efficiency
• Diversify product mix:
– Wealth and retirement planning solutions to individuals
– Diverse offerings to SMEs
Market priorities

Hong Kong
(US$ millions)2016 2019 2020
CAGR
(2016-2019)
Core earnings 442 739 813 19%
NBV 278 536 463 24%
NBV margin 56.2% 62.5% 59.9% N/A
APE sales 496 859 773 20%
Japan
(US$ millions)2016 2019 2020
CAGR
(2016-2019)
Core earnings 371 368 310 0%
NBV 260 259 131 0%
NBV margin 25.5% 31.0% 21.9% N/A
APE sales 1,019 835 600 -6%
Market performance by geographies
Note: Core earnings, new business value, new business value margin, and APE sales are Non-GAAP measures.
Core earnings and new business value are calculated after non-controlling interests. Both new business value and
APE sales used in the new business value margin calculation are after non-controlling interests. Percentage
changes are stated on a constant exchange rate basis, a Non-GAAP measure. See slide entitled “Performance
and Non-GAAP Measures” in 2021 Investor Day Legal Slides.
29
Vietnam
(US$ millions)2016 2019 2020
CAGR
(2016-2019)
Core earnings 38 158 233 62%
NBV 28 98 144 53%
NBV margin 25.3% 36.2% 41.1% N/A
APE sales 111 272 350 36%
Singapore
(US$ millions)2016 2019 2020
CAGR
(2016-2019)
Core earnings 65 114 110 20%
NBV 85 134 145 16%
NBV margin 22.9% 22.9% 28.7% N/A
APE sales 374 585 506 16%
China
(US$ millions)2016 2019 2020
CAGR
(2016-2019)
Core earnings 72 147 139 28%
NBV 51 105 100 29%
NBV margin 50.1% 58.1% 49.1% N/A
APE sales 199 353 399 22%

Growing across geographies and distribution channels
APE Sales by Geographies(US$ millions)
APE Sales by Distribution Channels(US$ millions)
30 Note: APE sales is a Non-GAAP measure. See slide entitled “Performance and Non-GAAP Measures” in 2021 Investor Day Legal Slides.
496859 773
1 019
835600
199
353
399
374
585
506
272
350299
320
264
111
2016 2019 2020
2,498
2,892
3,224
VietnamHong Kong
SingaporeJapan
China
Other Emerging Markets
948
1 467 1 529
716
899 743834
858620
2016 2019 2020
2,498
3,224
2,892
Agency Bancassurance Other

31