Embed Size (px)
Citation preview
.' ..
.
.
.
- -
.
A BIOLOGICAL SURVEY OF THE SUSQUEHANNA RIVER
,IN ThE VICINITY OF YORK HAVEN, PA.
1967 PROGRESS REPORT
prepared for.
- PENNSYLVANIA POWER & LIGHT COMPANY
and,
METROPOLITAN EDISON COMPANY
by
' Charles B. Vurtz'
Cca uiting :. c!cgis: -
La Salle College.,
Philadelphia, Pr.. .
.
'
.
o
, submitted
9 August 1968
.
0
.
.
con 006su.
-
o* *
lo* Bnv Y a
'
,
m e M e Mul XlAL .
74//120 63
4
.
. ..
.
.
'
.
.
.
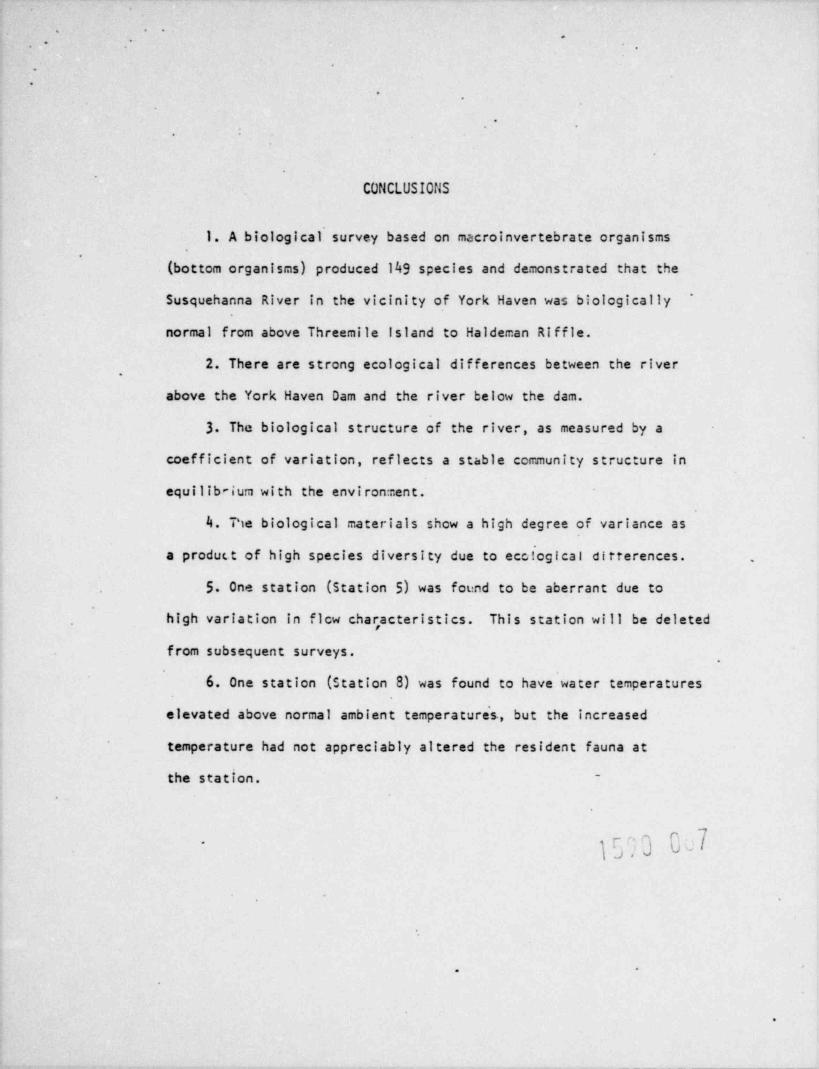
CONCLUSIONS
1. A biological survey based on macroinvertebrate organisms
(bottom organisms) produced 149 species and demonstrated that the*Susquehanna River in the vicinity of York Haven was biologically
normal from above Threemile Island to Haldeman Riffle.
2. There are strong ecological differences between the river.
above the York Haven Dam and the river below the dam.
3. The biological structure of the river, as measured by a
coefficient of variation, reflects a stable community structure in
equilib-ium with the environment.
4. T'ie biological materials show a high degree of variance as
a product of high species diversity due to ecc!cgical ditterences. .
5. One station (Station 5) was found to be aberrant due to
high variation in ficw char,acteristics. This station will be deleted
from subsequent surveys.,
6. One station (Station 8) was found to have water temperatures
elevated above normal ambient temperatures, but the increased
temperature had not appreciably altered the resident fauna at
the station. -
{J,
..
.
,'*
.
. .
.
.
'
A BIOLOGICAL SURVEY OF THE SUSQUEHANNA RIVER
IN THE VICINITY OF YORK HAVEN, PA..
.
INTRODUCTION
This survey was undertaken in'the interests of the Pennsylvania,
Power and Light Company and the Metropolitan Edison Company. The
two companies jointly sponsored the work, which included a study
of the Susquehanna River in a stretch extending from above Threemile
l_sland dcunstream to Haldeman Riffle.
The Survey consisted of a study of the macroinvertebrate
fauna (bo. tom organisms) at each of n'ne stations. Field work
was begur. August 7, 1967, and contir.ued through August 18, 1967
The field work was pe , formed by Drs. Charles S. Vurtz and
John S. Penny. Mr. Lynn Ratzell of the Pennsylvania Power and
Light Company ' accompanied the consultants during the field work.
Water quality characteristics were measured by laboratory
personnel of the Pennsylvania Power and Light Company.
-
STATIONS-
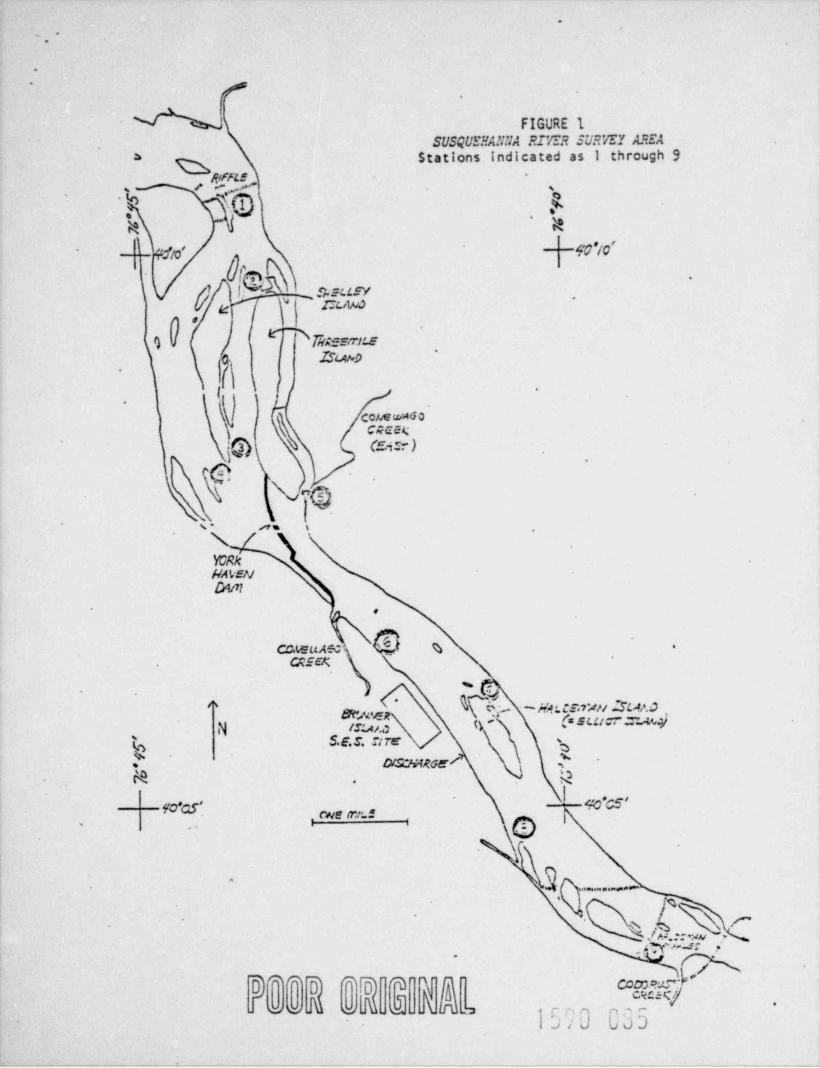
Nine stations (sampling sites) were collected. The location
of each station is indicated on Figure 1, a map of the general area
'
.
-1-
l '; : D 0 3~
- - . . - -- ,_,
.
..
'
. o
.
_ _
of investigation. The list of stations with pertinent comments
follows.
Station 1. This station was in the riffle area above
Threemile Island and between the head of Fall Island and the
eastern shore. Along the eastern shore the substrate was
anaerobic at depths of two or more. feet as indicated by the
production of hydrogen sulfide..
* Station 2. This stacion was between the northern tips of
Threemile .sland and Shelley Island. ..vt off Shelley Island a-
sandy bottem was found to depths of five feet. Fragments of
large uni..nid clam shells were found f.e.e, but no living .
specimens were taken at any station dur.ng the survey.~ ~~
S ic i s on 3 T|e s s s la t i on aniciidsd '0.6" ... .~. the ;Oeth0Tr. KIP' *-
of Shelley Island and the western sher of Threemile Island at.
the " Ball Lai" summer cottage. Depths reached ten feet at this
s ta t ion. . .inaerobic bottom conditions occurred in depths as
shallow as two feet.
Station 4. This station extended from the southern tip of
Shelley Island to the southern tip of the next Island west of
Shelley Island. The station had depths to nine feet, and was_
characterized by extensive aquatic plant growth. One plant,
a species of 7cIlisneria, is reputed to have been introduced
by the State as a duck food. This plant occurs as a nuisance
growth.
'
1r'] OV9_2- o.
preO
.
P ]OWY Q ' ,&& S In\ _
\1 o uu
. , '.
.
.
.
Station 5 This station was located across the channel.
from the southern tip of Threemile Island below the York Haven.
Dam. The staticn was aberrant in its physical characteristics
because of widely fluctuating water levels. This station will
be deleted from further studies.
Station 6. This station was located along the western
shore of the river above the mouth of the Conewago Creek.
Depths did not exceed one and one-half feet at the time of
collecting. Near the shore the river had a mud substrate,
while of# shore an extensive. growth of Polygonum was present.
Stat on 7 This station was located between the northern
' Eiiiot) islana ano the eas terri niiore. Deptiintip oi- raldeman = '
reached & bout five feet. *
Station 8. This station was located along the western
shore abou. one mile below the discharge canal of the Brunner
Island Plant. Depths did not exceed two feet and heavy silt
deposits covered the substrate material. *
Station 9 This station was located at the right edge of
Haldeman Riffle and included a shoaling mud flat below the riffle.
This mud flat supported an extensive growth of emergent aquatic
plants. Depths did not exceed one and one-half feet.
.
-3--
.,
.
Ok Oh&Q -
. .
.
.. . .
. .
'. .
.
.
.
WATER QUALITY
On August 18, 1967, one set of water samples was taken for. . water quality analyses by the laboratory personnel of the
Pennsylvania Power and Light Company. No sample was collected
at Station 5 because this station was inaccessible on the
day of collection.
The analytical work was performed September 15, 1967, after
nearly one month of storage. Since some water quality charac-
teristics are unstable it would appear inappropriate to include.
recorded measurements for these here. Thus results of.the
hydrogen ion concentration and free carbon dioxide tests are not
included here. Phenolphthalein alkalinity (as CACO 1 was3
repcrted 'dr Stations 6, 8, and 9 The reported values were ,
We assume this10.0, 2.0, and 5.5 parts per million respectively.
analysis was not performed on the other samples since the submitted
data sheet presents a dash (-) in the results column under the
other stations. The presence of phenolphthalein alkalinity implies
the presence of free hydroxids. This appears unlikely in stored
samples and this occurrence must be considered anomalous.
Results of the analytical tests are presented in Table I
with results expressed as parts per million.
-4 r-n n.UlJ
.
&a
.'N
~
.
.
.
.
.
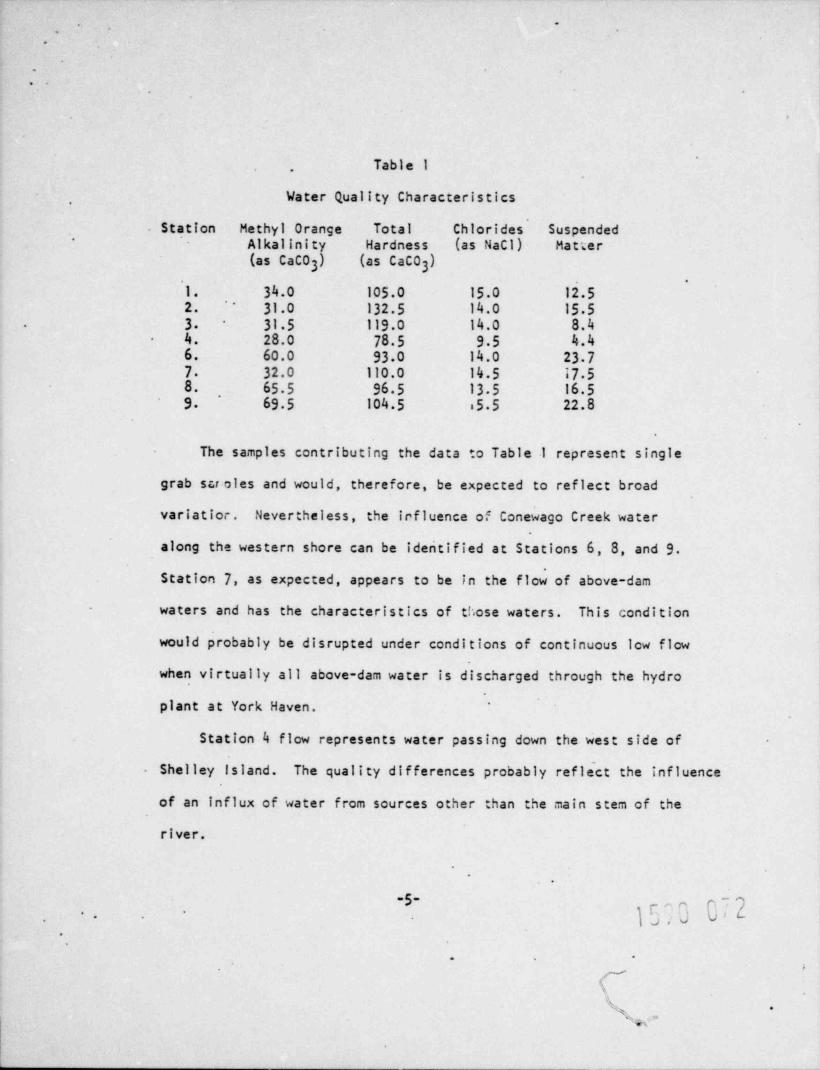
Table 1.
Water Quality Characteristics.
Station Methyl Orange Total Chlorides SuspendedAlkalinity Hardness (as Nacl) Matter
*
(as CACO ) (as CACO )3 3.
1. 34.0 105.0 15.0 12.52. 31.0 132.5 14.0 15.5
'
3 31.5 119.0 14.0 8.4-
4. 28.0 78.5 9.5 4.46. 60.0 93.0 14.0 23 77. 32.0 110.0 14.5 17.58. 65.5 96.5 13 5 16.59 69.5 104.5 i5.5 22.8
The samples contributing the data to Table .I represent single
grab su oles and would, therefore, be expected to reflect broad
variatior. Nevertheless, the icfluence of Conewago Creek water
along the western shore can be identified at Stations 6, 8, and 9
Station 7, as expected, appears to be in the flow of above-dam
waters and has the characteristics of those waters. This condition
would probably be' disrupted under conditions of continuous low flow
when virtually all above-dam water is discharged through the hydro
plant at York Haven. *
Station 4 flow represents water passing down the west side of
Shelley Island. The quality differences probably refle'ct the influence
of an influx of water from sources other than the main stem of the
river.
*
.
f. f e
}p3,0 Jr '1.
.
e *
skw .g
k$
*
.-
.
-.
. .
.
.
.
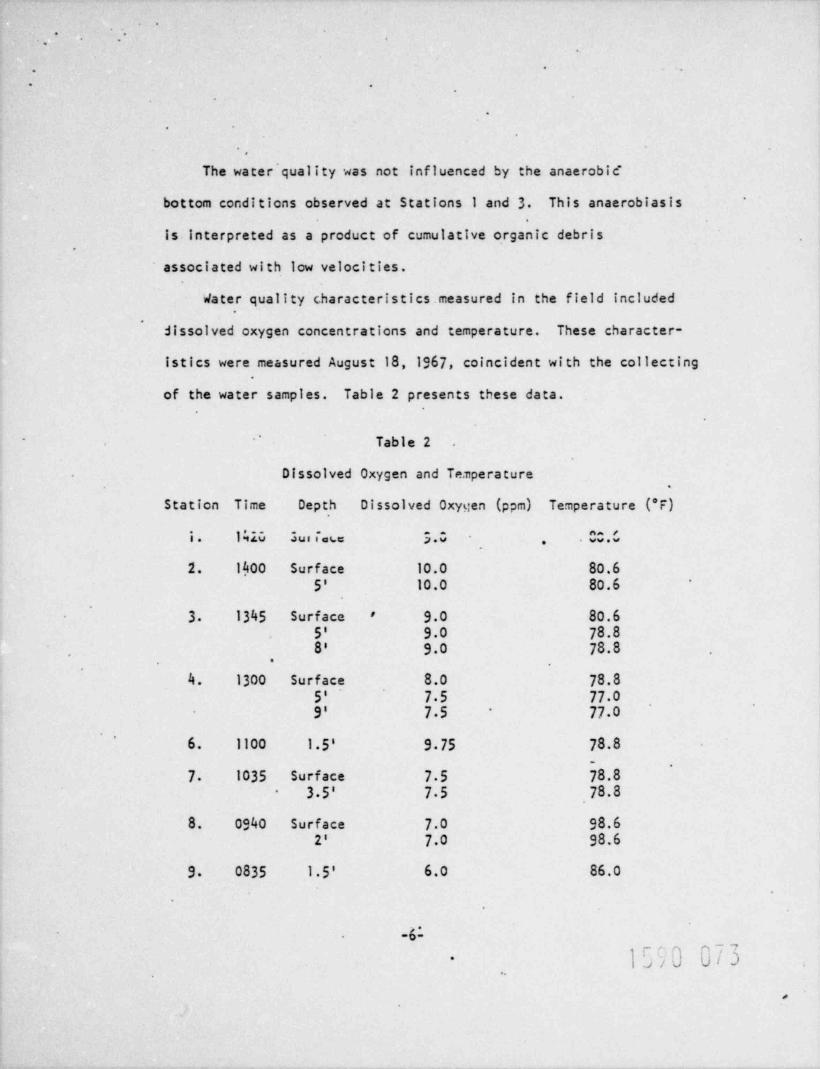
The water quality was not influenced by the anaerobic
bottom conditions observed at Stations 1 and 3 This anaeroblasts *
Is. Interpreted as a product of cumulative organic debris
associated with low velocities.
Water quality characteristics. measured in the field included.
dissolved oxygen concentrations and temperature. These character-
Istics were measured August 18, 1967, coincident with the collecting
of the water samples. Table 2 presents these data.
Table 2-.
Dissolved Oxygen and Tecnperature.
Station Time Depth Dissolved Oxygen (ppm) Temperature (*i-)
1. 142G Sus i .w 5.0 00.0~
,
2. 1400 Surface 10.0 80.65' 10.0 80.6
3 1345 surface 9.0 80.6'
5' 9.0 78.88' 9.0 78.8
.
4. 1300 surface 8.0 78.85' 7.5 77.09' 7.5 77 0
'
6. 1100 1.5' 9.75 78.8'
7 1035 surface 7.5 78.83.5' 75 78.8-
8. 0940 surface 7.0 98.62' 7.0 98.6
9 0835 1.5' 6.0 86.0
6n,
lbjb- - ry Ui3-
.
M
.
. .
.
.
.
---
.
Biological collections were made at Station 8 on August 16th.
On that date the right shoreline water temperature ranged from
96.0 F to 100.0 F at 1:30 PM. Offshore, at the head of the
Island, the water temperature was 90.0 F at 9: 15 AM. Although
these elevated temperatures were found at Station 8 all tempera-
tures and dissolved cxygen concentrations at all stations were
apparently within biologically acceptable ranges for the r.esident
macroini-rtebrate organisms.
The Pennsylvania Power and Light Ccmpany provided river flow
data for the period preceding and including the field work. ' River
flow diminished almost continuously cucing the survey; discharge
lowering from approximately 35,000 cfs on August 7 to approximately
5,900 cfs on August 18. (A slight, trsnsient, rise occurred -
. August 10.) The peak flow immediately preceding the beginning of
the surve) was approximately 37,000 cfs on August 6. Average
discharge during the 12 days of the survey period was approximately
19,590 cfs. During the 12 days preceding the survey, average
discharge was approximately 19,900 cfs.
In the 12 days preceding the survey river elevation ranged
from 252.18 to 254.88 feet: a range of 2.70 feet. During the 12
days of the survey period river elevations ranged from 251.61 to
254,77 feet: a range of 3.16 feet.
-7-.
3rfg CT4.
.
**
,
.
. .
.
.
.
River flow data indicate that the physical characteristics.
of the river, with the exception of Station 5, were not extreme
enough to influence the resident fauna of macroinvertebrate
organisms..
Station 5 was physically limiting for bottom organisms
because of fluctuating water levels. At times of low flow,
when no water spills ever the York Haven Dam, Station 5 would
have essentially intermittent flow. Any flow that did occur
would consist only of the discharge from Conewago Creek * and
seepage Icsses from the impoundment.
*This would be the small Conewago Creek draining into the eastern.
side of the river above the community of Falmouth, it is not to
be confused with the larger Conewago Creek draining into the
western side of the river at York Haven.
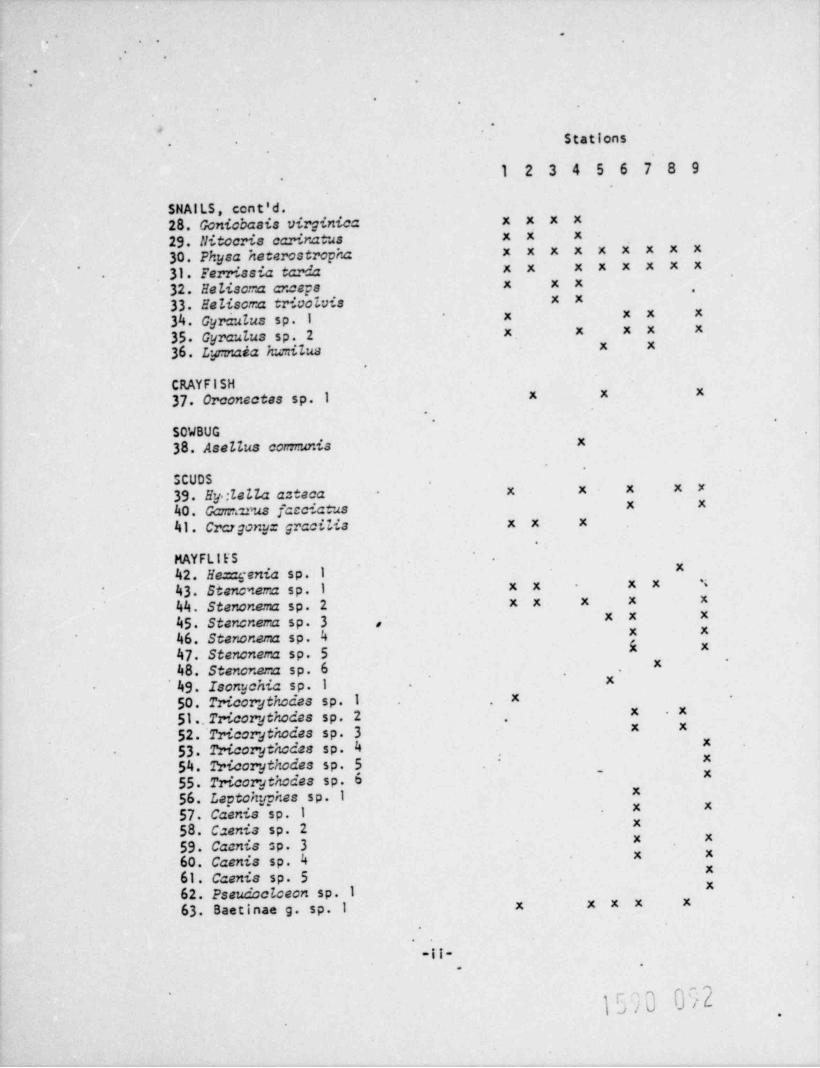
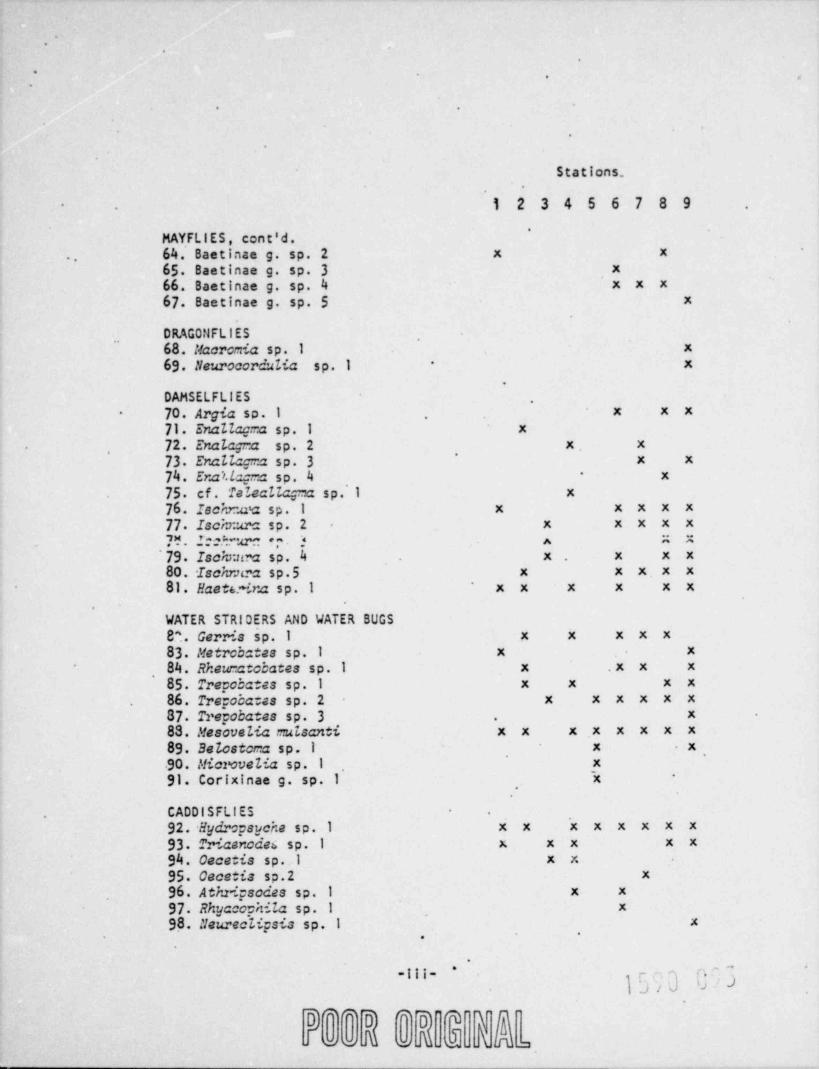
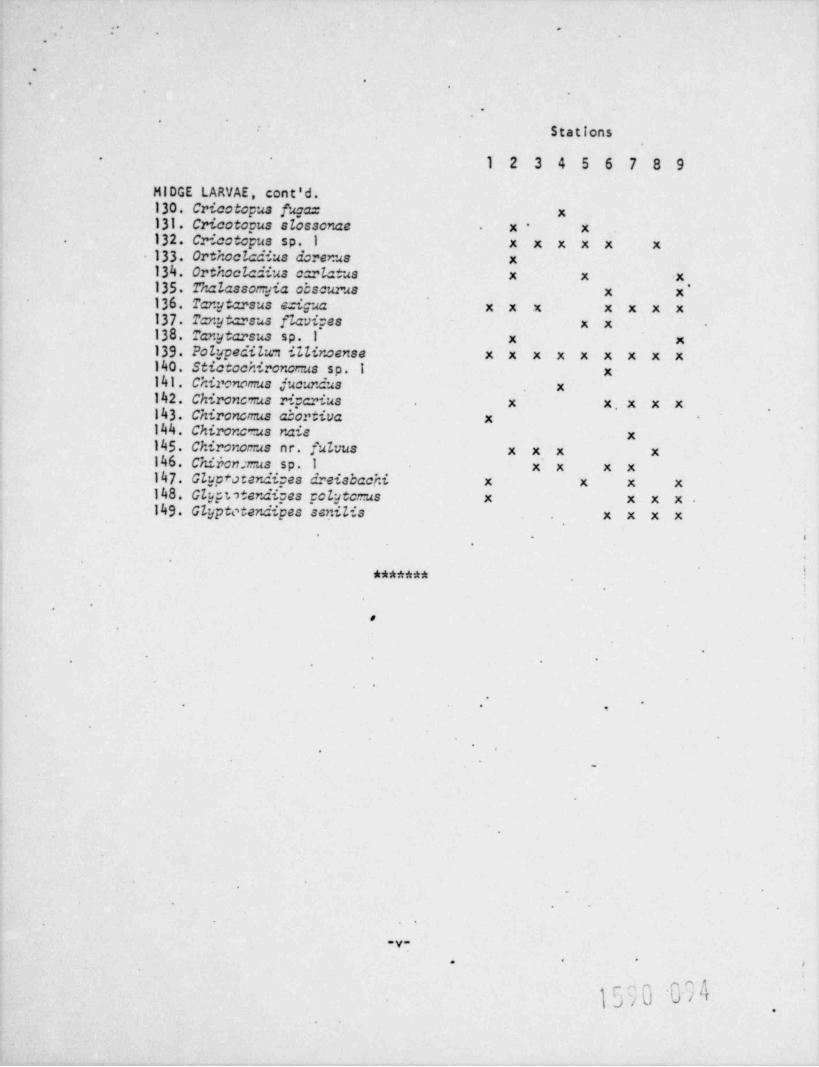
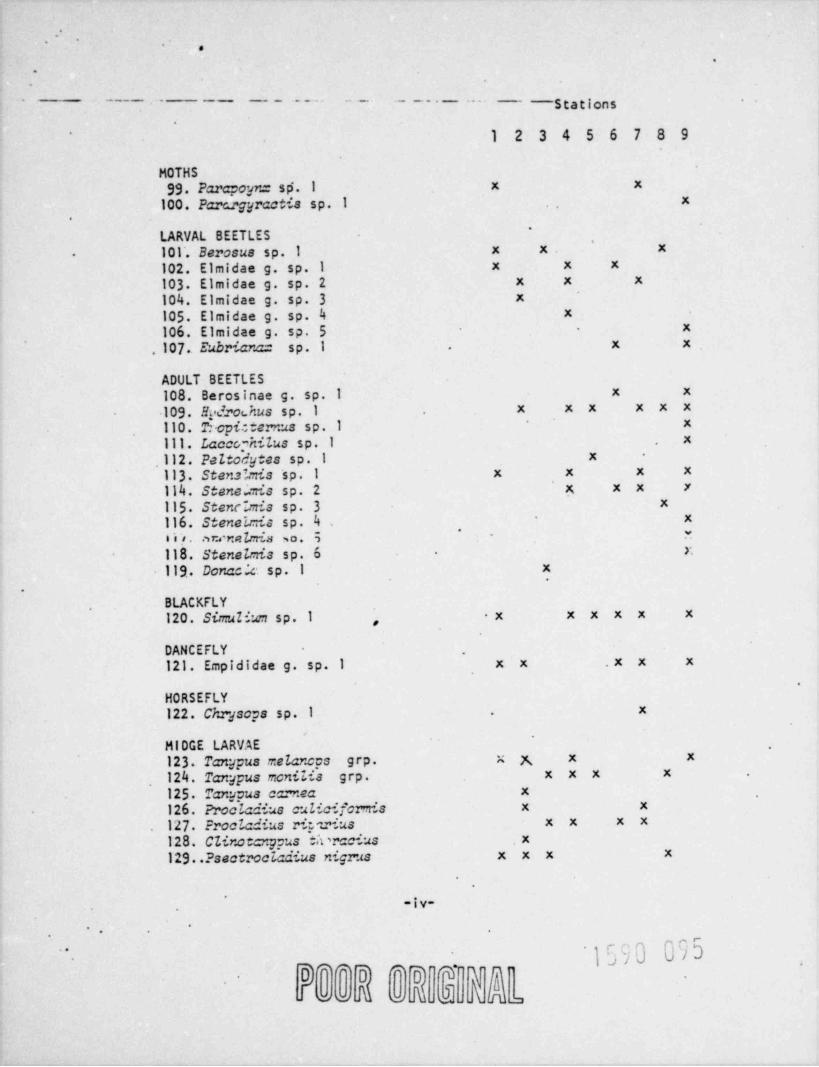
BIOLOGICALCOLLECTI0td
A total of 149 species of macroinvertebrate organisms was
collected during the survey. These are listed in Appendix A,
which also shcws the distribution of the species by station.
-8-'
' -.
i.5 9 0 0 , ,3-
,
.
.
-.' - -,
,'
.
.
'
*- -,-
- .
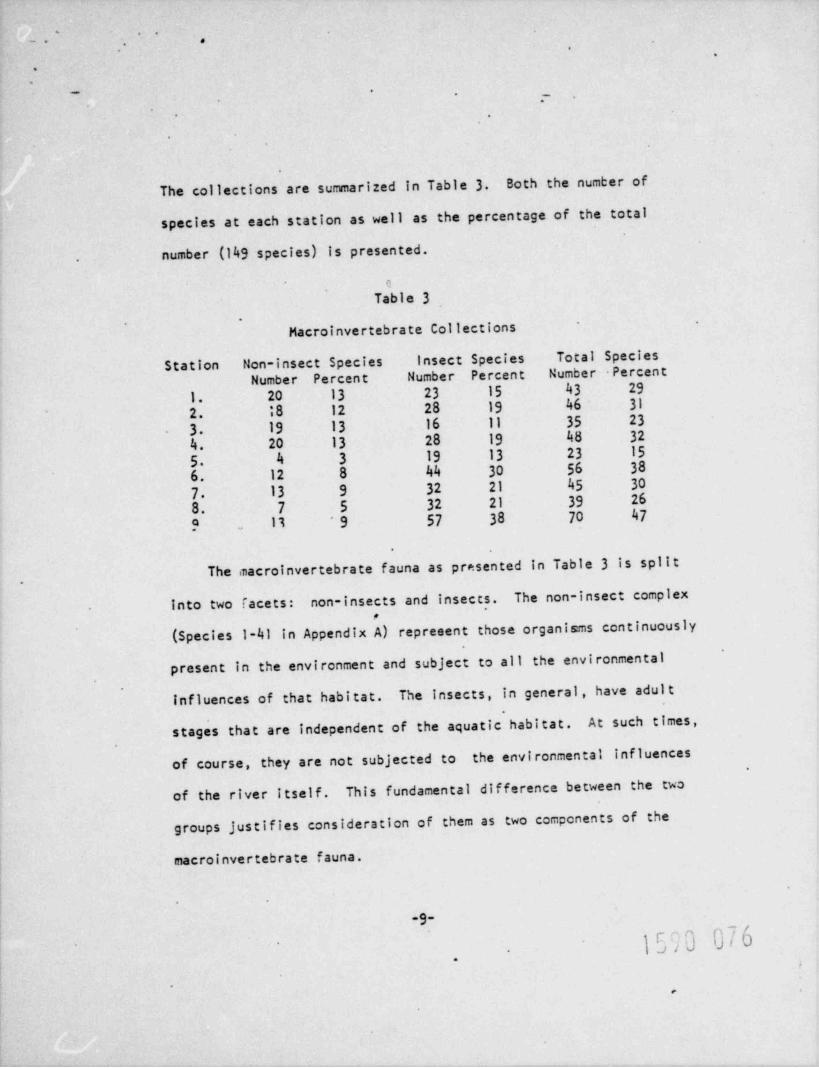
The collections are summarized in Table 3 Both the number of
species at each station as well as the percentage of the total
number (149 species) is presented..
e
Table 3.
Macroinvertebrate Collections
Station Non-insect Species Insect Species Total Species
Number Percent Number Percent Number Percent
1. 20 13 23 15 43 29
2. 18 12 28 19 46 31
3 19 13 16 11 35 23
4. 20 13 28 19 48 32
5 4 3 19 13 23 15
6. 12 8 44 30 56 38
7 13 9 32 21 45 30
8. 7 5 32 21 39 26
" 13 9 57 38 70 47. ,
The macroinvertebrate fauna as pre.sented in Table 3 is split.
into two facets: non-insects and insects. The non-insect complexo
(Species 1-41 in Appendix A) represent those organisms continuously
in the environment and subject to all the environmentalpresent
Influences of that habitat. The Insects, in general, have adultAt such times,stages that are independent of the aquatic habitat.
of course, they are not subjected to the environmental influences.
of the river itself. This fundamental difference between the two
groups justifies consideration of them as two components of the
macroinvertebrate fauna.
.
9_
1570 076.
9
. .
.-
.
.
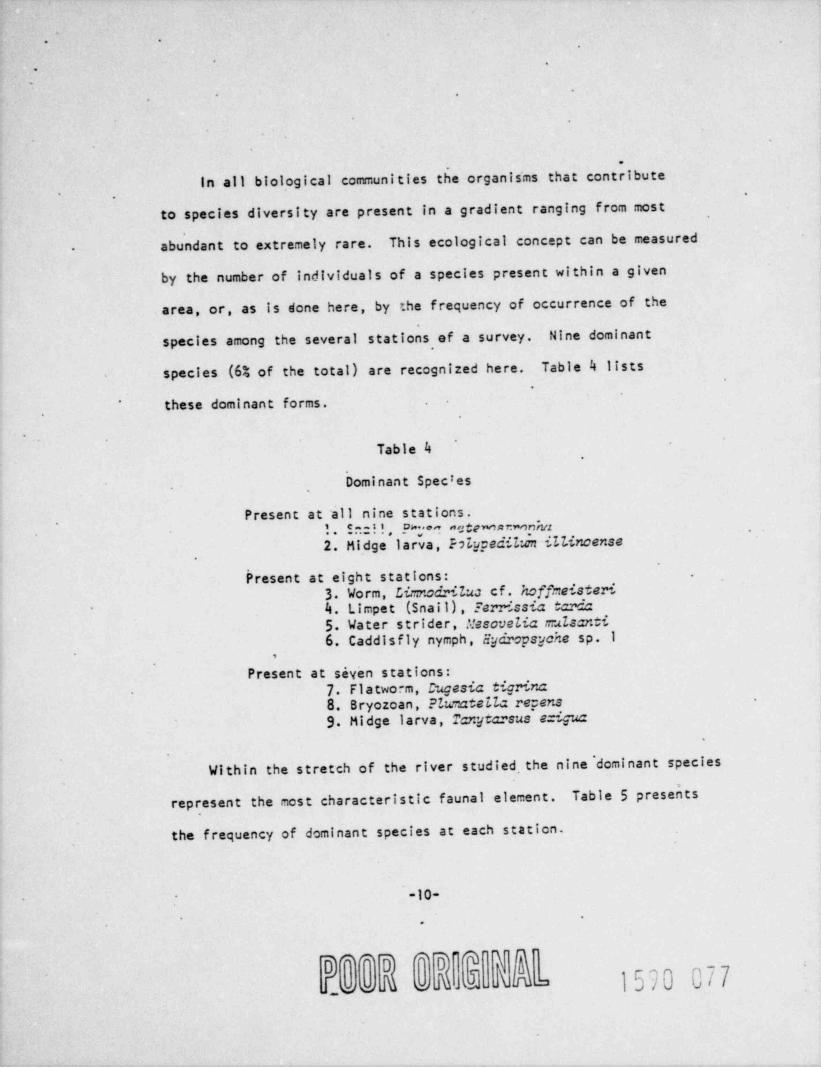
In all biological communities the organis'ms that contribute.
-
to species diversity are present in a gradient ranging from most
abundant to extremely rare. This ecological concept can be measured-
by the number of individuals of a species present within a given
area, or, as is done here, by the frequency of occurrence of the
species among the several stations ef a survey. Nine dominant,
species (6% of the total) are recognized here. Table 4 lists.
these dominant forms.*
Table 4.
Dominant Species
Present at ill nine stations.1. Sr.:1!, Pa;*~ accenantwopha2. Midge larva, Polypeditwn-sLLinoense
.
Present at eight stations:3. Yorm, Lir:nodriIua cf. hoffmeisteri4. Limpet (Snail), Ferrissia tarda5. Water strider, resovetic muIsents6. Caddisfly nymph, Eydropsyche sp. I
.
Present at sEven stations:7. F1atworm, Dugesia tigrina8. Bryozoan, PlumateLZc repens9. HIdge 1arva, Tanytarsus e=ip a
Within the stretch of the river studied.the nine' dominant species
represent the most characteristic faunal element. Table 5 presehts
the frequency of dominant species at each station.
-10--
.
D* * l0
*lD
' T Y h_w M e n A hW= 1570 077
. .,
. .
.
-.
.
.
.
.
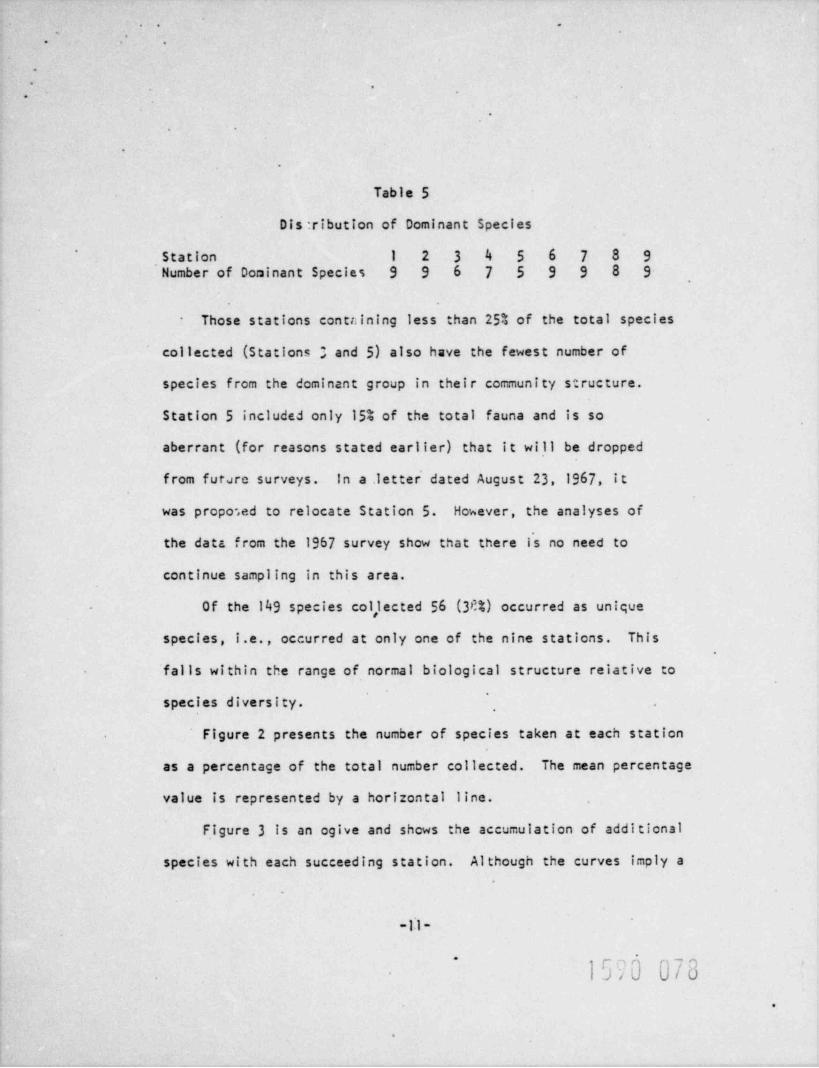
Table 5
Dis :ribution of Dominant Species
Station 1 2 3 4 5 6 7 8 9*
Number of Do.,inant Species 9 9 6 7 5 9 9 8 9
Those stations contr.ining less than 25% of the total species
collected (Stations ; and 5) also have the fewest number of
species from the dominant group in their community structure.
Station 5 included only 15% of the total fauna and is so
aberrant (for reasons stated earlier) that it will be dropped
from furore surveys. In a. letter dated August 23, 1967, it
was propo,ed to relocate Station 5. However, the analyses of
the data from the 1967 survey show that there is no need to
continue sampling in this area.
Of the 149 species col,lected 56 (38%) occurred as unique
species, i.e., occurred at only one of the nine stations. This
' falls within the range of normal biological structure relative to
species diversity.,
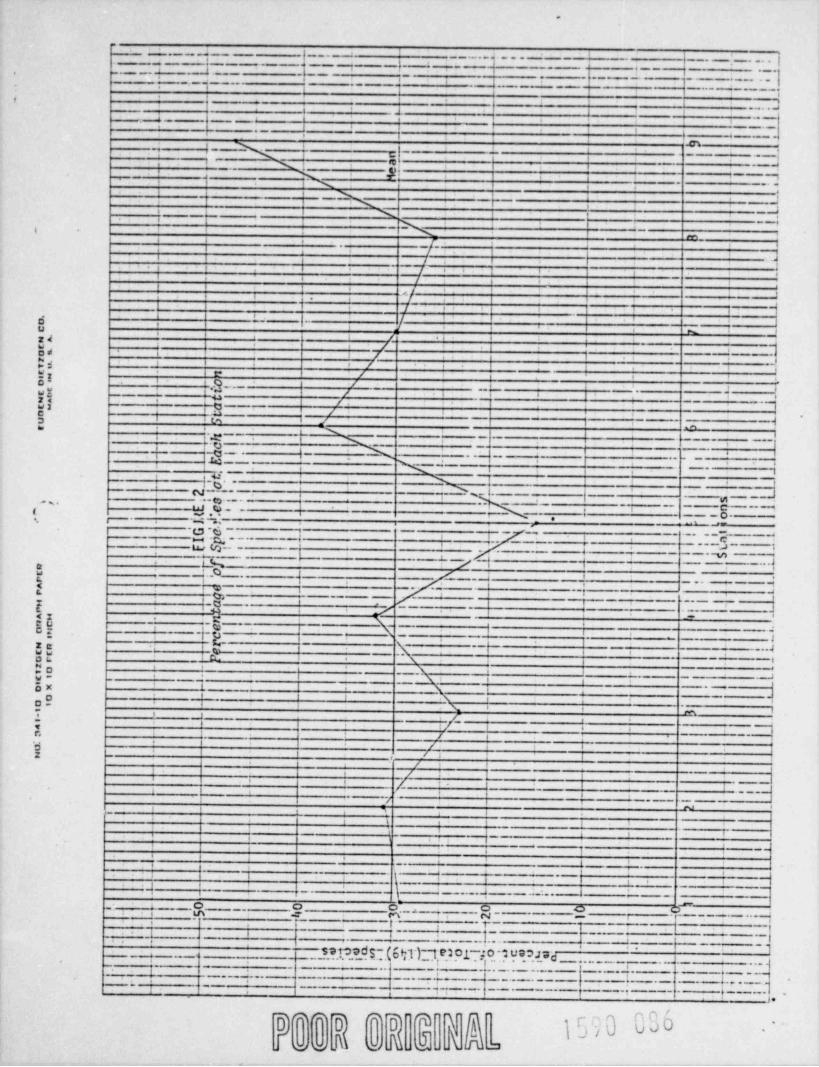
Figure 2 presents the number of species taken at each station
as a percentage of the total number collected. The mean percentage
value is represented by a horizontal line.
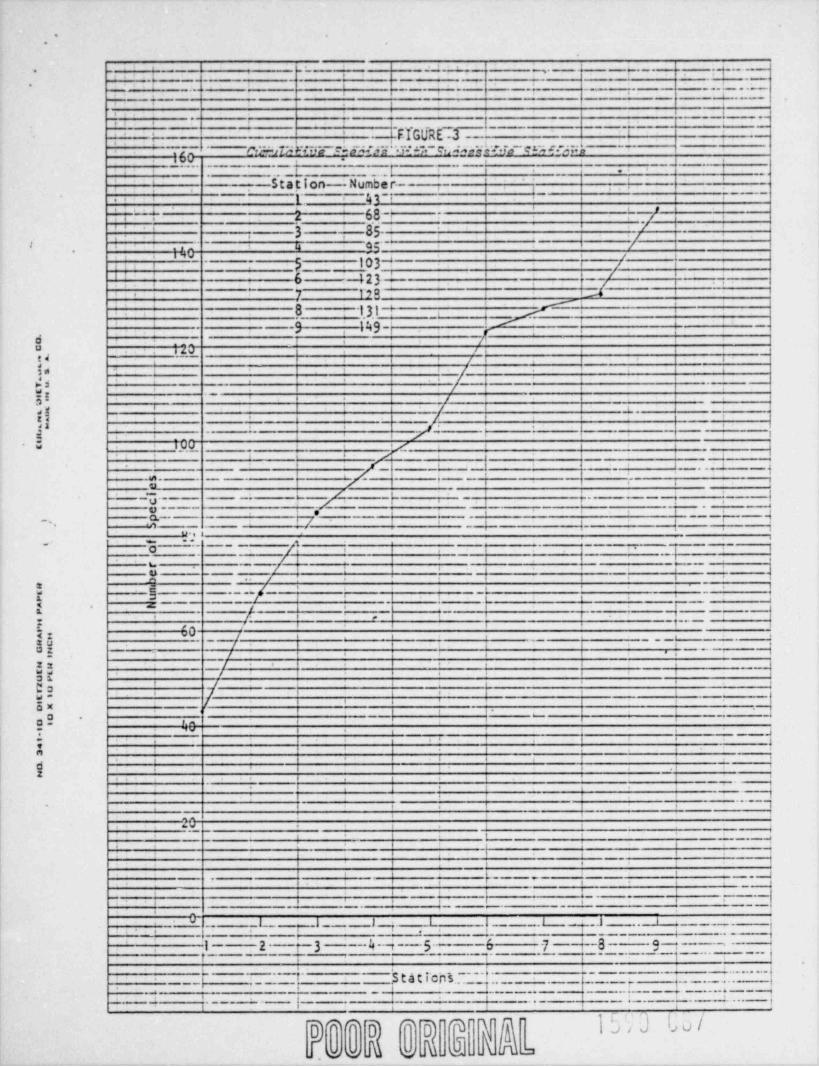
Figure 3 is an ogive and shows the accumulation of additional
species with each succeeding station. Although the curves imply a.
-11-
~
1570 078.
.
,- .
..
.
.
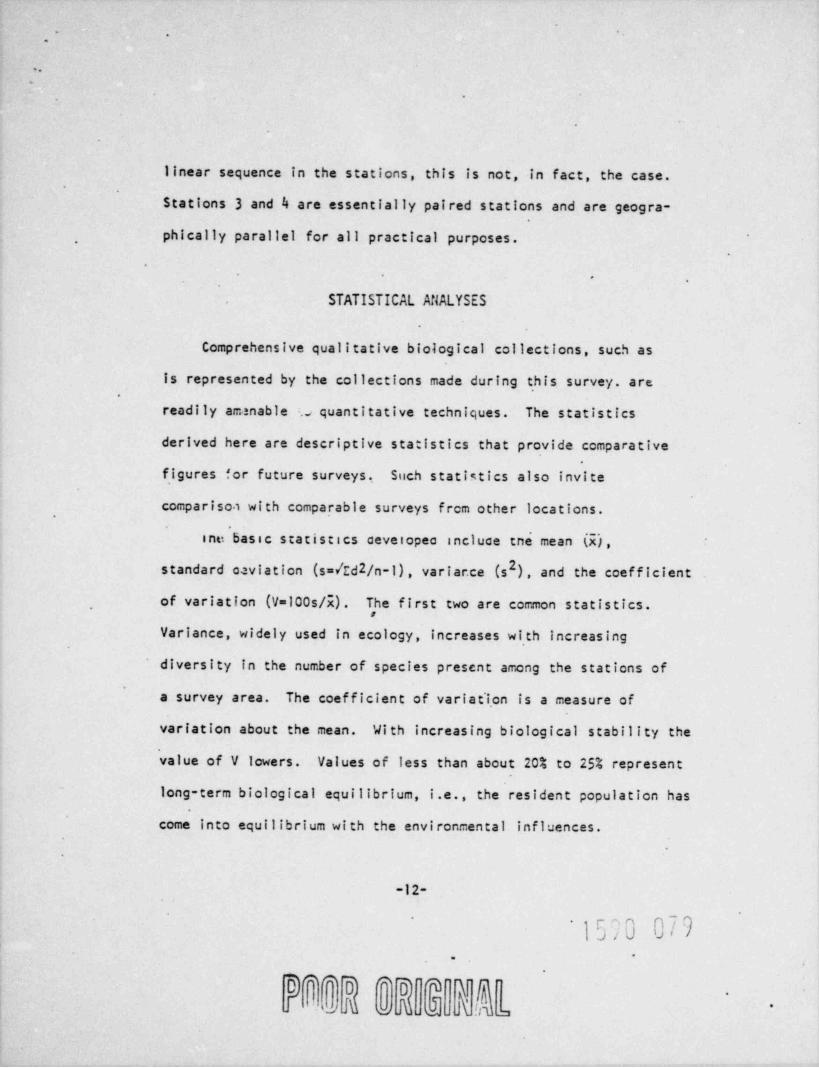
linear sequence in the stations, this is not,-in fact, the case.
Stations 3 and 4 are essentially paired stations and are geogra-
phically parallel for all practical purposes.,
.
.
STATISTICAL ANALYSES
Comprehensive qualitative biological collections, such as
is represented by the collections made during this survey. are.
readily amanable s quantitative techniques. The statistics
derived here are descriptive statistics that provide comparative'
figures for future surveys. Such statistics also invite
comparisoa with comparable surveys from other locations..
'
ine basic statistics aevelopea incluce tne mean (E) , '
2standard cavlation (s=/Ed2/n-1), variar.ce (s ), and the coefficient
, of variation (V=100s/i) . The first two are common statistics.
Variance, widely used in ecology, increases with increasing
diversity in the number of species present among the stations of
a survey area. The coefficient of variati.on is a measure of
variation about the mean. With increasing biological stability the
value of V lowers. Values of less than about 20% to 25% represent
long-term biological equilibrium, i.e., the resident population has
come into equilibrium with the environmental influences.
-12-
~1570 079..
.
.
.
%
Table 6 summarizes the descriptive statistics derived for.
various aspects of the data.
.
Table 6
Descriptive Statistics
2x s s y
Total species at all stations'
45 13.13 172.50 29.2%Total species excluding aberrant Station 5 48 10.93 119.43 22.8%
'
Non-insects at all stations 14 5.79 33 50 41.4%. Non-insects excluding aberrant Station 5 15 4.72 22.29 31.5%
Insects at all stations '31 12.73 162.25 41.1%insects excluding aberrant Station 5 33 12.75 162.57 38.6%
When the aberrant Station 5 is de12ted f rcm the data the total
species n::ber reflect biological stability in the stretch of the
river stuuled.
There is a high degree-of variance in the collections. This
is a reflection of high species diversity among a series of stations.
that vary ecologically because of physical differences. Obviously,
the variance is chiefly associated with the insects. The ecological
differences leading to this diversity include variation in substrate
material, flow velocity, depth, etc.''
'
When the stations are divided into an above-dam grcup (Stations
1-4) and a below-dam group (Stations 6-9) the descriptive statistics
-13-.
1590 000.
'
. ..
,
*
.
. .
'A .
.
reflect greater stability within each group. Table 7 presents.
these statistics.
Table 7
Descriptive Statistics Relative to York Haven Dam
2I s s y
Total species above the dam 43 5.71 32.66 13.3%Total species below the dam 56 14.21 202.00 25.4%
Hon-insects above the dam 19 1.00 1.00 0.05%Non-Insects below the dam 11 2.88 8.33 26.2%
insects above the dam 24 5.68 32.33 23.7%Insects below the dam 41 11.80 139.33 28.8%
Fron the data in Table 7 it is apparent that ecological
cannernns cerrar oe.cween tiie auuve-Ue... and valuw Jam =iatici...
The above-dam stations tend to resemble each other ecologically
and biological equilibrium is clear-cut. The stations below the
dam differ from each other ecologically and this is reflected in
.the high variance. At the same time, this part of the river can
be considered in biological equilibrium w.ith the environmental
influences.
The. coefficient of variation of 0.05% for non-insects above_
the dam is the lowest value for this statistic ever found by the
consultant. This is an uncommon degree of stability.
-14-.lb,O Coi -
$ k h hJ A |:._2 .
~
. .
,
. -
'
.
. .
Dayhaw's chi-square test *for comparing two sets of chserved
2data was applied to the data. No significant difference (x =2.26).
was found when the total number of species from above the damowas
compared with the total number from below the dam (excluding
Station 5). The same conditions prevailed in a siniilar comparison
of the non-insect component (x =1.55) and the insect component
(x =3.45). However, when the same test was applied to non-insects
versus insects for all stations, exclusive of Station 5, a highly.
significant difference (p=<.01) was found with a chi-square value ,
of 24.56. This significantly different value reflects the ecological
dif ferer.ces between above-dam and bele.a-dam stations.
In a 1967 four-station survey of the Susquehanna River at
Sunbury nu significant differences were found between non-insects
and insec:s. The stations at the Sunbury location were more ,
closely comparable to the a,,bove-dam stations at York Haven than to
the below-dam stations. At the Sunbury location 83 species were
taken in June while 66 species were taken in September, which was a
period of very high water. At Stations 1 through 4 of the York
Haven survey 95 species were collected. This larger number of,
species reflects increased river size and diversity of habitat
2 2 2 2* x =(Ib /n-B fg)3 f;3
-15-.
.
.
*f' s
|
.' -
.
*-.
.
.
between Sunbury and York Haven. Stations 6 through 9 of the,
York Haven survey produced 111 species, reflecting further -
.
Increases in habitat diversity; particularly at Station 9, which.
supported 18 uniqua species.
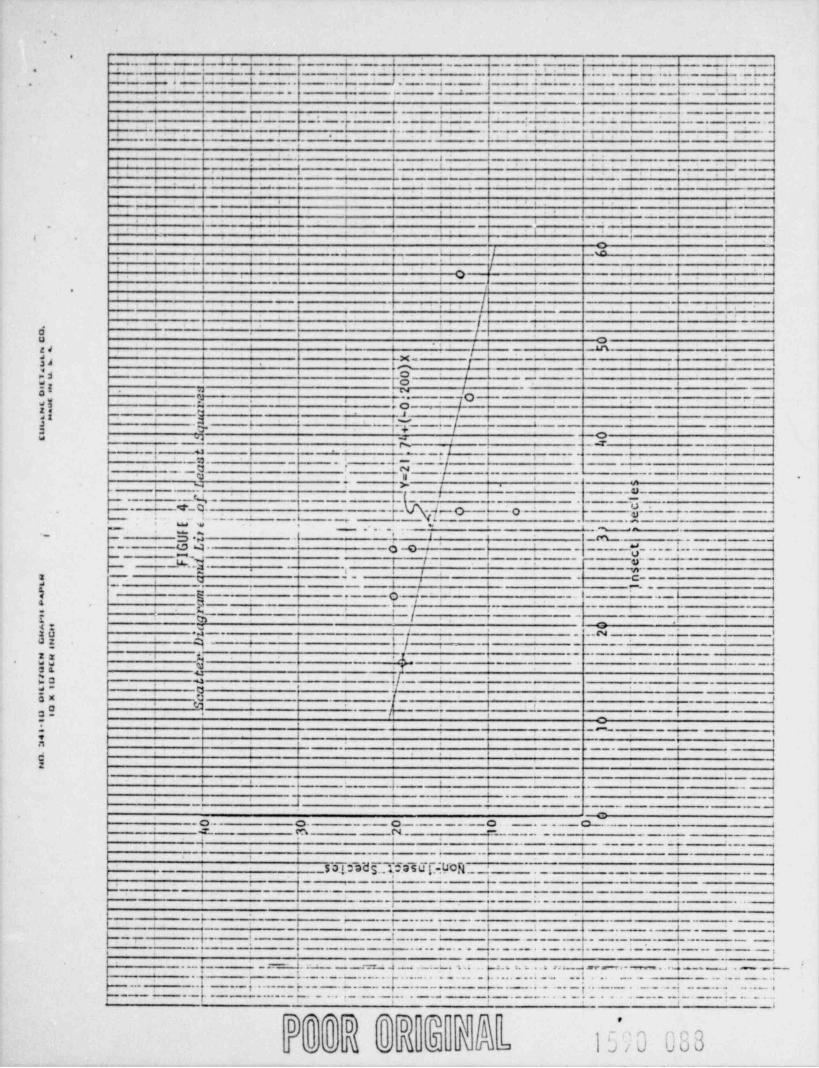
A coefficient of correlation * of 0.542 was found between..
non-insects and insects for all stations exclusive of Station 5,
" Figure 4 presents a scatter diagram of these data as well as
the line of least squares, for which Y=21.74+(-0.200)X. The two
components of the macroinvertebrate fauna reflect, at best, but
moderate correlation and tend to be independent of each other.
. xy .'':NY- (t r.' '.vv '' 2 } / [a ' 5/ _g3 g2;[,;y,2,,,,2;2~8*-.
.
.
O
s
.
O
e
-16-. .,
15'?0 033-
..
$h $$$&
. * * g
e
a
e"
, m
a w
FIGURES
.
O
e
e
e
O
e
e
9
e
- ,O_O/ ,v)- s..i* J UUT
.
6
9
e
b
4
.
..,
.
'
[FIGURE 1,
SUSQUEHANiiA RIWR SURWZ ASEAs Stations indicated as I through 9
e @$- s,
'% M.'. k,
'n nL in' Wto'4
l'@ -
/ l.(/) y \* . DAvaS.2:. LEY'
.
\'o
i
t) J ) ]I(CEEtr/L5'
'O ISLAND
.
' '
ccM?u/AGO,
\ CREE 4:I (ECT)
Q@ f"Oi c '
s
xWRkHAVEN0 1 /11
o
CC,%EltAGJ % *
CREEK
~ .
k*
g, ;, - -N4: M.7:e// 34+ J ,^
y ;gu,3 %* (*SILIT~M~*VQ S.E.s. :tre %
DISO+1RGW ? '
s
n n.
I @'M'ro'e' ca, ,,.,
Q. .,
\a%....__.
L&.
i
ccmw -oe a
Ch[.bCf ,
em o . a ic , y1J/U d)
e
.
- 7._______4_( .. __.3..___-
_...i'
_
i t-
__; '.- - _. ..|..
. _
|_ _ .;, $- . .-- _-- _ . - .,
, 'i
. ..J.L 1 ''
" ' ' ' . . _ _-=
i 3. ' ._
1a i _.
1
N i- g[4--
'm | ----j
--=
' \l- tyt
%
i__,
*.k* '
m - - -
\ !8
--+|
m. . r_ .1 _[ l*
3 ,-]i0 / 3 8
1
I,
, ,
a ,,
* i6 e fI f a
i g
g |4 m i*
zd i f f a 1 sa
W jOd 8 3 Y .-.e
I 33h . i$= g f Ie
g ieW f T* / t '
b I.- wwEn , , u -
,.W F9
- -,fe a, . .
3 i - 4t i / i m
'.c - _ _ _.
. '_
. .i c._ | ..y - ._ y-
2a V --. , . ,,*a- x ,..,
g D..* .*-- N g. 4.*"""
. ,l=
, Ia
-*.Q==. -
g, , ,
'. ) .4 -. _
'
ggg , ; -- - o -,
t- - -.
. g .s. _ .
. . . ' . --;-
.
m .4~ "m .e,
tu %g ~ ;,
-- -, _..; ;
- 4 --.mw f
A, ,4 9 .)- - -=q o-.W
4 i,._ ... -
< ,1 w , --
-t aL g
<: ** Ae
y'. *
'. ,
- . . . _ __n *
{ YM *
Pu , .e x-CZ ,
z'= .Q \ ,
jhg e -- --
--f- de.
, igo ._.\
' '
' '
jX. __ __ \ ' '
_ Jw-If - \ _.-' j9 '
D .g .\ f , f4
T. * a m I
, e*
, e"""*"4
r, f e
..O f , s
g / i i,
/i / e
i
i . . .f . : i . ._f __ -
M 'e '
01
% e 8 5
3f_ i i I, '1
. .e 1
~
.f | '' '4i i .-e
a
'.E | _ g . .!'
O O. OO._ V, .__ _.m
-- ,Om.
. g_-
, . . . --
g p,
._ ..l .~. _i ia ~.-
sopod ...(9;r) .t,e2 o.t ..:01. u. o.m. a _.. _ r_.a|. . . .
,
S-
<,-,
!_. .$ - .,
. ...-
. -- -
- n --,_..._----} _
g.,-. .. - . _ . _ . _
_ . . _ .e
- p_ . . p _. .< j.
OO O *OD D
g* '
l '; i / 0 i i o .- uo1-
cw. c - . :3
.
.
,q....1 .= _ , . _ ._.,
_.3._ -_
. ,.. -_ _ . . . _ . . . _ _
-
__
! l
~_
_ --'.. ._
.
; ' FfGllRE .3-
'. .
'.
y- tv=apf:Da =-K5..cf.i.y . e.sngf.T.r c'M.54a,
. . __t --.._L-- ....
I
'S t a t ion-. Numbe r-- i-'
. ,---r, p. -
,
1 A .' ' , i.
4 00 j , et* . ''3 8'5
''| / I
I ' ~., i
O( l /,y
e i* *
/
6 -123 ' |''
7 178 3 +
8 1.3.1 , , .
.9 149 i h |
--,
D...ggg ,l' s
u , ,
P / I 4
$d - 11
4 , ' 'epg
d2 ---' '
| /3=el I L.*
E4 1 / i
43 . f. ,
,,_ f I l
!-
, . , i
j 4--;
.. .
= . j_. . - - 1,
U l 3 I . 6
'
L/ L . -M~
- g. ' ^, -J' '
- ''
v--~~.?--
- i--/ | i, , , ,-
3 ' Iu. g a...
-~~-~
O-~ /g . i ,
I i L ._ '6 | ' I tQ __
/ e l 6 3n*
; _'g _ __. ..f= - _.
,,, .
--, r- -2
-
i r t/. ,.. 1-- ~.~ , s .
2, v020 ---/
'--|=
.,oz - - - . . y, , ,
22 / , .
l'8 es ""*/ ,3L ' f' * Ig i I ' ' !
f,y-., , , ,
3,. . . ,. mo, , . , ..
. .
'- 'v e , , j- i .- , a
n t . -
4 6 e 4.d ;
, , ,
z , i ., , ,
I I ' f Ir
I I
, .
.v.s_ _
, ,. , ,
_
| | 9,, , ,
; : - .._J; F--
-.,
',' i .
, i_ . . .-. ___,
O L_ __._), i. L .1 i.. ,, , . i-
1-- 2 .H 3 -4 ,5 -. 6 -7 | 8__ 9-~ -
'
-- 3 _.. {t ,. _._
p .y. ; ...}. .- . . . . . . . . .
|- |
_
.._y.. ; - .._.-,
w . .% .6%u. . i. . _ . . . _ -
om m 7 3r } i- | |s u /D s'uD
c h A.i m.wo
.
.
* '4- -e - -& . ~~b' _ . _ ;. _._ ....._. v ....L._.__.. _..l. - [~ -- - . g. .
--
'* ' :-'
' 1 ._a*,
4 t. . L 'j . .. _
_....L.___ .._- __
...
__. __.4-
_,
-}_..___..-
_ ., , ,
_
{ . _ _.. - . . _ .f
-. _
' _._ _ _ . _ . . ..
.'__
-a _.- . _ _ !- _. _, _...
'' q,9
_ _ ., ,,. .__7,
* '-l Aa t i
-i i
'! ! I I t
e. -
| ;-
+ i ' '-p .
,, . , , , i,
e
| g | I & _... e -
t e
( 3 i i i . '.
# 1 8f 5 4
+ i If e e...
D9
i
*. ,
e
d 9 6 e iI
1 9 f, | [e . .
O , , i (U O' A *
L' x . '_g4 L,
aJJ l
_
s. d -O /_
',,,.,_Ie*
-
"I $,' '
ao' , - ,o -- , *
,c. __
d5 4 v024 1
6 _3e
f' ls |, , ,
* I | V f n*y ,
."hs *4 , .-4 , --, ,- .:r
'
- ' ge '
-
- 4. .= I '. '_. -
I'03 .
- -h |
.
M, t- E - -'
-- - _.,
~ , , , ,U
_-'==== % __ L. _ 4 _. _=='
v_ Q. . y'
_' w.. m.._ - - .,
- .po Ho.. .
+.,. .
w f *1 - --- . . . .
* _ D .,a I I ' I
.|# .y
_. ._ a _
_g_..._...---._. e q. o _o, ,
"'~ g~~_, , ,. ..
.a . i # e 'V'~*
3_
C- =, y , , ,d
-..g& 1 l
Q s-4 - - - .
H :-
-r: -. .
--uII. m t
-'ri
<. w .<
2u *.4 - * . -N -.--.
as 7 | r./ -- - ;' '
.
n 2 --,== .
ww e.: i .r --134 , ,%
# I33 .ma -'}I-a- n e
.
3X Q _'
'
'O ',3. . . e :
-' '
,,, . -%* i +,
n * *>
. i . . 1 ii i2. , ,
* ' i i i ti 3 .
. 4* --
,1.
: _ . .J.'-CO .. C. _ - C _.-_--- _O-- - _= '
. C._. '.4. G N.
",I e
*t% .
,
_
----T- -~
,-
4 e ,-.
i
50j.09d y$.. A0 3 5 u 3' . .U. .C _.*
i "" * * " " * * * * " " ' * " " * " ***"", g i
i + t- - | !'
F ; 4_.._.._. -- ,
_t -
'l' _ ._
.._;...__- ;._. . __ A . __.
I
, e t. _ . . . _ . - j _ _. _ __ ;. _ . _ _ . - . - _ _,
.___ . . . . . . . - . . . . . _ . . . . _ . . . i
. . . ' :--| -.--..4_.~. __: 4-..__.s.. . u . ..,
. . , . ... .. .. .._- . .. .. . . _.. _ ...._..... ~. ..! . _. .. . . .
4 j . . . ._ p . . _ . - } _. . . r_ _ _ . ........._.j..-._.~.;. . _ _ . _ . ... ..
-- _... . . . . ,p .
7. ._ . . . _ . . . . . . . _ . . . . _ . . s ...,
4
q._ _
QQ Q .. O /
4 0
4
e *
O
e
O
4
6
I
9
APPENDIX A.
a
9
O
D
ee
e
e
e
O
4e
3 y
1J/v VV/
o
.
O
e
e #
4
a
a
G
4a&
e
.'-
.,
. .
.
-.
.
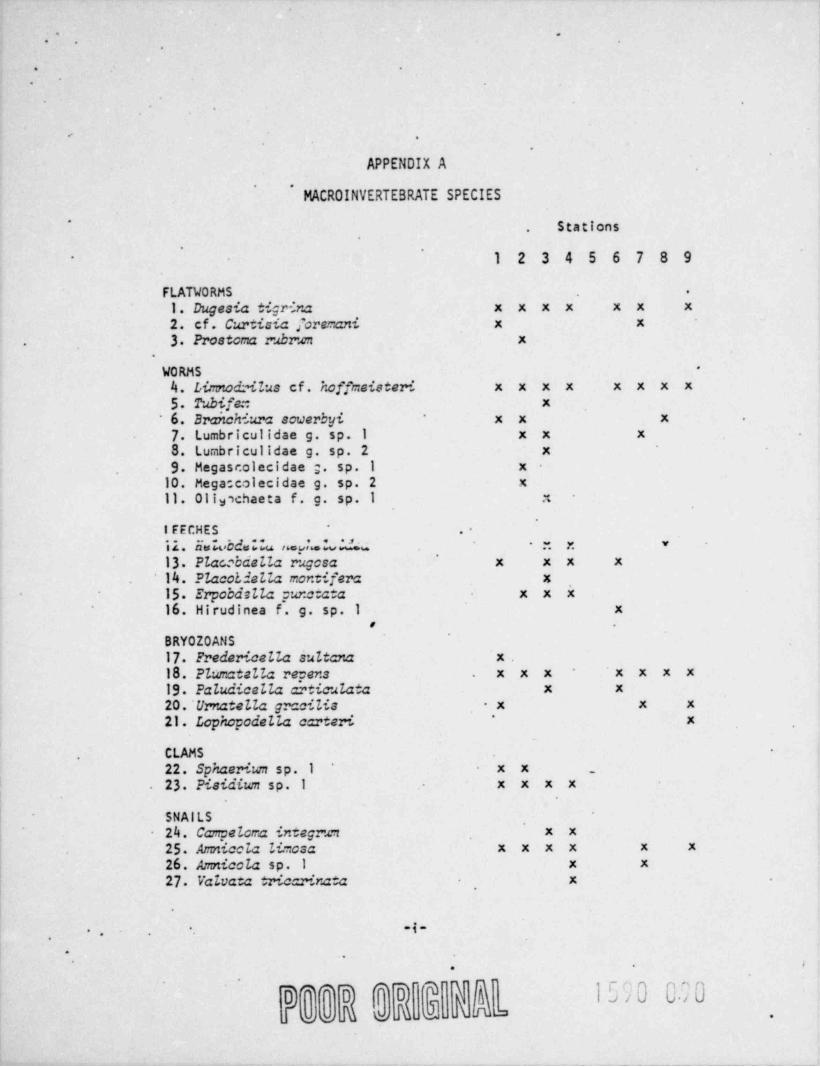
APPENDIX A.
MACR 0 INVERTEBRATE SPECIES
' Stations.
'
1 2 3 4 5 6 7 8 9-
FLATVORMS .
1. Dugesia tigrina x x x x x x x2. cf. Curtisia foremani x x3. Prostcma rubrum x.
.
*
WORMS
4. Limnoddlus cf. hoffmeisteri x x x x x x x x5 Tubife:: x6. Braitchiura scuerbyi x x x .
7. Lumbriculidae g. sp. 1 x x x8. Lumbriculidae g. sp. 2 x9. Megascolecidae g. sp. I x
10. Mega:colecidae g. sp. 2 x11. Oli , chaeta f. g. sp. 1 .x3
IFECHES*
.
ii. Eukbdalk u.v;..L .d.. ~. r. v -
.
13. Placebdella rugosa x x x x
14. Placoldella mon:ifera x15. Erpobdsila punc:ata x x x16. Hirudinea f. g. sp. I x
o
BRYOZOANS
17. Fredericeila suitana x18. Plumatella recens x x x x x x x19. Paludicella a'rticulata x x20.'Urnatella gracilis x x x21. Lophcyodella carteri x'
CLAMS
22. Sphaerium sp. 1 x x _
'
23. Pisidium sp. 1 x x x x
SNAILS24. Campelcma integr'.ct x x25. Amnicola limosa x x x x x x26. Amnicola sp. 1 x x27. Valua:a tricarinata x
.{-..,.
.
.
*/
.'.
'.
.
.- - .--.--.
.
.
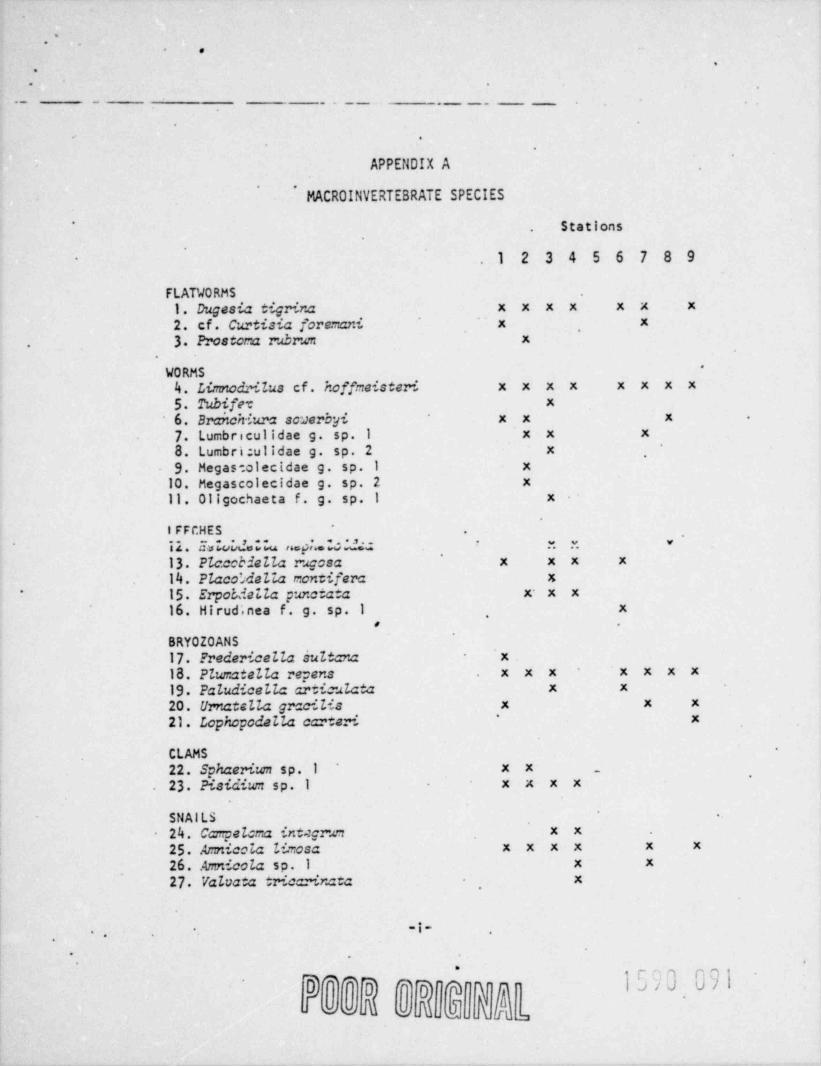
APPENDIX A.
MACR 0 INVERTEBRATE SPECIES
Stations'
.
* 1 2 3 4 5 6 7 8 9
FLATVORMS1. Dugesia tigrina x x x x x x x
2. cf. Curtisia foremani x x3. Proscor a rubrum x
.
-
WORMS
4. Limnodritus cf. hoffbeisteri x x x x x x x x5. Tubife x6. Branch +.wa soverbyi x x x -
7. Lumbriculidae 9. sp. 1 x x x
8. Lumbri ulidae g. sp. 2 x,
9. Megastolecidae 9. sp. I x10. Megascolecidae g. sp. 2 x11. Oligochaeta f. g. sp. I x
IFFCHES~
.
12. Estubda;la n.9' M 'de - * r. r. **
13. Plce:biella rugosa x x x x14. Placo',deLIa contifera x15. ErpoMella punc:ata x- x x*
16. Hirud'.nea f. g. sp. 1 x,
# .
BRYOZOANS~
17. Fredericella sultana - x18. Plumatella recens x x x x x x x19. Paludicella ai'ticulata x x20. Urnatella grac'Lis x x x
'
21. Lophopodalla carteri x
-
CLAMS
22. Sphaerium sp. I x x _*
23. Pisidium sp. I x x x x
SNAILS .
24. Campel :n int.:grum x x
15. k:niccia limosa x x x x x x26. Amnicola sp. I x x
27. Valuata tricarinata x,
-l-'
. .
,
.
d yg 1550 091D*o o
b..Niido* *' a
~.
*.
.
.
~.
-.
Stations*
1 2 3 4 5 6 7 8 9.
SNAILS, cent'd.28. Gonicbasis virginica x x x x29. !!itocris carinatus x x x
x x x x x x x x x30. Physa heterostropha31. Ferrissia tarda x x x x x x x x
x x x32. HeLiscma anceps *
x x33. Helisoma tricoivis34. Gy m ius sp. 1 x x x x
35. Gyrautus sp. 2 x. x x x xx x
36. L2::naia h:ctiZus
CRAYFISHx x x37. Orconcoces sp. 1
,
.
S0WBUGx38. Aselius cor:mmia
SCUDS39. Hy.:lella azteca - x x x x x
x x40. Gar:rarus facciatus41. Crargonya gracilia x x x
HAYFLtES ,
x42. He :cgenia sp. I '
43. 5tenonema sp. 1 x x x x .
44. Stenonema sp. 2 x x x x xx x x45. Scencnema sp. 3 ,
x x46. Stenonema sp. 4k x47. Stencnema sp. 5 x48. Stencnema sp. 6
49. Isonychia sp. 1 . x50. Tricorsthedes sp. 1 x
.
x x51..Tricorsthodes sp. 2 .
x x52. Tricorsthodes sp. 3 x53. Tricorsthedes sp. 4 x54. Tricorithodes sp. 5 ~ x55. Tricorschedes sp. 656. Leptohyphes sp. 1 x
x x57. Caenis sp. 1x58. caenis sp. 2x x59. Cacnis sp. 3x x60. Caenis sp. 4 x
61. Caenis sp. 5 x62. Pseudocicecn sp. 163. Baecinae g. sp. I x x x x x
.
-11-.
.
'' '
.
.'.
-. ,
.
. .
.
Stations..
1 2 3 4 5 6 7 8 9-.
'
MAYFLIES, cont'd.64. Baetinae g sp. 2 x x
..
65. Baetinae g. sp. 3 x66. Baetinae g. sp. 4 x x x67. Baecinae 9. sp. 5 x
DRAGO|lFLIES68. Macro:nia sp. 1 x69. NeurocorduLia sp. 1 x-
.
DAMSELFLIES '
70. Argia sp. 1 x x x-.
71. EnaIZag a sp. I x72. Enalap a sp. 2 x. x
, '
73. Enallag a sp. 3 x x74. Enatlap.= sp. 4 x-
75. ef. Te!caIIar a sp. I x76. Ischnura sp. 1 x x x x x77. Ischnura sp. 2 x x x x x
a x x75. Io&c : . }'79. Ischn wa sp. 4 x x x x80. Ischraea sp.5 x x x. x x81. East 6.~~na sp. 1 x x x x x x
.
VATER STRIDERS AND WATER BUGS8'. Gerris sp. 1 x x x x x83. Metrobates sp. I x x84. Rhew.atabates sp.1 x .x x x85. Trepobates sp. 1 x x x x86. Trepoba es sp. 2 x x x x x x87. Trepobates sp. 3 x.
88. Mesovelia muisanti x x x x x x x x89. Selcstor.a sp. I x x90. Microvelia sp. I
_
'x -
x91. Corixinae g. sp.1
,
CADDISFLIES92. Hydropsyche sp. 1 x x x x x x x x93. Triaenodes sp. I 2. x x x x94. Oecetis sp. 1 x x95. Cecatis sp.2 x96. Athrigsodes sp. 1 x x97. Rhyacophila sp. 1 x98. Neureclipsis sp. 1 x
,
.
r, - 7*.ggg. ,
Jc-a>J u J
em
P]Dh3'Thg D
oJuuS..kini:o o Ju 2
. .- ,
,
.
*.
.
.
Stations
1 2 3 4 5 6 7 8 9' *
MIDGE LARVAE, cont'd.130. Cricotcpus fuga: x131. Cricotopus slossonae x- x
. 132. Cricotcpus sp. I x x x x x x133. Orthociadius dorecas x134. Orthocladius carlatus x x x135. 2"e.alassc=gia obscurus x x'136. Tanytarsus e=igua x x x x x x x137. Tanytarsus flavipes x x138. Tanytarsus sp. I x x139. Polypedilun illinoense x x x x x x x x x140. Stictcchironceas sp. I x141. Chironomus jucundus x142. Chironc~:us ricarius x x' x x x|43. Chironc=as ab'rtivao x144. Chironc=.ts nais x145. Chironc=as nr. fulvus x x x x146. Chiron;=as sp. 1 x x x x147. Glyptatendiges dreisbachi x x x x148. Glucutendices colutc=as x x x x149.Gliptetendiges'senitis x x x x
. .
8888888
.
.
.
.
e
e
.y.
* *. ;
j
.-'
e
.
.
.
. . ._ __ _ _ - - . . . _ . . . _ . . _ . - Stations
1 2 3 4 5 6 7 8 9
HOTHS99. Percpoync sp. I x x
100. Parcrgyractis sp. 1 x.
*
LARVAL BEETLES '
. 101'. Berosus sp.1 x x x102. Elmidae g. sp. I x x x103. Elmidae g. sp. 2 x x x104. Elmidae g. sp. 3 x10⁵. Elmidae 9. sp. 4 x
x106. Elmidae g. sp. 5107. Eubrianca sp. 1 x x.
ADULT BEETLES108. Berosinae g. sp. 1 x x109. Egdrochus sp. I x x x x x x110. E opi.:ternus sp. I x111. Lacco~ hilus sp. 1 x112. Peltodytes sp. 1 x113. Stens?.wis 'sp. 1 x x x x114. Stene M s sp. 2 5 x x y
115. Scenc7. mis sp. 3 x116. Stencimis sp. 4 x4 I '# . h ?".4'M4 [l|T$3 30. 3
- *
118. Stenelmis sp. 6 r.
119.. Doncc'.c sp. I x.
BLACKFLY120. SimuZi:ca sp.1 x x x x x x
,
DANCEFLY .
121. Empididae g. sp. 1 x x .x x x
.
HORSEFLY122. Chrysops sp. 1 x.
/
MIDGE LARVAE ,
123. Tanypus melancys grp. u n x x
124. Tcnypus monitis grp. x x x .x .
x125. Tanypus carnec126. Procladius caliciformis x x
x x x x127. Procicdius rip rius128. Clinotanovus ::t,racius .x129..?sectrockiius nigrus x x x x
~
-iv-
-. .
.
]"20 095'
'
D**D *
T' }km1.g '
oc o
'.
.
.
%
A BIOIOGICAL SURVEr OF TIE SUSQUEHANNA RIVER
IN THE 7ICINITY OF YOPZ HAVEN, PA.
1968 PROGRESS REPORT
.
prepared for
PENNSYL7ANIA PCWER & LIGHT CCMPANY
ara
METRCPOLITAN EDISCN COMPANY
by
. . -
Charles B. WurtzConsulting Biologist
La Salle CollegePhiladelphia, Pa.
,
submitted
24 January 1970 -
-'F ^ G, [J1 F; UJ/v <
s
e
'
.
.
.
CONCitJSIONS
1. The York Haven area of the Susquehanna River produced
119 species of macroirrrertebrate species (botten organisms)
in 1968. The co= parable 1967 surrey produced 11+5 species.
2. Differences in biological structure between 1967 and
1968 are presented, and these generally indicate, statistically
significant differences between the two years.
3 In 1968 the river appeared biologically depressed
over 1967, and this was chiefly associated with a reduction in
the insect fauna.
h. One cause for the obserted changen would be the con-
tirmous low flow to the river for an extended period of time
during 1968.
5 There are strong indications that the river suffered
frge the introduction of a toxicant during the su=mer of 1968.
6. The area of biologicel depression extended from Station
2 through Station 8. Station 9. the west end of Haldeman Riffle,
did not appear strongly affected.
.
e
7r, ^ ~Il ,nJ' U-J
.
. '
.
.
A BI0IfGICAL SURVET OF THE SUSQUEHANIA RIVER
IN THE VICINITY OF YOPZ HAVEN, PA.
INTRODUCTION
This surrey was the second biological surtey undertaken in
the interest of the Pennsylvania Power & Light Company and the
Metropolitan Edison Company. The surrey represents a study of
the macroi:rtertebrate fauna (bottom organisms) at each of a
series of eight stations. Field work extended from August 12
through August 20, 1968.
STATICIS
Eight stations (sa=pling sites) were collected. The
locatien of each station was irdicated on Figure 1 of the first
progress report submitted August 9,1968. The statiens studied
are listed below.
Station 1. This station was in the riffle area above
Three Mile Island and between the head of Fall Island and the
eastern shore. Along the eastern shore the substrate contained
anaerobic pockets.
Station 2. This station was between the northern tips of
Three Mile Island and Shelley Island.
Foq n^''.3 ,J Uiu
.
..-
.
. .
Station 3 This station extended from the southern tip of
Shelley Island to the western shore of Three Mile Island at the
" Bali Lai" su=mer cottage.
Station 4. This station extended from the southern tip
of Shelley Island to the southern tip of the next island west
of Shelley Island.
Station 5 This station, included in the first survey, has
been deleted from the program. However, the original station
numbers are retained to facilitate comparisons between the
reports to date.
Station 6. This station was located along the western shore
of the river above the mouth of the Conewago Creek diversion
chamel that skirts the nortt.ern edge of the Brunner Island
Plant site.
Station 7 This station was located between the northern
tip of Halde=an (=Elliot) island and the eastern shore.
Station 8. This station wac located along the western shore
of the river about one mile below the discharge canal of the
Brure.er Island Plant.
Station 9 This station was located at, the western edge of
Haldeman Eiffle above the mouth of Codorus Creek.
1,;;0 0?9-2-
.~
.
.
.
WATER QUALITY
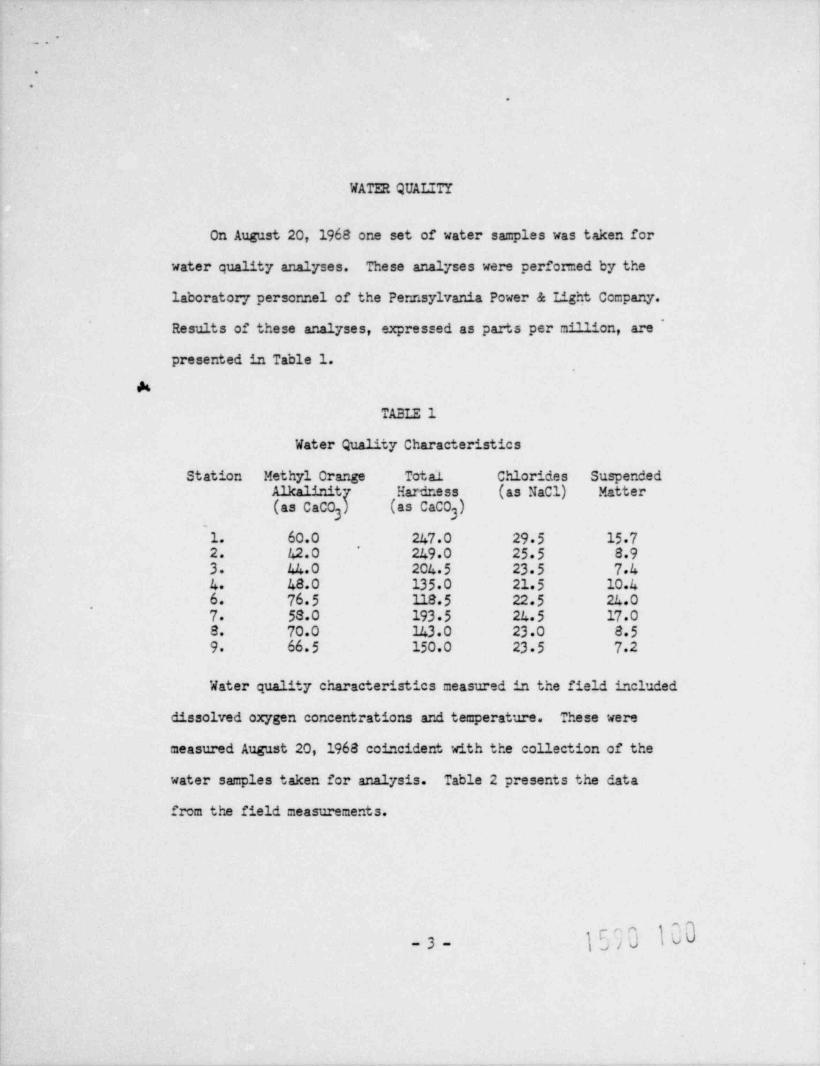
On August 20, 1968 one set of water samples was taken for
water quality analyses. These analyses were perfor=ed by the
laboratory personnel of the Pennsylvania Power & Light Ccmpany.
Results of these analyses, expressed as parts per m4'14cn, are
presented in Table 1.
k
TABLE 1
Water Quality Characteristics
Station Methyl Orange Total Chlorides Suspended
Alkalinit/ Hardness (as Nacl) Matter*
(asCaCO) (asCaCO)3 3
1. 60.0 247.0 29 5 15 7'2. 42.0 249 0 25.5 -8 9
3 44.0 204 5 23.5 744. 48.0 135 0 21 5 10.46. 76.5 118 5 22.5 24.07. 58.0 193 5 24 5 17 08. 70.0 143.0 23.0 8.59 66.5 150.0 23 5 72
Water quality characteristics measured in the field included
dissolved oxygen concentrations and temperature. These were
measured August 20, 1968 coincident with the collection of the
water samples taken for analysis. Table 2 presents the data
from the field measurements.
){]0 \-3
.
.
.
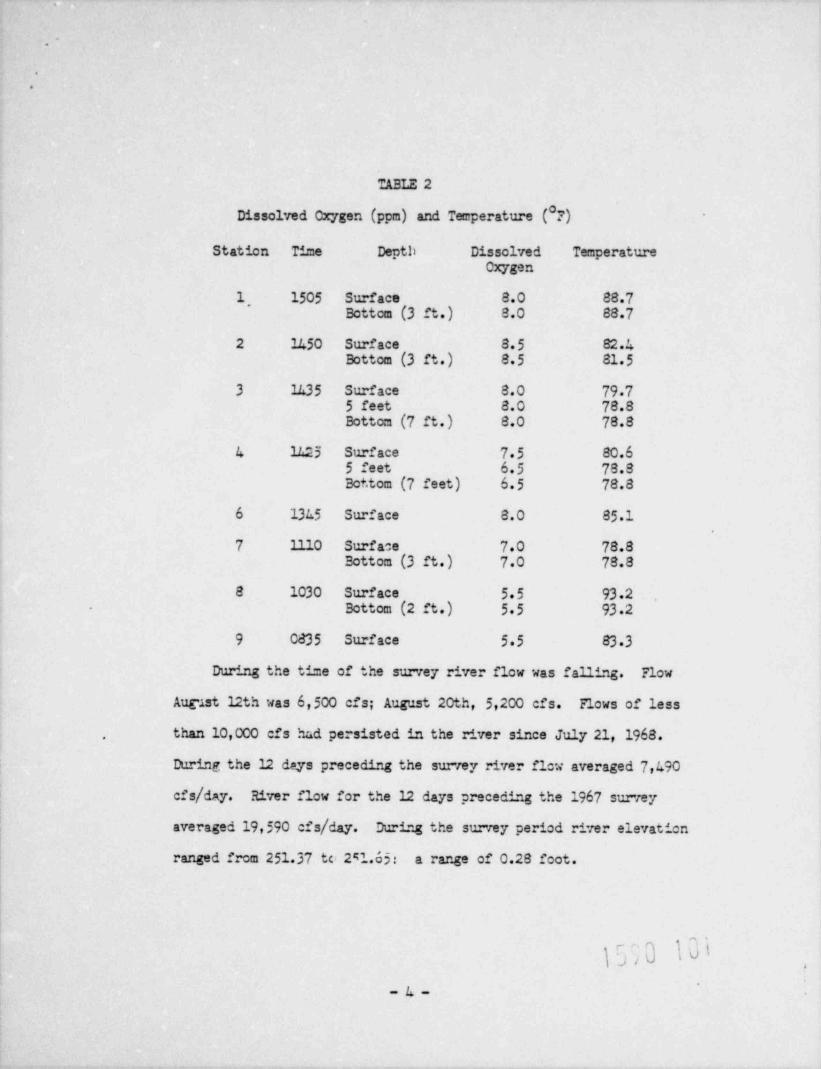
TABLE 2
Dissolved Oxygen (ppm) and Temperature ( ?)
Station Tine Deptb Dissolved TemperatureOxygen
1' 1505 Surface 8.0 88.7Bottom (3 ft.) 8.0 88 7
2 1450 Surface 8.5 82.4Bottom (3 ft.) 85 81 5
3 1435 Surface 8.0 79.75 feet 8.0 78.8Bottom (7 ft.) 8.0 78.8
4 1L25 Surface 7.5 80.65 feet 6.5 78.8Bot. tom (7 feet) 6.5 78.8
6 13L5 Surface 8.0 85 1
7 1110 Surface 7.0 78.8Bottom (3 ft.) 7.0 78.8
8 1030 Surface 5.5 93.2Bottom (2 ft.) 55 93.2
9 0d35 Surface 55 83 3
During the time of the survey river flow was falling. Flow
AuE.ist 12th was 6,500 cfs; August 20th, 5,200 cfs. Flows of less
than 10,000 cfs had persisted in the river since July 21, 1968.,
During the 12 days preceding the survey river ficw averaged 7,L90
cfs/ day. River flow for the 12 days preceding the 1967 survey
averaged 19,590cfs/ day. Durdr.g the survey period river elevation
ranged from 251.37 tc 251.65: a range of 0.28 foot.
,.
4
-u-
.-
.
.
)
BIOLOGICAL COLLEC"'ICUS
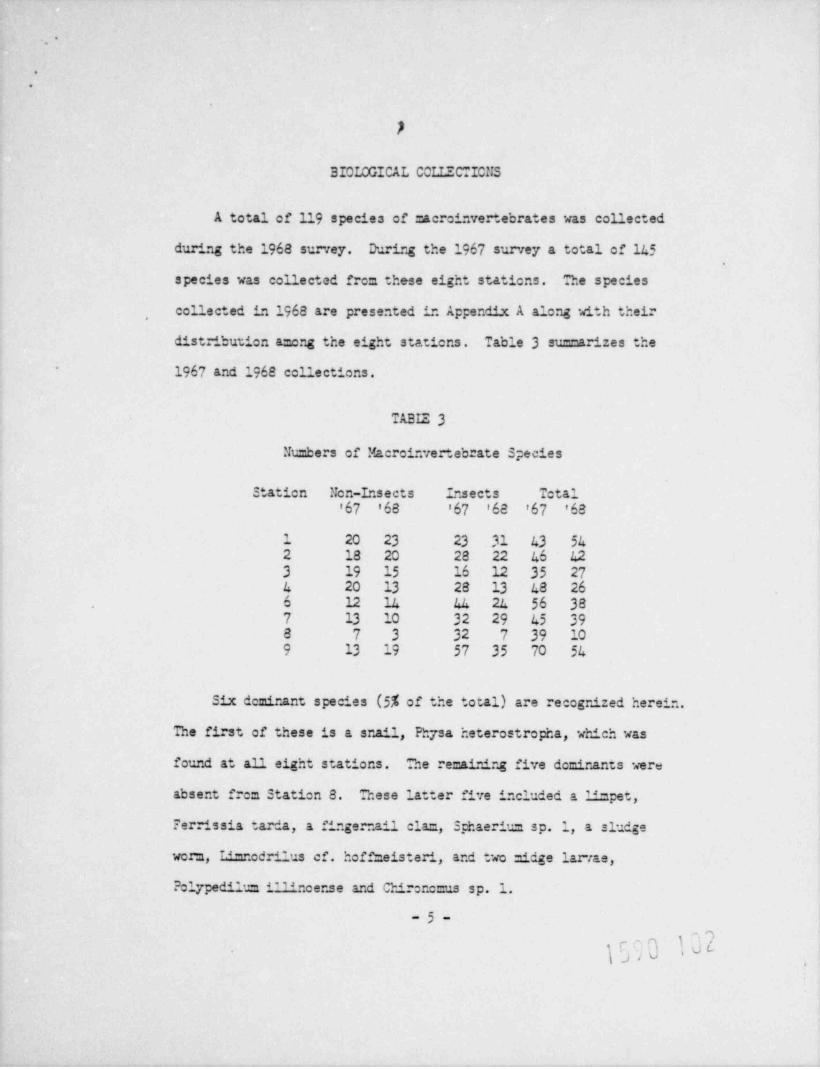
A total of 119 species of =acroinvertebrates was collected
during the 1968 survey. During the 1967 survey a total of 145
species was collected frc= these eight stations. The species
collected in 1968 are presented in Appendix A along dth their,
distribution a=cng the eight stations. Table 3 su==ar_4:es the
1967 and 1968 cc11ections.
TABIZ 3
Nu=bers of Macrcinvertebrate Species
Station Non-Insects Insects Total'67 '68 '67 '68 '67 '68
1 20 23 23 31 43 542 18 20 28 22 46 L23 19 15 16 12 35 274 20 13 28 13 L8 266 12 lh 44 2a 56 387 13 10 32 29 45 398 7 3 32 7 39 109 13 19 57 35 70 56
Six dcminant species (5% of the total) are recognized herein.
The first of these is a snail, Physa heterostropha, which was
found at all eight stations. 3e re=aining five dc=inants were
absent fres Station 8. Sese latter five included a limpet,
Ferr.d ssia tarda, a fingernail cla=, Sphaeriu= sp.1, a sludge
worm, Li=nedrilus ef. hoffneisteri, and two =idge larvae,
Polypedil.:n 1111ncense and Chirenc=us sp.1.
-5-. _ ,
--n 1
,'
J iuLJi
4
.
.
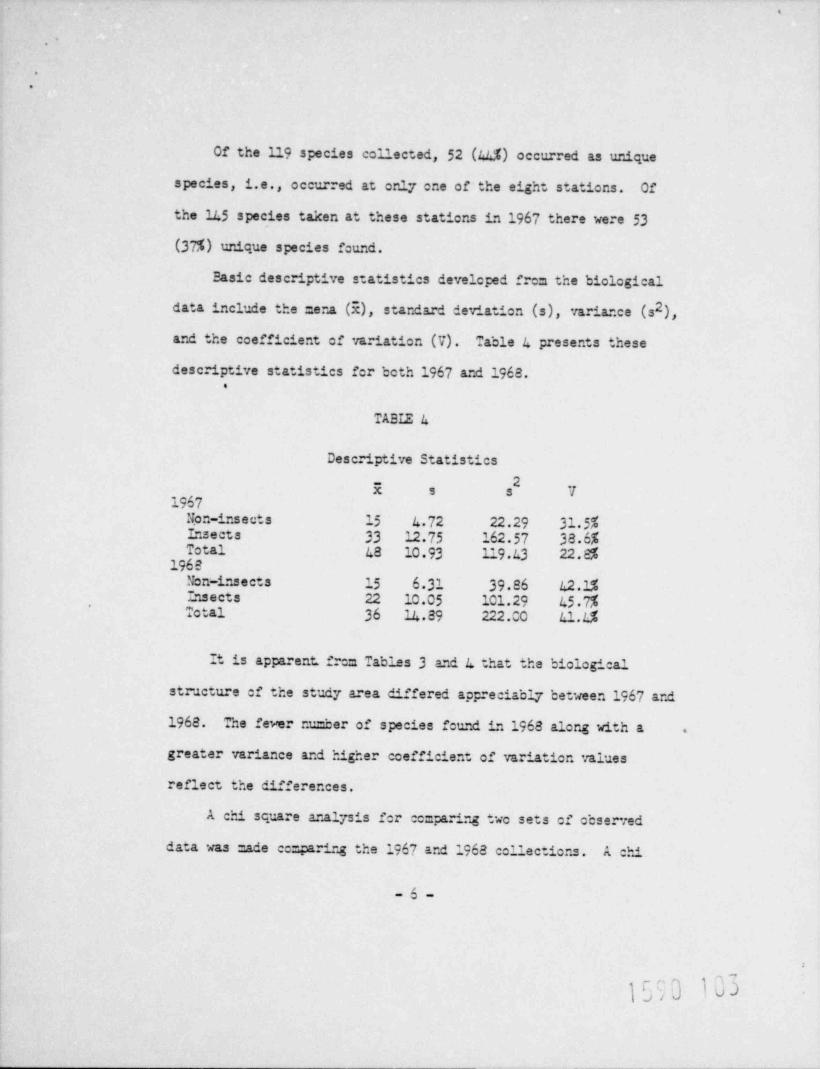
Of the 119 species collected, 52 (44%) occurred as urlque
species, i.e., occurred at only ene of the eight stations. Of
the 145 species taken at these stations in 1967 there were 53
(375) unique species found.
Easic descriptive statistics developed frem the biological
data include the mena (E), standard deviation (s), variance (s ),2
and the coefficient of variation (V). Table a presents these
descriptive statistics for both 1967 and 1963..
TABLE 4
Descriptive Statistics
2-
x s s V1967
N.on-insects 15 L.72 22.29 31.5%Insects 33 12.75 162.57 3a.6%Total 48 10.93 119.13 22.e5
1968Non-insects 15 6.31 39.e6 42.1%Insects 22 10.05 101.29 L5.7%Total 36 14.89 222.00 El.L%
It is apparent, frem Tables 3 and L that the biological
structure of the study area differed appreciably between 1967 and
1968. The fever r"-ber of species fcund in 1968 along with a .
greater variance and higher coefficient of variation values
reflect the differences.
A chi square analysis for ec= pari.g two sets of observed
data was nade ec= paring the 1967 and 1968 collections. A chi
-6-
^~g
l '- eJ,qJ tu3
.~
.
.
square value of 19.93 was found with p=0.005-0.010. This is
statistically significant. A chi square test was also done
comparing the insect fauna of 1967 with that of 1968. The
derived chi square value was 18.59 with p=0.005-0.010, which
is also statistically significant. A chi square test done to
ec= pare the 1967 non-insect fauna with the 1968 ncn-insect
fauna produced a chi square value of 5.44 with p=0 500-0 750.
Obviously, no significant difference occurred between these
two collections.
Using rank order correlation analysis (Spear _.an rho) no
correlation was found between the non-insects and insects for
either 1967 (rho ==-0.683) er 1968 (rhc=0.52i).
Correlation analyses were =ade c:= paring .the dist:"bution
of organisms a=ong the stations for the two years. No correla-
tien was found (rho =0 375) for the total nu=ber of species
taken at the stations for 1967 versus 1968. Further, no correla-
tion was found for the insects alone (rhc=0 393) er the non-insects
alone (rho =0 5AS).
It is apparent that the chief difference between the 1967
and 1968 collections rests with the insect ec=panent of the
fauna rather than the non-insect ec=ponent (Species 1-38 of
Appendix A).
-7-
19 z1iennJs'J tur
'.
.
.
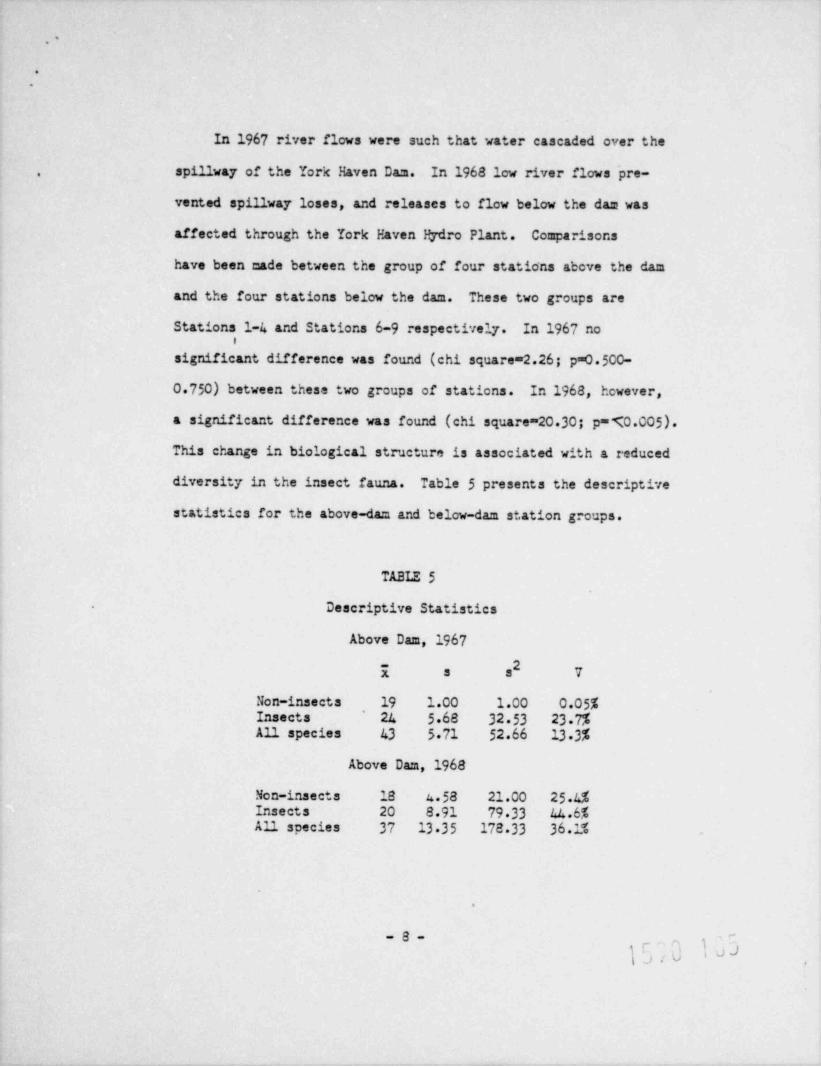
In 1967 river ficws were such that water cascaded over the
spillway of the York Haven Dam. In 1968 low river flows pre-,
vented spillway loses, and releases to flew below the dam was
affected through the York Haven R7 ro Plant. Co=parisonsd
have been made between the group of four static'ns above the das
and the four stations below the dam. These two groups are
Stations 1-4 and Stations 6-9 respectively. In 1967 not
significant difference was found (chi square =2.26; p=0 500-
0 750) between these two groups of stations. In 1968, hcwever,
a significant difference was found (chi square =20 30; p= t0.005).
This change in biological structure is associated with a reduced
diversity in the insect fauna. Table 5 presents the descriptive
statistics for the above-dam and below-dam station groups.
TABIZ 5
Descriptive Statistics
Above Dam,1967
2I s s 7
Non-insects 19 1.00 1.00 0.05%Insects 24 5.68 32 53 23.7%All species 43 5 71 52.66 13 3%
Above Dam, 1968
Non-insects 18 4 58 21.00 25 4%Insects 20 8.91 79 33 44.6%All species 37 13 35 178 33 36.1%
.
-8-_ , ,
"
)J.d IJ
'.
.
.
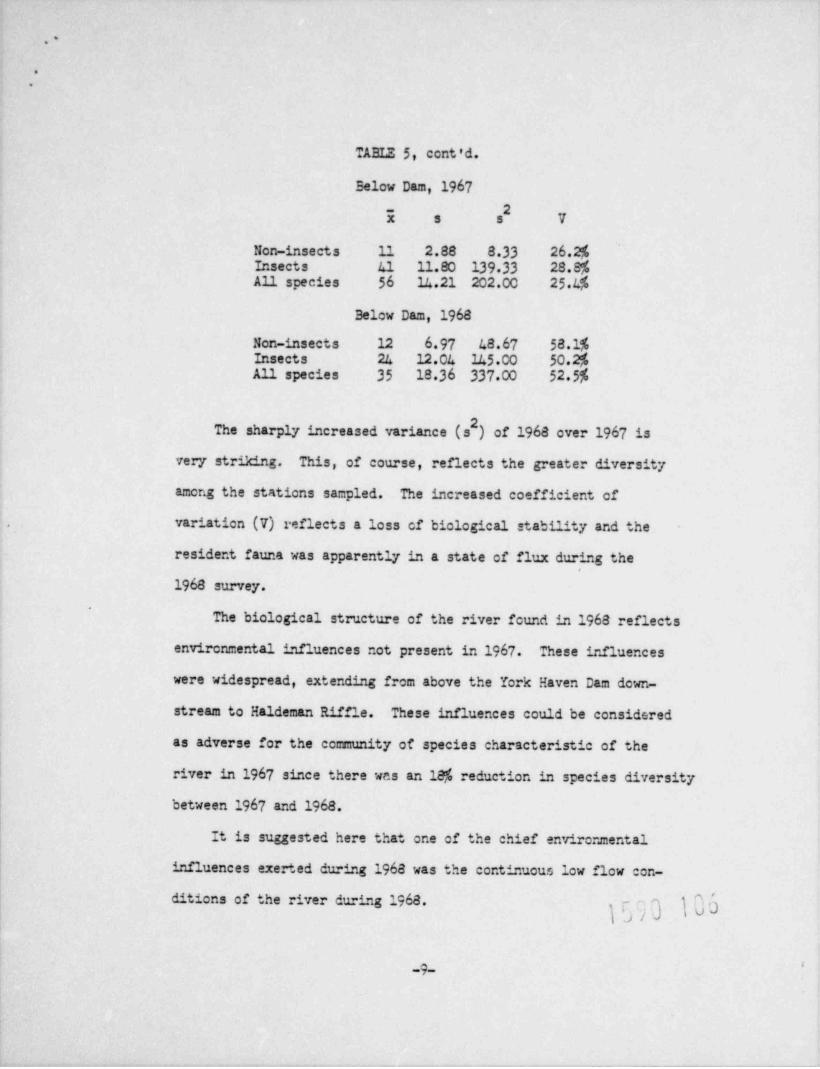
TABI2 5, cent'd.
Selow Dam, 1967
ic s s 7
Non-insects 11 2.88 8.33 26.2%Insects 41 11.80 139 33 28.8%All species 56 14.21 202.00 25.L%
Below Dam, 1968
Non-insects 12 6.97 48.67 58.1%Insects 24 12.04 145.00 50.2%All species 35 18.36 337.00 52.5%
The sharply increased variance (s ) of 1968 over 1967 is
very striking. This, of course, reflects the greater diversity
among the stations sampled. The increased coefficient of
variation (V) reflects a loss cf biological stability and the
resident fauna was apparently in a state of flux during the
1968 survey.'
The biological structure of the river found in 1968 reflects
environmental influences not present in 1967 These influences
were widespread, extending from above the York Haven Dam down-
stream to Haldeman Riffle. These influences could be considered
as adverse for the ecmmunity of species characteristic of the
river in 1967 since there was an 18% reduction in species diversity
between 1967 and 1968.
It is suggested here that one of the chief environmental
influences exerted during 1968 was the continuous low flow con-
ditions of the river during 1968. } }}h
'-9-
.
.
.
With low-flew conditions the securing of substrate material
is much reduced. This permits the deposition of silt, which is
physically limiting to many bottom organisms. In addition,
continuous low ficw would severely linit the transpcrt and.
diotribution of organisme.
Low flew conditions would also permit stronger local effects
from discharges entering the river. For example, the discharge from
the Brunner Island Plant would more centinuously inundate Station
8, which is in the mixing :ene. At the time of this survey,
however, lethal te=peratures were not found at Staticn 8.
Reference to Table 2 shows that en August 20, 1968 there was
a ten-degree drop between Stations 8 and 9, indicating that the
west end ,af Haldeman Riffle is not subject to abnormally high
temperatures that would be biologically licdting. Station 9
had the same diversity (5A species) found at Station 1 above
Three=ile Island.
Some field observations seemed to indicate a recent toxic
affect in the river. For example, at Statien 4 on August 14th
numerous unienid clu:s (Anodonta cataracta) were found dead. A
few of these had died so recently that muscle tissue was still
attached to the inner surface of the shell valves. Such tissues
usually deccepose within a few days after death.
~
-10-
G 1^7I ''/ U io/J
.
.
.
Statiens 2 through 4, located in the pool of the York Haven
Dam, had sc=e oil or oil-like substance entrained in bottem
materials. The exact nature of this caterial, and its
extent over the bottom of the pcol, was not investigated.
Extensive stands of rcoted aquatic vegetation indicated that
much of the bottem was not affected by this caterial.
ib/b b
-11-,
e
$
=
APPDIDIX A
- , n
Y |
.
.
.
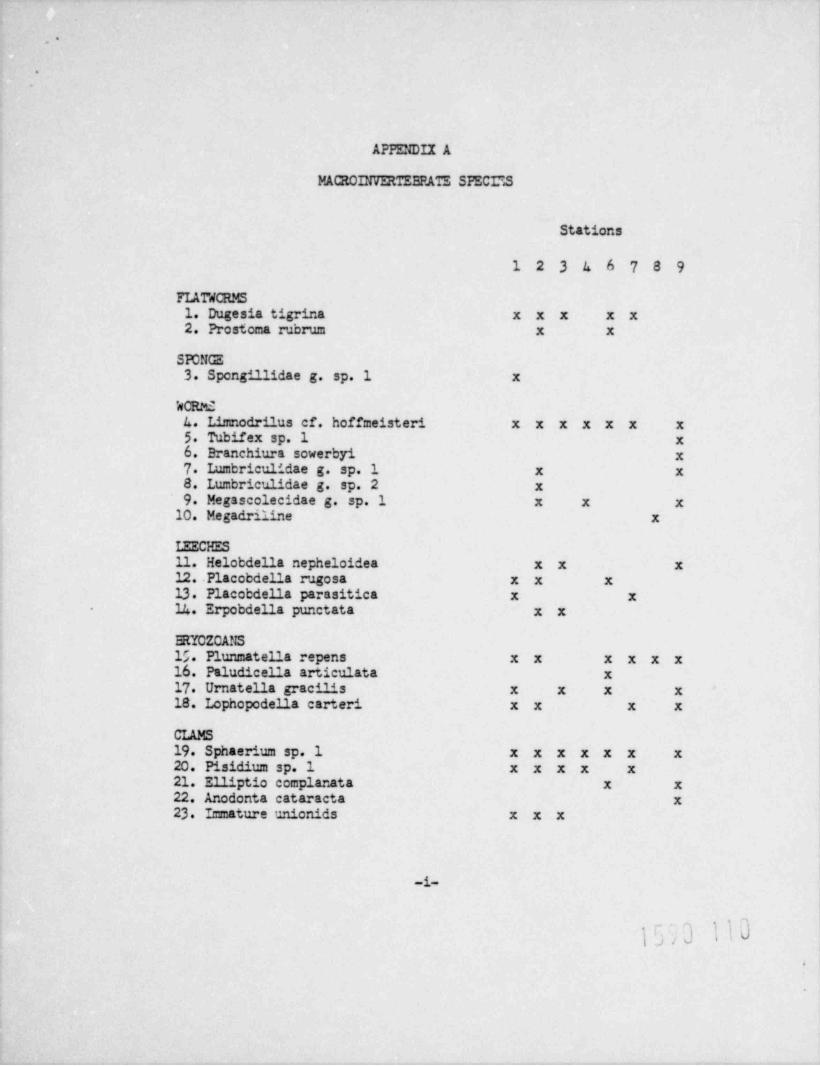
APPENDII A
PACROINVERTEEPAIS SPECI"3
Stations
1 2 3 h 6 7 8 9
FIATWCRMS1. Dugesia tigrina x x x x x2. Prestoma rubrum x x
SPONGE
3. Spongillidae g. sp. 1 x
'dCRP2L. Ihnodrilus ef. hoffmeisteri x x x x x x x5. Tubifex sp. 1 x6. Branchiura sowerby1 x7. Lumbriculidae g. sp. 1 x x8. Lumbriculidae g. sp. 2 x9. Megsscolecidae g sp. 1 x x x
10. Megadriline x
LEECHES11. Helebdella nepheloidea x x x12..Placobdella rugosa x x x13. Placobdella parasitica x x14. Erpobdella punctata x x
ERYOZCAIS15. Plunmatella repens x x x x x x16. Paludicella articulata x17. Urnatella gracilis x x x x18. Lophopodella carteri x x x x
CLAMS
19. Sphaerium sp. 1 x x x x x x x20. Pisidium sp. 1 x x x x x21. 711dptio complanata x x22. Anodonta cataracta x23. I= mature unionids x x x
-1-
. 3 a_ .,
J , v
,
.
.
.
Stations
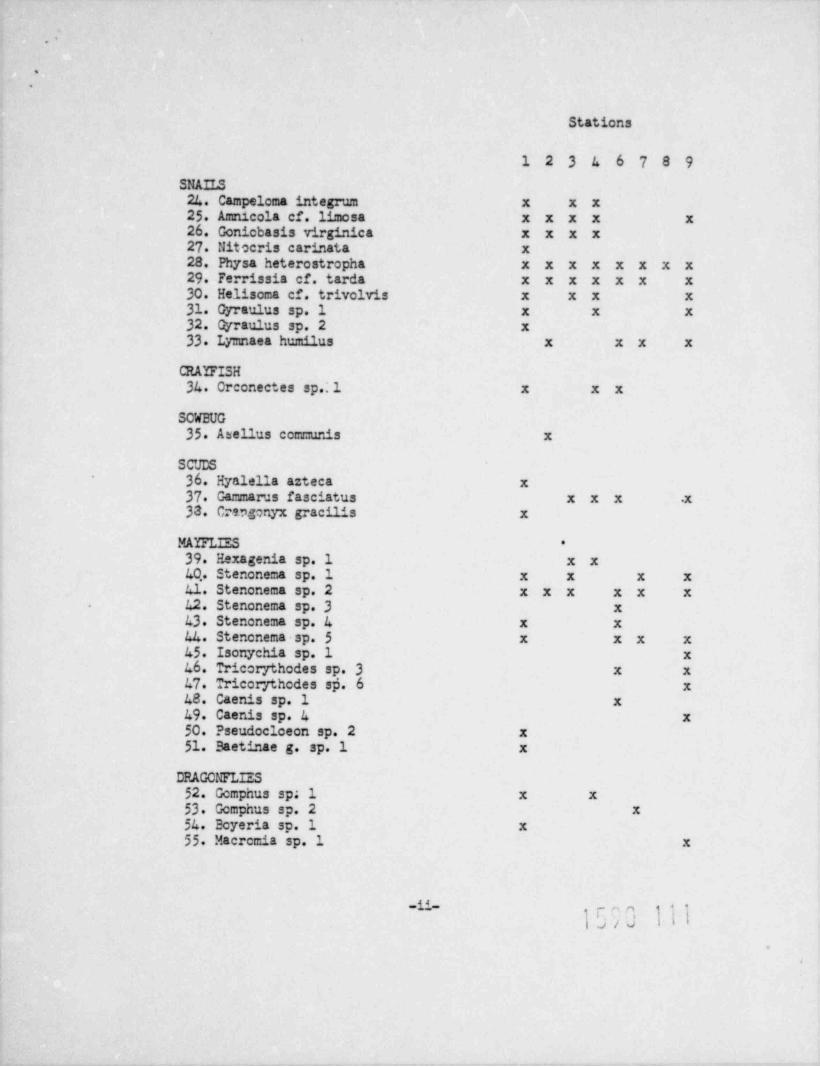
1 2 3 4 6 7 8 9SNAILS24. Campelema integrum x x x25. Amnicola ef. limosa x x x x x26. Gonicbasis virginica x x x x27. Nitocris carinata x28. Physa heterostropha x x x x x x x x29. Ferrissia ef. tarda x x x x x x x30. Helisema ef. trivolvis x x x x31. Gyraulus sp. 1 x x x32. Gyraulus sp. 2 x33. Lymnaea humilus x x x x
CRAYFISH34. Creenectes sp. 1 x x x
SCWBUG35. Asellus cem=unis x
SCUDS36. Hyalella a::teca x37. Gammarus fasciatus x x x .x33. Crtngenyx gracilis x
MAlTLIES *
39. Eexagenia sp. 1 x x40,. Stenene=a sp. 1 x x x x41. Steneneca sp. 2 x x x x x x42. Stenenema sp. 3 x43. Stenenema sp. A x x44. Stenenema sp. 5 x x x x45. Isonychia sp. 1 x46. Tricorythodes sp. 3 x x47. Tricorythedes s;i. 6 x48. Caenis sp. 1 x49. Caenis sp. A x50. Pseudociceen sp. 2 x51. Baetinae g. sp. 1 x
DRAGONFLIIS52. Ocmphus sp; 1 x x53. Gemphus sp. 2 x54. Ecyeria sp. 1 x55. Macremia sp. 1 x
-11- 4 a,s n
lb/J II
.-
.
Stations
1 2 3 4 6 7 8 9
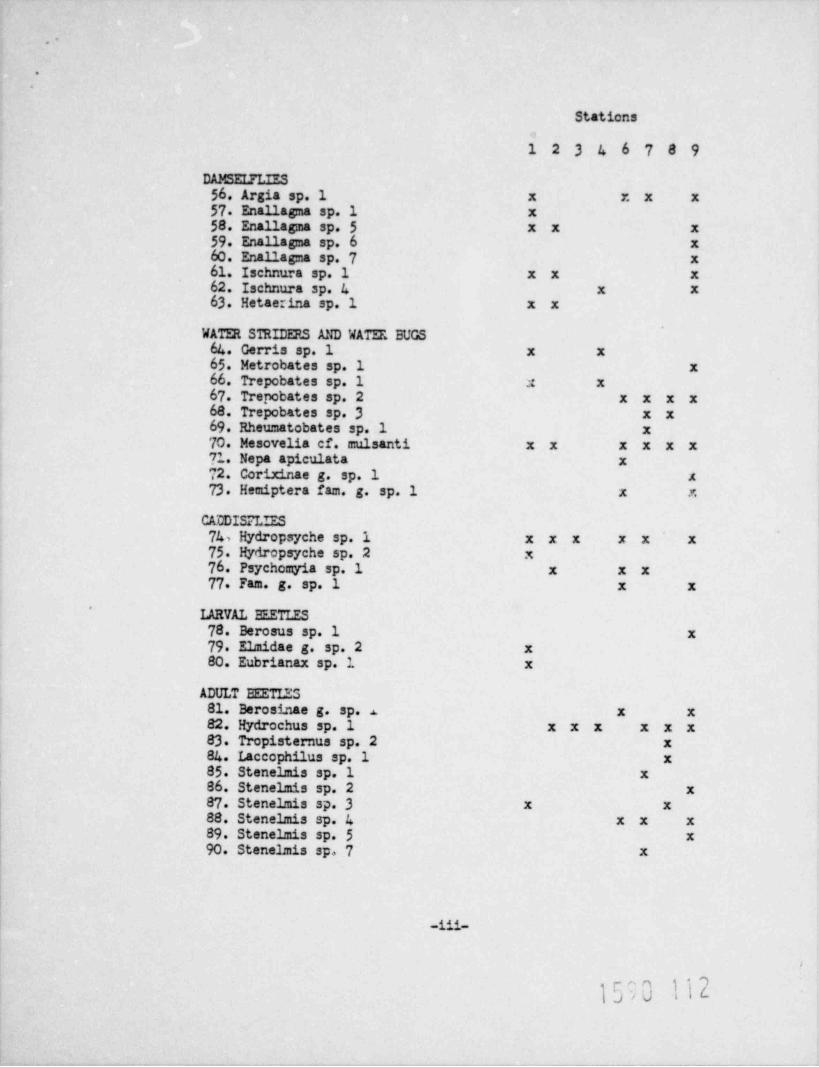
DAMSELFLIES56. Argia sp. 1 x x x x57. Enallagma sp. 1 x58. Enallagma sp. 5 x x x59. Enallagma sp. 6 x60. Enallagma sp. 7 x61. Ischnura sp. 1 x x x62. Ischnura sp. 4 x x63. Hetaerina sp. 1 x x
WATER STRIDERS AND WATER BUGS64. Gerris sp. 1 x x65. Metrobates sp. 1 x66. Trepobates sp. 1 a x67. Trepobates sp. 2 x x x x68. Trepobates sp. 3 x x69. Rheumatobates sp. 1 x70. Mesovelia ef. mulsanti x x x x x x71. Nepa apiculata x72. Corixinae g. sp. 1 x73. Hemiptera fam. g. sp.1 x r.
CADDISFLIES743 Hydropsyche sp. 1 x x x x x x75. Hydropsyche sp. 2 x76. Psychomyia sp. 1 x x x77. Fam. g. sp. 1 x x
*
LARVAL EEETLES78. Berosus sp. 1 x79. Elmidae g. sp. 2 x80. Eubrianax sp. 1 x
ADULT EEETLE381. Berosinae g. sp. . x x82. Hydrochus sp. 1 x x x x x x83. Tropisternus sp. 2 x84. Laccophilus sp. 1 x85. Stenelmis sp. 1 x86. Stenelmis sp. 2 x87. Stenelmis sp. 3 x x88. Stenelmis sp. 4 x x x89. Stenelmis sp. 5 x90. Stenelmis sp. 7 x
-111-
a3IL} ; ,,. o'U i
..
.
.
Stations
1 2 3 4 6 7 8 9
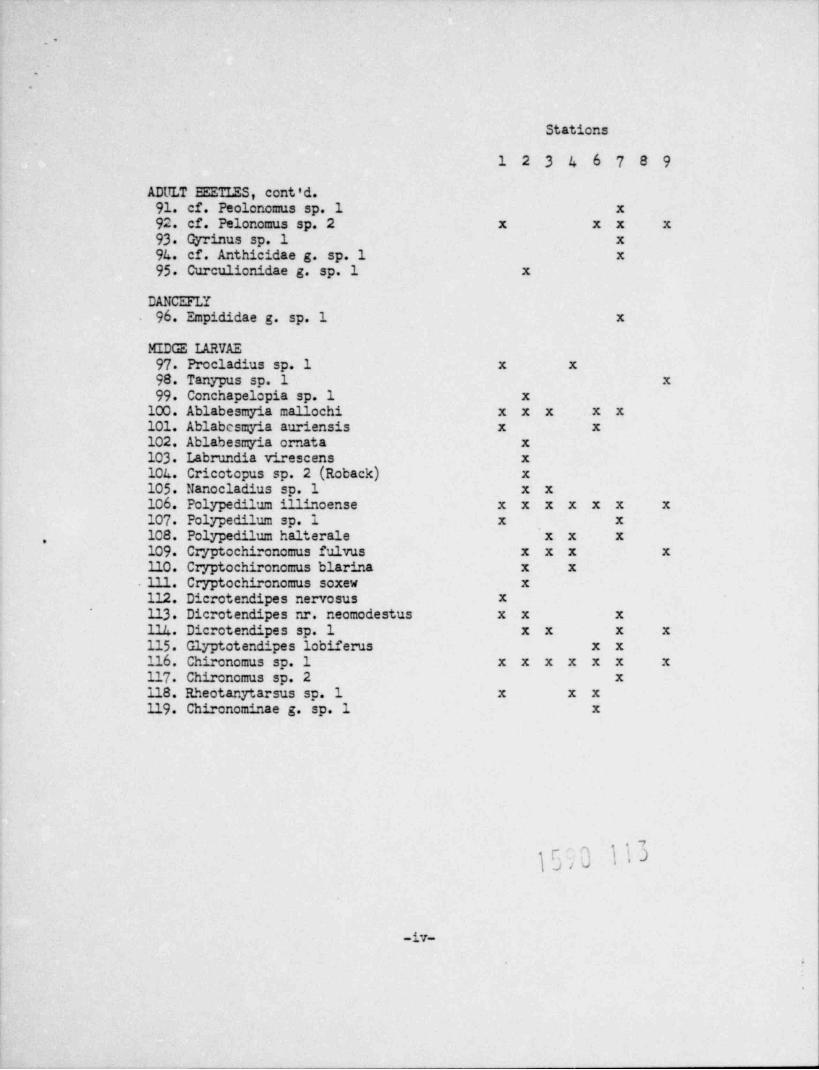
ADULT EETLES, cont'd.91. cf. Peolono=us sp. 1 x92. ef. Pelonomus sp. 2 x x x x93. Gyrinus sp. 1 x94. ef. Anthicidae g. sp. 1 x95. Curculionidae g. sp. 1 x
DANCEFLY96. Empididae g. sp. 1 x
MIDGE LARVAE97. Procladius sp. 1 x x98. Tanypus sp. 1 x99. Conchapelopia sp. 1 x
100. Ablabesmyia mallochi x x x x x101. Ablabcemyia auriensis x x102. Ablabesmyia ornata x103. Labrundia virescens x104. Cricotopus sp. 2 (Roback) x105. Nanocladius sp. 1 x x106. Polypedilum 4714ncense x x x x x x x107. Polypedilum sp. 1 x x108. Polypedilum halterale x x x.
109. Cryptochironomus fulvus x x x x110. Cryptochironotus blarina x x111. Cryptochironomus sexew x112. Dierotendipes nervosus x113. Dicretendipes nr. neomodestus x x x114. Dicrotendipes sp. 1 x x x x115. Glyptotendipes lobiferus x x116. Chironomus sp. 1 x x x x x x x117. Chironomus sp. 2 x118. Rheotanytarsus sp. 1 x x x119. Chironominae g. sp. 1 x
.,
[)J/V
-iv-
.