Embed Size (px)
Citation preview

A Bibliometric Analysis on Green Innovations, Green Investments and Green Venture Capital
Ilknur H. Tekin, Dundar F. Kocaoglu
Portland State University, Engineering and Technology Management Department, Portland, Oregon, USA Abstract--This paper introduces a methodology approach to
forecast the growth of publications on environmental and financial performance of firms. It explores the Engineering and Technology Management, and Business Management literature on Green Innovations, Green Investments and Green Venture Capital by using Bibliometric analysis and presents the trends in the scholarly and professional publications in these areas from 1990 to 2009. The 1990 to 2009 period, with more than 5 million publications, is analyzed by using the Fisher-Pry model. Projections are made for publication trends on the basis of the model forecasts. The analysis indicates sustainability-related publications in the three areas studied are in the emerging and rapid development stages of development.
I. INTRODUCTION
This paper aims to explore the literature on environmental and financial performance by focusing on the current trends on green business. Being Green” is by focusing on the publications on green innovations, green investments and green venture capital.
Often referred to as the “triple bottom line”, companies must concern themselves not only with their economic profits but also with social and environmental profits [10]. Following the triple bottom line approach, Corporate Social Responsibility initiatives are broadly categorized into two domains: “people” and “planet”. Whilst the People domain refers to the social benefits delivered to the society and the employees of companies, the Planet domain refers to engaging in environmentally responsible, sustainable business practices. The Profit domain of the triple bottom line, as has been in practice for centuries, refers to the economic and financial welfare of the businesses.
The definition of sustainability was first developed by the UN’s Brundtland Commission (led by the former Norwegian Prime Minister GroHarlem Brundtland) in 1987 as “Business practices that meet the needs of the current generation without compromising the ability of the future generations to meet their needs” [4].
The World Business Council for Sustainable Development (WBCSD) announced in its 2008 Annual Report:
“…In fact, many businesses and governments have suggested that “Green solution” can be found to both economic and ecological challenges, creating new jobs and markets by investing in new forms of energy, redesigning or retrofitting buildings and equipment, and managing forests and other ecosystems sustainably.” in [36]. Later, WBCSD's Chairman, Samuel Di Piazza Jr. pointed out on April 2009 that: "Economic crises must
remind us that sustainable development is not just about environmental or social issues but also about sound economic development."
Green Business has been receiving attention increasingly
over the past 15 years and maybe at one of its highest points in the last 2 years following the global financial crisis.
The findings of the bibliometric analysis and Fisher-Pry forecasting models developed in this paper point out emerging and rapid development stages of growth for “Green Innovations”, “Green Investments” and “Green Venture Capital”
II. MILESTONES IN THE LITERATURE ON ENVIRONMENTAL PERFORMANCE
Freimann et al. cite that the greening-of-industry
processes has been going on since 1995 starting in Europe, with standardized Environmental Management Systems (EMS), two of the most common applications of EMS being Eco-Management and Audit Scheme (EMAS) and ISO 14000. They report that these environmental risk management schemes have been developed and implemented in 40,000 companies worldwide.
EMAS is a voluntary Environmental Management System (EMS), under which companies and other public organizations evaluate, manage and continuously improve their environmental performance. EMAS has been operative since 1995. The latest revision (EMAS III) came into effect on 11 January 2010. Currently, more than 4,400 organizations and approximately 7,600 sites are EMAS-registered.
The International Standardization Organization (ISO), which is a member agency of the United Nations, has established a number of international standards in the areas of social and environmental performance (ISO 14000 series). ISO is a network of national standards institutes in 148 countries with headquarters in Geneva. ISO standards are developed by technical committees made up of experts on loan from the industrial, technical and business sectors that have asked for the standards and that subsequently put them to use. “The ISO 14000 family addresses various aspects of environmental management. The very first two standards, ISO 14001:2004 and ISO 14004:2004 deal with EMS. ISO 14001:2004 provides the requirements for an EMS and ISO 14004:2004 gives general EMS guidelines.” [18].
ISO 14001 standards were developed in 1996 by ISO, and are based on the three main elements of sustainable development: the economy, society and the environment.
2381
2011 Proceedings of PICMET '11: Technology Management In The Energy-Smart World (PICMET)
Many companies now recognize and monitor these three parallel standards on the basis of their assessments in order to guide product, process and personnel development and to secure their position in the rapidly changing climate of environmental legislation and stakeholder expectations. Among the ISO standards, ISO 14001 is one of the most frequently adopted standards in the area of corporate responsibility and is widely recognized as an international standard for environmental management. Based on a statistical report developed by the Federal Environment Agency of Germany, covering the EMS and EMAS as well as the ISO14001, Figure 1 is presented below.
Even though these standards have been in use over the years, they do not necessarily provide clear quantitative measures of how green a company’s impact is. They focus on standardization of business processes a company to enhance the company’s environmental impact . In other words, it can be stated that the companies which are qualified to receive these standards, do have verified management approaches and systems in running their business operations and managing their processes with the consideration of environmental impacts. However, they do not address the quantified intelligence of a company in having less pollutant impact on the environment. The current state of environmental impact- focused business processes jn the world is depicted by the distribution of ISO 14001 certification across countries Figure 1.
Figure 1 is a snapshot of the worldwide distribution the ISO14001 certification as of December 2006 / January 2007, as well as EMAS certificates worldwide based on 2007 numbers. According to the two graphs summarized, Japan is the leading country in terms of ISO 14001 certificates. The Japanese companies own approximately 22,000 certificates. The USA is listed as number five with a little more than 9000
certificates. Regarding EMAS certificates out of the total of 5389 certificates, German companies have the highest percentage with 1979 certifications, followed by Spain with 843 EMAS certificates. It is important to note that these are cumulative numbers and are affected by the size of the industry in each country.
The link between being “green” and being a financially successful company has been a topic of high interest in the corporate environmental management literature. (see [19], [33], [11], [38], [15], [17], [20], [23], [24], [25], [29], [32]). Some scholars argue that environmental protection mainly results in costs to a company ([2], [8]) whereas others support the idea that operating in an environmentally responsible way improves the firm’s bottom line (e.g. [27], [28], [32], [34], [35], [36]).
The limited, however diverse, empirical studies in the literature provide arguments for both sides. The results are split between supporting a positive relationship between environmental and financial performances, and opposing it. To illustrate them, several key publications are briefly summarized below.
In [31], Wagner indicates that many studies support the hypothesis that good environmental performance is not punished, or stated differently, bad performance does not pay off. The traditional view among economists, that the environmental regulations impose excessive costs on regulated industries, was challenged by Porter in 1991 and Porter and van der Linde in 1995 [26], [27], [28] . The Porter Hypothesis (PH), developed by Porter and van der Linde in 1995 states that stringent, well-designed environmental regulations lead not only to social benefits but may very often result in increased competitive advantage, and financial benefits for regulated companies in [27] and [28].
Figure 1. Worldwide Distribution of ISO 14001 Certificates (Ref: [9])
2382
2011 Proceedings of PICMET '11: Technology Management In The Energy-Smart World (PICMET)

Figure 2. Schematic representation of the Porter Hypothesis in [1]
Porter summarizes the main causal links involved in the
PH as presented in Figure 2, such that strict but flexible environmental regulations (ERs), result in increased R&D which leads to cost reduction and increased product value via product offset, both of which improve competitiveness and profitability and it is presented in [1] as a flow chart as Figure 2.
In [29], [21], [7], and [22] the authors conclude that the relationship between ERs and the financial performance is positive. On the other hand, the opposing view point is highlighted by another group of articles as [3], [12], [14], and in these articles it is conclude that there is a negative relationship between performance and environmental regulations.
The focus of these two groups of papers in terms of the industries they analyze and the countries from which they sample are different, thus both groups reach non-generalizable conclusions. More importantly, the papers which conclude a negative relationship are using firm’s performance indicators as specifically driven from stock market performance while the other group is looking into the ROA, ROI and similar firm-specific performance indicators.
III. ENVIRONMENTAL PERFORMANCE AND ECONOMIC PERFORMANCE IN THE CONTEXT OF
ENVIRONMENTAL REGULATIONS
The critical papers which explore the impact of environmental regulations, and financial performance are briefly introduced in this section.
The key findings and methods of these papers are summarized in two groups: first group concluding that there is a positive relationship between ER and performance and second group concluding that there is negative relationship between the two. Group 1: Papers that conclude there is a positive relationship between ER & performance
In [25], Russo and Fouts, in their study of 243 firms from a wide range of industries over 1991-1992 period, show that environmental performance and economic performance are positively linked and industry growth moderates the relationship, with the returns to environmental performance being higher in high-growth industries.
In [21], Khanna et al., in their study of 91 US chemical firms over the 1989 – 1994 time period show that there are negative abnormal returns during one-day period following
disclosure, abnormal losses are higher for firms that do not reduce emissions.
In [7], Dasgupta and Laplante, in their study of 126 events involving 48 publicly-traded firms in Argentina, Chile, the Philippines and Mexico, show that 20 out of 39 positive events have led to positive abnormal returns (+20% in firm value over an 11-days window).
In [22], King and Lenox, in their study of 652 US manufacturing firms over 1987-1996 period, show that ERs have a positive impact on financial performance but statistically significant for only one variable. Group 2: Papers that conclude there is a negative relationship between ER & performance
In [3], Brannlund et al., in their study of 41 Swedish pulp and paper mills from 1989 to 1990 show that the mills which were affected by the regulations, had an average reduction of 4% - 17% in their profits due to regulation.
In [12], Filbeck and Gorman, in their study of 24 US electrical utilities over the 1996 - 1998 time periods, show that there is negative relationship between returns and environmental regulation compliance.
In [14], Gupta and Goldar, in their study of 17 Indian pulp and paper plants, 15 auto firms and 18 chlor alkali firms in the 1999-2001 period, also show that there is a negative relationship between abnormal returns and environmental rating.
There is clearly a disagreement in the literature addressing the relationship between environmental and economic performance.
Acknowledging this disagreement, a bibliometric analysis on the publications that address environmental performance and financial performance from 1990 to 2009 was conducted with the application of Fisher-Pry forecasting model to explore the trend in the field of environmental sustainability covering environmental innovations, environmental investments and venture capital investments in environment.
IV. BIBLIOMETRIC ANALYSIS FRAMEWORK
For exploring the growth trends in academic and professional literature on environmental performance, the 1990 – 2009 time window was selected as the time frame for analysis.
For the literature search, 4 main search engines: Business Source Premier (EBSCO), Engineering Village
2383
2011 Proceedings of PICMET '11: Technology Management In The Energy-Smart World (PICMET)

(COMPendex), Google Scholar and Google General were used.
The key groups of words for the literature search selected were: 1. Green Innovations 2. Green Investments 3. Green Venture Capital TABLE 1. CUMULATIVE AMOUNT OF SCHOLARLY AND GENERAL
PUBLICATIONS USED IN THE BIBLIOMETRIC ANALYSIS
The bibliometric search conducted with the above three
word groups, has resulted in more than 5 million cumulative publications in the 1990 – 2009 time frame. They are presented in Table 1 and Table 2 in a detailed break down.
The results of the study have provided an overall assessment of the publications on green business by using “Green Innovations, Green Investments and Green Venture Capital” as the key indicators. The aim is to have a holistic view of the trends in this area by exploring the engineering
and business literature by means of these key words, rather than attempting to compare the fields of engineering and management or to reach concluding remarks on the literature filtered by the key words.
V. FINDINGS OF THE BIBLIOMETRIC ANALYSIS
The bibliometric analysis results are grouped into four
groups and are presented accordingly. 1. Business-oriented scholarly publications, using EBSCO
search engine 2. Engineering-oriented scholarly publications, using
Compendex search engine 3. Overall scholarly publications, using Google Scholar
search engine 4. General publications including professional journals,
news, blogs and all other published materials, using Google search engine
The growth trends in each of the three topics studied
(Green Innovations, Green Investments, Green Venture Capital) in four groups are summarized below with cumulative graphs and brief explanations below.
The literature search verified the growth trend in sustainability-related topics in both scholarly and general publications over the past 20 years, between 1990 and 2009. The trends analyzed, using the Fisher-Pry model with projections for the future are presented in the following section. Scholarly Publications’ growth trend from 1990 to 2009 (cumulative over the years):
Scholarly publications on Green Investments start at 26 in 1990 and reach 4385 in 2009, Green Innovations start at 7 for 1990 and reach 3118 in 2009. Green Venture Capital starts at 0 in 1990 and reaches 460 in 2009.
TABLE 2. BIBLIOMETRIC ANALYSIS NUMBERS BY PUBLICATION TYPE PER YEAR
Total
1,576
5,007,740
5,015,703
EBSCO
Compendex
Scholar
General
4,373
2,014
1990 1991 1992 1993 1994 1995 1996 1997 1998 1999 2000 2001 2002 2003 2004 2005 2006 2007 2008 2009 Total Total
innovation 3 7 6 12 41 33 18 27 24 22 23 32 32 56 64 82 124 182 291 223 1302
investment 17 15 10 16 29 34 31 46 72 65 72 60 81 145 190 227 225 395 480 475 2685Venture Capital (V.C.) 0 0 0 0 0 0 0 0 4 1 5 9 6 6 15 12 14 30 69 40 211
Cleantech V.C. 0 0 0 0 0 0 0 0 0 0 0 0 0 2 2 2 16 35 69 49 175
innovation 4 6 5 4 5 13 15 24 26 20 30 33 47 71 107 126 153 144 197 218 1248
investment 4 4 0 5 4 9 7 7 14 19 22 30 42 73 112 88 68 73 79 91 751
Venture Capital (V.C.) 0 0 0 0 0 0 0 0 0 0 0 0 0 2 1 0 0 2 2 3
Cleantech V.C. 0 0 0 0 0 0 0 0 0 0 0 0 1 0 0 0 0 1 0 3
innovation 0 0 0 2 1 3 1 4 6 6 10 5 16 18 27 18 31 59 62 109
innovations 0 1 0 1 1 3 1 2 5 3 9 9 6 7 13 18 12 24 29 46
investment 3 1 4 13 12 5 12 10 26 21 24 40 43 49 30 65 57 62 85 127
investments 2 0 3 4 1 3 3 7 6 6 9 8 11 14 14 18 13 17 35 86
Venture Capital (V.C.) 0 1 0 0 1 0 0 0 1 1 1 2 2 3 2 4 4 2 5 6
Cleantech V.C. 0 0 0 0 0 0 0 0 0 0 0 0 0 0 0 0 1 3 10 10
innovation 18900 15060 16310 5550 18840 8250 7440 29730 20950 20130 36400 23280 23040 21010 28540 23840 34620 44600 72800 105400 574,690
investment 33420 24400 16170 13570 14580 17800 16170 21140 19590 23310 55800 32300 41100 43800 35600 60500 68700 81200 110200 129500 858,850
Venture Capital (V.C.) 79000 58400 62700 53700 78200 90300 82700 76000 122400 128400 229300 198700 195000 213800 270500 376500 452700 436500 274400 95000 3,574,200
Compendex
Scholar
568
949
59
4,373
General
15
5,007,740
1,576
2,014
EBSCO
2384
2011 Proceedings of PICMET '11: Technology Management In The Energy-Smart World (PICMET)

General Publications’ growth trend from 1990 to 2009 (cumulative over the years):
When overall general publications in popular media, including professional journals, news, and blogs, using Google search engine, are studied, it is observed that the
cumulative number of publications on Green Innovations starts at 18,900 for 1990 and reaches 574,690 in 2009, Green Investments start at 33,420 in 1990 and reach 858,850 in 2009, Green Venture Capital starts at 79,000 in 1990 and reaches 3,574,200 in 2009.
0
500
1000
1500
2000
2500
3000
3500
4000
4500
5000
Green Innovations
Green Investments
Green VC.
Scholarly Publications from 1990 to 2009
0
500000
1000000
1500000
2000000
2500000
3000000
3500000
4000000
Green Innovations
Green Investments
Green VC.
General Publications from 1990 to 2009
2385
2011 Proceedings of PICMET '11: Technology Management In The Energy-Smart World (PICMET)

VI. FISHER-PRY MODEL APPLICATION TO THE BIBLIOMETRIC ANALYSIS RESULTS
Among a group of forecasting models such as the
Gompertz model, Fisher-Pry Model, Pearl Read Model, Logarithmic Models, Log Natural Models, Exponential Models, Bass Model used for bibliometric trend analysis and future projections, Fisher-Pry Model is heavily used both in industry and academia for forecasting technological innovations, developing S-Curves for growth patterns and analyzing market penetration trends. In [13], Fisher-Pry model was described by its authors as a substitution model for technological change. Fisher and Pry in [13] explained that the model would be powerful in forecasting technological opportunities [30]. Especially in the field of technology forecasting the Fisher-Pry models have been used in several research papers in the field of engineering and technology management [5], [6], [16]). In this paper, the Fisher-Pry Model is used to explore the growth trends in publications on sustainability in both the scholarly publications in journal articles, books, conference papers and in the general interest publications in popular media. One clarification to be made on a limitation of this study is that there is no physical upper limit that can be applied to the growth curves. Since publications do not have a physical property that would limit their growth and define the upper limit, that could be used as for the upper limit, the trends are defined without such a limit as would be in the case when Fisher-Pry growth curves, are used for forecasting the growth of technologies. In case of publications, it is conceivable that new researchers can join the field and new journals can emerge on a continuous basis, and the growth curve can continue in its upward trend without a pre-defined limit. This paper does not make an attempt to define the upper limit. It explores where the publications are in the expected life cycle of their growth trend.
The separate trends in these two groups are also compared to each other later in the paper.
The Fisher-Pry Model growth curve is defined by:
y(t) = 1 / (1 + e - b (t-a)) where
y corresponds to growth at time t, a and b are growth coefficients
In the Fisher-Pry Model growth curve, the regions for
growth stages are defined as 0≤y≤0.2 Emerging ( E ) 0.2<y≤0.8 Rapidly developing ( D ) 0.8<y≤1.0 Maturity ( M )
The growth stages are depicted in Figure 3 below, where the X axis corresponds to years (t), and Y axis to the growth at time (t)
Figure 3 – Fisher-Pry Model and regions of growth stage
The methodological approach was similar to that used for
DOE in interpreting the a, b and m values for the fitting of the bibliometric analysis cumulative numbers. The values are determined, following the DOE approach, by shifting and alignment of the curve with the Fisher-Pry base curve. In this paper, the values of a, b and m are not listed as there are no conclusions driven based on them, however, summaries on the series of charts and the growth to maturity that they indicate are included following each chart.
The cumulative number of scholarly publications and general interest publications are vastly different from each other, where scholarly publications are measured in thousands, while general interest publications are in millions Because of this difference in magnitude, separate Fisher-Pry models are developed for them. The results and the fit of the models are briefly explained for each of the charts presented below. All models have a goodness of fit in the 98% to 99% range. Fisher-Pry Models applied to Green Innovation(s):
Four Fisher-Pry Models are developed for Green Innovations for business and engineering scholarly publications as well as the literature search findings from Google Scholar and the broad General Google search.
For business publications the Fisher-Pry model, with a goodness of fit of 0.990, indicates that the level of Green Innovations in business scholarly publications is at the Rapid Development Stage, as of 2009, and the projected Maturity Stage transition is likely to take place by 2018. The curve for Green Innovations in business scholarly publications and its fit to the original Fisher-Pry Model is presented in Chart 1 below.
E
D
M
2386
2011 Proceedings of PICMET '11: Technology Management In The Energy-Smart World (PICMET)

CHART 1. GROWTH OF GREEN INNOVATIONS IN BUSINESS PUBLICATIONS
Similarly, the model for Green Innovations in engineering scholarly publications, with a goodness of fit of 0.999, indicates that the level of Green Innovations in engineering scholarly publications is at the Rapid Development Stage, as of 2009, and the projected Maturity Stage transition is likely to take place by 2019. The curve for Green Innovations in engineering scholarly publications and its fit to the original Fisher-Pry Model is presented in the appendix as Chart 2.
The model for Green Innovations in scholarly publications by using Google Scholar search engine, with a goodness of fit of 0.992, indicates that the level of Green Innovations in scholarly publications is at the Emerging Stage, as of 2009, and the projected Rapid Development Stage transition is likely to take place by 2010. The Maturity Stage transition is also estimated to happen by 2017. The curve for Green Innovations in scholarly publications via Google Scholar search engine and its fit to the original Fisher-Pry Model is presented in the appendix as Chart 3.
Finally, the fourth model for Green Innovations in overall general publications by using Google search engine, with a goodness of fit of 0.991, indicates that the level of Green Innovations in general publications is at Rapid Development Stage. The Maturity Stage transition is estimated to happen by 2018. The curve for Green Innovations in general publications via Google search engine and its fit to the original Fisher-Pry Model is presented in the appendix as Chart 4.
Fisher-Pry Models applied to Green Investment(s):
Four Fisher-Pry Models are developed for Green Investments for business and engineering scholarly publications as well as the literature search findings from Google Scholar and the broad General Google search.
For business publications the Fisher-Pry model, with a goodness of fit of 0.997, indicates that the level of Green
Investments in business scholarly publications is at the Rapid Development Stage, as of 2009, and the projected Maturity Stage transition is likely to take place by 2017. The curve for Green Investments in business scholarly publications and its fit to the original Fisher-Pry Model is presented in Chart 5 below.
Similarly, the model for Green Investments in engineering scholarly publications, with a goodness of fit of 0.981, indicates that the level of Green Investments in engineering scholarly publications is at the Rapid Development Stage, as of 2009, and the projected Maturity Stage transition is likely to take place by 2019. The curve for Green Investments in engineering scholarly publications and its fit to the original Fisher-Pry Model is presented in the appendix in Chart 6.
The model for Green Investments in scholarly publications by using Google Scholar search engine, with a goodness of fit of 0.992, indicates that the level of Green Investments in scholarly publications based on Google Scholar search engine is at the Emerging Stage, as of 2009, and the projected Rapid Development Stage transition is likely to take place by 2013. The Maturity Stage transition is also estimated to happen by 2018. The curve for Green Investments in scholarly publications via Google Scholar search engine and its fit to the original Fisher-Pry Model is presented in the appendix in Chart 7.
Finally, the fourth model for Green Investments in overall general publications by using Google search engine, with a goodness of fit of 0.991, indicates that the level of Green Investments in general publications based on Google search engine is at the Rapid Development Stage, as of 2009, and the projected Maturity Stage transition is likely to take place by 2018. The curve for Green Investments in general publications via Google search engine and its fit to the original Fisher-Pry Model is presented in the appendix in Chart 8.
0
0.2
0.4
0.6
0.8
1
1.2
Fisher‐Pry
EBSCO "G.innov."
2387
2011 Proceedings of PICMET '11: Technology Management In The Energy-Smart World (PICMET)

CHART 5. GROWTH OF GREEN INVESTMENTS IN BUSINESS PUBLICATIONS
Fisher-Pry Models applied to Green Venture Capital: Four Fisher-Pry Models are developed for Green Venture
Capital for business and engineering scholarly publications as well as the literature search findings from Google Scholar and the broad General Google search.
For business publications the Fisher-Pry model, with a goodness of fit of 0.966, indicates that the level of Green
Venture Capital in business scholarly publications is at the Emerging Stage, as of 2009, and the transition to Rapid Development Stage is estimated to take place by 2018. The projected Maturity Stage transition is also likely to take place by 2025. The curve for Green Venture Capital in business scholarly publications and its fit to the original Fisher-Pry Model is presented in Chart 9 below.
CHART 9. GROWTH OF GREEN VENTURE CAPITAL IN BUSINESS PUBLICATIONS
0
0.2
0.4
0.6
0.8
1
1.2
Fisher‐Pry
EBSCO "G.invest."
0
0.2
0.4
0.6
0.8
1
1.2
Fisher‐Pry
EBSCO "G. VC."
2388
2011 Proceedings of PICMET '11: Technology Management In The Energy-Smart World (PICMET)

Similarly, the model for Green Venture Capital in engineering scholarly publications, with a goodness of fit of 0.981, indicates that the level of Green Venture Capital is at the Emerging Stage, as of 2009, and the projected Rapid Development Stage transition is likely to have taken place by 2010. The Maturity Stage transition is estimated to happen by 2017.The curve for Green Venture Capital in engineering scholarly publications and its fit to the original Fisher-Pry Model is presented in appendix in Chart 10.
The model for Green Venture Capital in scholarly publications by using Google Scholar search engine, with a goodness of fit of 0.978, indicates that the level of Green Venture Capital is at the Emerging Stage, as of 2009, and the projected Rapid Development Stage transition is likely to take place by 2013. The Maturity Stage transition is also estimated to happen by 2018. The curve for Green Venture Capital in scholarly publications via Google Scholar search engine and its fit to the original Fisher-Pry Model is presented in appendix in Chart 11.
Finally, the fourth model for Green Venture Capital in overall general publications by using Google search engine, with a goodness of fit of 0.997, indicates that the level of Green Venture Capital is at the Rapid Development Stage, as of 2009, and the projected Maturity Stage transition is likely to take place by 2011. The curve for Green Venture Capital in general publications via Google search engine and its fit to the original Fisher-Pry Model is presented in appendix in Chart 12.
VII. CONCLUSION
Two conclusions can be drawn from the results of the bibliometric analysis presented in this paper: 1. The Green Business literature is at the early stages of a
rapid growth trend. This finding emphasizes the high potential for scholarly work for at least the next 8 to 10 years. The findings based on the Fisher-Pry model can be classified as into three main groups by referring to the stages at which they currently are: a. Green Innovations are at the very early stages of Rapid
Development both for the scholarly and general publications literature with a goodness of fit higher than 99%.
b. Green Investments are at the very early stages of Rapid Development both for the scholarly and general publications literature with a goodness of fit higher than 98%, and at the emerging stage for the Google Scholar search engine with a goodness of fit of 99%.
c. Green Venture Capital is at the very early stages of Emerging Stage for the scholarly publications literature and at a very late stage of Rapid Development for general publications with a goodness of fit 99.7%.
2. The literature is unclear on the nature of the relationship between environmental and financial performance. While one group of researchers identifies a positive relationship
among the two, another group identifies a negative relationship by using different methodological approaches and variables.
These two conclusions point out that there is need for
more research in the areas of firm performance and environmental performance while in line with the high growth rate of publications already emerging on green innovations, green investments and green venture capital.
ACKNOWLEDGMENTS Dr. Paul Newman’s suggestions and constructive
comments on an earlier version of this paper, and Dr. Tugrul Daim’s suggestions for the revisions are gratefully acknowledged.
REFERENCES [1] S. Ambec and Barla P. (2002). A theoretical foundation of the Porter
Hypothesis. Economics Letters 75, 355-360. [2] A.J. Barbera, and V.D. McConnell (1990). The Impact of
Environmental Regulations on Industry Productivity: Direct and Indirect Effects. Journal of Environmental Economics and Management, 18, 50-65.
[3] R. Brannlund, R. Fare and S. Grosskopf (1995). Environmental Regulation and Profitability: An Application to Swedish Pulp and Paper Mills. Environmental and Resource Economics, 6: 23-36.
[4] Brundtland Report (1987), UN. [5] T. Daim, G. Grueda, H. Martin, P. Gerdsri, “Forecasting Emerging
Technologies: Use of Bibliometrics and Patent Analysis" Technology Forecasting and Social Change, Vol 73, No 8, October 2006, pp 981-1012.
[6] T. Daim et al. (2007). Time lag assessment between research funding and output in emerging technologies. Foresight, Vol. 9 Iss: 4, pp.33 – 44.
[7] S. Dasgupta and B. Laplante (2001) Pollution and Capital Markets in Developing Countries, Journal of Environmental Economics and Management 42: 310-345.
[8] C. Dufour, P. Lanoie and M. Patry (1998) Regulation and Productivity, Journal of Productivity Analysis, 9, 233-247
[9] www.ecology.org/jp/isoworld/english/analys14k.htm [10] J. Elkington, (1994). Towards the Sustainable Corporation: Win-Win-
Win Business Strategies for Sustainable Development. California Management Review, vol.36 pp.90-110, Winter 1994.
[11] S. J. Feldman, P. A. Soyka, and P. Ameer, (1996). Does Improving a Firm's Environmental Management System and Environmental Performance Result in a Higher Stock Price? Journal of Investing, 6 no:4, 87-97 (1997).
[12] G. Filbeck, and R.F. Gorman (2004). The relationship between the Environmental and Financial Performance of Public Utilities. Environmental and Resource Economics, 29:137-157.
[13] J.C. Fisher, and R. H. Pry, (1971). A simple substitution model of technological change, Technologica Forcasting and Social Change, 3 (March 1971), 75 – 88.
[14] S. Gupta, and B. Goldar (2005) Do stock markets penalize environment-unfriendly behaviour? Evidence from India, Ecological Economics, 52, 81-95.
[15] J. Hamilton, (1995). Pollution as news: Media and stock market reactions to the toxic release inventory data, Journal of Environmental Economics and Management, 28: 98–113.
[16] G. Harrell, U. T. Daim, (2009). Forecasting energy storage technologies, Foresight, Vol.11 No.6, 2009, 74 - 85.
2389
2011 Proceedings of PICMET '11: Technology Management In The Energy-Smart World (PICMET)

[17] S. Hart, G. Ahuja (1996). Does it pay to be green? An empirical examination of the relationship between emission reduction and firm performance. Business,Strategy and the Environment, 5: 30–37.
[18] ISO (www.iso.org) [19] B. Jaggi,and M.Freedman, (1992). An examination of the impact of
pollution performance on economic and market performance: pulp and paper firms. Journal of Business Finance and Accounting, 19(5), 697±713.
[20] S. D. Johnson, (1995). An Analysis of the Relationship Between Corporate Environmental and Economic Performance at the Level of the Firm. University of California, Irvine: Doctoral Dissertation
[21] M. Khanna, W. R. Quimio, and D. Bojilova. (1998). Toxic release information: A policy tool for environmental protection. Journal of Environmental Economics and Management, 36: 243–266.
[22] A.A. King, M.J. Lenox, (2001). Does It Really Pay to Be Green? An Empirical Study of Firm Environmental and Financial Performance. Journal of Industrial Ecology, (5) : 1, 105 – 116.
[23] R. Klassen, and C. McLaughlin. (1996). The impact of environmental management on firm performance. Management Science, 42: 1199–1214.
[24] J. McGuire, A. Sundgren, and T. Schneeweis, (1988). Corporate social responsibility and firm financial performance. Academy of Management Journal 31, 854±872.
[25] S. Morris, (1997). Environmental Pollution and Competitive Advantage: An Exploratory Study of US Industrial-Goods Manufacturers. Paper presented at the annual meeting of the Academy of Management, Boston (Mass.).
[26] M. Porter, (1991) American's Green Strategy. Scientific American, 264, 168.
[27] M.E. Porter, C. van der Linde (1995). Toward a new conception of the environment-competitiveness relationship. Journal of Economic Perspectives, 9(4): 97–118.
[28] M. Porter, and C. van der Linde, C. (1995). Green and competitive. Harvard Business Review, September - October: 121–134.
[29] M.V. Russo, P.A. Fouts (1997). A resource-based perspective on corporate environmental performance and profitability. Academy of Management Review, 40(3): 534–559.
[30] A. Suominen, and, A. Tuominen (2010). Analyzing the direct methanol fuel cell technology in portable applications by a historical and bibliometric analysis., Journal of Business Chemistry. 7(3): 117 – 130.
[31] M. Wagner, (2000). A Review of Empirical Studies Concerning the Relationship Between Environmental and Economic Performance. What Does the Evidence Tell Us? Lueneburg: Center for Sustainability Management (CSM).
[32] M. Wagner, and W. Wehrmeyer (2001). The relationship between environmental performance and economic performance of firms and the influence of ISO 14001 and EMAS: an empirical analysis. Conference Proceedings of the 2001 Eco-Management and Auditing Conference, June, ERP Environment, Shipley.
[33] N. Walley, and B. Whitehead, (1994). It's not easy being green. Harvard Business Review, 72, 46±52.
[34] WBCSD (World Business Council for Sustainable Development) (1997). Environmental Performance and Shareholders Value. Geneva: WBCSD.
[35] WBCSD (World Business Council for Sustainable Development) (2007). Annual Report Geneva:
[36] WBCSD. (World Business Council for Sustainable Development) (2008). Annual Report Geneva:
[37] www.wbcsd.org [38] M. White, (1995). The performance of environmental mutual funds in
the United States and Germany: Is there economic hope for “green” investors? Research in Corporate Social Performance and Policy Supplement, 1: 325–346.
APPENDIX
CHART 2. GROWTH OF GREEN INNOVATIONS IN ENGINEERING PUBLICATIONS
0
0.2
0.4
0.6
0.8
1
1.2
Fisher‐Pry
Compendex "G.innov."
2390
2011 Proceedings of PICMET '11: Technology Management In The Energy-Smart World (PICMET)
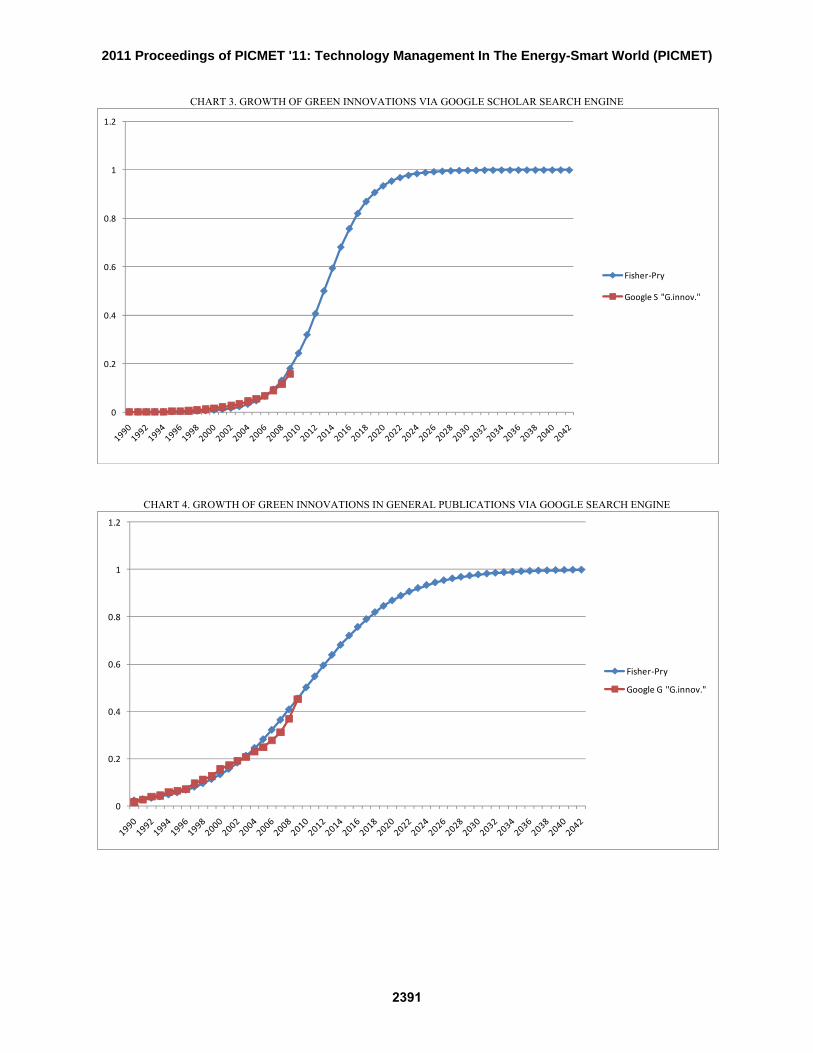
CHART 3. GROWTH OF GREEN INNOVATIONS VIA GOOGLE SCHOLAR SEARCH ENGINE
CHART 4. GROWTH OF GREEN INNOVATIONS IN GENERAL PUBLICATIONS VIA GOOGLE SEARCH ENGINE
0
0.2
0.4
0.6
0.8
1
1.2
Fisher‐Pry
Google S "G.innov."
0
0.2
0.4
0.6
0.8
1
1.2
Fisher‐Pry
Google G "G.innov."
2391
2011 Proceedings of PICMET '11: Technology Management In The Energy-Smart World (PICMET)

CHART 6. GROWTH OF GREEN INVESTMENTS IN ENGINEERING PUBLICATIONS
CHART 7. GROWTH OF GREEN INVESTMENTS VIA GOOGLE SCHOLAR SEARCH ENGINE
0
0.2
0.4
0.6
0.8
1
1.2
Fisher‐Pry
Compendex "G.invest."
0
0.2
0.4
0.6
0.8
1
1.2
Fisher‐Pry
Google S "G.invest.
2392
2011 Proceedings of PICMET '11: Technology Management In The Energy-Smart World (PICMET)

CHART 8. GROWTH OF GREEN INVESTMENTS IN GENERAL PUBLICATIONS VIA GOOGLE SEARCH ENGINE
CHART 10. GROWTH OF GREEN VENTURE CAPITAL IN ENGINEERING PUBLICATIONS
0
0.2
0.4
0.6
0.8
1
1.2
Fisher‐Pry
Google G "G.invest."
0
0.2
0.4
0.6
0.8
1
1.2
Fisher‐Pry
Compendex "G.VC."
2393
2011 Proceedings of PICMET '11: Technology Management In The Energy-Smart World (PICMET)

CHART 11. GROWTH OF GREEN VENTURE CAPITAL VIA GOOGLE SCHOLAR SEARCH ENGINE
CHART 12. GROWTH OF GENERAL PUBLICATIONS ON GREEN VENTURE CAPITAL VIA GOOGLE SEARCH ENGINE
0
0.2
0.4
0.6
0.8
1
1.2
Fisher‐Pry
Google S "G.VC"
0
0.2
0.4
0.6
0.8
1
1.2
Fisher‐Pry
Google G "G.VC"
2394
2011 Proceedings of PICMET '11: Technology Management In The Energy-Smart World (PICMET)