Embed Size (px)
Citation preview
Australasian Transport Research Forum 2016 Proceedings 16 – 18 November 2016, Melbourne, Australia
Publication website: http://www.atrf.info
1
A best practice evaluation of traffic impact assessment guidelines in Australia and New Zealand
Kirstine Cooley1, Chris De Gruyter1, Alexa Delbosc1
1 Department of Civil Engineering, Monash University, Victoria, Australia
Email for correspondence: [email protected]
Abstract Traffic impact assessments (TIAs) are crucial to understanding how a proposed development will impact the surrounding transport network. Various national and state TIA guidelines are available throughout Australia and New Zealand, but there is little understanding of the extent to which these guidelines constitute best practice in TIA. This research aims to understand what a standard of best practice means in the context of TIA and to what extent the Australian and New Zealand TIA guidelines represent this standard.
The research included an evaluation of the national guidelines for Australia and New Zealand, as well as state/region specific guidelines from New South Wales, Queensland, Tasmania, Western Australia and Auckland. An international literature review of best practice in TIA was undertaken to inform the development of an assessment framework using on a ‘scorecard’ approach. This scorecard was then applied to assign numerical weight to reflect the extent to which each TIA guideline met best practice standards.
The evaluation found that the state guidelines from Western Australia and the Australian national guidelines scored highest, achieving 55% of the maximum possible score. The guidelines from Queensland and New South Wales scored marginally lower with 45% and 48% of the maximum possible score. This was followed by Tasmania (30%), Auckland (29%) and the national guidelines for New Zealand (23%). The results highlighted a number of key areas for improvement, particularly those related to legislative frameworks, multi-modal transport considerations, and the monitoring and review of TIAs.
The conclusions of this research are indicative only, and limited to the breadth of literature review that informed the paper. Further research should seek the opinions of academics, various transport stakeholders and industry participants to revise and refine the framework in order to provide a more accurate standard with which to measure best practice.
Key words: Traffic impact assessment, guidelines, best practice, Australia, New Zealand.
ATRF 2016 Proceedings
2
1. Introduction Traffic Impact Assessments (TIAs) are crucial to understanding how a proposed development will impact the surrounding transport network. Various national and state TIA guidelines are available throughout Australia and New Zealand, but there is little understanding of the extent to which these guidelines constitute best practice.
In an environment where cites are experiencing increasing problems of traffic congestion, private vehicle use and environmental degradation relating to transport growth, it is important that TIA guidelines are of a high standard. TIAs aim to assess the impact that a new development will have on all aspects of the transport network, and therefore offer transport and land use planning practitioners informed knowledge with which to make vital development-related decisions. It is more effective, and both cost and time efficient to address transport, social and environmental issues at the planning stage rather than to try and remedy any negative outcomes at the post-occupation stage. Moreover, understanding the requirements of best practice, and the extent to which available guidelines constitute this standard, is vital to informing and streamlining future reviews and amendments of TIA guidelines.
The aim of the research underlying this paper is to understand what a standard of best practice means in the context of TIA and to what extent the Australian and New Zealand TIA guidelines represent this standard. This aim is underpinned by two key research questions:
1) What constitutes best practice in TIA?
2) To what extent do Australian and New Zealand TIA guidelines represent best practice?
In order to address research question 1, an international literature review of best practice in TIA was undertaken. This review was used to inform the development of an assessment framework against which the guidelines could be evaluated. To assess research question 2, the assessment framework was then applied to the following TIA guidelines currently available in Australia and New Zealand:
• Australia: Guide to Traffic Management Part 12: Traffic Impacts of Development (Austroads 2009)
• Queensland: Guidelines for Assessment of Road Impacts of Development (Department of Main Roads 2006)
• Western Australia: Transport Assessment Guidelines for Developments (Department for Planning and Infrastructure 2006)
• New South Wales: Guide to Traffic Generating Developments (Roads and Traffic Authority 2002)
• Tasmania: Traffic Impact Assessment (TIA) Guidelines (Department of Infrastructure, Energy and Resources 2007)
• New Zealand: Transport Impact Guidelines for Site Development (Collins et al. 2007) • Auckland: Integrated Transport Assessment Guidelines (Auckland Transport 2015).
Two further secondary research questions were also explored:
3) Do more recent guidelines present better practice than older guidelines?
4) Do longer guidelines present better practice than shorter guidelines?
The remainder of this paper is structured as follows. Section 2 provides a summary of best practice in TIAs based on the findings of the international literature review. Section 3 describes the development of the assessment framework used to evaluate each guideline, with the results presented in Section 4. Section 5 discusses the implications for practice and potential areas for improvement in the guidelines. Concluding remarks are presented in Section 6.
A best practice evaluation of traffic impact assessment guidelines in Australia and New Zealand
3
2. Literature review of best practice The international literature review was based on research publications and reports focused on best practice in traffic impact assessments. Best practice in this context is defined as ‘the most appropriate way to assess or undertake some element of a TIA versus some other way that may develop into best practice after peer review and development’ (Abley et al. 2010, p. 38). The following subsections summarise the most important aspects of TIA guidance including transport assessments, structural and technical guidance, sustainability and TIA review.
2.1 Traffic impact assessments versus transport assessments Since the publication of most guidelines evaluated in this research there has been a move from a traditional TIA approach, with private vehicle traffic impacts as the primary issue, towards transport assessments (TAs) that consider accessibility and travel patterns for all transport modes (Abley et al. 2010). Contemporary transport planning practice no longer prioritises car-centric modes of travel and therefore traffic impact assessments should encompass all modes of transport including public transport, walking, cycling and freight movements (Department for Planning and Infrastructure 2006). Although there are significant differences between the two main types of assessment, this paper uses the terms interchangeably in order to evaluate guidelines described either as TIAs or TAs, against the current broader model of transport assessment.
2.2 TIA structure, scope and legislative framework Guidelines should prescribe a preferred format for TIA reports (van Rensburg & van As 2004) in order to convey the findings of the assessment clearly and concisely (Transport for London 2010). All information should be contained within the one document, as this is seen as a benefit for practitioners in government and the wider industry (Bitzios 2015). A flowchart or checklist should be provided, complete with all issues that should be considered, to allow authorities and developers to understand the scope and requirements of TIAs (Weller 2007). The extent of the assessment and level of detail required should be clearly explained and this should reflect the nature of different development types (Abley et al. 2010).
A minimum threshold should be defined for developments requiring assessment based on the use and size of the development. Flexible thresholds are preferred that relate to the scale of activity and the extent of impact. Guidelines should recommend a minimum study area limit (Weller 2007), with more detailed information provided on variable study area limits. It is recommended that the future year of assessment is at least 10 years (Abley et al. 2010) with design years ideally varying by location, extent and purpose of development.
The existing statutory and policy framework should be outlined with a description of how the TIA fits within that framework (Abley et al. 2010). The developer’s responsibility for cost mitigation should also be clarified, with guidance provided on the duration of assessment validity (van Rensburg & van As 2004). Guidelines should also prescribe the type of expertise and experience required by those preparing TIAs (van Rensburg & van As 2004).
2.3 Technical guidance To ensure that predictions of transport impacts are accurate, guidelines should include technical guidance about baseline conditions and key assumptions, with a full assessment of existing transport infrastructure (Transport for London 2010). Road safety and environmental impacts should also be given due consideration (Abley et al. 2010; van Rensburg & van As 2004). Guidance should be provided about seasonal factors reflecting different travel patterns and methodologies available to predict background traffic growth, including truck traffic growth (Muldoon & Bloomberg 2008). The impacts of servicing arrangements, construction traffic impacts, development phasing and the cumulative effects of surrounding developments form a significant part of assessment in international best practice (Transport for London 2010).
ATRF 2016 Proceedings
4
Guidance should be provided on defining the road network hierarchy, including the description of road conditions and traffic infrastructure (Transport for London 2010). The availability of current and comprehensive trip generation data is crucial (Weller 2007), with the methodology used for predicting trips having a significant effect on a TIA (Muldoon & Bloomberg 2008). Guidance on trip distribution analysis, as well as local and linked trips, should also be included to assess potential impacts on the transport network (Transport for London 2010). In addition, detailed information about parking considerations, road link impacts and intersection impacts should be provided (Abley et al. 2010).
2.4 Sustainability A key goal of TIAs is to enable sustainable development (van Rensburg & van As 2004). Road transport comprised 13% of Australia’s greenhouse gas emissions in 2008, with private vehicles accounting for 60% of these emissions (Australian Bureau of Statistics 2013). TIAs should therefore aim to reduce the demand for private travel, particularly single occupant car trips (Clark & Faid 2007). This includes the use of travel plans which are long-term management strategies that seek to deliver sustainable transport objectives (Transport for London 2010). Developers should give priority to sustainable transport modes before considering access by private vehicles (Abley et al. 2010). Guidance on existing routes and facilities, and level of service considerations, should be provided in detail for pedestrians, cyclists, public transport users and freight.
2.5 Review A key feature of international best practice is the requirement for TIAs to be reviewed prior to planning approval. In addition, transport related impacts at developments should be monitored beyond development occupation to ensure they are consistent with that for which approval was obtained (Scottish Executive 2005).
3. Assessment framework
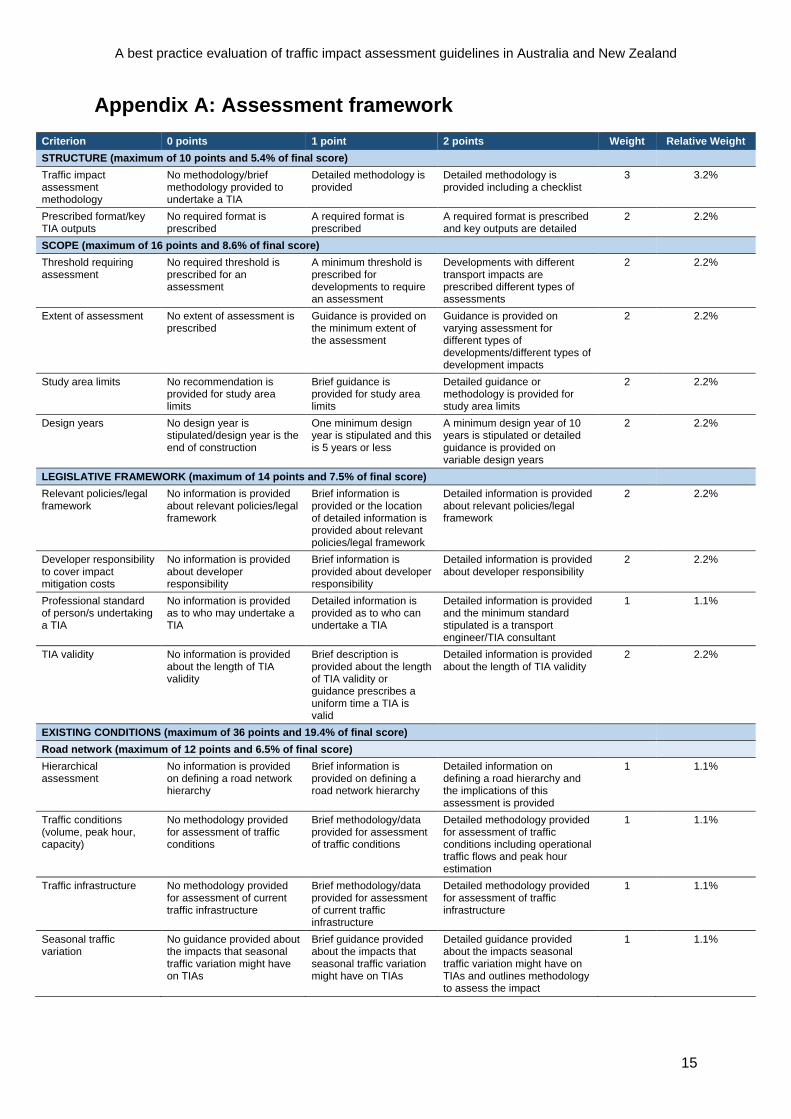
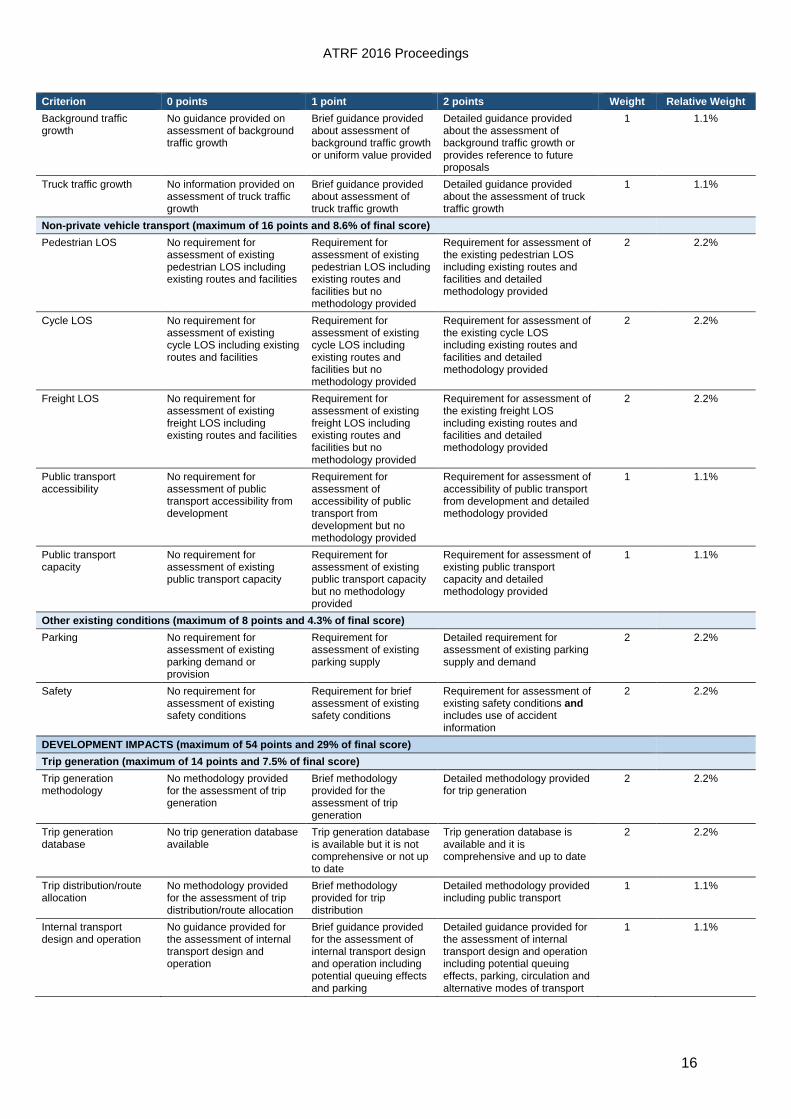
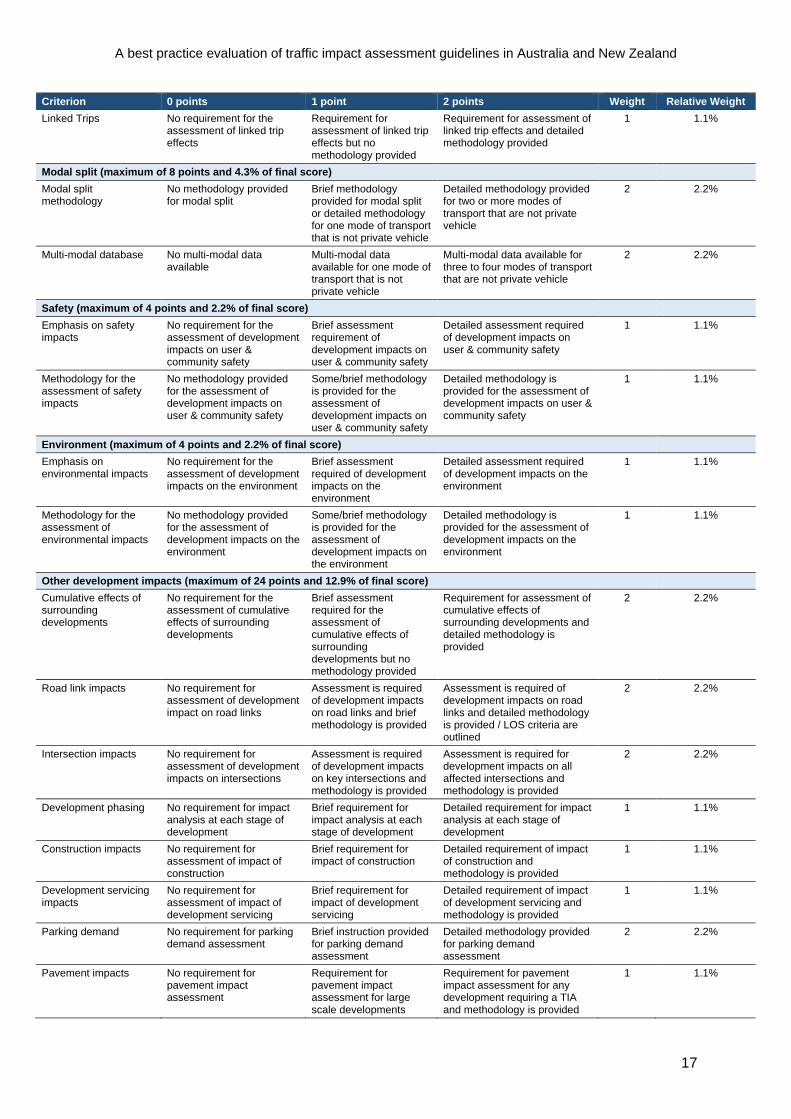
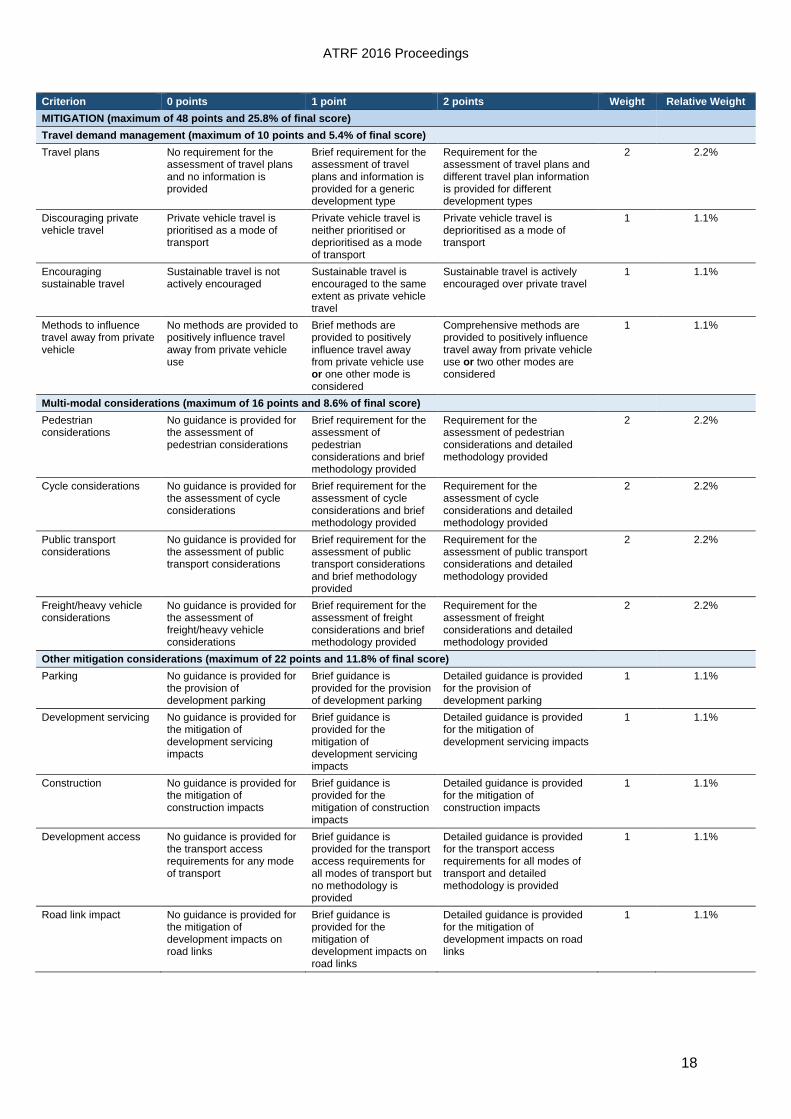
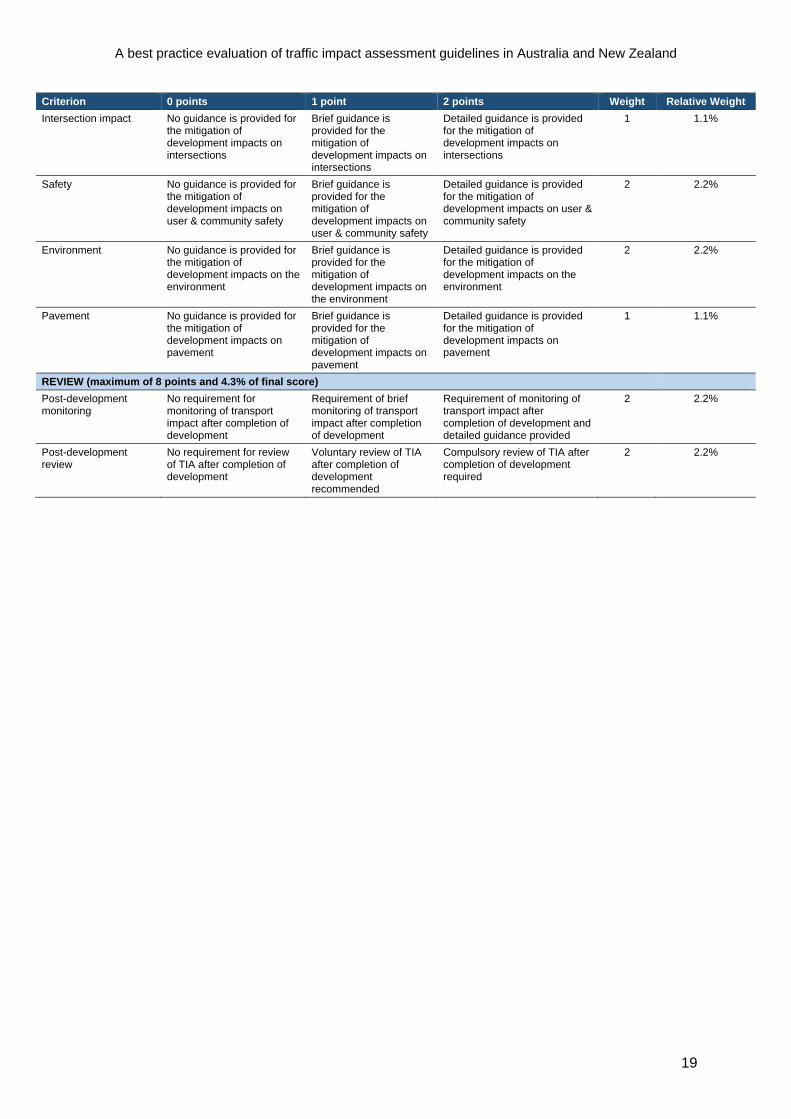
3.1 Overview Based on the literature review, a ‘scorecard’ approach was developed to evaluate each TIA guideline against a standard of best practice. A numerical weight was assigned to reflect the importance of different criteria, as supported by the research literature. Excluding the weighting of different elements in the scorecard, a criterion can score between 0 and 2 points. For the majority of criteria, the benchmark for a score of 1 implies either brief guidance or a stipulated requirement, while the benchmark for a score of 2 reflects the provision of detailed guidance and/or methodologies. These scores reflect the necessity for comprehensive detail in TIA guidance and should not be viewed as merely requiring quantity of information. ‘Brief guidance’ can also be considered as requiring the user to seek ancillary information to perform a TIA assessment and ‘detailed guidance’ provides a level of complete information. Guidelines having vast quantity of information may be unable to provide the user with comprehensive material to satisfy certain criteria. A copy of the full assessment framework is provided in Appendix A.
3.2 Assessment criteria The assessment criteria represent the key stages in the TIA process so as to flow in a chronological manner throughout each guideline. Critical inclusions regarding road safety and sustainability have been incorporated into these stage-based criteria, as it is important to consider these factors holistically throughout the process and not as isolated features.
A best practice evaluation of traffic impact assessment guidelines in Australia and New Zealand
5
Structure, scope and relevant legislative frameworks are presented first. It is important to identify these as explicit and separate elements in order to assess the relative strengths of the guidelines and also where improvements can be made in the regulation of assessments.
Existing conditions encompass all necessary information about the transport network prior to development. Criteria sub-headings isolate information specific to the road network, multi-modal transport considerations and other relevant aspects such as parking and safety.
The category of development impacts focuses on guidance given to the expected impact that a development will have on the transport network, including modes of transport other than private vehicles. Impacts of a development on user and community safety, as well as the environment, have separate sub-headings to allow for specific focus on these areas.
Aspects of sustainable development have been integrated into the category of mitigation. The sub-category of travel demand management outlines important factors that align with current views on improvements in transport planning and design. Multi-modal considerations are separated from general mitigation considerations to highlight the importance of providing for other modes of transport. Criteria for the mitigation of environmental, safety and road network impacts, among other elements, have also been included in this section of the assessment framework.
A final section dedicated to the review of TIAs has been included to highlight the importance of monitoring post-construction impacts and the necessity of reviewing TIAs prior to approval.
3.3 Numerical weighting Certain criteria were deemed to be more important than others in meeting the standard of best practice. A weighting of 1 was generally given to represent a standard level of importance to a guideline. Weightings of 2 and 3 were given to criteria with significant importance and critical importance respectively. The sole criterion weighted by a factor 3 was ‘traffic impact assessment methodology’, as this was viewed to be critically important (Weller 2007).
Criteria which support sustainability objectives were usually allocated a larger weighting. However, where these criteria were separated, for example ‘travel demand management’ which included four sub-criteria, a weighting of 1 was maintained to ensure this section was not of disproportionate overall importance.
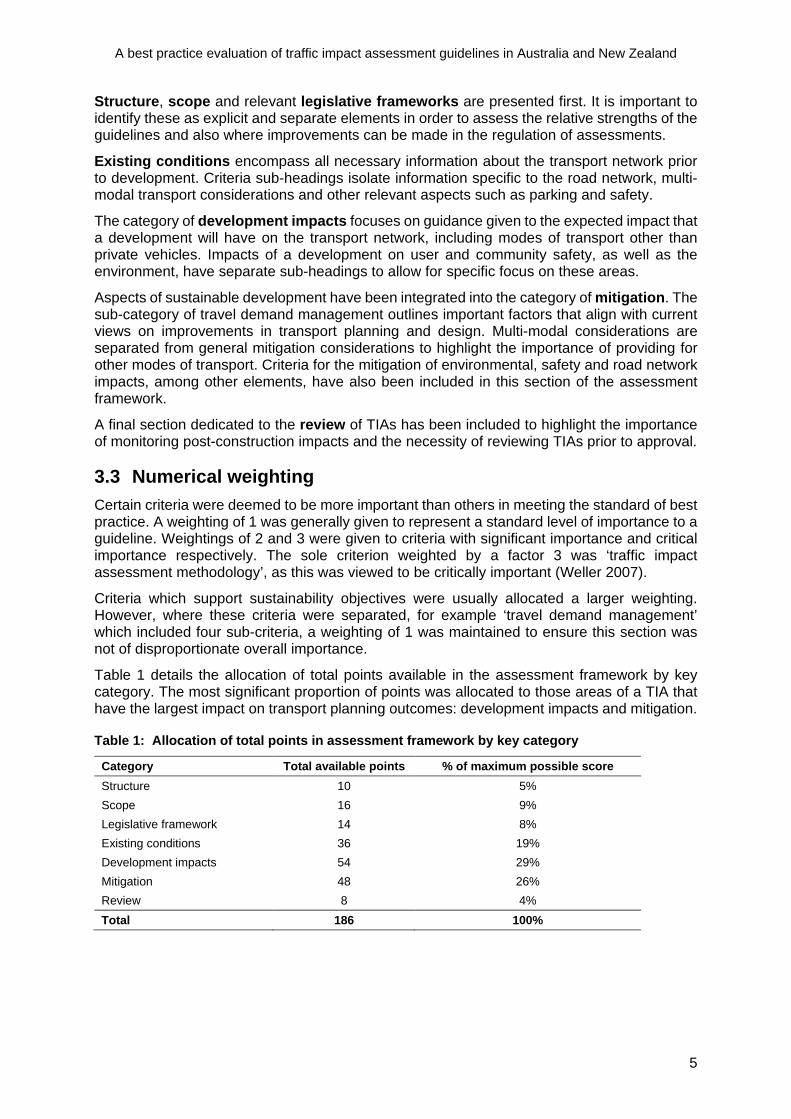
Table 1 details the allocation of total points available in the assessment framework by key category. The most significant proportion of points was allocated to those areas of a TIA that have the largest impact on transport planning outcomes: development impacts and mitigation.
Table 1: Allocation of total points in assessment framework by key category
Category Total available points % of maximum possible score Structure 10 5% Scope 16 9% Legislative framework 14 8% Existing conditions 36 19% Development impacts 54 29% Mitigation 48 26% Review 8 4% Total 186 100%
ATRF 2016 Proceedings
6
3.4 Application of assessment framework The assessment framework was used to evaluate seven published TIA guidelines in Australia and New Zealand, as listed in Section 1 of this paper. Only the content available within each guideline was assessed and no account was taken of any extraneous materials that were referenced. This meant, for example, that only Part 12 (Traffic Impacts of Developments) of the Austroads Guide to Traffic Management (Austroads 2009) was assessed to the exclusion of any other relevant parts of the Guide. As aforementioned, guidance should be contained within the one document to increase ease of use and to ensure all relevant information is delivered to the user in its entirety (Bitzios 2015).
3.5 Limitations of assessment framework It is important before presenting the results of the evaluation to acknowledge the limitations of this research. Generation of the framework relied entirely on the literature review of what constituted best practice in TIA. Although the authors focused on maintaining objectivity throughout the development and use of the framework, the inclusions, applied weighting and overall balance of the scorecard remains the informed opinion of the authors and should be construed as such. In future, it would be beneficial to seek the opinions of academics, various transport stakeholders and industry participants to revise and refine the framework in order to provide a more accurate standard with which to measure best practice. The results and conclusions drawn from this evaluation are therefore indicative only. Final conclusions may only be drawn from such aforementioned revision.
4. Assessment results In presenting the results of the assessment, the guidelines will be referred to by their designed region. For example, ‘Guide to Traffic Management Part 12: Traffic Impacts of Development’ (Austroads 2009) will be referred to as ‘Australia’, while ‘Integrated Transport Assessment Guidelines’ (Auckland Transport 2015) will be referred to as ‘Auckland’.
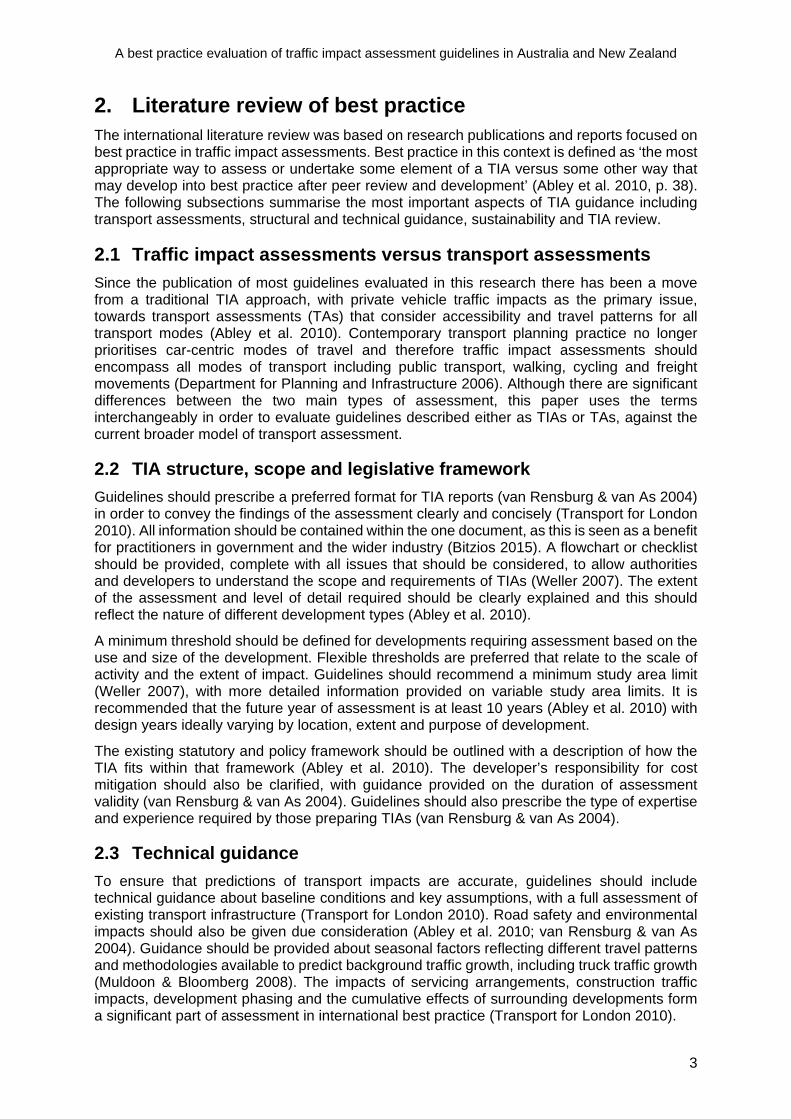
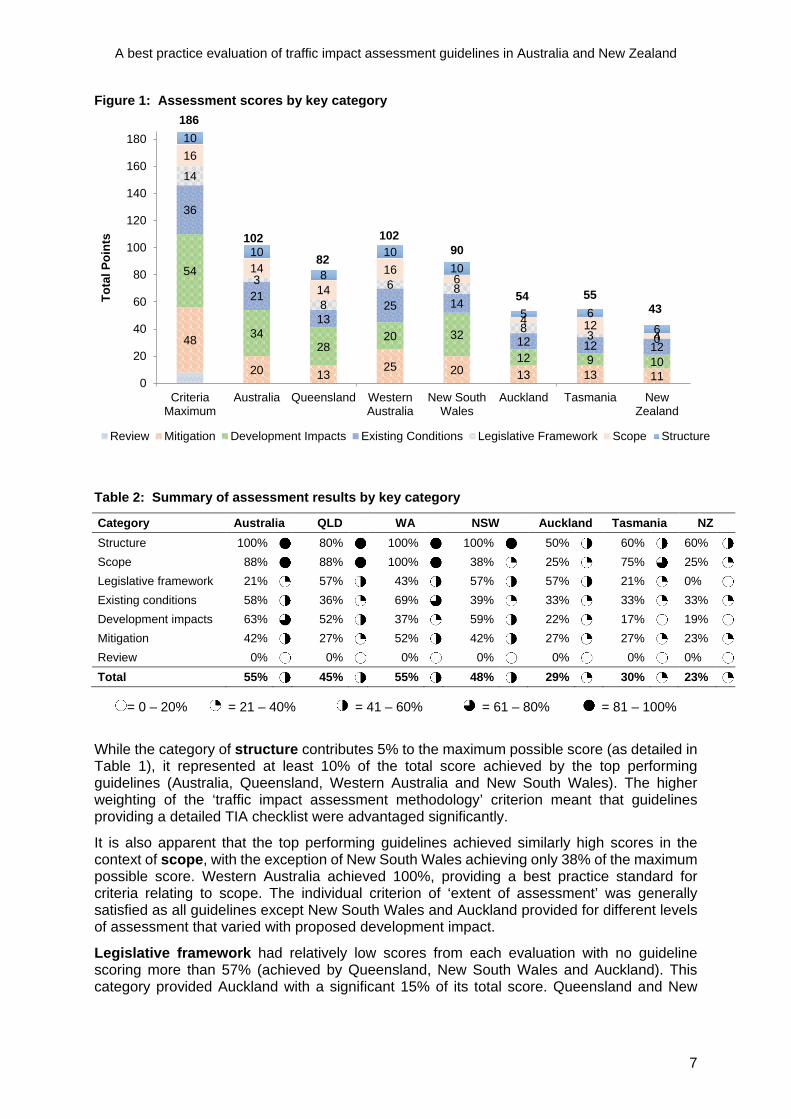
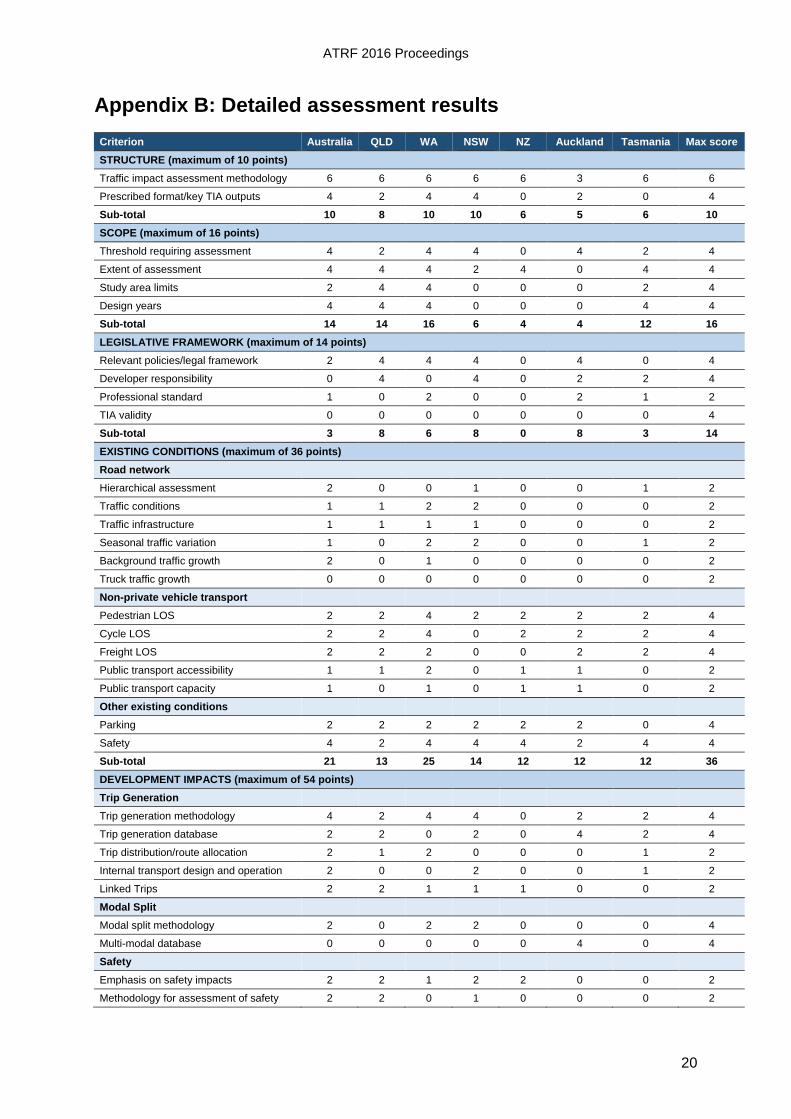
4.1 Total scores by key category Figure 1 shows the total scores for each guideline and disaggregates these by key category. A summary of results is also provided in Table 2 where the performance of each guideline is expressed as a percentage of the maximum possible score. Detailed scores for each guideline are provided in Appendix B.
The Australian and Western Australian guidelines achieved a total of 102 points from a maximum possible score of 186 points (equivalent to 55%). This was closely followed by New South Wales and Queensland which achieved a total of 90 points (48%) and 82 points (45%) respectively. Auckland and Tasmania achieved similar aggregate scores of 54 points (29%) and 55 points (30%) respectively. The lowest total score of 43 points (23%) was achieved by the national guidelines for New Zealand.
A best practice evaluation of traffic impact assessment guidelines in Australia and New Zealand
7
Figure 1: Assessment scores by key category
Table 2: Summary of assessment results by key category
Category Australia QLD WA NSW Auckland Tasmania NZ Structure 100% 80% 100% 100% 50% 60% 60% Scope 88% 88% 100% 38% 25% 75% 25% Legislative framework 21% 57% 43% 57% 57% 21% 0% Existing conditions 58% 36% 69% 39% 33% 33% 33% Development impacts 63% 52% 37% 59% 22% 17% 19% Mitigation 42% 27% 52% 42% 27% 27% 23% Review 0% 0% 0% 0% 0% 0% 0% Total 55% 45% 55% 48% 29% 30% 23%
= 0 – 20% = 21 – 40% = 41 – 60% = 61 – 80% = 81 – 100%
While the category of structure contributes 5% to the maximum possible score (as detailed in Table 1), it represented at least 10% of the total score achieved by the top performing guidelines (Australia, Queensland, Western Australia and New South Wales). The higher weighting of the ‘traffic impact assessment methodology’ criterion meant that guidelines providing a detailed TIA checklist were advantaged significantly.
It is also apparent that the top performing guidelines achieved similarly high scores in the context of scope, with the exception of New South Wales achieving only 38% of the maximum possible score. Western Australia achieved 100%, providing a best practice standard for criteria relating to scope. The individual criterion of ‘extent of assessment’ was generally satisfied as all guidelines except New South Wales and Auckland provided for different levels of assessment that varied with proposed development impact.
Legislative framework had relatively low scores from each evaluation with no guideline scoring more than 57% (achieved by Queensland, New South Wales and Auckland). This category provided Auckland with a significant 15% of its total score. Queensland and New
48
20 1325 20 13 13 11
54
3428
20 32
12 9 10
36
21
1325 14
12 12 12
14
3
8
6 8
8 3 0
16
14
14
166
4 124
10
10
8
1010
5 66
0
20
40
60
80
100
120
140
160
180
CriteriaMaximum
Australia Queensland WesternAustralia
New SouthWales
Auckland Tasmania NewZealand
Tota
l Poi
nts
Review Mitigation Development Impacts Existing Conditions Legislative Framework Scope Structure
186
102
82
102 90
54 55 43
ATRF 2016 Proceedings
8
South Wales delivered the best guidance on ‘developer responsibility to cover impact mitigation costs’, with highly detailed and methodical provisions.
For the category of existing conditions, Western Australia had the highest performance of all guidelines, achieving 69% of the maximum possible score. A lack of information regarding routes, facilities and level of service (LOS) for non-private vehicle modes meant many guidelines lost significant marks in a category that was weighted relatively highly. However, ‘Existing safety conditions’ was generally well addressed, with every guideline except Queensland and Auckland achieving the maximum score for this criterion.
The category of development impacts had the largest number of available points, accounting for 29% of the total score. Australia had the highest score for this category across all guidelines, achieving 63% of the maximum possible score. The category assessed a relatively large amount of technical guidance and therefore benefitted guidelines such as Australia that included dedicated sections on trip generation, trip distribution, hierarchical assessment and internal design, among other aspects. New South Wales provided the most detailed section on land use traffic generation which is reflected by the use of this section in other guidelines in the region and also internationally (Weller 2007). Although the New South Wales trip generation database is comprehensive, it does not provide current information and could not achieve the maximum score for this criterion. Auckland provided little technical guidance but benefitted from a current and comprehensive trip generation database. Tasmania and New Zealand received the lowest points for development impacts, achieving only 17% and 19% of the maximum possible score respectively, as neither provided detailed technical guidance.
Mitigation criteria represented 25% of the available points yet resulted in a score of only 23-52% across all guidelines. A key contribution to these scores came from the sub-criteria of ‘travel demand’. New Zealand and Auckland achieved 60% of these available points, while Western Australia was the highest scoring Australian guideline achieving 50% of the maximum score. Points allocated to mitigation for alternative modes of transport, as well as construction, servicing and development access, had a similarly low threshold to obtain 1 point. Because of this, the majority of guidelines were able to satisfy the standard for 1 point in each of these criteria through providing only brief coverage of these mitigation measures.
The review component of the assessment received no points by any of the guidelines.
4.2 Comparisons by guideline An issue evident in the Australian guidelines was a lack of guidance about the legislative and policy framework. However, given variations between states and territories, it may be more challenging for Australian-wide guidance to provide detailed information about legislation, developer contributions, and TIA validity. Although the Australian guidelines provided detailed technical information, many sections of the guideline refer to other parts of the Austroads Guide that provides more specific information on topics such as parking and development access. It may be likely that users of the Australian guidelines would consult other parts of the Austroads Guide to complete a TIA, but this cannot be relied upon.
Queensland performed relatively well in the first three categories, achieving 57-88% of the maximum possible score allocated to scope, structure and legislative framework. A large proportion of points was gained from brief statements regarding requirements for alternative modes of transport. However, for criteria such as safety and environment, Queensland outperformed the other guidelines, achieving 7 out of 8 points and 8 out of 8 points respectively.
A key feature included in the guidelines for Western Australia was the integration of the legislative and policy context into each sub-section of the guidance. The results of this guideline’s assessment are somewhat divided, performing very well in the area of alternative transport modes (only losing a total of 5 from the 33 available points), but relatively poor in critical areas of safety and environmental considerations.
A best practice evaluation of traffic impact assessment guidelines in Australia and New Zealand
9
The New South Wales guidelines are a key example of where a large amount of technical guidance on traffic impacts is provided at the expense of alternative modes of transport. Much of the guidance is dedicated to land use traffic generation and large portions of the publication give highly detailed information regarding road link and intersection performance. Alternative transport modes are not significantly considered until the mitigation stage of the guidance, and even at this stage the only detailed information presented relates to service and freight vehicles. However, this guideline performs well in terms of safety considerations and includes a large section on environmental concerns.
The guidelines from Auckland and New Zealand achieved very similar results to one another, with both gaining significant points for incorporating sustainable development objectives. Guidance on discouraging private vehicles distinguished both New Zealand guidelines from the majority of the Australian guidelines. New Zealand provided more detailed information about the extent of assessments, but both guidelines achieved points for requirements relating to multi-modal transport considerations and other development impact and mitigation criteria. Both guidelines were preceded by a literature review on best practice in traffic impact assessments (Weller 2007) that appeared to provide more technical detail than the resulting guidelines.
Tasmania achieved a similar result to that of Auckland and New Zealand, but omitted the inclusion of sustainable development objectives. This guideline scored highly for structural inclusions that were detailed and comprehensive, but lacked significant detail for technical guidance on alternative transport modes as well as trip generation, road link impacts and intersection performance.
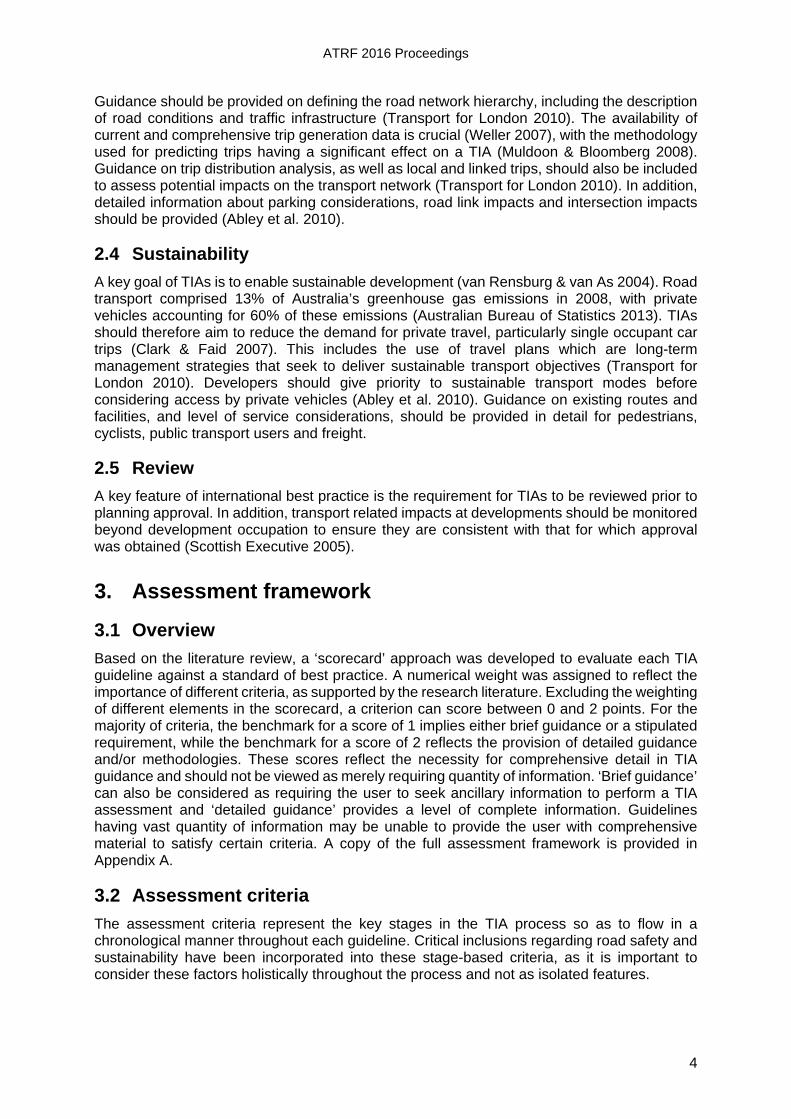
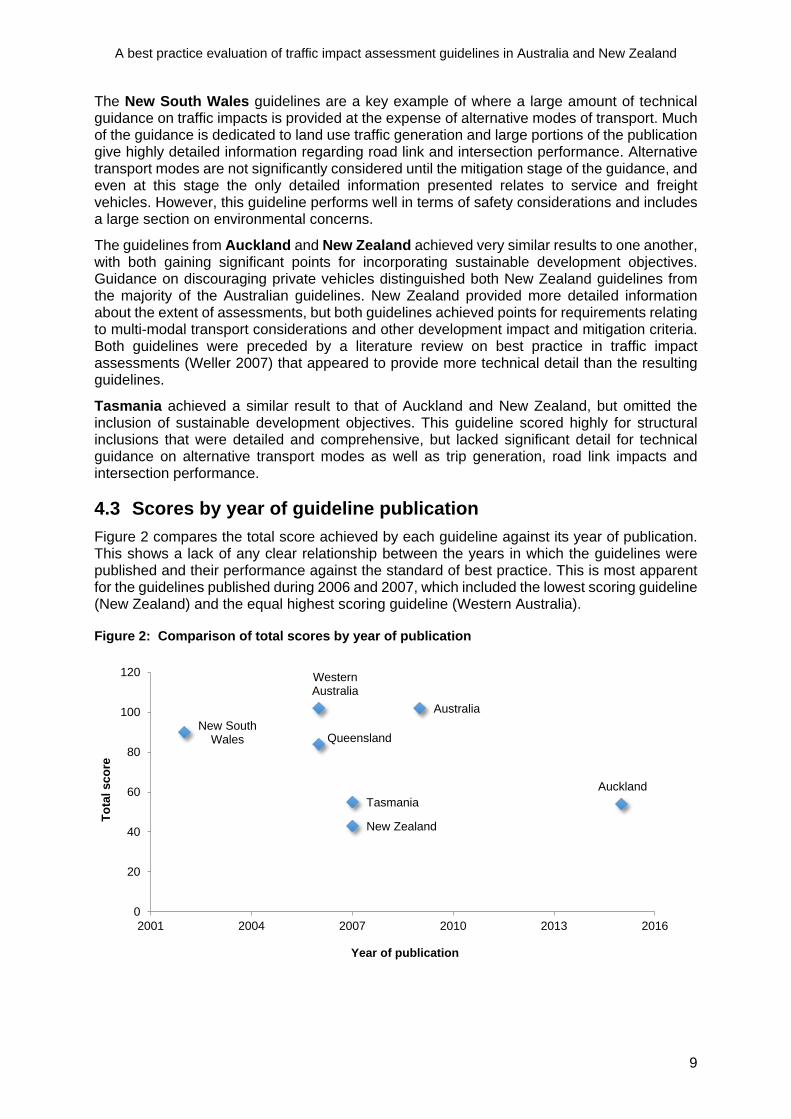
4.3 Scores by year of guideline publication Figure 2 compares the total score achieved by each guideline against its year of publication. This shows a lack of any clear relationship between the years in which the guidelines were published and their performance against the standard of best practice. This is most apparent for the guidelines published during 2006 and 2007, which included the lowest scoring guideline (New Zealand) and the equal highest scoring guideline (Western Australia).
Figure 2: Comparison of total scores by year of publication
Australia
Queensland
WesternAustralia
New SouthWales
AucklandTasmania
New Zealand
0
20
40
60
80
100
120
2001 2004 2007 2010 2013 2016
Tota
l sco
re
Year of publication
ATRF 2016 Proceedings
10
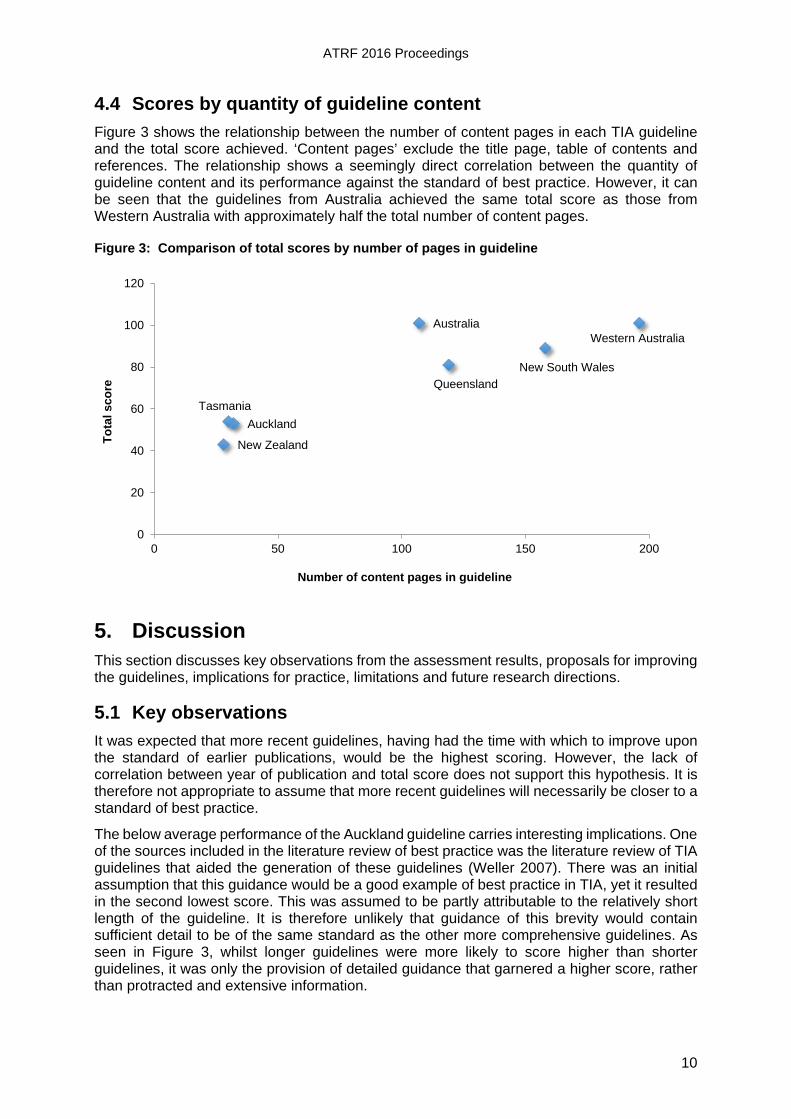
4.4 Scores by quantity of guideline content Figure 3 shows the relationship between the number of content pages in each TIA guideline and the total score achieved. ‘Content pages’ exclude the title page, table of contents and references. The relationship shows a seemingly direct correlation between the quantity of guideline content and its performance against the standard of best practice. However, it can be seen that the guidelines from Australia achieved the same total score as those from Western Australia with approximately half the total number of content pages.
Figure 3: Comparison of total scores by number of pages in guideline
5. Discussion This section discusses key observations from the assessment results, proposals for improving the guidelines, implications for practice, limitations and future research directions.
5.1 Key observations It was expected that more recent guidelines, having had the time with which to improve upon the standard of earlier publications, would be the highest scoring. However, the lack of correlation between year of publication and total score does not support this hypothesis. It is therefore not appropriate to assume that more recent guidelines will necessarily be closer to a standard of best practice.
The below average performance of the Auckland guideline carries interesting implications. One of the sources included in the literature review of best practice was the literature review of TIA guidelines that aided the generation of these guidelines (Weller 2007). There was an initial assumption that this guidance would be a good example of best practice in TIA, yet it resulted in the second lowest score. This was assumed to be partly attributable to the relatively short length of the guideline. It is therefore unlikely that guidance of this brevity would contain sufficient detail to be of the same standard as the other more comprehensive guidelines. As seen in Figure 3, whilst longer guidelines were more likely to score higher than shorter guidelines, it was only the provision of detailed guidance that garnered a higher score, rather than protracted and extensive information.
Australia
Queensland
Western Australia
New South Wales
AucklandTasmania
New Zealand
0
20
40
60
80
100
120
0 50 100 150 200
Tota
l sco
re
Number of content pages in guideline
A best practice evaluation of traffic impact assessment guidelines in Australia and New Zealand
11
There was also an expectation that the New South Wales guidelines would perform well as this guidance is relied upon across Australia, and in other countries that do not have their own national guidelines (Weller 2007). It is important to note however that the large benefits of this guidance, such as highly detailed and comprehensive information about land use traffic generation, comprised only a small component of the assessment framework. It might be inferred from these results that although this guidance in some aspects is very comprehensive, it also has narrow breadth in the content of information covered.
5.2 Proposals for improvement Although the composition of scores differs in the assessment of each individual guideline, there are many ways in which the guidelines could be improved to increase their total score. Percentage increases referred to in this section are relative to the current score of the guideline, not as a percentage increase of total achievable points.
Legislative framework was one of the lowest scoring components in the assessment. By including information such as an outline of the policy framework, the developer’s responsibility to cover mitigation costs and TIA validity, Australia and Western Australia as the highest scoring guidelines could see increases in their current aggregate scores of 11% and 8% respectively. New Zealand, receiving the lowest aggregate score, could expect an increase of up to 33% by addressing each of the legislative framework criteria.
The component of mitigation comprises 26% of total points but resulted in relatively low scores across the seven guidelines, therefore offering a significant opportunity for improvement. A key section of mitigation underrepresented in the results was the 10 points allocated to travel demand management, an area that is key to promoting sustainable development and catering for modes other than the private car (Department for Planning and Infrastructure 2006). If top performing guidelines such as those from Western Australia and Australia provided detailed guidance on promoting sustainable travel, including information on travel plans, increases in total scores of 6-8% could be expected. Including information about sustainable development objectives, environmental considerations and travel demand management, could see an increase in the total score of up to 31% for Tasmania.
The assessment framework allocates up to 32 points for information regarding alternative transport modes as part of existing conditions and mitigation. If each guideline provided detailed information about specific multi-modal considerations for both these sections, the guidelines could experience significant increases in their total scores. In particular, New Zealand and Tasmania could expect increases of up to 44% and 39% respectively.
Another key area for improvement is in the review component. None of the assessed guidelines from Australia or New Zealand provided any information regarding the review of completed TIAs or the need for post-construction monitoring. As the requirement for traffic impact assessments expands in the context of urban planning and sustainable development, it is important that assessments are not viewed merely as a hurdle for development approval.
5.3 Implications for practice There are two key types of implications that arise from the results reported in this paper. The first concerns the content of TIA guidelines, while the second relates to the post-occupation impacts of TIA guidelines.
Guidelines such as Auckland and New Zealand that lack guidance regarding scope, structure and thresholds of a TIA can generate assessments of varying detail, extent and format. It is therefore important that guidelines are sufficiently comprehensive so that TIAs are of suitable quality prior to granting planning approval. Tasmania and New Zealand, by not including information regarding legislative and policy frameworks, could result in assessments that do not appropriately reflect the broader legal and policy context for the region. This may result in delays and revisions in the TIA process that could have otherwise been avoided.
ATRF 2016 Proceedings
12
New Zealand and Auckland both received relatively high scores for sustainability related criteria, which could result in a greater emphasis on sustainability in developments in these regions. In contrast, the use of other guidelines, notably Australia, Queensland, New South Wales and Tasmania, may result in developments that are less environmentally focused.
The availability of trip generation databases, both private vehicle and multi-modal, can also have practical implications for transport planning. The reliance on the New South Wales database by many guidelines can mean that trip generation estimates are based on assumptions and information that are no longer current, resulting in inaccurate predictions of transport impacts. Auckland was the only guideline to provide a current and comprehensive multi-modal trip generation database but this guideline lacked technical information on the effective application of the database. Australia and New South Wales provided large volumes of technical information that could have aided multi-modal design, yet only used a private vehicle trip generation database and brief material about generating a modal split. Guidance that adopts a multi-modal trip generation database, and provides sufficient technical information on its use, would better equip practitioners in preparing TIAs.
One of the key factors eliciting a spread of results throughout the guidelines was the inclusion of safety and environmental measures. Guidance that excludes such information, for example Auckland and New Zealand, risk separating these elements out from a holistic design process. Safety and environmental considerations should always be embedded in the TIA process to ensure these elements are adequately addressed.
The lack of review and monitoring requirements poses a key issue for the practical application of TIAs. Guidance with no requirement to evaluate the accuracy of predicted transport impacts, coupled with no incentive to modify the existing TIA, may result in a lack of accountability for the development. Assumptions and decisions inherent in the preparation of a TIA should ideally be tested against outcomes measured at the development following occupation.
5.4 Limitations and future research directions This research has a number of limitations that should be addressed in future research. First, an initial decision was made to confine the standard of best practice to current elements of traffic impact assessments, to the exclusion of untested practices. Although based on the rationale of providing reliability of advised content in guidelines, this has the concurrent effect of rejecting new and innovative ways with which TIAs could be performed. This may have caused the assessment framework to be too ‘traditional’, limiting the amount of points possible for the newer and more recent guidelines.
As outlined in section 3.5 of this paper, the largest limitation of this research lies in the subjectivity of the creation and use of the assessment framework. Although the standard of best practice was developed through an extensive literature review, there will always be an element of the authors’ judgment regarding the selection of criteria included in the assessment framework, the weighting given to those criteria and the scoring allocated to the guidelines under assessment. Future research could therefore seek both professional and industry opinion on the assessment framework itself, and also look to test the reliability of the results and conclusions drawn.
A second limitation of this research was the lack of information available about industry use and user satisfaction with the guidelines evaluated. This could be explored in future research through a survey of practitioners involved in the preparation and use of TIAs.
Future research might also be extended to assessing local TIA guidelines in Australia and New Zealand, such as those prepared by local governments. International TIA guidelines might also be assessed to understand the extent to which these meet the standard of best practice.
A best practice evaluation of traffic impact assessment guidelines in Australia and New Zealand
13
6. Conclusion The aim of the research underlying this paper was to understand what a standard of best practice means in the context of TIA and to what extent the Australian and New Zealand TIA guidelines represent this standard. It is now possible to revisit this aim by answering the two primary research questions posed at the beginning of this paper:
Research question 1: What constitutes best practice in TIA?
An international literature review revealed a shift from assessments focused solely on ‘traffic’ impacts towards ‘transport assessments’ that consider all modes of transport. Other key elements of best practice include structural and technical guidance, sustainability considerations, and monitoring and review processes.
Research question 2: To what extent do Australian and New Zealand TIA guidelines represent best practice?
The assessment found that the Australian-wide guidelines published by Austroads and the state guidelines for Western Australia provided the closest examples of best practice in TIA guidance. Although receiving the highest scores in the assessment, it is clear that considerable improvement is needed within each individual guideline and across TIA guidance in Australia and New Zealand more generally. Information regarding sustainable development objectives in TIAs, the legislative framework and the incorporation of multi-modal transport considerations represent key areas for improvement.
In closing, this paper has provided an understanding of best practice in TIA guidelines and an indication of the extent to which it is met in Australian and New Zealand. The results of the assessment can be used to inform future revisions of existing TIA guidelines as well as the development of new TIA guidelines in other jurisdictions to ensure they meet best practice standards.
ATRF 2016 Proceedings
14
References Abley, S, Durdin, P & Douglass, M 2010, Integrated transport assessment guidelines, Research Report 422, NZ Transport Agency, Wellington, New Zealand. Auckland Transport 2015, Integrated Transport Assessment Guidelines, Auckland, New Zealand. Australian Bureau of Statistics 2013, 1370.0 Measures of Australia's Progress, 2010, Australia. Austroads 2009, Guide to Traffic Management Part 12: Traffic Impacts of Development, Austroads Publication No. AGTM12/09, Austroads Incorporated, Sydney, Australia. Bitzios, D 2015, 'Time for change: A new approach to TIAs', paper presented to Australian Institute of Traffic Planning and Management (AITPM) National Conference, Brisbane, Australia. Clark, I & Faid, M 2007, 'Guidelines for undertaking Transport Assessments in Australia and New Zealand', paper presented to Australian Institute of Traffic Planning and Management (AITPM) National Conference, Canberra, Australia. Collins, Z, Fuller, N & Weller, P 2007, Transport impact guidelines for site development, Research Report 327, Part 1, Land Transport New Zealand, Wellington, New Zealand. Department for Planning and Infrastructure 2006, Transport Assessment Guidelines for Developments, Western Australian Planning Commission, Australia. Department of Infrastructure, Energy and Resources, 2007, Traffic Impact Assessments (TIA) Guidelines, Tasmania, Australia. Department of Main Roads 2006, Guidelines for Assessment of Road Impacts of Development, Queensland Government, Brisbane, Australia. Muldoon, D & Bloomberg, L 2008, 'Development of Best Practices for Traffic Impact Studies', Transportation Research Record: Journal of the Transportation Research Board, no. 2077, pp. 32-8. Roads and Traffic Authority 2002, Guide to Traffic Generating Developments, Issue 2.2, NSW, Australia. Scottish Executive 2005, Transport Assessment and Implementation: A Guide, Edinburgh, Scotland. Stutzke, RD 2005, Estimating software-intensive systems: projects, products, and processes, Pearson Education, New Jersey, United States. Transport for London 2010, Transport assessment best practice: Guidance document, London, United Kingdom. van Rensburg, JF & van As, SC 2004, 'Issues with Traffic Impact Assessments', paper presented to 23rd South African Transport Conference (SATC), Pretoria, South Africa. Weller, P 2007, Transport impact guidelines for site development: Literature review, Research Report 327, Part 2, Land Transport New Zealand, Wellington, New Zealand.
A best practice evaluation of traffic impact assessment guidelines in Australia and New Zealand
15
Appendix A: Assessment framework Criterion 0 points 1 point 2 points Weight Relative Weight STRUCTURE (maximum of 10 points and 5.4% of final score) Traffic impact assessment methodology
No methodology/brief methodology provided to undertake a TIA
Detailed methodology is provided
Detailed methodology is provided including a checklist
3 3.2%
Prescribed format/key TIA outputs
No required format is prescribed
A required format is prescribed
A required format is prescribed and key outputs are detailed
2 2.2%
SCOPE (maximum of 16 points and 8.6% of final score) Threshold requiring assessment
No required threshold is prescribed for an assessment
A minimum threshold is prescribed for developments to require an assessment
Developments with different transport impacts are prescribed different types of assessments
2 2.2%
Extent of assessment No extent of assessment is prescribed
Guidance is provided on the minimum extent of the assessment
Guidance is provided on varying assessment for different types of developments/different types of development impacts
2 2.2%
Study area limits No recommendation is provided for study area limits
Brief guidance is provided for study area limits
Detailed guidance or methodology is provided for study area limits
2 2.2%
Design years No design year is stipulated/design year is the end of construction
One minimum design year is stipulated and this is 5 years or less
A minimum design year of 10 years is stipulated or detailed guidance is provided on variable design years
2 2.2%
LEGISLATIVE FRAMEWORK (maximum of 14 points and 7.5% of final score) Relevant policies/legal framework
No information is provided about relevant policies/legal framework
Brief information is provided or the location of detailed information is provided about relevant policies/legal framework
Detailed information is provided about relevant policies/legal framework
2 2.2%
Developer responsibility to cover impact mitigation costs
No information is provided about developer responsibility
Brief information is provided about developer responsibility
Detailed information is provided about developer responsibility
2 2.2%
Professional standard of person/s undertaking a TIA
No information is provided as to who may undertake a TIA
Detailed information is provided as to who can undertake a TIA
Detailed information is provided and the minimum standard stipulated is a transport engineer/TIA consultant
1 1.1%
TIA validity No information is provided about the length of TIA validity
Brief description is provided about the length of TIA validity or guidance prescribes a uniform time a TIA is valid
Detailed information is provided about the length of TIA validity
2 2.2%
EXISTING CONDITIONS (maximum of 36 points and 19.4% of final score) Road network (maximum of 12 points and 6.5% of final score) Hierarchical assessment
No information is provided on defining a road network hierarchy
Brief information is provided on defining a road network hierarchy
Detailed information on defining a road hierarchy and the implications of this assessment is provided
1 1.1%
Traffic conditions (volume, peak hour, capacity)
No methodology provided for assessment of traffic conditions
Brief methodology/data provided for assessment of traffic conditions
Detailed methodology provided for assessment of traffic conditions including operational traffic flows and peak hour estimation
1 1.1%
Traffic infrastructure No methodology provided for assessment of current traffic infrastructure
Brief methodology/data provided for assessment of current traffic infrastructure
Detailed methodology provided for assessment of traffic infrastructure
1 1.1%
Seasonal traffic variation
No guidance provided about the impacts that seasonal traffic variation might have on TIAs
Brief guidance provided about the impacts that seasonal traffic variation might have on TIAs
Detailed guidance provided about the impacts seasonal traffic variation might have on TIAs and outlines methodology to assess the impact
1 1.1%
ATRF 2016 Proceedings
16
Criterion 0 points 1 point 2 points Weight Relative Weight Background traffic growth
No guidance provided on assessment of background traffic growth
Brief guidance provided about assessment of background traffic growth or uniform value provided
Detailed guidance provided about the assessment of background traffic growth or provides reference to future proposals
1 1.1%
Truck traffic growth No information provided on assessment of truck traffic growth
Brief guidance provided about assessment of truck traffic growth
Detailed guidance provided about the assessment of truck traffic growth
1 1.1%
Non-private vehicle transport (maximum of 16 points and 8.6% of final score) Pedestrian LOS No requirement for
assessment of existing pedestrian LOS including existing routes and facilities
Requirement for assessment of existing pedestrian LOS including existing routes and facilities but no methodology provided
Requirement for assessment of the existing pedestrian LOS including existing routes and facilities and detailed methodology provided
2 2.2%
Cycle LOS No requirement for assessment of existing cycle LOS including existing routes and facilities
Requirement for assessment of existing cycle LOS including existing routes and facilities but no methodology provided
Requirement for assessment of the existing cycle LOS including existing routes and facilities and detailed methodology provided
2 2.2%
Freight LOS No requirement for assessment of existing freight LOS including existing routes and facilities
Requirement for assessment of existing freight LOS including existing routes and facilities but no methodology provided
Requirement for assessment of the existing freight LOS including existing routes and facilities and detailed methodology provided
2 2.2%
Public transport accessibility
No requirement for assessment of public transport accessibility from development
Requirement for assessment of accessibility of public transport from development but no methodology provided
Requirement for assessment of accessibility of public transport from development and detailed methodology provided
1 1.1%
Public transport capacity
No requirement for assessment of existing public transport capacity
Requirement for assessment of existing public transport capacity but no methodology provided
Requirement for assessment of existing public transport capacity and detailed methodology provided
1 1.1%
Other existing conditions (maximum of 8 points and 4.3% of final score) Parking No requirement for
assessment of existing parking demand or provision
Requirement for assessment of existing parking supply
Detailed requirement for assessment of existing parking supply and demand
2 2.2%
Safety No requirement for assessment of existing safety conditions
Requirement for brief assessment of existing safety conditions
Requirement for assessment of existing safety conditions and includes use of accident information
2 2.2%
DEVELOPMENT IMPACTS (maximum of 54 points and 29% of final score) Trip generation (maximum of 14 points and 7.5% of final score) Trip generation methodology
No methodology provided for the assessment of trip generation
Brief methodology provided for the assessment of trip generation
Detailed methodology provided for trip generation
2 2.2%
Trip generation database
No trip generation database available
Trip generation database is available but it is not comprehensive or not up to date
Trip generation database is available and it is comprehensive and up to date
2 2.2%
Trip distribution/route allocation
No methodology provided for the assessment of trip distribution/route allocation
Brief methodology provided for trip distribution
Detailed methodology provided including public transport
1 1.1%
Internal transport design and operation
No guidance provided for the assessment of internal transport design and operation
Brief guidance provided for the assessment of internal transport design and operation including potential queuing effects and parking
Detailed guidance provided for the assessment of internal transport design and operation including potential queuing effects, parking, circulation and alternative modes of transport
1 1.1%
A best practice evaluation of traffic impact assessment guidelines in Australia and New Zealand
17
Criterion 0 points 1 point 2 points Weight Relative Weight Linked Trips No requirement for the
assessment of linked trip effects
Requirement for assessment of linked trip effects but no methodology provided
Requirement for assessment of linked trip effects and detailed methodology provided
1 1.1%
Modal split (maximum of 8 points and 4.3% of final score) Modal split methodology
No methodology provided for modal split
Brief methodology provided for modal split or detailed methodology for one mode of transport that is not private vehicle
Detailed methodology provided for two or more modes of transport that are not private vehicle
2 2.2%
Multi-modal database No multi-modal data available
Multi-modal data available for one mode of transport that is not private vehicle
Multi-modal data available for three to four modes of transport that are not private vehicle
2 2.2%
Safety (maximum of 4 points and 2.2% of final score) Emphasis on safety impacts
No requirement for the assessment of development impacts on user & community safety
Brief assessment requirement of development impacts on user & community safety
Detailed assessment required of development impacts on user & community safety
1 1.1%
Methodology for the assessment of safety impacts
No methodology provided for the assessment of development impacts on user & community safety
Some/brief methodology is provided for the assessment of development impacts on user & community safety
Detailed methodology is provided for the assessment of development impacts on user & community safety
1 1.1%
Environment (maximum of 4 points and 2.2% of final score) Emphasis on environmental impacts
No requirement for the assessment of development impacts on the environment
Brief assessment required of development impacts on the environment
Detailed assessment required of development impacts on the environment
1 1.1%
Methodology for the assessment of environmental impacts
No methodology provided for the assessment of development impacts on the environment
Some/brief methodology is provided for the assessment of development impacts on the environment
Detailed methodology is provided for the assessment of development impacts on the environment
1 1.1%
Other development impacts (maximum of 24 points and 12.9% of final score) Cumulative effects of surrounding developments
No requirement for the assessment of cumulative effects of surrounding developments
Brief assessment required for the assessment of cumulative effects of surrounding developments but no methodology provided
Requirement for assessment of cumulative effects of surrounding developments and detailed methodology is provided
2 2.2%
Road link impacts No requirement for assessment of development impact on road links
Assessment is required of development impacts on road links and brief methodology is provided
Assessment is required of development impacts on road links and detailed methodology is provided / LOS criteria are outlined
2 2.2%
Intersection impacts No requirement for assessment of development impacts on intersections
Assessment is required of development impacts on key intersections and methodology is provided
Assessment is required for development impacts on all affected intersections and methodology is provided
2 2.2%
Development phasing No requirement for impact analysis at each stage of development
Brief requirement for impact analysis at each stage of development
Detailed requirement for impact analysis at each stage of development
1 1.1%
Construction impacts No requirement for assessment of impact of construction
Brief requirement for impact of construction
Detailed requirement of impact of construction and methodology is provided
1 1.1%
Development servicing impacts
No requirement for assessment of impact of development servicing
Brief requirement for impact of development servicing
Detailed requirement of impact of development servicing and methodology is provided
1 1.1%
Parking demand No requirement for parking demand assessment
Brief instruction provided for parking demand assessment
Detailed methodology provided for parking demand assessment
2 2.2%
Pavement impacts No requirement for pavement impact assessment
Requirement for pavement impact assessment for large scale developments
Requirement for pavement impact assessment for any development requiring a TIA and methodology is provided
1 1.1%
ATRF 2016 Proceedings
18
Criterion 0 points 1 point 2 points Weight Relative Weight MITIGATION (maximum of 48 points and 25.8% of final score) Travel demand management (maximum of 10 points and 5.4% of final score) Travel plans No requirement for the
assessment of travel plans and no information is provided
Brief requirement for the assessment of travel plans and information is provided for a generic development type
Requirement for the assessment of travel plans and different travel plan information is provided for different development types
2 2.2%
Discouraging private vehicle travel
Private vehicle travel is prioritised as a mode of transport
Private vehicle travel is neither prioritised or deprioritised as a mode of transport
Private vehicle travel is deprioritised as a mode of transport
1 1.1%
Encouraging sustainable travel
Sustainable travel is not actively encouraged
Sustainable travel is encouraged to the same extent as private vehicle travel
Sustainable travel is actively encouraged over private travel
1 1.1%
Methods to influence travel away from private vehicle
No methods are provided to positively influence travel away from private vehicle use
Brief methods are provided to positively influence travel away from private vehicle use or one other mode is considered
Comprehensive methods are provided to positively influence travel away from private vehicle use or two other modes are considered
1 1.1%
Multi-modal considerations (maximum of 16 points and 8.6% of final score) Pedestrian considerations
No guidance is provided for the assessment of pedestrian considerations
Brief requirement for the assessment of pedestrian considerations and brief methodology provided
Requirement for the assessment of pedestrian considerations and detailed methodology provided
2 2.2%
Cycle considerations No guidance is provided for the assessment of cycle considerations
Brief requirement for the assessment of cycle considerations and brief methodology provided
Requirement for the assessment of cycle considerations and detailed methodology provided
2 2.2%
Public transport considerations
No guidance is provided for the assessment of public transport considerations
Brief requirement for the assessment of public transport considerations and brief methodology provided
Requirement for the assessment of public transport considerations and detailed methodology provided
2 2.2%
Freight/heavy vehicle considerations
No guidance is provided for the assessment of freight/heavy vehicle considerations
Brief requirement for the assessment of freight considerations and brief methodology provided
Requirement for the assessment of freight considerations and detailed methodology provided
2 2.2%
Other mitigation considerations (maximum of 22 points and 11.8% of final score) Parking No guidance is provided for
the provision of development parking
Brief guidance is provided for the provision of development parking
Detailed guidance is provided for the provision of development parking
1 1.1%
Development servicing No guidance is provided for the mitigation of development servicing impacts
Brief guidance is provided for the mitigation of development servicing impacts
Detailed guidance is provided for the mitigation of development servicing impacts
1 1.1%
Construction No guidance is provided for the mitigation of construction impacts
Brief guidance is provided for the mitigation of construction impacts
Detailed guidance is provided for the mitigation of construction impacts
1 1.1%
Development access No guidance is provided for the transport access requirements for any mode of transport
Brief guidance is provided for the transport access requirements for all modes of transport but no methodology is provided
Detailed guidance is provided for the transport access requirements for all modes of transport and detailed methodology is provided
1 1.1%
Road link impact No guidance is provided for the mitigation of development impacts on road links
Brief guidance is provided for the mitigation of development impacts on road links
Detailed guidance is provided for the mitigation of development impacts on road links
1 1.1%
A best practice evaluation of traffic impact assessment guidelines in Australia and New Zealand
19
Criterion 0 points 1 point 2 points Weight Relative Weight Intersection impact No guidance is provided for
the mitigation of development impacts on intersections
Brief guidance is provided for the mitigation of development impacts on intersections
Detailed guidance is provided for the mitigation of development impacts on intersections
1 1.1%
Safety No guidance is provided for the mitigation of development impacts on user & community safety
Brief guidance is provided for the mitigation of development impacts on user & community safety
Detailed guidance is provided for the mitigation of development impacts on user & community safety
2 2.2%
Environment No guidance is provided for the mitigation of development impacts on the environment
Brief guidance is provided for the mitigation of development impacts on the environment
Detailed guidance is provided for the mitigation of development impacts on the environment
2 2.2%
Pavement No guidance is provided for the mitigation of development impacts on pavement
Brief guidance is provided for the mitigation of development impacts on pavement
Detailed guidance is provided for the mitigation of development impacts on pavement
1 1.1%
REVIEW (maximum of 8 points and 4.3% of final score) Post-development monitoring
No requirement for monitoring of transport impact after completion of development
Requirement of brief monitoring of transport impact after completion of development
Requirement of monitoring of transport impact after completion of development and detailed guidance provided
2 2.2%
Post-development review
No requirement for review of TIA after completion of development
Voluntary review of TIA after completion of development recommended
Compulsory review of TIA after completion of development required
2 2.2%
ATRF 2016 Proceedings
20
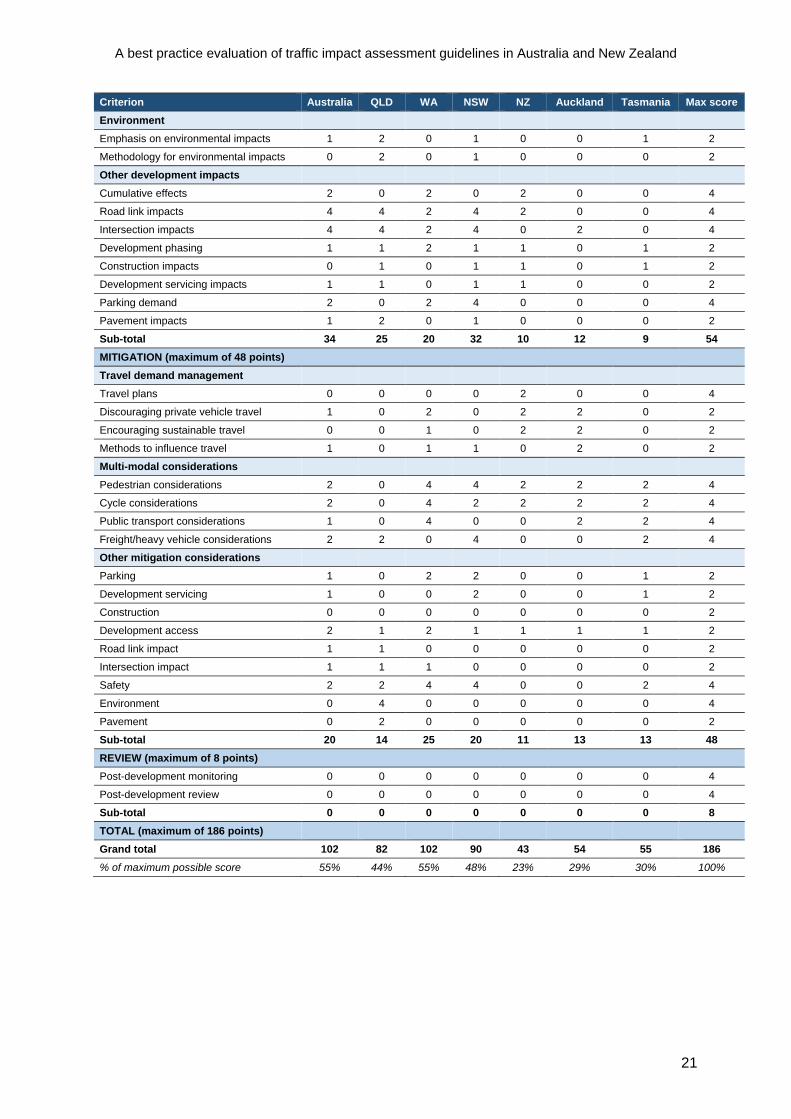
Appendix B: Detailed assessment results Criterion Australia QLD WA NSW NZ Auckland Tasmania Max score STRUCTURE (maximum of 10 points) Traffic impact assessment methodology 6 6 6 6 6 3 6 6
Prescribed format/key TIA outputs 4 2 4 4 0 2 0 4
Sub-total 10 8 10 10 6 5 6 10 SCOPE (maximum of 16 points) Threshold requiring assessment 4 2 4 4 0 4 2 4
Extent of assessment 4 4 4 2 4 0 4 4
Study area limits 2 4 4 0 0 0 2 4
Design years 4 4 4 0 0 0 4 4
Sub-total 14 14 16 6 4 4 12 16 LEGISLATIVE FRAMEWORK (maximum of 14 points) Relevant policies/legal framework 2 4 4 4 0 4 0 4
Developer responsibility 0 4 0 4 0 2 2 4
Professional standard 1 0 2 0 0 2 1 2
TIA validity 0 0 0 0 0 0 0 4
Sub-total 3 8 6 8 0 8 3 14 EXISTING CONDITIONS (maximum of 36 points) Road network Hierarchical assessment 2 0 0 1 0 0 1 2
Traffic conditions 1 1 2 2 0 0 0 2
Traffic infrastructure 1 1 1 1 0 0 0 2
Seasonal traffic variation 1 0 2 2 0 0 1 2
Background traffic growth 2 0 1 0 0 0 0 2
Truck traffic growth 0 0 0 0 0 0 0 2
Non-private vehicle transport Pedestrian LOS 2 2 4 2 2 2 2 4
Cycle LOS 2 2 4 0 2 2 2 4
Freight LOS 2 2 2 0 0 2 2 4
Public transport accessibility 1 1 2 0 1 1 0 2
Public transport capacity 1 0 1 0 1 1 0 2
Other existing conditions Parking 2 2 2 2 2 2 0 4
Safety 4 2 4 4 4 2 4 4
Sub-total 21 13 25 14 12 12 12 36 DEVELOPMENT IMPACTS (maximum of 54 points) Trip Generation Trip generation methodology 4 2 4 4 0 2 2 4
Trip generation database 2 2 0 2 0 4 2 4
Trip distribution/route allocation 2 1 2 0 0 0 1 2
Internal transport design and operation 2 0 0 2 0 0 1 2
Linked Trips 2 2 1 1 1 0 0 2
Modal Split Modal split methodology 2 0 2 2 0 0 0 4
Multi-modal database 0 0 0 0 0 4 0 4
Safety Emphasis on safety impacts 2 2 1 2 2 0 0 2
Methodology for assessment of safety 2 2 0 1 0 0 0 2
A best practice evaluation of traffic impact assessment guidelines in Australia and New Zealand
21
Criterion Australia QLD WA NSW NZ Auckland Tasmania Max score Environment Emphasis on environmental impacts 1 2 0 1 0 0 1 2
Methodology for environmental impacts 0 2 0 1 0 0 0 2
Other development impacts Cumulative effects 2 0 2 0 2 0 0 4
Road link impacts 4 4 2 4 2 0 0 4
Intersection impacts 4 4 2 4 0 2 0 4
Development phasing 1 1 2 1 1 0 1 2
Construction impacts 0 1 0 1 1 0 1 2
Development servicing impacts 1 1 0 1 1 0 0 2
Parking demand 2 0 2 4 0 0 0 4
Pavement impacts 1 2 0 1 0 0 0 2
Sub-total 34 25 20 32 10 12 9 54 MITIGATION (maximum of 48 points) Travel demand management Travel plans 0 0 0 0 2 0 0 4
Discouraging private vehicle travel 1 0 2 0 2 2 0 2
Encouraging sustainable travel 0 0 1 0 2 2 0 2
Methods to influence travel 1 0 1 1 0 2 0 2
Multi-modal considerations Pedestrian considerations 2 0 4 4 2 2 2 4
Cycle considerations 2 0 4 2 2 2 2 4
Public transport considerations 1 0 4 0 0 2 2 4
Freight/heavy vehicle considerations 2 2 0 4 0 0 2 4
Other mitigation considerations Parking 1 0 2 2 0 0 1 2
Development servicing 1 0 0 2 0 0 1 2
Construction 0 0 0 0 0 0 0 2
Development access 2 1 2 1 1 1 1 2
Road link impact 1 1 0 0 0 0 0 2
Intersection impact 1 1 1 0 0 0 0 2
Safety 2 2 4 4 0 0 2 4
Environment 0 4 0 0 0 0 0 4
Pavement 0 2 0 0 0 0 0 2
Sub-total 20 14 25 20 11 13 13 48 REVIEW (maximum of 8 points) Post-development monitoring 0 0 0 0 0 0 0 4
Post-development review 0 0 0 0 0 0 0 4
Sub-total 0 0 0 0 0 0 0 8 TOTAL (maximum of 186 points) Grand total 102 82 102 90 43 54 55 186 % of maximum possible score 55% 44% 55% 48% 23% 29% 30% 100%