Embed Size (px)
Citation preview
A Benefits Assessment of WaterPollution Control Programs
Since 1972:Part 1, The Benefits of
Point Source Controls forConventional Pollutants in
Rivers and Streams
Final Report
Prepared for
U.S. Environmental Protection AgencyOffice of Water
Office of Policy, Economics, and Innovation
January 2000

EPA Contract Number RTI Project Number68-C6-0021 6600-4
A Benefits Assessment of WaterPollution Control Programs
Since 1972:Part 1, The Benefits of
Point Source Controls forConventional Pollutants in
Rivers and Streams
Final Report
Prepared for
U.S. Environmental Protection AgencyOffice of Water
Office of Policy, Economics, and Innovation
EPA Work Assignment Manager
Dr. Mahesh PodarOffice of Water
401 M Street SW (MC4301) Washington, DC 20460
Prepared by
Tayler H. Bingham, Timothy R. BondelidBrooks M. Depro, Ruth C. Figueroa, A. Brett Hauber
Suzanne J. Unger, George L. Van HoutvenResearch Triangle Institute
Research Triangle Park, NC 27709
in association with
Andrew Stoddard
Tetra Tech, Inc.Fairfax, VA 22030
Industrial Economics, Inc.Cambridge, MA 02140
January 2000

i
DISCLAIMER
Although the information in this report has been funded wholly or in part by the United States EnvironmentalProtection Agency under Contract 68-C6-0021 with Research Triangle Institute, it does not necessarily reflectthe views of the Agency and no official endorsement should be inferred. Mention of trade names orcommercial products does not constitute endorsement or recommendation for use.
ACKNOWLEDGMENTS
The principal project manager for this segment of the model development is Virginia Kibler. In addition, we wouldlike to thank the following EPA staff for critical review and comments: Bill O’Neil, Charles Griffiths, MaheshPodar, Mathew Clark, and John Powers.
iii
TABLE OF CONTENTS
Section Page
Executive Summary . . . . . . . . . . . . . . . . . . . . . . . . . . . . . . . . . . . . . . . . . . . . . . . . . . . vii
1 Introduction . . . . . . . . . . . . . . . . . . . . . . . . . . . . . . . . . . . . . . . . . . . . . . . . . . . . . . . . 1-1
2 Water Pollution and CWA Regulatory Programs . . . . . . . . . . . . . . . . . . . . . . . . . . . . . 2-1
2.1 Water Pollutants . . . . . . . . . . . . . . . . . . . . . . . . . . . . . . . . . . . . . . . . . . . . . . . 2-1
2.2 Sources of Pollutants . . . . . . . . . . . . . . . . . . . . . . . . . . . . . . . . . . . . . . . . . . . . 2-3
2.3 CWA Pollution Control Programs . . . . . . . . . . . . . . . . . . . . . . . . . . . . . . . . . . 2-32.3.1 Direct Industrial Dischargers and POTWs . . . . . . . . . . . . . . . . . . . . . . 2-42.3.2 Indirect Industrial Dischargers . . . . . . . . . . . . . . . . . . . . . . . . . . . . . . . 2-82.3.3 Nonpoint Sources . . . . . . . . . . . . . . . . . . . . . . . . . . . . . . . . . . . . . . . . 2-8
3 Water Quality Conditions and Water Resourcesand Their Services . . . . . . . . . . . . . . . . . . . . . . . . . . . . . . . . . . . . . . . . . . . . . . . . . . . 3-1
3.1 Current Water Quality Conditions . . . . . . . . . . . . . . . . . . . . . . . . . . . . . . . . . . 3-2
3.2 Water Resource Services . . . . . . . . . . . . . . . . . . . . . . . . . . . . . . . . . . . . . . . . . 3-93.2.1 Withdrawal Services . . . . . . . . . . . . . . . . . . . . . . . . . . . . . . . . . . . . . . 3-93.2.2 In-Place Services . . . . . . . . . . . . . . . . . . . . . . . . . . . . . . . . . . . . . . . . 3-143.2.3 Existence Services . . . . . . . . . . . . . . . . . . . . . . . . . . . . . . . . . . . . . . . 3-17
4 Impact of the Clean Water Act on Use Support of Water Resources . . . . . . . . . . . . . . . . . . . . . . . . . . . . . . . . . . . . . . . . . . . . . . . . . . . . 4-1
4.1 Brief Overview of the NWPCAM . . . . . . . . . . . . . . . . . . . . . . . . . . . . . . . . . . . 4-24.2 Pollutant Loadings . . . . . . . . . . . . . . . . . . . . . . . . . . . . . . . . . . . . . . . . . . . . . 4-3
4.2.1 Loadings Under the With-CWA Conditions . . . . . . . . . . . . . . . . . . . . 4-44.2.2 Loadings Under the Without-CWA
Conditions . . . . . . . . . . . . . . . . . . . . . . . . . . . . . . . . . . . . . . . . . . . . . 4-6

iv
4.3 Water Quality . . . . . . . . . . . . . . . . . . . . . . . . . . . . . . . . . . . . . . . . . . . . . . . . . 4-84.3.1 Water Quality Conditions Under Alternative Point Source Control
Scenarios . . . . . . . . . . . . . . . . . . . . . . . . . . . . . . . . . . . . . . . . . . . . . . 4-9
5 Valuation of Selected In-Place and Existence Benefits . . . . . . . . . . . . . . . . . . . . . . . . . 5-1
5.1 Overview of the Mitchell and Carson Study . . . . . . . . . . . . . . . . . . . . . . . . . . 5-2
5.2 Application of the Mitchell and Carson Estimates . . . . . . . . . . . . . . . . . . . . . . 5-55.2.1 Local/In-Place Benefits . . . . . . . . . . . . . . . . . . . . . . . . . . . . . . . . . . . . 5-65.2.2 Nonlocal/Existence Benefits . . . . . . . . . . . . . . . . . . . . . . . . . . . . . . . . 5-85.2.3 Total Estimated Benefits . . . . . . . . . . . . . . . . . . . . . . . . . . . . . . . . . . . . 5-8
6 Case Study: The Willamette River Basin . . . . . . . . . . . . . . . . . . . . . . . . . . . . . . . . . . . 6-1
6.1 Profile of the Willamette River Basin . . . . . . . . . . . . . . . . . . . . . . . . . . . . . . . . 6-2
6.2 Pollutant Loadings and Water Quality . . . . . . . . . . . . . . . . . . . . . . . . . . . . . . . 6-46.2.1 Oxygen Depletion . . . . . . . . . . . . . . . . . . . . . . . . . . . . . . . . . . . . . . . . 6-56.2.2 Nutrients . . . . . . . . . . . . . . . . . . . . . . . . . . . . . . . . . . . . . . . . . . . . . . . 6-56.2.3 Pollutants from Nonpoint Sources . . . . . . . . . . . . . . . . . . . . . . . . . . . . 6-76.2.4 Toxins . . . . . . . . . . . . . . . . . . . . . . . . . . . . . . . . . . . . . . . . . . . . . . . . . 6-7
6.3 Legislative and Regulatory History of Water Pollution Control . . . . . . . . . . . . . 6-9
6.4 Biological and Habitat Indicators of Water Quality . . . . . . . . . . . . . . . . . . . . 6-10
6.5 Valuation of Selected Withdrawal and In-Place Benefits . . . . . . . . . . . . . . . . 6-126.5.1 Withdrawal Benefits . . . . . . . . . . . . . . . . . . . . . . . . . . . . . . . . . . . . . 6-126.5.2 In-Place Benefits . . . . . . . . . . . . . . . . . . . . . . . . . . . . . . . . . . . . . . . . 6-15
6.6 Applying the NWPCAM to the Willamette River Basin . . . . . . . . . . . . . . . . . 6-28
7 Directions for Future Research . . . . . . . . . . . . . . . . . . . . . . . . . . . . . . . . . . . . . . . . . . 7-1
7.1 Resource Coverage . . . . . . . . . . . . . . . . . . . . . . . . . . . . . . . . . . . . . . . . . . . . . 7-1
7.2 Pollutant Coverage . . . . . . . . . . . . . . . . . . . . . . . . . . . . . . . . . . . . . . . . . . . . . 7-2
7.3 Source Coverage . . . . . . . . . . . . . . . . . . . . . . . . . . . . . . . . . . . . . . . . . . . . . . . 7-2
7.4 Services Coverage . . . . . . . . . . . . . . . . . . . . . . . . . . . . . . . . . . . . . . . . . . . . . . 7-2
7.5 WTP Estimates . . . . . . . . . . . . . . . . . . . . . . . . . . . . . . . . . . . . . . . . . . . . . . . . 7-3
References . . . . . . . . . . . . . . . . . . . . . . . . . . . . . . . . . . . . . . . . . . . . . . . . . . . . . . . . . . . . . . . R-1

v
LIST OF FIGURES
Number Page
1-1 Illustration of Alternative Analytical Perspectives for Evaluating CWA Benefits . . . . . . 1-3
3-1 Source, Use, and Disposition of Withdrawn Water—1990 . . . . . . . . . . . . . . . . . . . . 3-11
5-1 Resources for the Future Water Quality Ladder . . . . . . . . . . . . . . . . . . . . . . . . . . . . . . 5-4
6-1 Willamette River Basin Water Quality Study Area and the Four River Regions . . . . . . . 6-3
6-2 Long-Term Trends of Summer DO in the Willamette River at the SP&S Bridge,Portland Harbor: 1950-1995 . . . . . . . . . . . . . . . . . . . . . . . . . . . . . . . . . . . . . . . . . . . 6-6

vi
LIST OF TABLES
Number Page
2-1 Major Sources of Water Pollution . . . . . . . . . . . . . . . . . . . . . . . . . . . . . . . . . . . . . . . . 2-42-2 Effluent Guidelines Included in CFR Title 40 . . . . . . . . . . . . . . . . . . . . . . . . . . . . . . . . 2-6
3-1 Surface Water Resources in the U.S. . . . . . . . . . . . . . . . . . . . . . . . . . . . . . . . . . . . . . . 3-33-2 Beneficial Uses of Water Bodies . . . . . . . . . . . . . . . . . . . . . . . . . . . . . . . . . . . . . . . . . 3-43-3 Levels of Use Support . . . . . . . . . . . . . . . . . . . . . . . . . . . . . . . . . . . . . . . . . . . . . . . . . 3-43-4 Status of U.S. Surface Water Resources, 1992-1993: Proportion of Assessed Waters
Reported to Have Good Water Quality . . . . . . . . . . . . . . . . . . . . . . . . . . . . . . . . . . . . 3-53-5 Levels of Use Support—Rivers, 1992-1993 . . . . . . . . . . . . . . . . . . . . . . . . . . . . . . . . . 3-53-6 Levels of Use Support—Lakes and Ponds, 1992-1993 . . . . . . . . . . . . . . . . . . . . . . . . . 3-63-7 Levels of Use Support—Ocean Shoreline, 1992-1993 . . . . . . . . . . . . . . . . . . . . . . . . . 3-73-8 Levels of Use Support—Great Lakes Shoreline, 1992-1993 . . . . . . . . . . . . . . . . . . . . . 3-83-9 Levels of Use Support—Estuaries, 1992-1993 . . . . . . . . . . . . . . . . . . . . . . . . . . . . . . . 3-83-10 Water Resources: Withdrawal Services and Major Uses . . . . . . . . . . . . . . . . . . . . . . 3-123-11 Water Resources: In-Place Services and Major Uses . . . . . . . . . . . . . . . . . . . . . . . . 3-15
4-1 Total Loadings of BOD and TSS for Industrial and Municipal Point Sources Withthe CWA, Mid-1990s . . . . . . . . . . . . . . . . . . . . . . . . . . . . . . . . . . . . . . . . . . . . . . . . . 4-5
4-2 Total Loadings of BOD and TSS for Nonpoint Sources and CSOs with the CWA,Mid-1990s . . . . . . . . . . . . . . . . . . . . . . . . . . . . . . . . . . . . . . . . . . . . . . . . . . . . . . . . . 4-5
4-3 Total Loadings of BOD and TSS for Industrial and Municipal Point SourcesWithout the CWA, Mid-1990s . . . . . . . . . . . . . . . . . . . . . . . . . . . . . . . . . . . . . . . . . . 4-6
4-4 RFF Water Quality Ladder Values . . . . . . . . . . . . . . . . . . . . . . . . . . . . . . . . . . . . . . . . 4-94-5 Maximum Achievable Increases in Recreational Use Support Through Point
Source Controls . . . . . . . . . . . . . . . . . . . . . . . . . . . . . . . . . . . . . . . . . . . . . . . . . . . . 4-104-6 Rivers and Streams (632,552 miles) Supporting Recreational Uses: Comparison
of With-CWA and Without-CWA Conditions in the Mid-1990s . . . . . . . . . . . . . . . . . 4-104-7 Rivers and Streams in Populated Places (222,789 miles): Comparison of With-
CWA and Without-CWA Conditions in the Mid-1990s . . . . . . . . . . . . . . . . . . . . . . . 4-12
5-1 Individual Household WTP Values for Water Quality Improvements . . . . . . . . . . . . . . 5-55-2 Estimated Annual Value of Selected In-Place and Existence Benefits of the CWA,
Mid-1990s . . . . . . . . . . . . . . . . . . . . . . . . . . . . . . . . . . . . . . . . . . . . . . . . . . . . . . . . . 5-9
6-1 Surface Water Used in Irrigation and Manufacturing in Willamette Basin . . . . . . . . . 6-136-2 Public and Domestic Use of Surface Water in Willamette Basin . . . . . . . . . . . . . . . . 6-14

vii
6-3 Summary of Annual Recreation Benefits for Willamette Resources . . . . . . . . . . . . . . 6-176-4 Summary of Recreational Fishing Activity in the Willamette Basin . . . . . . . . . . . . . . 6-186-5 Summary of Recreational Fishing Values . . . . . . . . . . . . . . . . . . . . . . . . . . . . . . . . . 6-196-6 Annual Recreational Fishing Benefits in the Willamette Basin . . . . . . . . . . . . . . . . . . 6-206-7 Selected Recreation Benefits . . . . . . . . . . . . . . . . . . . . . . . . . . . . . . . . . . . . . . . . . . . 6-216-8 Boating and Sailing Benefits . . . . . . . . . . . . . . . . . . . . . . . . . . . . . . . . . . . . . . . . . . . 6-226-9 Annual Wildlife Viewing Benefits . . . . . . . . . . . . . . . . . . . . . . . . . . . . . . . . . . . . . . . 6-246-10 Summary of Passive Use Values for Clean Water . . . . . . . . . . . . . . . . . . . . . . . . . . . 6-266-11 Annual Benefits Attributable to Aesthetic Values for the Willamette Basin . . . . . . . . . 6-276-12 Summary of Case Study Estimates of Annual Clean Water Benefits for the
Willamette River Basin . . . . . . . . . . . . . . . . . . . . . . . . . . . . . . . . . . . . . . . . . . . . . . . 6-276-13 Estimated River and Stream Miles Attaining Beneficial Uses for Recreation in the
Willamette River Basin With the CWA, Mid-1990s . . . . . . . . . . . . . . . . . . . . . . . . . . 6-286-14 Estimated Impact of the CWA on River and Stream Miles Attaining Beneficial Uses
for Recreation in the Willamette River Basin, Mid-1990s . . . . . . . . . . . . . . . . . . . . . 6-286-15 Estimated Annual Value of Selected In-Place Benefits of the CWA in the
Willamette River Basin, Mid-1990s . . . . . . . . . . . . . . . . . . . . . . . . . . . . . . . . . . . . . 6-29

vii
Executive Summary
Since the early 1970s, national water pollution control programs atall levels of government can be largely credited with reversing thecenturies-long trend in the degradation of the Nation’s waters. Foremost among these programs are those that have beenimplemented by the U.S. Environmental Protection Agency (EPA)under the Clean Water Act (CWA) of 1972. Prior to theseprograms, the decline in water quality that accompanied economicindustrialization and population growth was epitomized by the dayin June 1969 when oil and debris in the Cuyahoga River caughtfire. Today, the cumulative impact of the national water pollutionprograms has been to improve the health of aquatic ecosystems andto expand the share of the Nation’s water resources that supportvarious forms of beneficial uses for humans. The purpose of thisstudy has been to develop a preliminary assessment of the nationalbenefits associated with these programs, in particular the CWA.
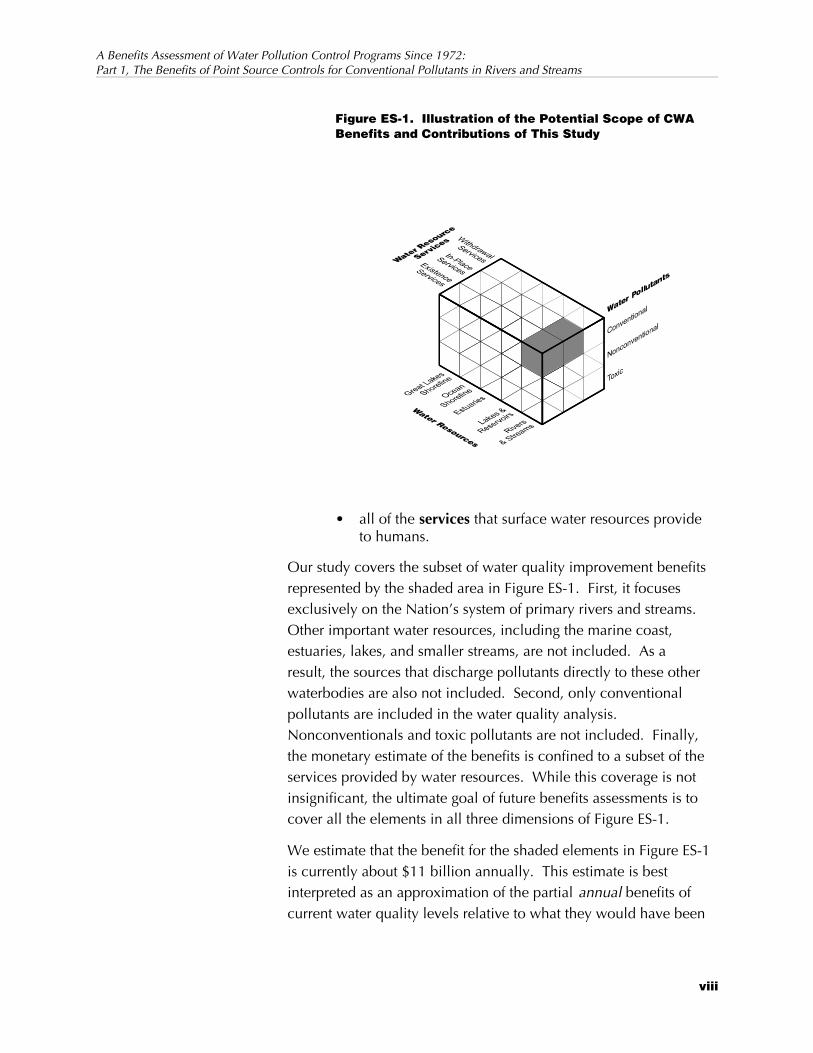
This analysis represents the first part of an ongoing effort by theAgency to develop a comprehensive assessment of the benefits ofthe CWA using modern valuation methods. The results of this studymust therefore be viewed as partial because they do not yet includeall of the facets of water quality benefits. As depicted inFigure ES-1, a comprehensive assessment must fully address thethree primary dimensions of water quality improvements. That is, itshould address
• all of the pollutants addressed by the Agency’sprograms,
• all of the Nation’s surface water resources, and
A Benefits Assessment of Water Pollution Control Programs Since 1972:Part 1, The Benefits of Point Source Controls for Conventional Pollutants in Rivers and Streams
viii
Figure ES-1. Illustration of the Potential Scope of CWABenefits and Contributions of This Study
• all of the services that surface water resources provideto humans.
Our study covers the subset of water quality improvement benefitsrepresented by the shaded area in Figure ES-1. First, it focusesexclusively on the Nation’s system of primary rivers and streams. Other important water resources, including the marine coast,estuaries, lakes, and smaller streams, are not included. As aresult, the sources that discharge pollutants directly to these otherwaterbodies are also not included. Second, only conventionalpollutants are included in the water quality analysis. Nonconventionals and toxic pollutants are not included. Finally,the monetary estimate of the benefits is confined to a subset of theservices provided by water resources. While this coverage is notinsignificant, the ultimate goal of future benefits assessments is tocover all the elements in all three dimensions of Figure ES-1.
We estimate that the benefit for the shaded elements in Figure ES-1is currently about $11 billion annually. This estimate is bestinterpreted as an approximation of the partial annual benefits of current water quality levels relative to what they would have been

Executive Summary
ix
without the water pollution control programs that have beenimplemented since the early 1970s, in particular without the CWA.
Although we recognize that it is an oversimplification, forconvenience in this report we attribute the benefits of waterpollution controls to the CWA. The CWA is the primary Federallaw for addressing the Nation’s water quality problems. Under theAct the Agency, among other things, establishes industrial andmunicipal pollution control performance standards for pointsources (PS) of conventional, nonconventional, and toxicpollutants. It charges States and tribes with setting specific waterquality criteria appropriate for their waters and with developingpollution control programs to meet them. Under the CWA, theAgency also provides funding to States and communities to helpthem meet their clean water infrastructure needs. These initiativesare likely to be the most significant cause of the water qualityimprovements achieved since the early 1970s. But they are notsolely responsible for the gains.
Other Federal and subfederal legislation and initiatives havecontributed to the improvements. For example, the Coastal ZoneManagement Act addresses NPSs of coastal water pollution. Also,in some cases, pollution controls mandated by State and localagencies can be more stringent than Federal guidelines. Evenlegislation directed toward other media has contributed to waterquality improvements. The Clean Air Act, for example, through itstreatment of the pollutants that cause acid deposition, has resultedin lower pH levels in the Nation’s waters. In practice it is difficultto fully separate the impacts of various programs; therefore, weassume that the benefits we are measuring are attributable to theCWA.
The benefits of the CWA can be defined (in economic terms) as theincrease in human well-being that results from its improvements inwater quality. These water quality improvements, in effect,improve the “services” humans receive from surface waterresources. To estimate these benefits, it is not enough to examinehow water quality has improved since 1972. Rather, it isappropriate to assess current water quality in relation to what itwould have been today without the CWA initiatives.

A Benefits Assessment of Water Pollution Control Programs Since 1972:Part 1, The Benefits of Point Source Controls for Conventional Pollutants in Rivers and Streams
x
This is a complex undertaking since even without the Act otherState and local programs may have been expanded or initiated toaddress the problem of water pollution. Estimating the likelihoodand contribution of such efforts is beyond the scope of this study. This study has developed an estimate of what water quality mightlook like today if current wastewater management practices weresimilar to 1972’s practices, but with today’s levels of economicactivity. This scenario provides the basis for the without-CWAwater quality characterization that is compared to today’s waterquality levels.
Although the benefit estimates are incomplete, theaccomplishments of our study are significant. Only a few priorstudies have attempted to value water quality changes, even for alocal setting. This study has provided such estimates on a nationallevel, albeit not for all resources. We are continuing the effort toprovide the missing elements.
Also included in this report is a case study analysis of the benefitsof the water quality improvements in the Willamette River Basin inOregon. This analysis provides the opportunity to examine thepotential benefits of the Act in greater detail and with lessabstraction than was possible with the national-level study. TheWillamette River Basin was chosen because of the significantimprovements in water quality achieved there since the 1960s. Thebenefits of the water quality improvements for that basin areestimated to be $120 million to $260 million annually.
ES.1 WATER QUALITY DIFFERENCES WITH THECWA
We used the National Water Pollution Control Assessment Model(NWPCAM) developed by EPA and RTI to conduct this assessmentof the national benefits of the CWA. The NWPCAM incorporateslocation-specific estimates of pollutant releases to simulate waterquality conditions for 632,552 miles of rivers and streams in thecontinental United States. Current pollutant PS loadings fromindustrial and municipal sources and NPS loadings were used inthe NWPCAM to characterize today’s water quality in terms ofoxygen-demanding wastes, sediment, and fecal coliform levels. This characterization was used as the with-CWA water qualityreference point.

Executive Summary
xi
Not SupportingRecreational Uses
(156,658 miles)
Total Rivers and Streams (632,552 miles)
Swimmable (238,627 miles)
Fishable (424,712 miles)
Boatable (475,894 miles)
Figure ES-2. Estimated U.S. River and Stream Miles Attaining Recreational Use Criteria Withthe CWA, Mid-1990s
Without-CWA loadings estimates were also developed, but only forindustrial and municipal sources. They were based on estimates ofthe control efficiency of effluent guidelines and municipalwastewater treatment programs applied to the current industrialbase. Because the NPS program is fairly new and data on itseffectiveness are not readily available, without-CWA pollutantloadings for these sources were assumed to be the same as currentloadings. The without-CWA loadings were used in the NWPCAMto characterize what the current state of water quality would bewithout the CWA initiatives.
The estimated water quality levels under both with- and without-CWA conditions were mapped into three use supportcategories—boatable, fishable, or swimmable—based on theminimum levels of water quality needed to support these activities. These three terms, as used here, are essentially shorthand ways todescribe water quality based on estimated pollutant levels. Theestimated current (with-CWA) national distribution of the river andstream miles across the beneficial use categories is provided inFigure ES-2. Almost 25 percent of the total 632,552 miles of riversand streams are estimated to be “nonsupport” miles, meaning they

A Benefits Assessment of Water Pollution Control Programs Since 1972:Part 1, The Benefits of Point Source Controls for Conventional Pollutants in Rivers and Streams
xii
fail to meet conditions required to support any of the threecategories.
The remaining 475,894 miles are estimated to, at least, supportboating activities. A majority of these boatable miles are alsoestimated to be fishable (424,712 miles), and a smaller subset areestimated to be suitable for swimming as well (238,627 miles). Forinterpreting Figure ES-2 (and the tables on the following pages) it isimportant to stress that the mile estimates in the three use supportcategories are not mutually exclusive. They are overlapping. Inother words, adding miles across the support categories wouldresult in double-counting because some river and stream milessupport more than one use (e.g., swimmable miles are, bydefinition, also boatable).
Table ES-1 shows what the estimated distribution of water qualitywould be under the without-CWA scenario. Nonsupport milesincrease to 178,514. The number of boatable, fishable, andswimmable miles are all estimated to decline relative to with-CWAconditions.
Using the same use support categorization scheme, we alsoestimated a third scenario to simulate what conditions would belike if all loadings of conventional pollutants from PSs wereeliminated. Because this zero PS discharge scenario represents themaximum achievable control of PSs, it serves as a useful point ofreference for evaluating the with-CWA (i.e., current control)scenario. It highlights the fact that, even if all point source loadingswere reduced to zero, a sizable portion of U.S. rivers and streamswould experience little to no improvement (relative to the without-CWA scenario) in their ability to support specific recreational uses. According to the NWPCAM, going from the without-CWA scenarioto the zero PS discharge scenario, only a small percentage (10percent overall) of the 632,552 miles of rivers and streams wouldachieve higher recreational uses. This is because the remainingmiles are either
• upstream of all PSs of conventional pollutants in themodel,
• already achieving maximum use support (i.e.,swimmable) under the without-CWA scenario, or

Executive Summary
xiii
• limited by NPS loadings.
Therefore, Table ES-1 also shows the estimated number of river andstream miles in each recreational use support category for the zeroPS discharge scenarios. It shows that, going from the without-CWAscenario to the zero PS discharge scenario, the maximumachievable increase in swimmable miles through PS controls is33,355 miles. For the fishable and boatable categories, themaximum increases are 42,754 and 36,810, miles, respectively.
Table ES-2a compares the estimated distribution of river and streammiles across use categories with and without the Act. We estimatethat CWA pollution controls have increased the number of miles ofrivers and streams attaining swimmable standards by 16,507, whichis 50 percent of the maximum increase that would have beenachieved by eliminating PS discharges. The additional number ofriver and stream miles nationally achieving fishable and boatablestandards today is estimated to be 24,713 and 21,856, respectively. These increases represent almost 60 percent of the maximum thatwould have been achieved by complete controls on PS discharges.
Because many of the services received from water resourcesdepend on their proximity to people, in Table ES-2b we alsoprovide estimates of the water quality increases specifically for“populated places” (as defined by the Census). These estimatesshow that about one-third of the 632,552 river and stream milesmodeled in the NWPCAM are in these more populated locations. More importantly, over two-thirds of the improved river and stream
Table ES-1. Maximum Achievable Increases in Recreational UseSupport Through Point Source Controls
Number of U.S. River and Stream Miles in Each UseSupport Category
Highest UseSupported
Without-CWAConditions
Zero PSDischarge
Conditions
MaximumAchievable
Change Swimmable 222,120 255,475 33,355
Fishable 399,999 442,753 42,754
Boatable 454,038 490,848 36,810
Nonsupport 178,514 141,704 –36,810

A Benefits Assessment of Water Pollution Control Programs Since 1972:Part 1, The Benefits of Point Source Controls for Conventional Pollutants in Rivers and Streams
xiv
miles are also located in these areas. For example, 12,527 (76percent) of the 16,507 miles that are estimated to achieveswimmable status as a result of the CWA are in populated places.
There are other characterizations of current water quality. Inparticular, the Index of Watershed Indicators (the IWI or Index)organizes and presents aquatic resource information fromnumerous sources across the country on a watershed basis. Thefirst and foremost of these sources is the information reported underthe 305(b) program. Under this program States and jurisdictionsdesignate uses for their water resources and conduct surveys todetermine the extent to which each water resource supports eachrelevant designated use. This is the most comprehensive
Table ES-2a. Rivers and Streams (632,552 miles) SupportingRecreational Uses: Comparison of With-CWA and Without-CWAConditions in the Mid-1990s
Highest UseSupported
Without-CWA
Conditions(miles)
With-CWAConditions
(miles)
Increase in Use Support
Miles
Percent ofMaximumIncreasea
Swimmable 222,120 238,627 16,507 49.5%
Fishable 399,999 424,712 24,713 57.8%
Boatable 454,038 475,894 21,856 59.4%
Nonsupport 178,514 156,658 –21,856 59.4%
a Maximum defined by difference between without-CWA scenario andzero PS discharge scenario.
Table ES-2b. Rivers and Streams in Populated Places (222,789miles): Comparison of With-CWA and Without-CWA Conditions inthe Mid-1990s
Highest UseSupported
Without-CWAConditions
(miles)
With-CWAConditions
(miles)
Increase in UseSupport(miles)
Swimmable 109,003 121,530 12,527
Fishable 161,861 178,588 16,727
Boatable 175,666 190,319 14,653
Nonsupport 47,123 32,470 –14,653
Executive Summary
xv
characterization of the quality of these resources and of thepollutants and pollutant sources that threaten their quality.
A drawback to using the 305(b) information for benefits estimation,however, is that the reported water quality information does notprovide an absolute measure of water quality; rather it is anassessment relative to the designated use. A further limitation tothese data is that they are based on inconsistent sample surveys—the sampling methods vary among the States and, in many cases,are not based on statistical sampling techniques. The resourcessurveyed are typically those of most importance to the State orunder the greatest threat of impairment.
Another drawback to using the 305(b) estimates for benefitsestimation is that there is no way to develop alternative (e.g.,without-CWA) water quality scenarios within the 305(b) structure. Although data from IWI have supported the development of theNWPCAM, for consistency we used the NWPCAM to estimatewater quality conditions both with and without the CWA.
ES.2 WATER QUALITY BENEFITS VALUATION
To assess the value that individuals place on changes in beneficialuses, we relied on estimates (derived in a previous study) ofwillingness to pay (WTP) for freshwater quality improvements. WTP is usually regarded as the best observable measure of thevalue that people place on the improvements in the quality of theservices provided by the environment. Its use is consistent withmost governmental directives for conducting benefits analyses. However, using WTP implies a human-based perspective on thebenefits of water quality improvements. For decisionmakers whobelieve that a more expanded view of the value of ecosystemsshould be the basis of public policy, WTP would, presumably,represent a lower bound on the value of the water qualityimprovements under the CWA.
The WTP values used in this study were originally estimated fora 1983 contingent valuation (CV) study conducted for EPA. TheseCV estimates have been updated, to the extent feasible, to reflectcurrent values. The CV method uses a survey instrument to elicitrespondents’ valuation of environmental quality improvements. This survey approach provides an effective way to develop some
A Benefits Assessment of Water Pollution Control Programs Since 1972:Part 1, The Benefits of Point Source Controls for Conventional Pollutants in Rivers and Streams
xvi
first-order approximations of values that would otherwise bedifficult or impossible to obtain.
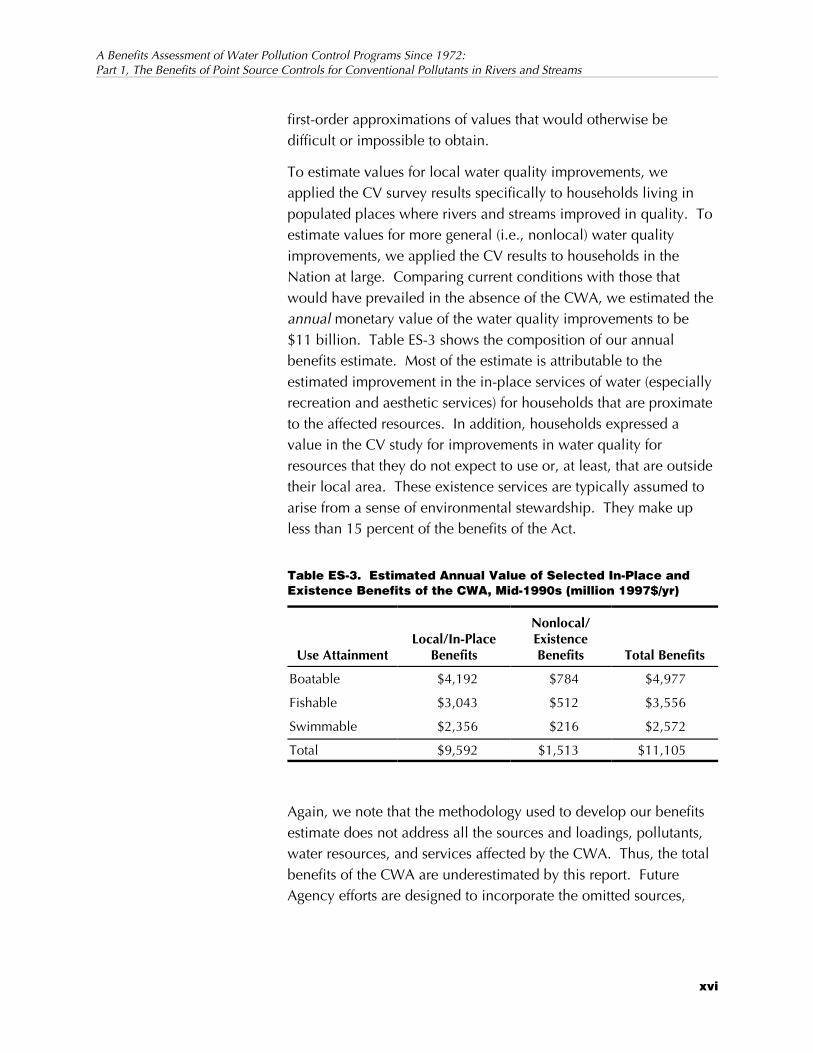
To estimate values for local water quality improvements, weapplied the CV survey results specifically to households living inpopulated places where rivers and streams improved in quality. Toestimate values for more general (i.e., nonlocal) water qualityimprovements, we applied the CV results to households in theNation at large. Comparing current conditions with those thatwould have prevailed in the absence of the CWA, we estimated theannual monetary value of the water quality improvements to be$11 billion. Table ES-3 shows the composition of our annualbenefits estimate. Most of the estimate is attributable to theestimated improvement in the in-place services of water (especiallyrecreation and aesthetic services) for households that are proximateto the affected resources. In addition, households expressed avalue in the CV study for improvements in water quality forresources that they do not expect to use or, at least, that are outsidetheir local area. These existence services are typically assumed toarise from a sense of environmental stewardship. They make upless than 15 percent of the benefits of the Act.
Again, we note that the methodology used to develop our benefitsestimate does not address all the sources and loadings, pollutants,water resources, and services affected by the CWA. Thus, the totalbenefits of the CWA are underestimated by this report. FutureAgency efforts are designed to incorporate the omitted sources,
Table ES-3. Estimated Annual Value of Selected In-Place andExistence Benefits of the CWA, Mid-1990s (million 1997$/yr)
Use AttainmentLocal/In-Place
Benefits
Nonlocal/ExistenceBenefits Total Benefits
Boatable $4,192 $784 $4,977
Fishable $3,043 $512 $3,556
Swimmable $2,356 $216 $2,572
Total $9,592 $1,513 $11,105

Executive Summary
xvii
pollutants, resources, and services. Once all of these factors areaccounted for, the estimated value should increase and provide amore accurate assessment of the total benefits of the CWA.
1-1
1 Introduction
The amendment of the 1948 Federal Water Pollution Control Act(FWPCA) in 1972 signaled a major shift in water qualitymanagement responsibility from the States to the Federalgovernment. Under the amendments, the U.S. EnvironmentalProtection Agency (EPA) was given the responsibility to, amongother things, set technology-driven national effluent limitations forindustrial sources, establish water quality standards, and administera construction grants program for publicly owned treatment works(POTWs) designed to achieve a minimum level of secondarytreatment for wastewaters discharged to surface waters bymunicipal facilities. The industrial standards are administeredthrough the National Pollutant Discharge Elimination System(NPDES). Discharges from POTWs are regulated through nationalpretreatment standards and local pretreatment programs (Fogarty,1991). The FWPCA was further amended in 1977 to address theproblem of toxic pollutants. Recognition of the impact of pollutantsfrom nonpoint sources (NPSs) on water quality resulted inprovisions in the 1987 amendments to address these sources. Today this body of legislation is commonly referred to as the CleanWater Act (CWA).
The overall goal of the CWA is to “... restore and maintain thechemical, physical, and biological integrity of the Nation’s waters.”One of the more specific provisions of the Act required eliminating“... the discharge of pollutants into navigable waters” by 1985. The
A Benefits Assessment of Water Pollution Control Programs Since 1972:Part 1, The Benefits of Point Source Controls for Conventional Pollutants in Rivers and Streams
1-2
Act is generally credited with reversing the trend in the degradationin water quality that began with the industrialization of theeconomy in the 1800s and was epitomized by the incident in June1969 when the Cuyahoga River near Cleveland caught fire. Today,that location is lined with restaurants and pleasure boat slips(Schneider, 1997).
Complementing the CWA are other governmental initiatives at theFederal and subfederal levels that address the problem of waterquality. Notably, the Coastal Zone Management Act is directedtoward coastal water pollution problems at a national level. Actions taken under this and other legislation have contributed tothe improvements in the Nation’s water quality. Because the CWAhas been in place longest with the greatest coverage, however,programs administered under this Act are primarily responsible forthe water quality improvements. For this reason, as well as for theconvenience of having a single inclusive term, we attribute thewater quality improvements described in this report to the CWA.
It is natural and appropriate to ask “what have we achieved since1972?” Such a question is motivated by the desire to know how weare doing in achieving the Act’s goals and by the recognition thatresources needed to protect and restore the Nation’s waters arescarce (costly) while the benefits of water quality improvements arenot infinite. Thus, society may seek to learn if the benefits of thispublic policy, as of others, are worth its costs. Students of publicpolicy counsel that part of effective public policymaking is learninghow these polices have performed; and then changing them toimprove their performance (e.g., see Stokey and Zeckhauser[1978]). The Government Performance and Results Act (GPRA)codifies these expectations into law; it requires that agencies reporton their performance goals and actual achievements. Also, underthe provisions of Executive Order (EO) 12893, EPA must evaluatethe benefits and costs of municipal infrastructure projects designedto protect water quality. Thus, there are many reasons forevaluating progress under the CWA.
Analysts can address the question of the benefits of the CWA fromtwo perspectives:

Section 1 — Introduction
1-3
1972 Today
Waterquality
with andwithout
comparison
before and aftercomparison
with-CWAconditions
without-CWAconditions
Year
Figure 1-1. Illustration of Alternative Analytical Perspectives for Evaluating CWA Benefits
1) Before-after perspective: How has the Nation’s waterquality changed since 1972, and what is the benefit ofthe change to society?
2) With-without perspective: How does the current qualityof the Nation’s water resources compare with what itwould have been like without the CWA, and what is thebenefit to society of the difference?
Figure 1-1 illustrates the differences between these twoperspectives. In the figure the actual level of water quality is shownas improving because of pollutant reductions due to the CWA. Thefirst perspective identified above takes a “before and after” view ofthe contributions of the CWA to water quality improvements—itcompares conditions in 1972 to current conditions. However,other things may have changed between 1972 and today thatwould have affected the quality of the Nation’s water resources andthe services provided by them.

A Benefits Assessment of Water Pollution Control Programs Since 1972:Part 1, The Benefits of Point Source Controls for Conventional Pollutants in Rivers and Streams
1-4
The second perspective—”with-without”—considers that withoutchanges in pollutant management practices, economic growthwould have resulted in the deterioration of water quality over theperiod. Providing a plausible characterization of current conditionswithout the CWA requires developing a without-CWA scenario. This scenario is shown in Figure 1-1 as the declining water qualitycurve. Although it is more analytically demanding, the “with-without” perspective should be adopted because it is theconceptually correct basis for valuing the benefits. The challengein such analyses is to develop a consistent, accuratecharacterization of the without-CWA conditions. Thatcharacterization must link estimates of pollutant discharges (i.e.,loadings) without the CWA to their impacts on surface waterquality, on the services provided by water resources, and on thesocial value of these services. Those metrics are then compared tothe ones developed similarly under with-CWA conditions.
The Nation’s water resources, broadly described, include rivers andstreams, lakes and reservoirs, estuaries, wetlands, the oceanshoreline, and the Great Lakes. This study focuses only on riversand streams and, within this category, only the 633,000 miles oflarger waterbodies (out of 3.5 million in the Nation) that arecatalogued in EPA’s Reach File 1 (RF1) database. In terms of theirsize, the rivers and streams captured in this analysis are the keyresources in this category. The Agency has plans to extend theanalysis to include additional water resources in the future,especially coastal, estuarine waters, and lakes.
Water pollutants are typically divided into conventional,nonconventional, and toxic pollutants. Source types include pointssources (PSs) such as drains, ditches, sewer outfalls; nonpointsources (NPSs) such as runoff; and atmospheric deposition of airpollutants such as rain or snow contaminated with air pollutants. This analysis includes three pollutants: fecal coliform (FC), aninfectious agent; biological oxygen demand (BOD), an oxygen-demanding waste; and total suspended solids (TSS), a sediment. While these pollutants are important contributors to water quality,they are not the only contributors. In particular, many EPAprograms are currently aimed at controlling toxic pollutants. TheAgency has plans to expand the pollutants covered in future

Section 1 — Introduction
1-5
analyses of the benefits of the CWA to include toxic andnonconventional pollutants.
The benefits of water quality improvements achieved under theCWA are evaluated here from an exclusively human-basedperspective. From this perspective, the value of a resource is basedon individuals’ preferences, and the valuation effort focuses on howthe services provided by water resources affect individuals’ welfare. Water resources provide a variety of services both when withdrawnand when left in place. The focus here is primarily on the effect ofwater quality on the recreation services of water. This human-based perspective of value is the cornerstone of applied benefit-costanalysis and is codified into governmental and agency practices(e.g., EO 12866, Agency guidelines for performing regulatoryimpact analyses). However, alternative views do exist on whysociety should seek to preserve or improve the functioning ofecosystems. Such alternative views may provide a more expansiveview of CWA benefits than the human-based approach used in thisanalysis.
To summarize, our study uses a national water resources networkmodel based on RF1. That model is designed to link PS and NPSloadings, river and stream flows, and the beneficial use goals of theCWA. We used the results of this modeling effort, together withresults from existing empirical literature, to estimate the economicsignificance of current beneficial use attainment relative to theexpected state of the Nation’s water quality in the absence of theCWA.
This analysis builds on previous work undertaken by Clark et al.(1995) and Research Triangle Institute (1997b) and represents anongoing effort to develop a comprehensive assessment of thebenefits of the CWA as discussed above. Thus, although this studydoes expand the range of pollutants and sources considered in theanalysis over earlier versions of the study, it is important to notethat it represents only another increment in an on-going process ofevaluating all of the water resources, pollutants, and associatedservice flows affected by the provisions of the Act. A morecomprehensive evaluation will require expanding the waterresources and pollutants covered, as well as addressing a number ofanalytical issues.
A Benefits Assessment of Water Pollution Control Programs Since 1972:Part 1, The Benefits of Point Source Controls for Conventional Pollutants in Rivers and Streams
1-6
A case study of the Willamette river basin in northwest Oregon isalso included to complement and contrast with the nationalevaluation. It provides a more comprehensive analysis of the waterquality changes and of the services provided by water resourceswithin a specific region. By working on a smaller geographic scale,the analysis has the benefit of being less abstract than is requiredwhen conducting a national analysis. Thus, it provides an informaltype of validation test for our national modeling approach.

2-1
Water Pollution and
2 CWA RegulatoryPrograms
Water pollution results from the release of residuals that change thephysical, biological, or chemical properties of waterbodies. Thesepollutants originate from both natural and human processes. Historically the uninformed and self-interested behaviors ofdischargers have degraded water resources in the United States andthroughout the world. The CWA reflects a recognition of theproblem and incorporates programs for improving water quality. The Agency’s implementation of these programs has resulted in amarked reduction in pollutant releases to the Nation’s waters.
2.1 WATER POLLUTANTS
Under the CWA, water pollutants are divided into conventionalpollutants, nonconventional pollutants, and toxic pollutants.
Conventional Pollutants
The primary conventional pollutants defined in Title 40 of the Codeof Federal Regulations (CFR) are biochemical oxygen-demandingwastes, TSS, bacteria, and FC. Oil, grease, and pH are otherconventional pollutants. Biodegradable organic materials containplant, fish, or animal matter that uses oxygen in the water duringdecomposition. BOD is the standard measure of these pollutants’potential to remove oxygen from the receiving waters. Oxygen-poor waters will only support trash fish and the most resistantmicroorganisms and invertebrates. In extreme cases, these waters

A Benefits Assessment of Water Pollution Control Programs Since 1972:Part 1, The Benefits of Point Source Controls for Conventional Pollutants in Rivers and Streams
2-2
support bacterial activity to such an extent that noxious gases andfoul odors are produced.
Excess sediment can fill lakes, smother aquatic life, cloud water,and block sunlight. Sediment can also carry other pollutants intowaterbodies. Erosion and runoff are primary sources of thispollutant.
Waterborne pathogenic organisms cause human illnesses rangingfrom minor respiratory and skin diseases to typhoid, infectioushepatitis, and polio. In addition to these diseases—often caused bydirect contact with contaminated water—biting insects can transmitwaterborne pathogens. The primary sources of infectious agentsfound in water resources are feces. Inadequately treated sewage,storm water drains, and livestock runoff are all sources of thesepollutants. An indicator bacterium (e.g., FC) is typically measuredto determine whether dangerous organisms are present in a body ofwater.
Nonconventional Pollutants
Nonconventional pollutants include chemical oxygen demand(COD), total organic carbon (TOC), nitrogen, and phosphorous. Fertilizers, sewage, manure, and detergents containing nitrogen andphosphorous from runoff and municipal discharges contribute toincreases in nutrient levels and in the biological productivity ofwater resources (EPA, 1995). However, excess nutrientsoverstimulate the growth of aquatic weeds and algae, leading to“blooms,” oxygen depletion, and elevated levels of sedimentaccumulation.
Toxic Pollutants
Toxic pollutants are listed by name in the CFR pursuant to Section307(a)(1) of the Act. There are 65 such named chemicals. Theyinclude both natural and synthetic organic chemicals as well asmetals discharged from industrial sources. Natural and syntheticorganic chemicals can be highly toxic, even in smallconcentrations. Synthetic compounds such as polychlorinatedbiphenyls (PCBs), pesticides, solvents, and dioxins often persist andaccumulate in the environment because they do not easilydecompose (EPA, 1995). Exposure to many of these compounds

Section 2 — Water Pollution and CWA Regulatory Programs
1This section draws heavily on John Fogarty’s (1991) review of the CWA legislation.
2-3
has been found to cause cancer and birth defects in humans andanimals.
Heavy metals (e.g., mercury, lead, cadmium) released towaterbodies often persist and accumulate in the environmentbecause they do not easily decompose (EPA, 1995). Exposure tomany of these compounds has been found to damage ecosystemsand to cause cancer and birth defects in humans and animals. Mining, processing, and use of these metals are all potentialsources of releases. Nonmetallic salts can be toxic for plants andanimals. Irrigation of high-salt-content soils and runoff fromhighways treated with sodium and calcium chloride are sources ofnonmetallic salt pollutants. Acids are toxic to many fish andamphibians. Direct releases from industrial processes, leaching ofmineral wastes, and atmospheric deposition all contribute to thepresence of these pollutants in water resources.
2.2 SOURCES OF POLLUTANTS
Sources that generate major water pollutants are typically classifiedinto PS and NPS groups. PSs directly discharge pollutants intosurface waters from pipes, conduits, or conveyances. Thesesources include industrial facilities, municipal sewage treatmentplants, stormwater discharges from discrete conveyances (i.e.,pipes), and combined sewer overflows (CSOs). NPSs deliverpollutants to surface waters through a variety of origins. Theyinclude agricultural runoff and urban runoff. NPS pollution tends tobe highly episodic, depending on rain, snowmelt, or irrigation thatoccurs in excess of soils’ capacity to collect and assimilatepollutants. Table 2-1 lists major sources of water pollution.
2.3 CWA POLLUTION CONTROL PROGRAMS1
Water pollution control policy under the CWA is primarily foundedon technology-based effluent standards for PSs and managementpractices for NPSs. This section describes these programs for directdischargers and POTWs, indirect dischargers, and NPSs.

A Benefits Assessment of Water Pollution Control Programs Since 1972:Part 1, The Benefits of Point Source Controls for Conventional Pollutants in Rivers and Streams
2-4
Table 2-1. Major Sources of Water Pollution
Source Examples
Industrial Chemical manufacturers, pulp and paper mills,steel plants and food processing plants.
Municipal Publicly owned sewage treatment plants that mayreceive indirect discharges from industrial facilitiesor businesses.
Combinedsewers
Single facilities that treat both storm water andsanitary sewage, which may become overloadedduring storm events and discharge untreated wastesinto surface waters.
Storm sewers/urban runoff
Runoff from impervious surfaces, including streets,parking lots, buildings, lawns, and other pavedareas.
Agricultural Crop production, pastures, rangeland, feedlots,other animal holding areas.
Silvicultural Forest management, tree harvesting, logging roadconstruction.
Construction Land development, road construction.
Resourceextraction
Mining, petroleum drilling, runoff from mine tailingsites.
Land disposal Leachate or discharge from septic tanks, landfills,and hazardous waste sites.
Source: U.S. Environmental Protection Agency. 1995. National Water QualityInventory: 1994 Report to Congress. EPA 841-R-95-005. Washington,DC: Office of Water.
2.3.1 Direct Industrial Dischargers and POTWs
Most industrial sources and all POTWs discharge their effluentdirectly to water resources. EPA has developed technology-basedeffluent limitations for these sources under the effluent guidelineprogram. Industry-specific limits are based on BPT—the “bestpracticable control technology currently available”; BCT—the “bestconventional pollutant control technology”;—and BAT—the “bestavailable technology economically achievable.” The effluent limitsbased on these technology standards are independent of the qualityof the receiving water resources. They are designed to achieve acommon level of control across all similar sources regardless oflocation.

Section 2 — Water Pollution and CWA Regulatory Programs
2-5
EPA has prepared over 51 effluent guidelines since the CWA wasenacted (Federal Register, 1996). Table 2-2 lists the effluentguidelines included in CFR Title 40. These effluent limitations areimplemented under the NPDES. Under this program all directdischargers, including storm water PSs, must be permitted by theAgency or, where authorized, by the States. The permit establishesdischarge limits and source monitoring and reporting requirements. More than 200,000 sources are regulated by NPDES permitsnationwide.
EPA’s technology-based control programs for direct industrialdischargers are supplemented on a case-by-case basis by additionalcontrol requirements based on water quality. Under Section 303,States, tribes, and jurisdictions establish standards for high prioritywaterbodies that define water quality in terms of designatedbeneficial uses, criteria to protect those uses, and antidegradationprovisions (EPA, 1995). Total maximum daily loads (TMDLs) forthe various pollutants are calculated for these resources based onthe pollutant loadings necessary to meet water quality standards. More stringent controls than the effluent guideline technologies arerequired if discharges are in excess of the TMDLs. The Statesallocate the TMDL among the various dischargers incorporating thecontrol requirements in the NPDES permits.
POTWs receive wastewaters from residential and industrial sources(indirect dischargers) and storm water runoff, treat the wastewaters,and discharge the treated effluent to water resources. The residualbiosolids (sludges) are also treated. POTWs are required in mostareas to provide at least secondary treatment to ensure that85 percent of conventional pollutants are removed (Council onEnvironmental Quality, 1995). In addition to the nationalstandards, local pretreatment programs are required for POTWswith a total daily design flow of 5 million gallons or more. Theseprograms address the specific treatment capabilities of the localPOTW.
To complement its program of effluent standards, EPA providesfinancial assistance to municipalities to solve their wastewatertreatment problems by supporting the construction of publicwastewater treatment projects. The 1987 amendments to the CWAshifted the method of Federal assistance from grants to loans

A Benefits Assessment of Water Pollution Control Programs Since 1972:Part 1, The Benefits of Point Source Controls for Conventional Pollutants in Rivers and Streams
2-6
Table 2-2. Effluent Guidelines Included in CFR Title 40
Part Description
PART 400 [Reserved]
PART 401 General provisions
PART 402 [Reserved]
PART 403 General pretreatment regulations for existing and newsources of pollution
PART 405 Dairy products processing PS category
PART 406 Grain mills PS category
PART 407 Canned and preserved fruits and vegetables processingPS category
PART 408 Canned and preserved seafood processing PS category
PART 409 Sugar processing PS category
PART 410 Textile mills PS category
PART 411 Cement manufacturing PS category
PART 412 Feedlots PS category
PART 413 Electroplating PS category
PART 414 Organic chemicals, plastics, and synthetic fibers PScategory
PART 415 Inorganic chemicals manufacturing PS category
PART 416 [Reserved]
PART 417 Soap and detergent manufacturing PS category
PART 418 Fertilizer manufacturing PS category
PART 419 Petroleum refining PS category
PART 420 Iron and steel manufacturing PS category
PART 421 Nonferrous metals manufacturing PS category
PART 422 Phosphate manufacturing PS category
PART 423 Steam electric power generating PS category
PART 424 Ferroalloy manufacturing PS category
PART 425 Leather tanning and finishing PS category
PART 426 Glass manufacturing PS category
PART 427 Asbestos manufacturing PS category
PART 428 Rubber manufacturing PS category
PART 429 Timber products processing PS category
(continued)

Section 2 — Water Pollution and CWA Regulatory Programs
2-7
Table 2-2. Effluent Guidelines Included in CFR Title 40(continued)
Part Description
PART 430 Pulp, paper, and paperboard PS category
PART 431 The builders’ paper and board mills PS category
PART 432 Meat products PS category
PART 433 Metal finishing PS category
PART 434 Coal mining PS category BPT, BAT, BCT limitationsand NSPS
PART 435 Oil and gas extraction PS category
PART 436 Mineral mining and processing PS category
PART 439 Pharmaceutical manufacturing PS category
PART 440 Ore mining and dressing PS category
PART 446 Paint formulating PS category
PART 447 Ink formulating PS category
PART 454 Gum and wood chemicals manufacturing PS category
PART 455 Pesticide chemicals
PART 457 Explosives manufacturing PS category
PART 458 Carbon black manufacturing PS category
PART 459 Photographic PS category
PART 460 Hospital PS category
PART 461 Battery manufacturing PS category
PART 463 Plastics molding and forming PS category
PART 464 Metal molding and casting PS category
PART 465 Coil coating PS category
PART 466 Porcelain enameling PS category
PART 467 Aluminum forming PS category
PART 468 Copper forming PS category
PART 469 Electrical and electronic components PS category
PART 471 Nonferrous metals forming and metal powders PScategory
Source: U.S. Environmental Protection Agency. 1997. World Wide Web site: <http://www.epa.gov.docs/epacfr40/contents.html>.

A Benefits Assessment of Water Pollution Control Programs Since 1972:Part 1, The Benefits of Point Source Controls for Conventional Pollutants in Rivers and Streams
2-8
provided by state revolving funds (SRF) (Council on EnvironmentalQuality, 1995). Currently all 50 States are operating SRF programs.
2.3.2 Indirect Industrial Dischargers
Indirect industrial dischargers release their effluents to POTWswhere they are treated. The treated effluent is then released to water resources. Because POTWs are primarily designed to handleresidential wastes, national pretreatment requirements for industrialdirect dischargers were established under CWA Section 307(b). Their purpose is to address any problems caused by pollutants thatare not susceptible to treatment by most POTWs and thus wouldotherwise pass through without being treated before discharge orwould interfere with the proper operation of the POTW’s treatmentsystem. Standards for indirect dischargers are generally analogousto the limitations imposed on direct industrial dischargers (FederalRegister, 1996).
2.3.3 Nonpoint Sources
NPSs are addressed under the CWA and under the Coastal ZoneAct Reauthorization Amendments of 1990 (CZARA). Under theseActs, EPA establishes guidance for the States to use whendeveloping their nonpoint pollution control programs. Under theCWA, the States conduct assessments of their NPS problems, designNPS management programs, and implement the programs. UnlikePSs that can be regulated at the discharge point, NPSs, by their verynature, require implementing management practices. EPA’sguidance does not have the force of regulatory authority, althoughthe States’ programs must be approved by the Agency. But it doescodify a set of best available control practices to address NPS waterpollution. The States must develop their specific programs to dealwith their NPS problems. EPA has grant programs to assist theStates in implementing their EPA-approved programs.
3-1
Water QualityConditions and
3 Water Resourcesand Their Services
The Nation’s water resources consist of marine and freshwaters, aswell, as estuarine waters where these two systems interact. One ofthe most comprehensive characterizations of the quality of theseresources is provided by the Agency’s National Water QualityInventory (NWQI or 305[b]) reports, which identify the pollutantsand primary categories of pollutant sources that threaten theirquality. This information is summarized here to complement thewater quality estimates we have developed using a simulationapproach.
The NWQI provides an overview of current water qualityconditions relative to the use support goals that the States andjurisdictions have established for their water resources. It is usefulbecause it offers a broad description of water quality; however,because water quality is defined in relative, rather than absoluteterms, it is less useful to our broader goal of describing the changein water quality resulting from the CWA. To do this, we use asimulation approach that establishes distinct levels that can becompared in a with- and without-CWA framework. This isdescribed in more detail in Section 4.
In this section, we present an overview of the water conditions inthe mid-1990s as described in the NWQI. We also provide ataxonomy of the full range of services provided by water resources
A Benefits Assessment of Water Pollution Control Programs Since 1972:Part 1, The Benefits of Point Source Controls for Conventional Pollutants in Rivers and Streams
3-2
based on the observation that some services are provided when thewater is withdrawn; others are in-place services. In either case, thequality of these services may be affected by water quality changes. The information on water quality, resources, and services providedhere provides a useful context for interpreting the results of oursimulation model, which are described in the next two sections ofthis report.
3.1 CURRENT WATER QUALITY CONDITIONS
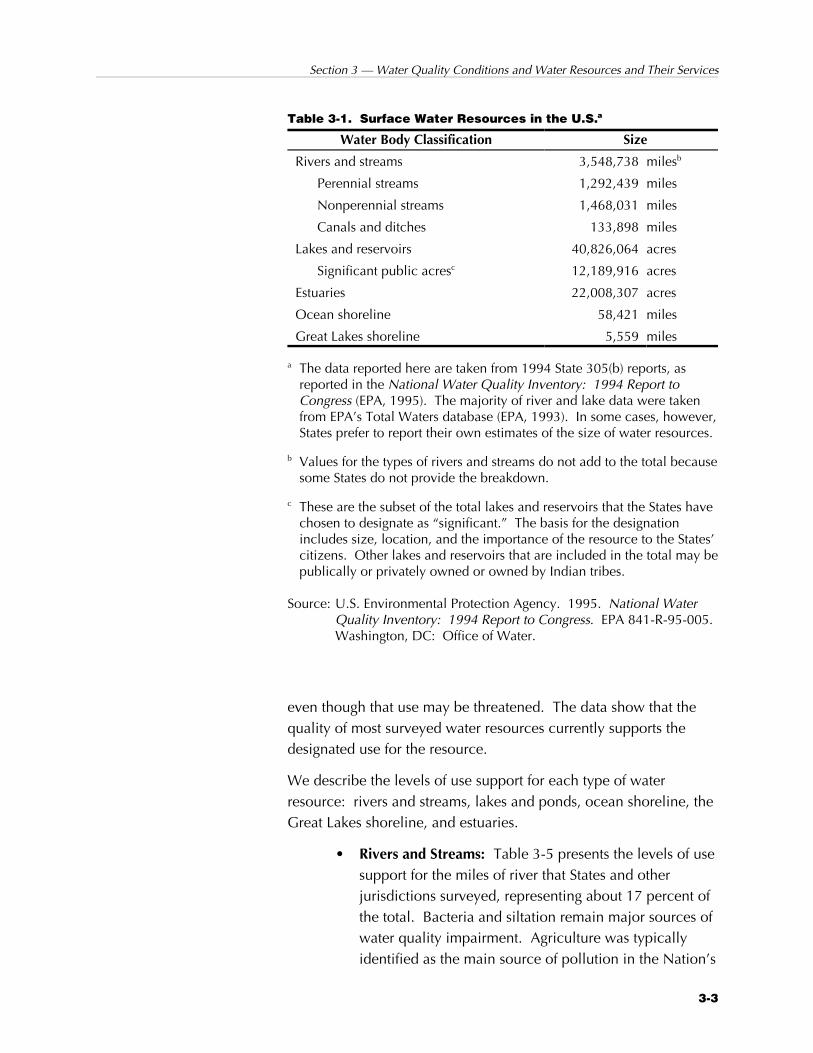
Table 3-1 summarizes the resources comprising the Nation’ssurface water system. Under the CWA, States and jurisdictions arerequired to designate “beneficial uses” (see Table 3-2 for a list ofthese uses) for each of their waterbodies and to report to EPA on theattainment of these uses. The results have been summarized mostrecently by EPA in The National Water Quality Inventory: 1994Report to Congress (EPA, 1995). This report covers the 1992 to1993 period and provides a comprehensive characterization ofwater quality for these resources.
A majority of States and jurisdictions have adopted the beneficialuse categorization listed in Table 3-2. They conduct surveys todetermine the extent to which each water resource supports eachrelevant designated use and, under Section 305(b), report on thestatus of their resources. Table 3-3 describes the various “scores”or levels assigned to each of the relevant beneficial use categoriesfor every water resource.
The 305(b) reports are still a very useful basis for characterizingwith-CWA water quality conditions because of their significantscope and because they are based on the reporting entities’ goalsfor their water resources. For the 1994 Report to Congress, Statesand jurisdictions surveyed 17 percent (615,806 miles) of theNation’s rivers and streams; 42 percent (17,134,152 acres) of itslakes, ponds, and reservoirs; 78 percent (26,847 square miles) of itsestuaries; 9 percent (5,208 miles) of its ocean shoreline waters; and94 percent (5,224 miles) of the Great Lakes shoreline to determinethe quality of the Nation’s water resources. These surveys primarilycover conditions in 1992 and 1993 and occasionally early 1994. Table 3-4 presents the percentage of surveyed waters that Statesand other jurisdictions reported as “good.” That is, the waterquality of the surveyed resource meets the designated use criteria,
Section 3 — Water Quality Conditions and Water Resources and Their Services
3-3
even though that use may be threatened. The data show that the quality of most surveyed water resources currently supports thedesignated use for the resource.
We describe the levels of use support for each type of waterresource: rivers and streams, lakes and ponds, ocean shoreline, theGreat Lakes shoreline, and estuaries.
• Rivers and Streams: Table 3-5 presents the levels of usesupport for the miles of river that States and otherjurisdictions surveyed, representing about 17 percent ofthe total. Bacteria and siltation remain major sources ofwater quality impairment. Agriculture was typicallyidentified as the main source of pollution in the Nation’s
Table 3-1. Surface Water Resources in the U.S.a
Water Body Classification Size
Rivers and streams 3,548,738 milesb
Perennial streams 1,292,439 miles
Nonperennial streams 1,468,031 miles
Canals and ditches 133,898 miles
Lakes and reservoirs 40,826,064 acres
Significant public acresc 12,189,916 acres
Estuaries 22,008,307 acres
Ocean shoreline 58,421 miles
Great Lakes shoreline 5,559 miles
a The data reported here are taken from 1994 State 305(b) reports, asreported in the National Water Quality Inventory: 1994 Report toCongress (EPA, 1995). The majority of river and lake data were takenfrom EPA’s Total Waters database (EPA, 1993). In some cases, however,States prefer to report their own estimates of the size of water resources.
b Values for the types of rivers and streams do not add to the total because some States do not provide the breakdown.
c These are the subset of the total lakes and reservoirs that the States havechosen to designate as “significant.” The basis for the designation includes size, location, and the importance of the resource to the States’citizens. Other lakes and reservoirs that are included in the total may bepublically or privately owned or owned by Indian tribes.
Source: U.S. Environmental Protection Agency. 1995. National WaterQuality Inventory: 1994 Report to Congress. EPA 841-R-95-005. Washington, DC: Office of Water.

A Benefits Assessment of Water Pollution Control Programs Since 1972:Part 1, The Benefits of Point Source Controls for Conventional Pollutants in Rivers and Streams
3-4
Table 3-2. Beneficial Uses of Water Bodies
Use Classification Description
Aquatic life support Provide suitable habitat for protection and propagation of aquaticorganism
Fish consumption Support fish free from potential health risk
Shellfish harvesting Support shellfish populations free from potential health risk
Drinking water supply Supply safe drinking water with conventional treatment
Primary contact recreation Provide for recreational swimming without adverse health effects
Secondary contact recreation Provide for “on-water” activities such as boating without adversehuman health risks
Agriculture Provide suitable water for irrigating fields or watering livestock
Ground water recharge Support adequate surface supply and quality to protect uses ofground water
Wildlife habitat Support habitat and resources for land-based wildlife
Culture Support the water body’s role in culture
Source: U.S. Environmental Protection Agency. 1995. National Water Quality Inventory: 1994 Report to Congress. EPA 841-R-95-005. Washington, DC: Office of Water.
Table 3-3. Levels of Use Support
Use Support LevelWater Quality
Condition Definition
Fully supporting Good Water quality meets designated use criteria
Threatened Good Water quality supports beneficial uses now but may notin the future unless action is taken
Partially supporting Fair (impaired) Water quality fails to meet designated use criteria attimes
Non supporting Poor (impaired) Water quality frequently fails to meet designated usecriteria
Not attainable Poor The State or jurisdiction has determined that use supportis not attainable due to one of six biological, chemical,physical, or economic/social conditions specified in theCode of Federal Regulations
Source: U.S. Environmental Protection Agency. 1995. National Water Quality Inventory: 1994 Report to Congress. EPA 841-R-95-005. Washington, DC: Office of Water.

Section 3 — Water Quality Conditions and Water Resources and Their Services
3-5
Table 3-4. Status of U.S. Surface Water Resources, 1992–1993: Proportion of AssessedWaters Reported to Have Good Water Quality (%)
Rivers andStreams
Lakes andPonds
OceanShoreline
Great LakesShoreline Estuaries
Number of Assessed Waters 615,806miles
17,134,152acres
5,209miles
5,224miles
26,847square miles
Use Classification
Aquatic life 69% 69% 95% 27% 70%
Fish consumption 95% 82% 96% 2% 92%
Swimming 77% 80% 95% 96% 85%
Secondary contactrecreation
87% 86% 99% 96% 83%
Drinking water 83% 87% NA 98% NA
Agriculture 92% 94% NA 89% NA
Shellfishing NA NA 95% NA 74%
NA = Not available.
Source: U.S. Environmental Protection Agency. 1995. National Water Quality Inventory: 1994 Report to Congress. EPA 841-R-95-005. Washington, DC: Office of Water.
Table 3-5. Levels of Use Support—Riversa, 1992–1993
Use ClassificationFully
Supporting ThreatenedPartially
Supporting PoorNot
Attainable
Aquatic life 62% 7% 21% 10% <1%
Fish consumption 94% 1% 3% 2% <1%
Swimming 74% 3% 10% 13% <1%
Secondary contactrecreation
85% 2% 7% 6% <1%
Drinking water 80% 3% 8% 9% <1%
Agriculture 91% <1% 4% 4% <1%
Shellfishing NA NA NA NA NA
NA = Not available.
a Expressed as a percentage of surveyed river miles.
Source: U.S. Environmental Protection Agency. 1995. National Water Quality Inventory: 1994 Report to Congress. EPA 841-R-95-005. Washington, DC: Office of Water.

A Benefits Assessment of Water Pollution Control Programs Since 1972:Part 1, The Benefits of Point Source Controls for Conventional Pollutants in Rivers and Streams
3-6
surveyed rivers. Municipal sewage treatment plantswere the second most common source of riverpollution.
• Lakes and Ponds: Table 3-6 provides the levels of usesupport for the lake acres that States and otherjurisdictions surveyed, representing about 42 percent ofthe total. Elevated nutrient loadings are a main sourceof lake pollution along with siltation, organic wastes,and metals. Agriculture was identified as the mostprevalent source of lake and pond pollution followed bymunicipal sewage, urban runoff, and storm sewers.
• Ocean Shoreline: Table 3-7 presents the levels of usesupport for the miles of ocean shoreline that States andother jurisdictions surveyed, representing about9 percent of the total. Only six of 27 coastal Statesidentified pollutants and sources of pollutants degradingocean shoreline waters. Such sparse data make drawingany national-level generalizations difficult. However,the six States identified bacteria, metals, nutrients,turbidity, siltation, and pesticides as major pollutants.
Table 3-6. Levels of Use Support—Lakes and Pondsa, 1992-1993
Use ClassificationFully
Supporting ThreatenedPartially
Supporting PoorNot
Attainable
Aquatic life 56% 13% 23% 8% <1%
Fish consumption 76% 6% 14% 4% <1%
Swimming 69% 12% 15% 4% <1%
Secondary contactrecreation
80% 6% 13% 1% 0%
Drinking water 82% 5% 7% 6% 0%
Agriculture 93% 1% 5% 0% <1%
Shellfishing NA NA NA NA NA
NA = Not available.
a Expressed as a percentage of surveyed lake areas.
Source: U.S. Environmental Protection Agency. 1995. National Water Quality Inventory: 1994 Report to Congress. EPA 841-R-95-005. Washington, DC: Office of Water.

Section 3 — Water Quality Conditions and Water Resources and Their Services
3-7
Urban runoff and storm sewers, industrial discharges,land disposal of wastes, septic systems, agriculture, andCSOs were identified as sources.
• Great Lakes Shoreline: Table 3-8 provides the levels ofoverall use support for the 5,224 surveyed miles ofGreat Lakes shorelines, representing 94 percent of thetotal. At the time of the survey, most of the Great Lakesshorelines were polluted by toxic organic chemicals. Other causes of use support impairment were pesticides,nonpriority organic chemicals, nutrients, and metals. Leading sources were atmospheric deposition, urbanrunoff and storm sewers, CSOs, industrial and municipaldischarges, agriculture, and land disposal of wastes.
• Estuaries: Table 3-9 presents the levels of overall usesupport for the 26,847 square miles of surveyedestuaries, representing 78 percent of the total. Nutrientsand bacteria were the main pollutants of estuarinewaters. Organic wastes and oil and grease also pollutedestuaries. Urban runoff and storm sewers, municipalsewage treatment plants, agriculture, and industrialdischarges were the most widespread sources ofpollution in the Nation’s surveyed estuarine waters.
Table 3-7. Levels of Use Support—Ocean Shorelinea, 1992–1993
Use ClassificationFully
Supporting ThreatenedPartially
Supporting PoorNot
Attainable
Aquatic life 93% 2% 4% 1% 0%
Fish consumption 96% 0% 4% 0% 0%
Swimming 64% 31% 4% 1% 0%
Secondary contactrecreation
98% 1% <1% 1% 0%
Drinking water NA NA NA NA NA
Agriculture NA NA NA NA NA
Shellfishing 95% <1% 4% 1% 0%
NA = Not available.a Expressed as a percentage of surveyed ocean shoreline.
Source: U.S. Environmental Protection Agency. 1995. National Water Quality Inventory: 1994 Report to Congress. EPA 841-R-95-005. Washington, DC: Office of Water.

A Benefits Assessment of Water Pollution Control Programs Since 1972:Part 1, The Benefits of Point Source Controls for Conventional Pollutants in Rivers and Streams
3-8
Table 3-8. Levels of Use Support—Great Lakes Shorelinea, 1992–1993
Use ClassificationFully
Supporting ThreatenedPartially
Supporting PoorNot
Attainable
Aquatic life 11% 17% 10% 63% 0%
Fish consumption 2% 0% 34% 64% 0%
Swimming 96% 1% 3% <1% 0%
Secondary contactrecreation
96% <1% 4% 0% 0%
Drinking water 98% <1% <1% 2% 0%
Agriculture 89% 0% 11% 0% 0%
Shellfishing NA NA NA NA NA
NA = Not available.
a Expressed as a percentage of surveyed Great Lakes acres.
Source: U.S. Environmental Protection Agency. 1995. National Water Quality Inventory: 1994 Report to Congress. EPA 841-R-95-005. Washington, DC: Office of Water.
Table 3-9. Levels of Use Support—Estuariesa, 1992–1993
Use ClassificationFully
Supporting ThreatenedPartially
Supporting PoorNot
Attainable
Aquatic life 61% 9% 27% 3% 0%
Fish consumption 90% 2% 6% 2% 0%
Swimming 83% 2% 13% 2% <1%
Secondary contactrecreation
83% 0% 17% <1% 0%
Drinking water NA NA NA NA NA
Agriculture NA NA NA NA NA
Shellfishing 73% 1% 12% 13% 1%
NA = Not available.
a Expressed as a percentage of surveyed estuarine areas.
Source: U.S. Environmental Protection Agency. 1995. National Water Quality Inventory: 1994 Report to Congress. EPA 841-R-95-005. Washington, DC: Office of Water.
Section 3 — Water Quality Conditions and Water Resources and Their Services
3-9
Although the 305(b) data provide useful insights into national waterquality conditions, as mentioned earlier, they also have importantlimitations. One drawback to using this information forcharacterizing water quality throughout the Nation is that it doesnot provide an absolute measure of water quality; rather it providesan assessment of water quality relative to the designated use. Afurther limitation to these data is that they are based on inconsistentsample surveys—the sampling methods vary among the States and,in many cases, are not based on statistical sampling techniques. The resources surveyed are typically those of most importance tothe State or under the greatest threat of impairment.
To address these limitations and to provide a more appropriateframework for assessing changes attributable to CWA controls, weuse a simulation approach that is described in Section 4.
3.2 WATER RESOURCES SERVICES
Individuals perceive the benefits of the CWA through the improvements in water-based services they experience. Bergstromet al. (1996) have developed a taxonomy of groundwater servicesthat is a useful starting point for identifying how surface waterquality improvements may directly and indirectly benefit people. The services provided by water resources are divided intowithdrawal, in-place, and existence services. The first two involvedirect contact or use of the resource; the latter is related toindividuals’ altruism toward others whose welfare is affected bychanges in water quality, or to a sense of stewardship regardingwater resources.
Although the following is a comprehensive list of water resourceservices, note again that the valuation component of this study onlyfocused on in-place and existence services.
3.2.1 Withdrawal Services
Each day, U.S. inhabitants withdraw about 327 billion gallons ofwater from surface water sources for life support and otherproductive purposes. The availability and quality of the wateraffect the performance of these life and economic systems.
A Benefits Assessment of Water Pollution Control Programs Since 1972:Part 1, The Benefits of Point Source Controls for Conventional Pollutants in Rivers and Streams
3-10
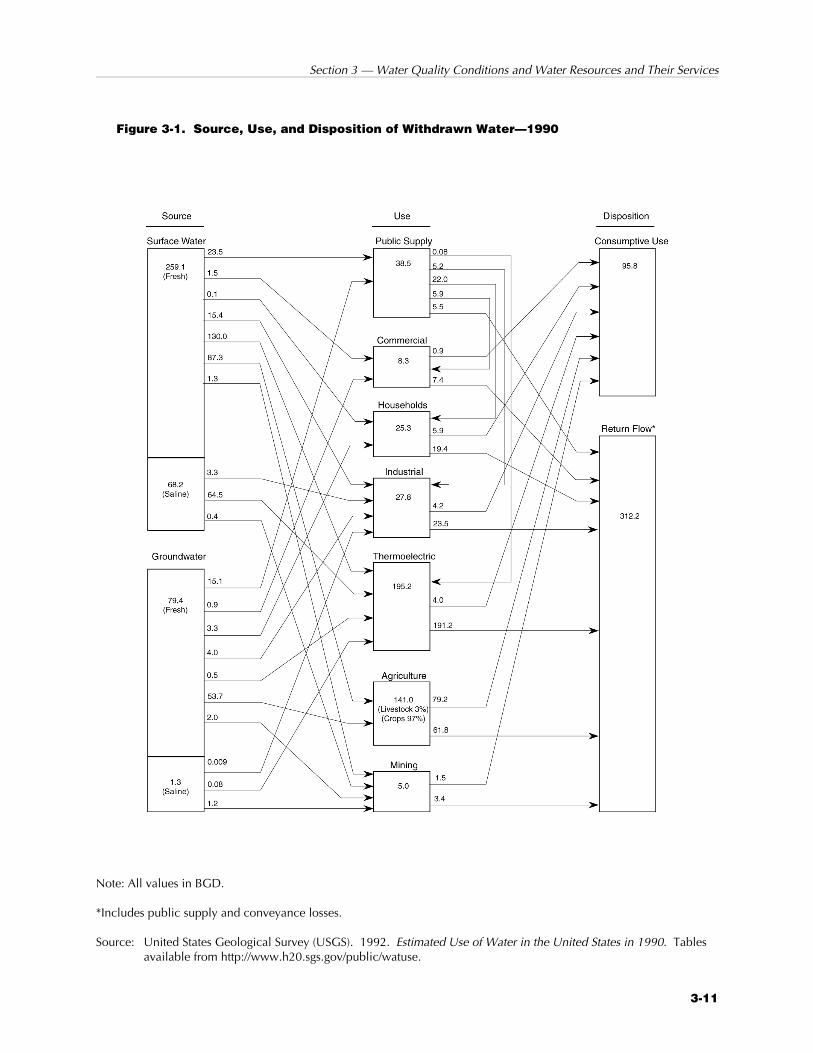
Figure 3-1 provides an overview of the water sources, users, andultimate disposition of withdrawn water. Most withdrawals arefrom fresh surface water resources. Seven broad economic usesectors are identified in the figure, covering the entire range ofproductive activity in an economy. Once used, the water may bereturned to one of the water resources as part of return flow or itmay be effectively consumed through a number of pathways (e.g.,evaporation of irrigation water). About one-quarter of waterresources are lost this way. Table 3-10 identifies the majorwithdrawal services of surface water and the key interfacesbetween these services and the sectors that use them. We describethe withdrawal services that depend on water quality.
• Life Support for Humans, Animals, and Plants: Waterresources are needed to support the various lifefunctions, most importantly as sources of drinking water. Without the proper quantity and quality of water, thehealth of living things may be impaired, and death mayresult in situations of extreme water deficiencies. Highconcentrations of nitrates, metals, organic and inorganiccontaminants, sediment, salt, radionuclides, pathogens,and other toxins all have the potential to cause seriousharm.
• Cooking: Water is used for cooking in kitchens of allsizes, from small households to large commercial users. In this capacity, water serves two purposes—as a heattransfer medium and as an integral part of the foodproduct.
• Watering and Irrigation: Agriculture, primarily throughwatering and irrigation, accounts for the great majorityof water withdrawals. Water is used on farms for cropand livestock production and in households for wateringlawns, shrubs, and pets. In this capacity, water alsoprovides important life support services.
Section 3 — Water Quality Conditions and Water Resources and Their Services
3-11
Figure 3-1. Source, Use, and Disposition of Withdrawn Water—1990
Note: All values in BGD.
*Includes public supply and conveyance losses.
Source: United States Geological Survey (USGS). 1992. Estimated Use of Water in the United States in 1990. Tablesavailable from http://www.h20.sgs.gov/public/watuse.
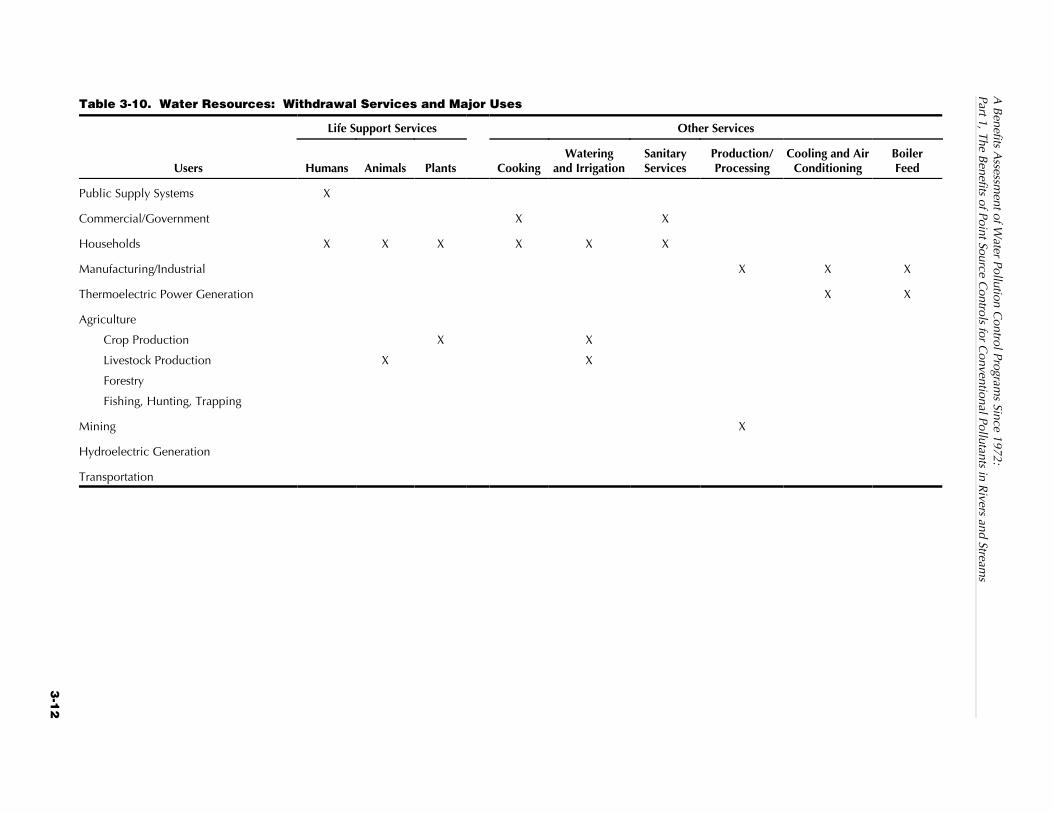
A B
enefits Assessm
ent of Water Pollution C
ontrol Programs Since 1972:
Part 1, The Benefits of Point Source C
ontrols for Conventional Pollutants in R
ivers and Streams
3-1
2
Table 3-10. Water Resources: Withdrawal Services and Major Uses
Life Support Services Other Services
Users Humans Animals Plants CookingWatering
and IrrigationSanitaryServices
Production/Processing
Cooling and AirConditioning
BoilerFeed
Public Supply Systems X
Commercial/Government X X
Households X X X X X X
Manufacturing/Industrial X X X
Thermoelectric Power Generation X X
Agriculture
Crop Production X X
Livestock Production X X
Forestry
Fishing, Hunting, Trapping
Mining X
Hydroelectric Generation
Transportation

Section 3 — Water Quality Conditions and Water Resources and Their Services
3-13
• Sanitary Services: Water is used for a variety of sanitaryservices: dishwashing, toilet flushing, bathing,laundering, washing, and garbage disposal. Alleconomic sectors use water for some type of sanitaryservice. Commercial use varies greatly depending onthe type of industry. Water quality can be a concernwhen water is used for sanitary services. Water withhigh salt content may corrode metal pipes. Thepresence of iron, manganese, and hydrogen sulfide gascan cause objectionable odors and stain fixtures andappliances.
• Production/Processing: Water is commonly used formany industrial purposes, whether it is incorporated intothe finished product or used for some other purpose(e.g., dilution, cooling, washing). Some manufacturinggroups, such as paper and food processing, demandhigh-quality water before use. These groups may haveguidelines for acidity and alkalinity (pH), color,turbidity, metals, dissolved and suspended solids, andother water quality parameters.
• Cooling, Air Conditioning, and Boiler FeedApplications: The high specific heat of water makes ituseful for transferring heat from one place to another. Water is used in two ways for cooling. Cooling watermay be used once and released to a surface water body. The quality requirements for this use are slight. However, recirculation of cooling water before releaseby industrial users is becoming common because ofstricter government regulations on the amount of heatindustrial users are allowed to release into streams. Inthis case, treating recirculated water addresses qualityconcerns related to corrosiveness and iron deposits.
Water is also used for steam production in heating,electricity generation, and other industrial purposes. Chemical salt content is the biggest quality parameter ofconcern for boiler feed water. Chemical salt forms afilm of mineral deposits on heating surfaces in boilers. However, nearly all water sources have naturally
A Benefits Assessment of Water Pollution Control Programs Since 1972:Part 1, The Benefits of Point Source Controls for Conventional Pollutants in Rivers and Streams
3-14
occurring and prohibitively high salt content; thus,practically all water is treated before boiler feed use.
3.2.2 In-Place Services
The Nation’s surface water resources provide a number ofimportant services in-place; that is, the water is not withdrawn orused outside its natural setting. Table 3-11 identifies water’s majorin-place services and the key interfaces between these services andthe sectors that use them. We describe the in-place services thatdepend on water quality.
• Life Support for Animals and Plants: In-place watersupplies support various life functions of living systems. Undomesticated animals have access to natural watersources. Aquatic plants uptake water through their rootsystems to perform photosynthesis. As described above,without the proper quantity and quality of water, thehealth of these systems may be impaired and death mayeven result in extreme situations. Support for animalsand plants also results in auxiliary services such as cleanair, clean water, climate regulation, and ecosystemactivities.
• Residuals Removal/Dilution/Storage/Treatment: Wateris commonly used as a means of removing wastes fromtheir point of discharge and treating those wastes innatural systems through the physical and chemicalaction of water resource systems. Virtually all sectorshave directly used this service. Indeed, the waste loadshave become so large that they have degraded thequality of the receiving waters, impairing the quality ofthe withdrawal and in-place services of water.
• Commercial Fishing: The success of commercial fishingactivities is directly related to the health of the stock ofcommercially exploitable fish species. Because cleanwater provides life support for these species, poor waterquality can result in increased harvest costs and pricesfor fish.
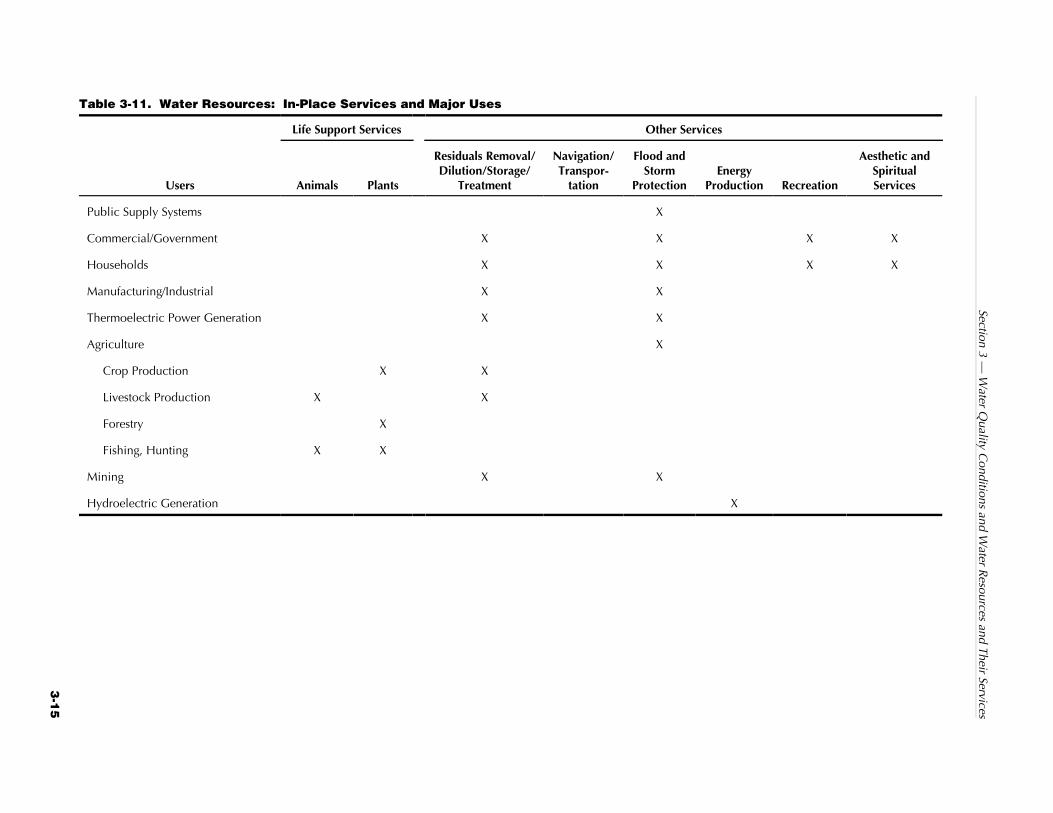
Section 3 — W
ater Quality C
onditions and Water R
esources and Their Services
3-1
5
Table 3-11. Water Resources: In-Place Services and Major Uses
Life Support Services Other Services
Users Animals Plants
Residuals Removal/Dilution/Storage/
Treatment
Navigation/Transpor-
tation
Flood andStorm
ProtectionEnergy
Production Recreation
Aesthetic andSpiritualServices
Public Supply Systems X
Commercial/Government X X X X
Households X X X X
Manufacturing/Industrial X X
Thermoelectric Power Generation X X
Agriculture X
Crop Production X X
Livestock Production X X
Forestry X
Fishing, Hunting X X
Mining X X
Hydroelectric Generation X

A Benefits Assessment of Water Pollution Control Programs Since 1972:Part 1, The Benefits of Point Source Controls for Conventional Pollutants in Rivers and Streams
3-16
• Navigation/Transport: The abundance and smoothsurface of water provide an economical means ofmoving people and goods. This service is primarilyaffected by water quantity rather than water qualitybecause excessively low or high stream flow can impairthese services.
• Flood and Storm Protection: Wetlands, in particular,may provide flood and storm protection services. Floodand storm water may collect in wetlands that serve as akind of buffer, lowering flood heights and preventingerosion of shorelines. By supporting healthy wetlandecosystems, water quality can therefore be an importantingredient for the provision of this service.
• Energy Production: The kinetic energy in moving wateris used to generate power. Today, the largest use ofwater for the production of energy is hydroelectricgeneration. At hydroelectric facilities, falling water isused directly to turn turbines, which generateselectricity. Water quantity is the primary determinant ofthe quality of this service.
• Recreation: Water is the focal point of manyrecreational activities such as swimming, boating,fishing, hunting, trapping, and plant gathering. In thiscapacity, water serves as a medium for transportation,an essential ecosystem component, and a source ofaesthetic beauty.
Recreational water quality concerns stem from themultitude of pollutant constituents that may affect anecosystem. Declining ecosystem health may in turngenerate changes in the quantity or quality ofrecreational activities or a change in human health orhealth risks. A common source of impaired recreationalwater use is pathogen infestations that impedeswimming and other forms of contact recreation.
Section 3 — Water Quality Conditions and Water Resources and Their Services
3-17
• Aesthetic Services: Throughout history, water has beencherished for its aesthetic value. For many people, theonsite observation of water resources and associatedliving and physical systems is a source of inspiration. Often, aesthetic services are referred to as passive uses.
Both water quantity and quality may affect the quality ofaesthetic amenities. Any degradation of water, whetherit be excessive flow that erodes stream banks orchemicals that harm aquatic organisms, may reduce theenjoyment humans receive from viewing waterresources.
3.2.3 Existence Services
John Krutilla (1967) first introduced the notion that individualscould derive satisfaction (utility) from natural resources eventhough they neither currently use them nor plan to do so in thefuture. Economists have suggested various motivations to supportthis nonuse concept over the past 30 years. The literature identifiesaltruism and stewardship as the most prominent.
Altruism involves the generalized concern for the welfare of others. In this context, altruism would be registered through the effect ofwater quality and its services on the welfare of others. Individualsmay also have a concern for nonhuman organisms. In that case,the service is the life support for natural systems.
4-1
Impact of the Clean Water Act on Use
4 Support of WaterResources
Estimating the benefits of the CWA requires, in part, characterizingthe water quality conditions expected in the absence of the CWA.These without-CWA water quality estimates, combined withestimates of the with-CWA (i.e., current) conditions, provide thebasis for estimating the changes in the quality of the servicesprovided by water resources. To have a valid comparison,estimates of both the without-CWA and the with-CWA conditionsmust be for the same time period.
The National Water Pollution Control Assessment Model(NWPCAM) was used to develop estimates of without-CWA waterquality conditions. This model builds on the Clean Water ActEffects Model (CWAEM), which was used in an earlier study byClark et al. (1995). The NWPCAM is a significant improvementover the CWAEM because both the pollutants and pollutant sourcesincluded in the model have been expanded. To provide aconsistent basis for comparing with- and without-CWA conditions,the NWPCAM was also used to develop the with-CWA conditionsestimates. The Section 305(b) water quality assessment informationcannot be used as the with-CWA conditions, in part because thereis no way to create without-CWA assessments within the 305(b)structure based on alternative pollutant loadings. Further, the305(b) evaluation of the support status of each water resource is
A Benefits Assessment of Water Pollution Control Programs Since 1972:Part 1, The Benefits of Point Source Controls for Conventional Pollutants in Rivers and Streams
1This section is largely drawn from A Comparative Analysis of BeneficialUse Attainment in Major U.S. Rivers and Streams Under AlternativeWater Pollution Control Scenarios (Research Triangle Institute, 1997b).
4-2
relative to an administratively determined use. Finally, not allresources are systematically and consistently evaluated. Thus, wehave used pollutant loadings estimates under the with-CWA andwithout-CWA conditions to derive the NWPCAM results.
The NWPCAM is a national-level water quality simulation modelthat includes the pollutants BOD, TSS, and FC. Tens of thousandsof major and minor sources and area sources are included in themodel. However, nonconventional and toxic pollutants are notcurrently included. The NWPCAM characterizes water quality forrivers and streams; it does not currently include most estuaries orlakes, the ocean shorelines, or the Great Lakes. Because the modeldoes not include these waters, the economic valuation of benefits islimited to the impact of the CWA on only a subset of the pollutantsand a subset of the Nation’s water resources.
4.1 BRIEF OVERVIEW OF THE NWPCAM1
A key component in developing water quality estimates is a modelthat can simulate the water quality changes associated with theplace-specific pollutant loadings changes that have occurred underthe CWA. The NWPCAM is a national-level water qualitysimulation model. It is a fairly simple hydrodynamic and waterquality model that is applied on a very large and detailed spatialscale. The large, detailed spatial scale makes the NWPCAMcapable of developing place-specific water quality estimates.
The NWPCAM has five key features. It
• estimates water quality for a river network that cancharacterize a meaningful “universe” of waters. Inparticular, the river and stream network used in themodel is the EPA RF1 database.
• accounts for pollutant loadings from both PSs and NPSs.
• uses stream flow and stream velocity data in modelingpollutant fate to simulate dilution and self-purificationeffects.

Section 4 — Impact of the Clean Water Act on Use Support of Water Resources
4-3
• estimates both water quality and beneficial useattainment—categories include boating, fishing, andswimming.
• is capable of characterizing PS loadings under differentstates of the world to do either retrospective analyses ofexisting programs or prospective analyses of newprograms under Agency consideration.
The NWPCAM incorporates the approximately 633,000 miles ofrivers and streams in RF1 grouped into 68,000 stream segments,known as “reaches,” of which approximately 61,000 are river andstream reaches with an average length of about 10 miles. These aretransport reaches—water flows down them. The remaining7,000 reaches are nontransport reaches (e.g., lake shorelines). Thetransport reaches are subdivided into subreaches for computationalpurposes by breaking them at each “milepost” and at any placewhere there is a known PS discharge. EPA, other agencies, and theStates are currently developing a more comprehensive reachdatabase, RF3. It will include virtually all of the 3 million miles ofrivers and streams because it will incorporate data on smaller, evenintermittent, streams.
Estimates of mean and low stream flows and velocities wereincorporated in the NWPCAM for each transport reach in RF1 totrace pollutant transport and to simulate dilution and self-purification. Hydrological relationships were used with theloadings and water flow data to estimate mean water quality foreach mile in RF1.
While the NWPCAM is very extensive in terms of water resourcesand pollutants, it is not complete. Estuaries, coastal waters, andlakes, including the Great Lakes, are not included in the model. Nonconventional and toxic pollutants are not included either.
4.2 POLLUTANT LOADINGS
Place-specific estimates of the discharge of three conventionalpollutants drive the water quality estimates developed by theNWPCAM. The pollutant loadings were estimated under bothwith-CWA and without-CWA conditions. While the great majorityof the pollutant loadings differences may be attributed to initiativestaken under the CWA, some of the changes in pollutant releasescharacterized below as “with CWA” are undoubtedly due to other

A Benefits Assessment of Water Pollution Control Programs Since 1972:Part 1, The Benefits of Point Source Controls for Conventional Pollutants in Rivers and Streams
4-4
nonfederal programs or would have happened without the Act. Prior to the passage of the 1972 amendments, some States andother authorities had begun to more vigorously address the problemof water pollution in their area. Even without the Act, loadingswould have been affected by such actions. However, becausethere is no way to project the impact of the nonfederal programs ifthere had been no CWA, and because the CWA is generallybelieved to be the major impetus behind the loadings changes (andsubsequent water quality improvements), we attribute all estimateddifferences in pollutant loadings and water quality to the CWA.
When developing the loadings estimates, it is not always possibleto have conformity in the current loadings estimates because datasources for the different dischargers are not always released for thesame years. Data for the latest year available, generally mid-1990s,were used as our with-CWA conditions.
4.2.1 Loadings Under the With-CWA Conditions
PS loadings of BOD and TSS by place were derived from the 1988Needs Survey database, the Industrial Facilities Discharge database(IFD), and the Permit Compliance System (PCS), which containsdata from the NPDES Discharge Monitoring Reports. In total, themodel incorporates place-specific discharge data from37,510 sources, including 9,890 municipal dischargers,2,261 major industrial dischargers, and 505 CSOs. A significantadvance of the NWPCAM over the CWAEM is the inclusion for thefirst time of 24,854 minor industrial dischargers.
Estimates of current (circa mid-1990s) national-level loadings ofBOD and TSS from industrial and municipal point sources areprovided in Table 4-1. The table includes estimated loadings fromall dischargers in the continental United States as well as dischargesfrom the subset of facilities on the rivers and streams modeled inthe NWPCAM.
NPS loadings are based on county-level loadings estimatesdeveloped by Lovejoy (1989) and Lovejoy and Dunkelberg (1990). Rural and urban loadings are reported separately. For rural areas,the annual NPS loadings were allocated to each mile of the riversand streams in RF1 in proportion to the total stream length in thecounty. For instance, if a county has a total of 100 miles of RF1rivers and streams, then we allocated 1 percent of the county’s NPS

Section 4 — Impact of the Clean Water Act on Use Support of Water Resources
4-5
loadings to each mile. For stream segments overlapping more thanone county, we assumed an equal proportion of the reach segmentis in each county. For urban NPS loads, the allocation wasproportional to both stream length and the population associatedwith each reach segment. Only a portion of NPS loads willactually get into the stream depending on the local sedimentdelivery ratio (SDR), which can vary greatly by watershed area. Separate SDRs were used for BOD and TSS for each of the18 hydrologic regions in the United States.
Loadings of BOD, TSS, and FC from CSOs serving approximately43 million people were obtained from Tetra Tech (1993). Theseloadings were updated to 1995. Table 4-2 provides the NPS andCSO current loadings estimates for BOD and TSS.
Table 4-1. Total Loadings of BOD and TSS for Industrial and Municipal Point Sources With theCWA, Mid-1990s
Water Resources
Industrial Dischargers Municipal Dischargers Totals
BOD(thousandtons/yr)
TSS(thousandtons/yr)
BOD(thousandtons/yr)
TSS(thousandtons/yr)
BOD(thousandtons/yr)
TSS(thousandtons/yr)
Inland rivers andstreamsa
1,050 4,496 524 577 1,575 5,073
Coastal 239 958 233 219 472 1,177
Great Lakes 4 629 16 18 20 647
Unknownb 558 1,255 101 116 659 1,372
Total 1,852 7,339 874 929 2,726 8,268
a The water quality effects are only estimated for these RF1 resources.b The water resource to which the loadings are released is unknown.
Table 4-2. Total Loadings of BOD and TSS for Nonpoint Sourcesand CSOs with the CWA, Mid-1990s
SourceaBOD
(thousand tons/year)TSS
(thousand tons/year)
NPS 1,847 64,363
CSO 1,309 4,806
a Only sources included in the NWPCAM.

A Benefits Assessment of Water Pollution Control Programs Since 1972:Part 1, The Benefits of Point Source Controls for Conventional Pollutants in Rivers and Streams
4-6
4.2.2 Loadings Under the Without-CWA Conditions
Since the passage of the CWA, pollutant loadings have changedbecause of changes in both the pollutant intensity of economicactivity and in the level and distribution of that activity. Thepollutant intensity of economic activity—that is, the ratio ofpollutant loadings per unit of activity—has generally decreased dueto the promulgation of effluent guidelines and the construction ofmunicipal wastewater treatment facilities. However, the aggregatelevel of economic activity has increased 87 percent over the 1972to 1996 period (U.S. Department of Commerce, 1997), implyingthat, without the change in pollutant intensity, loadings would haverisen by a similar percentage (assuming that this growth wasproportionally experienced across the economy’s sectors).
In constructing the without-CWA loadings estimates, we firstestimated early 1970s’ loadings/sales ratios by industry. We thenapplied these estimates to (i.e., multiplied by) estimates of mid-1990s’ sales by industry. These estimates of economic activitywere developed accounting for the fact that the CWA has imposedcosts on these industries and that this has altered somewhat thegrowth and distribution of economic activity across the Nation.
Estimates of pollutant loadings without the CWA are provided inTable 4-3. As discussed above, we attribute all these changes toinitiatives under the CWA. This approach undoubtedly overstates,by an unknown amount, the impact of the Act.
Table 4-3. Total Loadings of BOD and TSS for Industrial and Municipal Point Sources Withoutthe CWA, Mid-1990s
Water Resources
Industrial Dischargers Municipal Dischargers Totals
BOD(thousandtons/yr)
TSS(thousandtons/yr)
BOD(thousandtons/yr)
TSS(thousandtons/yr)
BOD(thousandtons/yr)
TSS(thousandtons/yr)
Inland rivers andstreamsa
1,619 8,306 1,106 1,217 2,725 9,523
Coastal 306 1,709 492 462 798 2,171
Great Lakes 6 1,140 34 38 40 1,178
Unknownb 1,154 2,441 222 244 1,376 2,685
Total 3,084 13,596 1,855 1,962 4,939 15,558
a The water quality effects are only estimated for these RF1 resources.b The water resource to which the loadings are released is unknown.
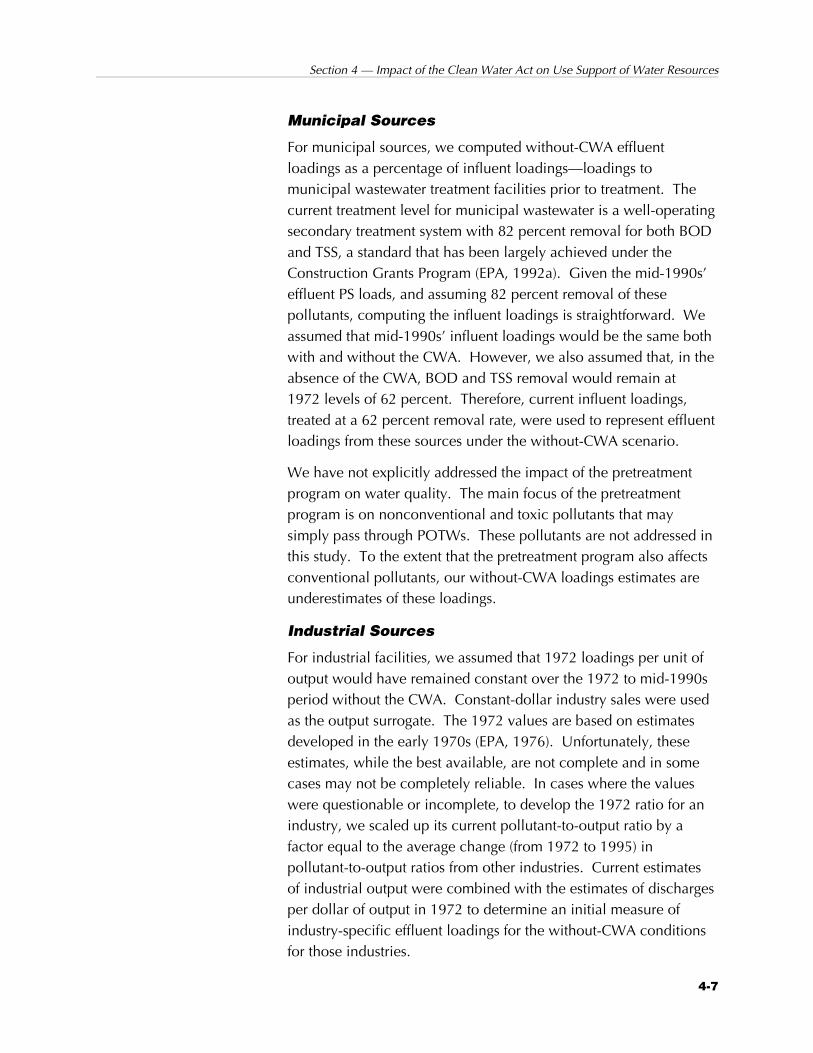
Section 4 — Impact of the Clean Water Act on Use Support of Water Resources
4-7
Municipal Sources
For municipal sources, we computed without-CWA effluentloadings as a percentage of influent loadings—loadings tomunicipal wastewater treatment facilities prior to treatment. Thecurrent treatment level for municipal wastewater is a well-operatingsecondary treatment system with 82 percent removal for both BODand TSS, a standard that has been largely achieved under theConstruction Grants Program (EPA, 1992a). Given the mid-1990s’effluent PS loads, and assuming 82 percent removal of thesepollutants, computing the influent loadings is straightforward. Weassumed that mid-1990s’ influent loadings would be the same bothwith and without the CWA. However, we also assumed that, in theabsence of the CWA, BOD and TSS removal would remain at1972 levels of 62 percent. Therefore, current influent loadings,treated at a 62 percent removal rate, were used to represent effluentloadings from these sources under the without-CWA scenario.
We have not explicitly addressed the impact of the pretreatmentprogram on water quality. The main focus of the pretreatmentprogram is on nonconventional and toxic pollutants that maysimply pass through POTWs. These pollutants are not addressed inthis study. To the extent that the pretreatment program also affectsconventional pollutants, our without-CWA loadings estimates areunderestimates of these loadings.
Industrial Sources
For industrial facilities, we assumed that 1972 loadings per unit ofoutput would have remained constant over the 1972 to mid-1990speriod without the CWA. Constant-dollar industry sales were usedas the output surrogate. The 1972 values are based on estimatesdeveloped in the early 1970s (EPA, 1976). Unfortunately, theseestimates, while the best available, are not complete and in somecases may not be completely reliable. In cases where the valueswere questionable or incomplete, to develop the 1972 ratio for anindustry, we scaled up its current pollutant-to-output ratio by afactor equal to the average change (from 1972 to 1995) inpollutant-to-output ratios from other industries. Current estimatesof industrial output were combined with the estimates of dischargesper dollar of output in 1972 to determine an initial measure ofindustry-specific effluent loadings for the without-CWA conditionsfor those industries.

A Benefits Assessment of Water Pollution Control Programs Since 1972:Part 1, The Benefits of Point Source Controls for Conventional Pollutants in Rivers and Streams
4-8
Because the CWA is presumed to have led to increased productioncosts and reduced output and growth in the industrial sectors of theeconomy (EPA, 1992b), changes in industrial output attributable tothe Act were estimated using a dynamic “general equilibrium”model of the entire U.S. economy (FEMA, 1987). We then assumedthat a percentage change in economic growth due to the CWAleads to an equal (and opposite) percentage change in pollutantloadings. For example, if it is determined that CWA requirementsresulted in a 5 percent decrease in the annual economic output fora particular sector relative to what the output would have beenotherwise, then PS loads for each industry in that sector wereincreased by 5 percent when modeling the without-CWA scenario. It is important to note, however, that changes in economic growthestimated using the general equilibrium model are quite small andhave virtually no effect on the NWPCAM results.
Combined Sewer Overflows and Nonpoint Sources
Changes in loadings from CSOs are excluded from the without-CWA scenario because EPA programs designed to control pollutantloadings from these sources are currently being implemented. For aprospective analysis of the expected benefits of EPA’s Urban WetWeather Management Program, see Research Triangle Institute(1997a).
NPS loadings are also assumed to remain at mid-1990s levels underthe without-CWA scenario because we lack data on theeffectiveness of NPS controls.
4.3 WATER QUALITY
Water quality levels for BOD TSS, DO, and FC were estimated forall stream segments in RF1 using the NWPCAM and pollutantloadings estimates for the with-CWA and without-CWA conditions. These water pollutant levels were then related to beneficial use forrecreation activities (boating, fishing, swimming) using an approachdeveloped by Vaughn for Resources for the Future (Mitchell andCarson, 1986). His approach involves choosing a maximumpollutant level for BOD, TSS, DO, and FC that corresponds toboatable, fishable, and swimmable waters. Vaughn’s water qualityladder includes BOD, turbidity, DO, pH, and FC. TSS is used inthis study as a surrogate for turbidity. The omission in our model of

Section 4 — Impact of the Clean Water Act on Use Support of Water Resources
4-9
pH, nutrients, and other water quality variables suggests that ourmodel overestimates the number of river and stream miles in abeneficial use category to the extent that these excluded parameterswould further degrade attainment status.
The water quality ladder values for each beneficial use is providedin Table 4-4. Each stream segment in the NWPCAM is assigned toa beneficial use category based on the requirement that thesegment must have water quality that meets all four of thecorresponding water quality criteria. A water resource that fails tomeet the boating criteria is classified as a “nonsupport” resource.
4.3.1 Water Quality Conditions Under Alternative PointSource Control Scenarios
The estimated national distribution of the 632,552 river and streammiles in RF1 across the beneficial use categories in the mid-1990sis shown in Tables 4-5 and 4-6 for three separate PS controlscenarios:
1. a with-CWA scenario,
2. a without-CWA scenario, and
3. a zero PS discharge scenario.
It is important to note that, in each case, the miles in theswimmable category are a subset of the fishable and boatablemiles, because a portion of the miles that are suitable for fishing arealso suitable for swimming. Similarly, the fishable miles are asubset of the boatable miles. In other words, these three
Table 4-4. RFF Water Quality Ladder Values
BeneficialUse
BOD(mg/L)
TotalSuspended
Solids(mg/L)
DissolvedOxygen
(%saturated)
Fecal Coliforms(MPN/100 mL)
Swimming 1.5 10 0.83 200
Fishing 2.4 50 0.64 1,000
Boating 4.0 100 0.45 2,000

A Benefits Assessment of Water Pollution Control Programs Since 1972:Part 1, The Benefits of Point Source Controls for Conventional Pollutants in Rivers and Streams
4-10
categories—boatable, fishable, and swimmable—are not mutuallyexclusive. Therefore, adding miles across the three supportcategories is not appropriate and would result in double-countingbecause some river and stream miles support more than one use.
Estimates for the with-CWA and without-CWA scenarios werebased on the loadings data described in Sections 3.2.1 and 3.2.2. The third scenario was estimated based on the assumption that allloadings of conventional pollutants from PSs were equal to zero. Because this zero PS discharge scenario represents the maximumachievable control of PSs, it serves as a useful point of reference forevaluating the with-CWA (i.e., current control) scenario. It
Table 4-5. Maximum Achievable Increases in Recreational UseSupport Through Point Source Controls
Number of U.S. River and Stream Miles in Each UseSupport Category
Highest UseSupported
Without-CWAConditions
Zero PSDischarge
Conditions
MaximumAchievable
Change Swimmable 222,120 255,475 33,355
Fishable 399,999 442,753 42,754
Boatable 454,038 490,848 36,810
Nonsupport 178,514 141,704 –36,810
Table 4-6. Rivers and Streams (632,552 miles) SupportingRecreational Uses: Comparison of With-CWA and Without-CWAConditions in the Mid-1990s
Highest UseSupported
Without-CWA
Conditions(miles)
With-CWAConditions
(miles)
Increase in Use Support
Miles
Percent ofMaximumIncreasea
Swimmable 222,120 238,627 16,507 49.5%
Fishable 399,999 424,712 24,713 57.8%
Boatable 454,038 475,894 21,856 59.4%
Nonsupport 178,514 156,658 –21,856 59.4%
a Maximum defined by difference between without-CWA scenario andzero PS discharge scenario.

Section 4 — Impact of the Clean Water Act on Use Support of Water Resources
4-11
highlights the fact that, even if all PS loadings were reduced tozero, a sizable portion of U.S. rivers and streams would experiencelittle to no improvement (relative to the without-CWA scenario) intheir ability to support specific recreational uses.
According to the NWPCAM, going from the without-CWA scenarioto the zero PS discharge scenario, only a small percentage (roughly10 percent) of the 632,552 miles of rivers and streams wouldachieve higher recreational uses. This occurs for the followingreasons. First, only 288,034 of the 632,552 miles are downstreamof PSs and, thus, potentially affected by PS controls. Second, ofthese remaining miles, 91,353 would achieve swimmable status,even without the CWA controls. This leaves 196,681 potentiallyimprovable miles. Third, because the remaining miles are affectedto differing degrees by NPSs, a large portion of them would notsupport higher recreational uses even if upstream PSs wereeliminated. Their recreational uses are, in effect, limited byupstream NPSs. Deducting these miles leaves at most 62,815 milesthat could achieve higher recreational uses through PS controls.
For both the without-CWA and zero PS discharge scenarios,Table 4-5 shows the estimated number of river and stream miles ineach recreational use support category. For each use supportcategory, it also shows the maximum achievable increase insupport miles through PS controls. For the swimmable, fishable,and boatable categories, the maximum increases are 33,355,42,754, and 36,810 miles, respectively.
Table 4-6 displays the estimated number of river and stream milesin each recreational use support category for the with-CWA and thewithout-CWA scenarios. Estimated improvements in recreationaluse support include 16,507 more miles supporting swimming,24,713 more miles supporting fishing, and 21,865 more milessupporting boating. Although these changes represent relativelysmall percentages of the nationwide number of river and streammiles, they do represent sizable increases relative to the maximumimprovements achievable through PS controls (as shown in Table4-5). An estimated 50 percent of all the miles that could potentiallyimprove to swimmable status through PS controls do so as a resultof CWA controls. The numbers achieving fishable and boatablestatus as a result of CWA controls are closer to 60 percent of theirrespective maxima.

A Benefits Assessment of Water Pollution Control Programs Since 1972:Part 1, The Benefits of Point Source Controls for Conventional Pollutants in Rivers and Streams
4-12
We note again that, even without the CWA, water quality may haveimproved because of the existence or establishment of water qualityprograms at the State or local level. Thus, the water qualityestimates for the without-CWA scenario may understate the numberof miles in each recreational use support category. This wouldimply that the estimated increases in use-support that are attributedto the CWA (Table 4-6) and to complete PS controls (Table 4-5) areoverstated.
Because many of the services received from water resourcesdepend on their proximity to people, Table 4-6 also reportsestimates of water quality changes specifically for inland rivers andstreams that pass through “populated places” (as defined by theCensus Bureau [U.S. Department of Commerce, 1991]). NWPCAMincludes 14,490 such places, accounting for almost two-thirds ofthe U.S. population and over 35 percent of all RF1 rivers andstream miles. As shown in Table 4-7, these areas also account forover two-thirds of the river and stream miles that achieve higherrecreational use categories as a result of the CWA. For example,12,527 (76 percent) of the 16,507 miles that are estimated toachieve swimmable status as a result of the CWA are in populatedplaces. This indicates that controls initiated under the Act have, ona proportional basis, had more of an impact on water quality inpopulated places than in the nation as a whole. PSs tend to belocated near more populated places; therefore, PSs have aparticularly large effect on water quality in these areas.
Table 4-7. Rivers and Streams in Populated Places (222,789miles): Comparison of With-CWA and Without-CWA Conditions inthe Mid-1990s
Highest UseSupported
Without-CWAConditions
(miles)
With-CWAConditions
(miles)
Increase in UseSupport(miles)
Swimmable 109,003 121,530 12,527
Fishable 161,861 178,588 16,727
Boatable 175,666 190,319 14,653
Nonsupport 47,123 32,470 –14,653

Section 4 — Impact of the Clean Water Act on Use Support of Water Resources
4-13
It is important to emphasize that these estimates of water qualityimprovements are not directly comparable to those in the States’305(b) reports. These estimates cover only a subset of the Nation’swater resources (rivers and streams in RF1), whereas the 305(b)reports cover all resources. Further, under Section 305(b) theauthorities designate a use for the water resource, then evaluate itsability to support that use. Thus, under 305(b) the use supportassessment is relative to the designated use, and the examination isselective (i.e., not all resources are evaluated and the selectedresources are purposefully, rather than randomly, sampled todetermine their use support). In contrast, our evaluation is anabsolute measure of water quality, and the coverage of RF1resources using the NWPCAM is complete. For these reasons, thisanalysis and the 305(b) reports should not be directly compared.

5-1
Valuation of Selected
5 In-Place andExistence Benefits
In 1983 Robert Mitchell and Richard Carson conducted a study forEPA of the national benefits of freshwater pollution control usingthe contingent valuation method (CVM) (Mitchell and Carson,1986; Carson and Mitchell, 1993). Their results are applied herewith the NWPCAM water quality simulations to estimate the valueof the nationwide improvements in selected water resource servicesas a result of the CWA. The methodology employed generallyfollows that of Clark et al. (1995).
Although the benefits estimates provided in this report are the mostcomprehensive yet developed, they are incomplete. In particular,toxic and nonconventional pollutants are not covered by thisanalysis. Further, the water resources incorporated in theNWPCAM do not include most estuaries, the ocean shoreline, theGreat Lakes, and other lakes. Only rivers and streams arerepresented and not all of them, but the most important ones areincluded. Finally, the services captured by the Mitchell and Carsonstudy cover only some of the in-place services of freshwaterresources. Existence services are also included, but no withdrawalservices are addressed.
Most studies in the economics literature that have examined thevalue of water resources have evaluated the value of water, per se
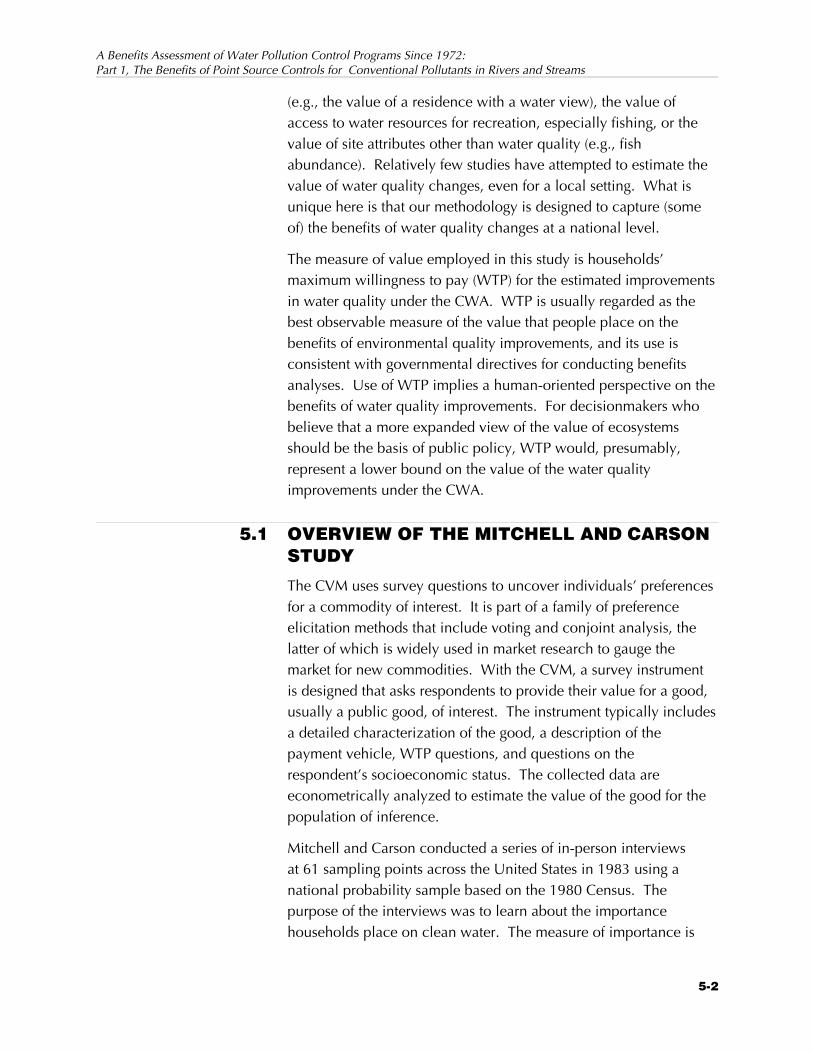
A Benefits Assessment of Water Pollution Control Programs Since 1972:Part 1, The Benefits of Point Source Controls for Conventional Pollutants in Rivers and Streams
5-2
(e.g., the value of a residence with a water view), the value ofaccess to water resources for recreation, especially fishing, or thevalue of site attributes other than water quality (e.g., fishabundance). Relatively few studies have attempted to estimate thevalue of water quality changes, even for a local setting. What isunique here is that our methodology is designed to capture (someof) the benefits of water quality changes at a national level.
The measure of value employed in this study is households’maximum willingness to pay (WTP) for the estimated improvementsin water quality under the CWA. WTP is usually regarded as thebest observable measure of the value that people place on thebenefits of environmental quality improvements, and its use isconsistent with governmental directives for conducting benefitsanalyses. Use of WTP implies a human-oriented perspective on thebenefits of water quality improvements. For decisionmakers whobelieve that a more expanded view of the value of ecosystemsshould be the basis of public policy, WTP would, presumably,represent a lower bound on the value of the water qualityimprovements under the CWA.
5.1 OVERVIEW OF THE MITCHELL AND CARSONSTUDY
The CVM uses survey questions to uncover individuals’ preferencesfor a commodity of interest. It is part of a family of preferenceelicitation methods that include voting and conjoint analysis, thelatter of which is widely used in market research to gauge themarket for new commodities. With the CVM, a survey instrumentis designed that asks respondents to provide their value for a good,usually a public good, of interest. The instrument typically includesa detailed characterization of the good, a description of thepayment vehicle, WTP questions, and questions on therespondent’s socioeconomic status. The collected data areeconometrically analyzed to estimate the value of the good for thepopulation of inference.
Mitchell and Carson conducted a series of in-person interviewsat 61 sampling points across the United States in 1983 using anational probability sample based on the 1980 Census. Thepurpose of the interviews was to learn about the importancehouseholds place on clean water. The measure of importance is

Section 5 — Valuation of Selected In-Place and Existence Benefits
1This water quality ladder was originally developed by W.J. Vaughan forResources for the Future for a pilot study conducted by Mitchell andCarson in 1980. The pilot study was a precursor to the study outlinedin this section.
2Nonboatable water was further described as having “oil, raw sewage, andother things like trash in it; it has no plant or animal life, smells bad,and contact with it is dangerous to human health.” Boatable water wasdescribed as “[not harming] you if you happened to fall into it for ashort time while boating or sailing.”
5-3
the sacrifice they would be willing to make in dollars to achievespecified levels of water quality, that is, their WTP.
The interviews elicited responses on a number of topics related toenvironmental protection, water pollution, and water-basedrecreational activities. The basic outline of the survey instrumentcovered the following topics:
• Water Resources: The water resources covered by thesurvey were confined to freshwater lakes, rivers, andstreams throughout the Nation. Subsequent discussionswith one of the authors indicate that the Great Lakes arenot part of the water resources that respondentsincluded in their values (Carson, 1997).
• Water Resources Services: Withdrawal services,including drinking water, were not part of the servicesrespondents were asked to value. Only in-place andexistence services were included.
• Valuation Component: Respondents were presentedwith a water quality ladder1 (Figure 5-1) depicting levelsof water quality ranging from below “boatable” to“drinkable” and asked to state how much they would bewilling to pay to maintain or achieve various levels ofminimum water quality throughout the country.2 Thus,there is a close correspondence between the Mitchelland Carson economic value study and our assessment ofrealized water quality improvements.

A Benefits Assessment of Water Pollution Control Programs Since 1972:Part 1, The Benefits of Point Source Controls for Conventional Pollutants in Rivers and Streams
5-4
10
9
8
7
6
5
4
3
2
1
0
Worst PossibleWater Quality
Best PossibleWater Quality
SWIMMABLE:Safe for swimming
FISHABLE:Game fish like bass can live in it
BOATABLE:Okay for boating
Figure 5-1. Resources for the Future Water Quality Ladder
• Elicitation Procedure: A payment card was used onwhich respondents were shown amounts averagehouseholds were then currently paying in taxes andhigher prices for selected publicly provided goods(e.g., national defense) and were asked to state theirWTP for the water quality change.
• Payment Vehicle: Respondents were told that the waterquality changes would be paid for in higher productprices and higher taxes.
The estimated WTP values from the Mitchell and Carson study afteradjusting for nonresponse effects are provided in Table 5-1. Thesevalues represent their “best estimates” of the mean annualhousehold values in 1983 for achieving the incremental waterquality goals. Analysis of the WTP bids by Mitchell and Carsonindicated that WTP increased proportionately with respondents’

Section 5 — Valuation of Selected In-Place and Existence Benefits
5-5
household income—a 1 percent increase in household incomeincreased its expected WTP by approximately 1 percent. Based ondata indicating that per capita disposable income increased by26.5 percent from 1983 to 1997, and that consumer pricesincreased by 61 percent over the same period, Mitchell andCarson’s best estimates of WTP have been adjusted in Table 5-1 to1997 values.
5.2 APPLICATION OF THE MITCHELL ANDCARSON ESTIMATES
The pollution control initiatives taken under the CWA havechanged the distribution of water quality throughout the Nation’swater resources from what it would have been without the Act. Asset out in the previous chapter, current water quality modelinglimitations have forced us to focus only on the 633,000 miles ofrivers and streams that make up RF1 and on selected conventionalpollutants and pollutant sources. Applying the Mitchell and Carsonestimates to value the estimated water quality improvementsrequires consideration of how households’ WTP is likely to vary(1) with the characteristics of the affected water resources and(2) with the extent of the water quality changes.
Table 5-1. Individual Household WTP Values for Water Quality Improvements
Mean Annual HouseholdValues, 1983a
Mean Modified HouseholdValues, 1996b
Total Incremental Total Incremental
Swimmable: WTP to raise allsubswimmable water quality toswimmable
$241 $78 $491 $159
Fishable: WTP to raise allsubfishable water quality tofishable
$163 $70 $332 $143
Boatable: WTP to maintainboatable water quality
$93 $93 $189 $189
aMitchell, R.C., and R.T. Carson. 1986. The Use of Contingent Valuation Data for Benefit/Cost Analysis in WaterPollution Control. CR-810224-02. Prepared for U.S. Environmental Protection Agency, Office of Policy Planning andEvaluation. Washington, DC.
bScaled Mitchell and Carson values based on real income growth and price changes over 1983 to 1996 period.

A Benefits Assessment of Water Pollution Control Programs Since 1972:Part 1, The Benefits of Point Source Controls for Conventional Pollutants in Rivers and Streams
5-6
Following Smith (1996), we would expect that arguably differentwater resources should be valued differently by people. Forexample, individuals are likely to place more value on waterresources that are nearer to them. This is simply because theyprovide lower cost recreation opportunities, more encounterswhere the aesthetic services of the resource can be enjoyed, and soforth. Other characteristics of the resources that affect the qualityof their withdrawal and in-place services may also be expected toinfluence households’ WTP for water quality changes.
One would also expect that the scope (or amount) of the waterquality changes due to the Act would be directly associated withpeople’s WTP for those changes. For example, if ten miles of ariver changed from boatable to fishable water quality, that changeshould be more highly valued than if the change only affected onemile. The Mitchell and Carson results provide only minimalsupport for the hypothesis that scope matters. They report thatmany respondents to their survey indicated that their WTP forpartial improvements was not much lower than for completeattainment of the stated water quality goals.
In their survey, Mitchell and Carson asked respondents to apportioneach of their expressed WTP values between achieving the waterquality goals in their own State and achieving those goals in theNation as a whole. On average, respondents allocated 67 percentof their values to achieving in-state water quality goals and theremainder to the Nation as a whole. Mitchell and Carson arguethat for valuing local water quality changes, 67 percent of the totalreported value is a reasonable upper bound for the local share ofWTP. Their findings support the view that proximity does matter asdo, almost by definition, the results of travel cost studies ofrecreation behavior. Based on the Mitchell and Carson results, wetreat local and nonlocal water resources as different commodities.
5.2.1 Local/In-Place Benefits
We confined our application of local values to “populated places”with an RF1 resource. Populated places are specified in the 1990Census Bureau database (U.S. Department of Commerce, 1991).
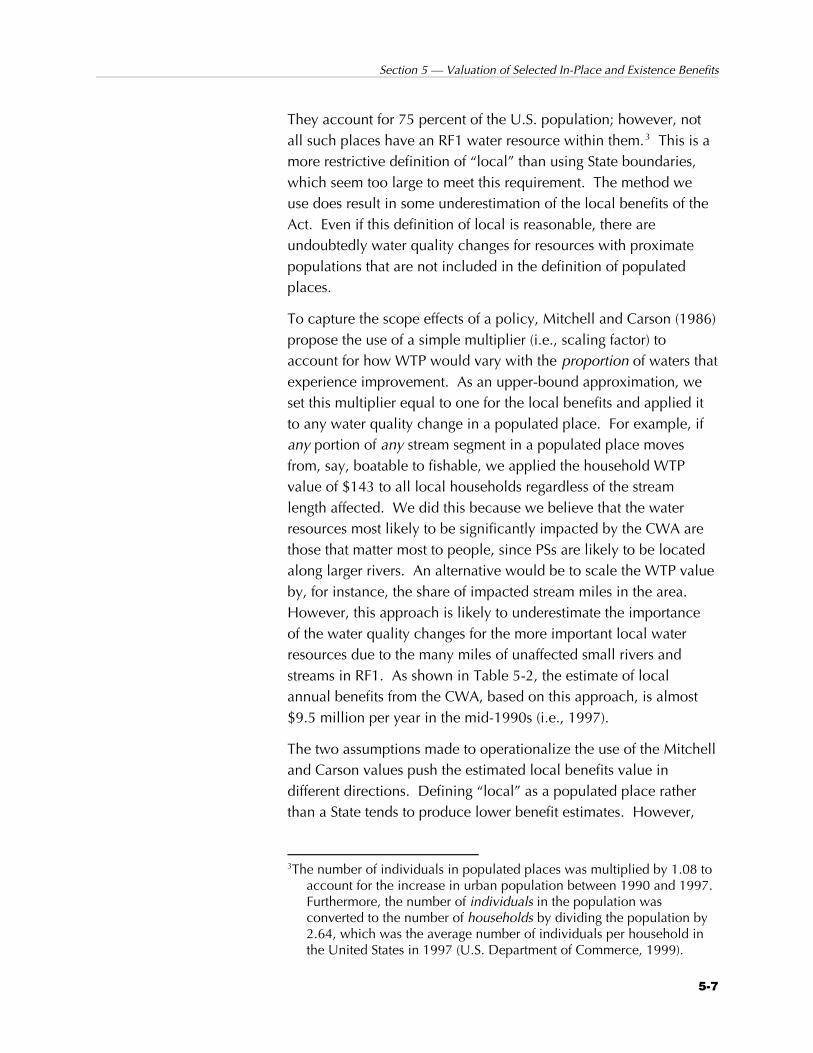
Section 5 — Valuation of Selected In-Place and Existence Benefits
3The number of individuals in populated places was multiplied by 1.08 toaccount for the increase in urban population between 1990 and 1997.Furthermore, the number of individuals in the population wasconverted to the number of households by dividing the population by2.64, which was the average number of individuals per household inthe United States in 1997 (U.S. Department of Commerce, 1999).
5-7
They account for 75 percent of the U.S. population; however, notall such places have an RF1 water resource within them.3 This is amore restrictive definition of “local” than using State boundaries,which seem too large to meet this requirement. The method weuse does result in some underestimation of the local benefits of theAct. Even if this definition of local is reasonable, there areundoubtedly water quality changes for resources with proximatepopulations that are not included in the definition of populatedplaces.
To capture the scope effects of a policy, Mitchell and Carson (1986)propose the use of a simple multiplier (i.e., scaling factor) toaccount for how WTP would vary with the proportion of waters thatexperience improvement. As an upper-bound approximation, weset this multiplier equal to one for the local benefits and applied itto any water quality change in a populated place. For example, ifany portion of any stream segment in a populated place movesfrom, say, boatable to fishable, we applied the household WTPvalue of $143 to all local households regardless of the streamlength affected. We did this because we believe that the waterresources most likely to be significantly impacted by the CWA arethose that matter most to people, since PSs are likely to be locatedalong larger rivers. An alternative would be to scale the WTP valueby, for instance, the share of impacted stream miles in the area. However, this approach is likely to underestimate the importanceof the water quality changes for the more important local waterresources due to the many miles of unaffected small rivers andstreams in RF1. As shown in Table 5-2, the estimate of localannual benefits from the CWA, based on this approach, is almost$9.5 million per year in the mid-1990s (i.e., 1997).
The two assumptions made to operationalize the use of the Mitchelland Carson values push the estimated local benefits value indifferent directions. Defining “local” as a populated place ratherthan a State tends to produce lower benefit estimates. However,

A Benefits Assessment of Water Pollution Control Programs Since 1972:Part 1, The Benefits of Point Source Controls for Conventional Pollutants in Rivers and Streams
5-8
applying the full WTP value to the entire population when there isany water quality change in a place rather than using a fractionalestimate is likely to overestimate the population’s WTP for partialwater quality changes.
5.2.2 Nonlocal/Existence Benefits
In contrast to local benefits, which we treat as being derivedprimarily from the in-place services of proximate water resources,nonlocal benefits are derived primarily from existence services. This is because the geographical area of nonlocal is, essentially, therest of the Nation. Furthermore, we do assume there is a scopeeffect for nonlocal water quality changes. To distinguish nonlocalbenefits, for each category of beneficial use, we deducted thefraction of WTP that is assumed to be for local water qualitychanges only (67 percent). This leaves 33 percent (of total WTP toattain each use target) for nonlocal water quality changes. Thisvalue was multiplied by the fraction of previously impaired nationalwaters (in each use category) that attain the beneficial use as aresult of the CWA. To measure aggregate national WTP fornonlocal water quality improvements, we then multiplied this valueby the total number of households in the United States.
This approach probably results in an underestimate of the existencebenefits of the CWA since each river is only represented by itslength in the calculation. If water quality in some rivers mattersmore than in others, the estimate is likely to undervalue existencebenefits because the larger rivers are most affected by the CWA.
5.2.3 Total Estimated Benefits
Combining the local and nonlocal values, the annual benefits ofwater quality improvements attributable to the CWA are about$11 billion annually, an average of about $109 per household. Asshown in Table 5-2, local benefits make up the largest componentof the benefits. Respondents to the Mitchell and Carson survey didprovide a higher WTP for local than nonlocal water qualitychanges, two to one. Also, we have used a unitary multiplier forlocal water quality changes and a fractional multiplier for thenonlocal changes to account for scope effects. As shown inTable 5-2, the estimate of annual existence benefits from the CWAbased on this approach is $1.5 billion per year in the mid-1990s.

Section 5 — Valuation of Selected In-Place and Existence Benefits
5-9
It is important to emphasize again that our estimate of the benefit ofthe CWA is an underestimate because the coverage of this analysisis not comprehensive. The estimated benefits cover only therecreation, aesthetic, and existence benefits of surface water qualitychanges. While these water resource services are most likely to beenhanced by the CWA, other in-place and withdrawal services mayalso be enhanced. Further, these values only cover rivers andstreams. The quality of estuarine and marine water, lakes, and theGreat Lakes has also improved as a result of the CWA. Thesewaters are not included in this analysis because of current modelinglimitations. Finally, only a subset of water pollutants regulatedunder the CWA is included in this analysis. Future Agency effortsare designed to incorporate the omitted sources, pollutants,resources, and services. Once all of these factors are accountedfor, the estimated value should increase and provide a moreaccurate assessment of the total benefits of the CWA.
Table 5-2. Estimated Annual Value of Selected In-Place andExistence Benefits of the CWA, Mid-1990s (million 1997$/yr)
UseAttainment
Local/In-PlaceBenefits
Nonlocal/ExistenceBenefits
TotalBenefits
Boatable $4,192 $784 $4,977
Fishable $3,043 $512 $3,556
Swimmable $2,356 $216 $2,572
Total $9,592 $1,513 $11,105
1This section, except Section 6.6, is an RTI abridgement of larger studiesby Tetra Tech, Inc. (1997), and Industrial Economics, Inc.
6-1
Case Study: The
6 Willamette RiverBasin1
This case study of the Willamette River Basin provides anopportunity to examine the benefits of the CWA at a regional level. This perspective provides greater detail than is possible with anational study. Following the taxonomy developed by the GeneralAccounting Office (GAO, 1990), this is an illustrative case study. Itis designed to describe what happened to water quality in Oregon’sWillamette River with the CWA controls. The Willamette Riverwas selected for analysis because its water quality has improvedsignificantly since the 1960s. Thus, this site was selected becauseof the special interest this river provides. This selection approachprecludes any generalizations of the findings from this site thatwould be possible with, for example, a probability sample of casestudy sites. However, the Willamette River case study does providea broader characterization of the benefits of water quality than ispossible at the national level and an illustration of the gains insocial welfare that are possible with pollution controls.
The approach to this benefits analysis uses an activity daymethodology. With this approach, an estimate of the difference inthe level of recreational activities with and without the water

A Benefits Assessment of Water Pollution Control Programs Since 1972:Part 1, The Benefits of Point Source Controls for Conventional Pollutants in Rivers and Streams
2 The study region encompasses Columbia, Multanomah, Yamhill,Clackamas, Polk, Marion, Benton, Linn, Lane, and Washingtoncounties in Oregon.
6-2
quality improvements is first developed. Then the value of theactivity differences is estimated by multiplying the unit value foreach activity by the number of units. The unit values are drawnfrom the literature. Activity rates were developed for the latest yearfor which data are available. This is the early 1990s for someactivities, late 1980s for others. Thus, these results should beconsidered reflective of about 1990 conditions. As is the case forthe national-level estimates of CWA benefits, these case studyestimates are also incomplete. They only focus on the recreationbenefits of the Act, although other water resources services arequalitatively evaluated.
To compare the methodology used to develop the nationalestimates with the activity day approach, we also applied theNWPCAM to the Willamette River.
6.1 PROFILE OF THE WILLAMETTE RIVER BASIN
The Willamette River’s drainage basin spans approximately11,500 mi2 in northwest Oregon between the coast (west) andCascade (east) mountain ranges (Figure 6-1).2 The main stem of theriver meanders approximately 187 miles north through an alluvialvalley to the Columbia River. Elevations range from less than 10 ft.at the mouth near the Columbia River to 450 ft. in the valley nearEugene to greater than 10,000 ft. in the headwaters of the Cascaderange. The Willamette is the tenth largest river in the continentalU.S. in terms of total discharge; the discharge per unit area is thehighest of large U.S. rivers (Sedell and Frogatt, 1984).
The population of the Willamette River basin has steadily increasedsince World War II, and Oregon’s three largest cities—Salem,Portland, and Eugene—with a total population of 1.8 million(nearly 70 percent of the State’s population) are located within thebasin. The wood products and agricultural economy of theWillamette basin accounts for about 70 percent of the totalindustrial production for Oregon. Industrial production, like thepopulation of the basin, has steadily increased over the past severaldecades.

Section 6 — Case Study: The Willamette River Basin
6-3
Figure 6-1. Willamette River Basin Water Quality Study Area and the Four RiverRegions
Source: STORET.
A Benefits Assessment of Water Pollution Control Programs Since 1972:Part 1, The Benefits of Point Source Controls for Conventional Pollutants in Rivers and Streams
3Population equivalents are the calculated population that would normallycontribute the same amount of BOD per day. A common base is one-sixth of a pound of BOD per person per day (ODEQ, 1970).
6-4
The river has played a key historical role in the agricultural andindustrial development of the valley. The Willamette River, amajor source for the basin’s municipal (20 cities) and industrial(600 facilities) water supply, also provides irrigation water for therich fruit and vegetable farms of the valley. The river and itstributaries have long been recognized as important spawninggrounds for anadromous fish and have contributed markedly to thecommercial and recreational fishery of the Columbia River, as wellas offshore catch. Other major uses of the Willamette River includecommercial navigation; hydroelectric power production; andwater-based recreational activities, including aesthetic enjoymentof the Greenway Trail, which runs along the length of the river. Asthe region has grown, the river has also been used for municipaland industrial waste disposal.
6.2 POLLUTANT LOADINGS AND WATERQUALITY
The primary source of pollution load to the Willamette River hasalways been the wastewater discharge from the pulp and paperindustry. Beginning with the first mills in the late 1800s, untreatedwastewater was discharged directly to the river. In 1948, the foursulphite mills located on the main stem discharged in excess of2,500,000 population equivalents.3 The subsequent construction ofadditional mills increased this amount to 4,490,000 populationequivalents (Gleeson, 1972). By 1965, however, the practice ofponding, barging, or process changes reduced pulp and paper millwastewater discharge to the river by 76 percent for the low waterperiod. By 1969, all mills had installed primary treatment, and by1972, all mills were required to have installed secondary treatmentand chemical recovery facilities. According to the OregonDepartment of Environmental Quality (ODEQ), the additionalchanges required by 1972 were expected to result in an overallreduction in BOD of over 92 percent (ODEQ, 1970; Gleeson,1972).
Water quality studies conducted on the Willamette River in theearly 1920s indicated that the untreated wastewaters discharged by

Section 6 — Case Study: The Willamette River Basin
6-5
municipal and industrial facilities had created a condition of severeand extensive pollution (Gleeson, 1972). In 1927, the Portland CityClub described the river as “ugly and filthy” and conditions of theriver were “intolerable” to the point that construction workersrefused to work on riverside projects (Gleeson, 1972; CEQ, 1973). A 1934 water quality survey indicated that the Willamette Riverthrough the Portland Harbor was in very poor condition and devoidof all DO in a stretch of several miles (Gleeson, 1972). Studyresults published from 1936 through 1938 concluded that thereexisted “undisputed evidence that portions of the Willamette Riverhad become so polluted with municipal sewage and industrialwastes that these waters were a menace to health, destructive tofish life, and unfit for certain other beneficial uses” (Westgarth andNorthcraft, 1964).
6.2.1 Oxygen Depletion
Severe summer oxygen depletion has been the key historical waterquality problem in the Willamette River. Over the past 20 years,however, summer oxygen levels have increased significantly as aresult of the implementation of basinwide secondary treatment formunicipal and industrial PSs and low flow augmentation fromreservoir releases. A comparison of results from the earliest waterquality survey conducted in 1929 to those conducted during theearly 1990s for the Willamette River Basin Water Quality Study(WRBWQS) illustrates the dramatic improvement (ODEQ, 1995). The summer oxygen levels in the river are clearly shown in thedistribution of oxygen from Salem to Portland Harbor and the long-term historical trend for oxygen in the lower Willamette River at theSP&S Bridge near Portland Harbor (Figure 6-2).
A 1964 report on water quality documented the impact pulp andpaper mill effluents had on water quality. The report projected thatby 1966 pulp and paper mills would contribute nearly 83 percentof the pollution load to the river (Oregon State Sanitary Authority,1964).
6.2.2 Nutrients
In addition to the demands placed on the river’s oxygen supply, thedischarge of spent sulphite liquor from pulp mills provided anexcess of nutrients, resulting in the formation of bacterial slimes.

A Benefits Assessment of Water Pollution Control Programs Since 1972:Part 1, The Benefits of Point Source Controls for Conventional Pollutants in Rivers and Streams
6-6
Figure 6-2. Long-Term Trends of Summer DO in the WillametteRiver at the SP&S Bridge, Portland Harbor: 1950-1995
Source: Data from STORET.
These slimes either formed on stationary attachment surfaces andperiodically sloughed off and floated downstream to eventuallysettle and decay, or they formed flocs around suspended organicparticles and settled to form sludge deposits in areas where rivervelocities were low.
Raw wood fiber, ground wood debris, chips, and waste wood fibersassociated with bacterial slime had long been the cause ofconsiderable public complaints. These items would collect anddecay in the bottom sediments, and in late summer, theirassociated gases buoyed large, unsightly, foul-smelling sludge raftsto the surface (Oregon State Sanitary Authority, 1964). Intenseareas of gasification were evident in the river long before and afterthe sludge rafts rose and fell. The 1964 report also reported thatcoliform bacterial contamination of the river was five to 100 timesthe limit that was considered safe for water-based recreation, such

Section 6 — Case Study: The Willamette River Basin
6-7
as swimming and water skiing (Oregon State Sanitary Authority,1964).
Results from recent water quality monitoring indicate that thecurrent status of the river is visibly much improved. Coliform levelshave decreased to levels that are safe for swimming and otherprimary contact recreational activities. With only two exceedancesof the State standard for DO (90 percent saturation) and noexceedances of the State action level of 15 µg/L for chlorophyll a,salmon are once again able to migrate up the Willamette River totheir spawning sites (ODEQ, 1995).
6.2.3 Pollutants from Nonpoint Sources
NPSs of pollution represent one potential threat to the health of theWillamette River. The flow of storm water runoff over lands usedfor agricultural, silvicultural, and industrial purposes can transportsuspended solids, nutrients, animal wastes, irrigation water, andtoxic contaminants to the river. The WRBWQS evaluatedapplicable land use loading coefficients for the basin based onavailable water quality data, tabulated summaries of NPS yields,and modeling efforts in smaller watersheds. The results of thisanalysis indicated that the greatest threats to water quality resultingfrom NPS runoff are the potentially high levels of suspendedparticles and agricultural nutrients coming from croplands.
Current estimates of NPS pollution loads for the subbasins of theWillamette River indicate that the sediment and nutrient loads areproduced primarily in agricultural areas located in the middleportions of the basin (ODEQ, 1995). However, the lack ofhistorical data for NPS loadings to the river precludes theevaluation of loadings trends over time.
6.2.4 Toxins
Much less information is known about the status and trends of toxiccontaminants in the river. Until the 1970s, water quality conditionswere primarily evaluated by measuring temperature, pH, TSS, DO,BOD, and bacterial concentrations. Almost no historical data areavailable on the status and trends of toxic contaminants in theWillamette River. In 1977, the USGS conducted a synoptic surveyof trace metals in bottom sediments of the Willamette River. Thereport of the survey results concludes that the river was a clean

A Benefits Assessment of Water Pollution Control Programs Since 1972:Part 1, The Benefits of Point Source Controls for Conventional Pollutants in Rivers and Streams
6-8
environment with the exception of a moderate enrichment of zincand slight enrichment of copper and lead (Rickert et al., 1977). Thezinc enrichment was thought to be from using zinc hydrosulfite as abrightening agent in three ground-wood pulp and paper mills. Upon learning of the results, ODEQ ordered the mills to ceaseusing zinc hydrosulfite by July 1977. Lead enrichment appeared tobe directly related to urban runoff (possibly from automobileexhaust) and no source of copper could be identified. The studyconcluded that no metals were accumulated in the WillametteRiver sediments at concentrations that might represent animmediate ecological threat; however, further investigations wouldbe required to determine how much lead is annually reaching theriver (Rickert et al., 1977).
More recent investigations indicate, however, that toxiccontamination of the Willamette River does exist. Oregon’s 1990water quality status assessment report classified the river as “waterquality limited” as a result of seven contaminants exceeding eitherEPA draft sediment guidelines (arsenic, chromium, lead, zinc, andDDT); State water quality standards (arsenic); or both(2,3,7,8-TCDD) (ODEQ, 1990). Other recent surveys have foundlevels of toxic chemicals in water, sediments, and fish tissue atvarious locations in the river basin (ODEQ, 1995). Surveysconducted by ODEQ in 1994 indicated that levels of metals(arsenic, barium, cadmium, chromium, copper, lead, mercury,nickel, silver, and zinc); pesticides (chlordane and DDT); otherorganic chemicals (carbon tetrachloride, creosote,dichloroethylene, dioxin, polynuclear aromatic hydrocarbons,PCBs, phenol, pentachlorophenol, phenanthrene, phthalates,trichloroethane, trichloroethylene, and trichlorophenol); andbacteria exceed regulatory or guidance criteria for the protection ofaquatic life and human health in at least one location of the river.
In the early 1990s, given the public concern over the continueddischarge of dioxin by pulp and paper mills, and in anticipation ofthe revision of the industry’s effluent guidelines, the majority ofmills began converting from conventional process technologies thatemployed elemental chlorine bleaching (known to produce dioxins)to process technologies that eliminated the use of elementalchlorine (e.g., substituting chlorine dioxide for elemental chlorineor oxygen delignification), in turn eliminating the discharge of

Section 6 — Case Study: The Willamette River Basin
6-9
detectable levels of dioxins. In 1995, effluent samples from millsemploying the upgraded process technologies indicated that dioxinconcentrations in the effluents are now below detectableconcentrations (EPA, 1996).
6.3 LEGISLATIVE AND REGULATORY HISTORYOF WATER POLLUTION CONTROL
After over a decade of public concern about the polluted conditionsof the Willamette River, the citizens of Oregon passed areferendum in 1938 setting water quality standards and establishingthe Oregon State Sanitary Authority. With the establishment of theSanitary Authority, the stated public policy of Oregon was torestore and maintain the natural purity of all public waters. As aresult of regulatory actions by the Sanitary Authority, allmunicipalities discharging into the Willamette implementedprimary treatment during the period 1949 to 1957, with all costsborne by the municipalities. Beginning in 1952, industrial wastedischarges from the pulp and paper mills were controlled byrequired lagoon diversions during summer months. In 1953, thenew Army Corps of Engineers dams began operation, resulting inaugmentation of the natural summer flow. Although not originallyplanned for water quality management, summer reservoir releaseshave become a significant factor in maintaining water quality andenabling salmon migration during the fall.
Although tremendous accomplishments had been made incontrolling water pollution in the Willamette basin, large increasesin industrial production and in the population served by municipalwastewater plants exceeded the assimilative capacity of the river. By 1960, the Sanitary Authority required that all municipalitiesdischarging to the Willamette River achieve a minimum ofsecondary treatment (85 percent removal of carbonaceous BOD). In 1964, the pulp and paper mills were directed to implementprimary treatment, with secondary treatment during the summermonths. In 1967, industrial secondary treatment was required on ayear-round basis. The Sanitary Authority had thus established aminimum policy of secondary treatment for all municipal andindustrial waste dischargers with the option of requiring tertiarytreatment if needed to maintain water quality. The State initiatedthe issuance of discharge permits for wastewater plants in 1968, 4

A Benefits Assessment of Water Pollution Control Programs Since 1972:Part 1, The Benefits of Point Source Controls for Conventional Pollutants in Rivers and Streams
6-10
years before the CWA of 1972 established the NPDES. The policyadopted in 1967 remains the current water pollution control policyof the State of Oregon for the Willamette River (ODEQ, 1970).
In response to the 1965 Federal Water Quality Act, Oregonestablished intrastate and interstate water quality standards in 1967that were among the first new State water quality standards to beapproved by the Federal government. The CWA of 1972 providedeven further authority for Oregon to issue discharge permits limitingthe pollutant loading of municipal and industrial facilities.
EPA established a policy of revising effluent guidelines as scientificadvances improved methodologies for analyzing water quality dataand for treating industrial wastewaters. From 1989 through 1993,EPA began a nationwide effort to sample the effluents and receivingwaters of pulp and paper mills. The initial results of this samplingindicate that pulp and paper mill effluents contain toxic chemicalcompounds, as well as conventional pollutants such as BOD andTSS. In response to this information, EPA began evaluating theenvironmental benefits of technology and water quality-basedcontrols applicable to the pulp and paper mill discharges. Based inpart on the results of this benefits analysis, in 1998 EPApromulgated revised effluent guidelines and standards for the pulpand paper industry.
6.4 BIOLOGICAL AND HABITAT INDICATORS OFWATER QUALITY
The first comprehensive study of the Willamette River biota wasconducted by Dimick and Merryfield (1945) in the summer of1944. Their study was specifically intended to assess the impact ofpollution on benthic invertebrates and fish in the river. Benthicorganisms and fish provide particularly good indicators of long-termtrends in water quality. Because they are generally sedentary andhave long life spans, benthic organisms can provide local indicatorsof water quality. This study was repeated in 1983 to assess thechanges that had occurred in the river since its cleanup began. In1987, Hughes and Gammon sampled the same sites that Dimickand Merryfield had sampled in 1944. ODEQ conducted anecological assessment that evaluated benthic communities, fishassemblages, skeletal deformities of juvenile fish, and the physicalhabitat.
Section 6 — Case Study: The Willamette River Basin
6-11
Dimick and Merryfield (1945) found very different biologicalconditions in different stretches of the river. Upstream of Salem,where pollutant sources to the river were few, they found anabundance of healthy fish and intolerant caddisfly, mayfly, andstonefly nymphs. Below Salem to Portland, where pollutantloadings to the river were greatest, they found few to no fish, deadfish on the banks of or in the river, and a total absence of stonefliesand mayflies. They further noted that the biomass of insect larvaedownstream of Salem was less than upstream, and that largemouthbass collected below Salem were generally smaller than normaland in poor physical condition. Both of these situations areindicative of poor water quality.
A comparison of recent data to that collected by Dimick andMerryfield indicates a vast improvement in the diversity andintegrity of the benthic communities found in the Willamette Riverbasin. In 1945, Dimick and Merryfield found a total absence ofintolerant benthic species between Salem and Portland, whereasbenthic data collected in 1994 indicated that 34 percent of the totaltaxa of benthic species collected consisted of intolerant species ofcaddisfly, mayfly, and stonefly (ODEQ, 1995). Although it isevident that there is still some impairment of the benthiccommunities at certain locations along the river (ODEQ, 1995), theconditions below Salem have recovered significantly as a result ofimplementing water quality controls.
Dimick and Merryfield conducted similar studies in 1983, and in1987, Hughes and Gammon replicated the 1944 study. While the1983 study showed some signs of a pollution-stressed river belowSalem, the differences between the findings of the studiesdemonstrated a marked improvement in water quality. WhereDimick and Merryfield had found only tolerant species associatedwith sluggish, warm water and muddy or sandy substrates, Hughesand Gammon found many intolerant species suited to fast moving,cold water, and rubble and gravel bottoms—an obvious indicationthat the conditions of the river had undergone a vast improvement.
The improvements in the fish communities of the Willamette Riverbetween 1944 and 1983 were not solely due to water qualityimprovements. Historically, the river provided important spawningand nursery grounds for salmon and steelhead, but dams built alongthe river prevented these fish from reaching their spawning

A Benefits Assessment of Water Pollution Control Programs Since 1972:Part 1, The Benefits of Point Source Controls for Conventional Pollutants in Rivers and Streams
6-12
grounds. Corrections to this situation accompanied water qualityimprovements. Fish ladders were built at dams and four large fishhatcheries were put into operation, producing 3.8 million salmonper year (Bennett, 1995). The dams also provide flowaugmentation during autumn low-flow periods, which providesfaster moving, oxygenated water to running fall chinook (Starbirdand Georgia, 1972).
The improvement in the quality of the Willamette River has playedan important role in the survival and return of both wild andhatchery-reared salmon. In 1965, only 79 chinook salmon werecounted in the fall run. That number increased to 5,000 in 1971(Starbird and Georgia, 1972). A record high of 106,300 springchinook salmon were counted in the 1990 run, up 30 percent fromthe 1985 to 1989 average of 81,900. The 1990 catch of chinooksalmon of 27,700 was 39 percent greater than the 1980 to 1989average of 20,000 (Bennett, 1995). With the recent and continuingpopulation growth in the Portland area (where most of the salmonare caught) and the improvements in water quality, interest inangling in the river has increased dramatically. The WillametteRiver is once again able to support important commercial andrecreational fisheries.
6.5 VALUATION OF SELECTED WITHDRAWALAND IN-PLACE BENEFITS
Improvements in the quality of the Willamette River since the1960s have contributed to improvements in the quality of theservices provided by this resource and, hence, to social welfare. Below, we discuss the way that water quality improvements in theriver may have improved the value that the resource provides. WTP estimates were developed for improvements in recreationservices.
6.5.1 Withdrawal Benefits
Numerous private and public enterprises rely on the waters of theWillamette Basin. Below, we discuss water use by agriculture andmanufacturing industries and public water suppliers and considerthe potential economic benefit associated with enhancedpretreatment or wastewater.

Section 6 — Case Study: The Willamette River Basin
4Note that available USGS data on water withdrawals in the Willametteregion include withdrawals from the Columbia River. Therefore, welikely overstate total withdrawals by agriculture, industry, and publicsuppliers.
6-13
Agricultural and Industrial Water Use
The Willamette Valley is a major agricultural production center,and many of the crops produced require irrigation. As shown inTable 6-1, farms withdraw approximately 80 billion gallons ofwater each year from the rivers of the Willamette Basin. 4 About 24percent of the total acreage in production requires irrigation. Mostof this irrigated land is used to produce vegetables (beans, corn,broccoli, cabbage, garlic, onions, and squash); mint; berries; andhops.
Water Resources Department officials recalled no time in the pastwhen pollution impeded the withdrawal of irrigation water(Szeramek, 1997) probably because irrigation water is not highlywater quality dependent. In addition, much of the water used forirrigation is withdrawn from the tributaries of the Willamette, whichtend to be less polluted than the main stem of the river. Nonetheless, officials could not rule out the possibility of situationswhere water quality may have influenced cropping choices orotherwise discouraged irrigation.
In addition to agriculture, a number of manufacturing industries usesurface water in the Willamette Basin. Table 6-1 summarizes total
Table 6-1. Surface Water Used in Irrigation and Manufacturing inWillamette Basin
Irrigation Water use(millions gal/year)
80,300
Total irrigated acres 290,000
Manufacturing Water use(millions gal/year)
54,750
Number of facilities 4,212
Source: U.S. Geological Survey. 1996. Estimated Water Use and GeneralHydrologic Conditions for Oregon: 1985 and 1990. Water ResourcesInvestigations Report 96-4080.
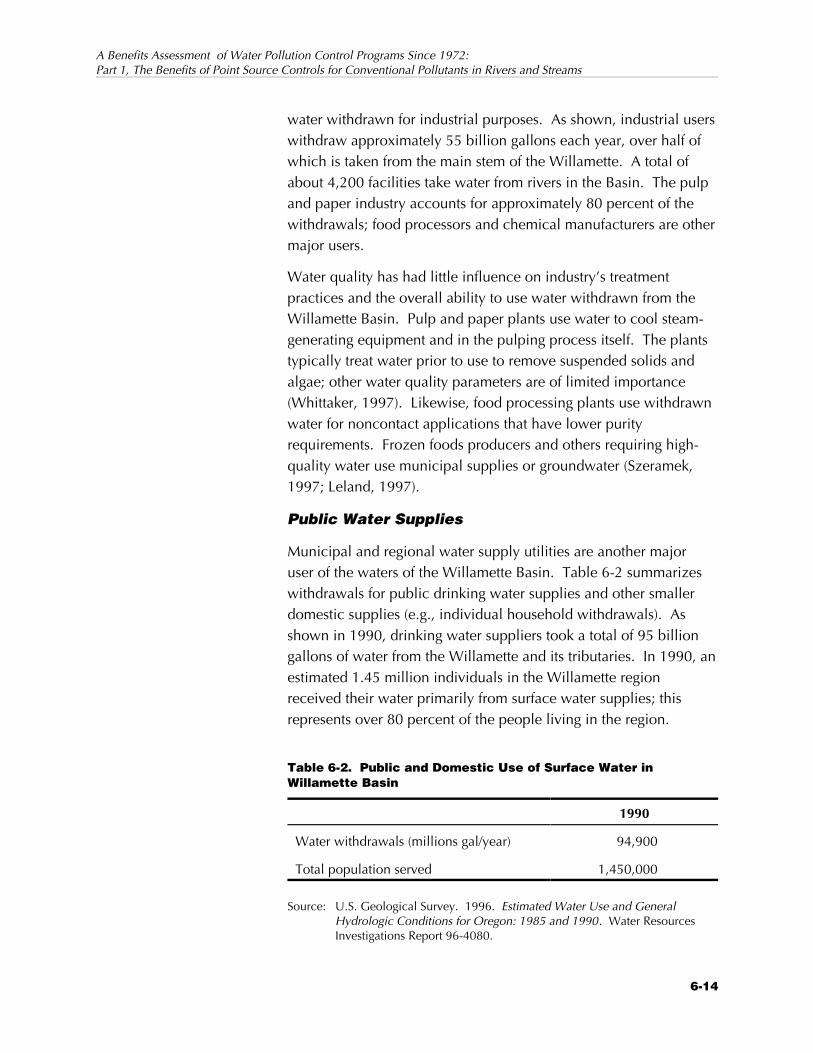
A Benefits Assessment of Water Pollution Control Programs Since 1972:Part 1, The Benefits of Point Source Controls for Conventional Pollutants in Rivers and Streams
6-14
water withdrawn for industrial purposes. As shown, industrial userswithdraw approximately 55 billion gallons each year, over half ofwhich is taken from the main stem of the Willamette. A total ofabout 4,200 facilities take water from rivers in the Basin. The pulpand paper industry accounts for approximately 80 percent of thewithdrawals; food processors and chemical manufacturers are othermajor users.
Water quality has had little influence on industry’s treatmentpractices and the overall ability to use water withdrawn from theWillamette Basin. Pulp and paper plants use water to cool steam-generating equipment and in the pulping process itself. The plantstypically treat water prior to use to remove suspended solids andalgae; other water quality parameters are of limited importance(Whittaker, 1997). Likewise, food processing plants use withdrawnwater for noncontact applications that have lower purityrequirements. Frozen foods producers and others requiring high-quality water use municipal supplies or groundwater (Szeramek,1997; Leland, 1997).
Public Water Supplies
Municipal and regional water supply utilities are another majoruser of the waters of the Willamette Basin. Table 6-2 summarizeswithdrawals for public drinking water supplies and other smallerdomestic supplies (e.g., individual household withdrawals). Asshown in 1990, drinking water suppliers took a total of 95 billiongallons of water from the Willamette and its tributaries. In 1990, anestimated 1.45 million individuals in the Willamette regionreceived their water primarily from surface water supplies; thisrepresents over 80 percent of the people living in the region.
Table 6-2. Public and Domestic Use of Surface Water inWillamette Basin
1990
Water withdrawals (millions gal/year) 94,900
Total population served 1,450,000
Source: U.S. Geological Survey. 1996. Estimated Water Use and GeneralHydrologic Conditions for Oregon: 1985 and 1990. Water ResourcesInvestigations Report 96-4080.

Section 6 — Case Study: The Willamette River Basin
5Corvallis is the only major municipality using the Willamette as adrinking water supply.
6-15
Water quality in the Willamette Basin has influenced howmunicipalities supply water. State officials noted that many of theregion’s larger municipalities hold water rights on the main stem ofthe Willamette River but have not exercised these rights because ofhistorically poor water quality (Starr, 1997). Instead, thesemunicipalities have established supplies in tributaries and reservoirsin higher elevations. For example, Portland receives 60 percent ofits water from the Bull Run River; similarly, Salem and Albany takewater from the North and South Santiam, respectively. 5 Given thispattern of water use, cleanup of the Willamette has had littleinfluence on the actual treatment practices applied and the intensityof this treatment. However, cleanup of the main stem of theWillamette ultimately may influence the choice of whether to usethe Willamette as a water source. For example, Portland recentlylooked more closely at the possibility of using the Willamette as asupply source (Yon, 1997). The cost associated with deliveringwater from the Willamette may be less than the cost of deliveringwater from more remote sources. In effect, the cost of “producing”water would be reduced and the savings realized either in the formof producer surplus (if water rates remained unchanged) orconsumer surplus (if water rates were reduced). Such savingswould represent a real economic benefit.
6.5.2 In-Place Benefits
Commercial Fishing
Little commercial fishing takes place on the Willamette and itstributaries. Today, a few licenses are issued each year forcommercial harvesting of shad (allowed only in the MultnomahChannel), crawfish, lamprey eel, and freshwater mussels (King,undated). The total value of the catch is small, about $47,000 in1993 (Oregon Department of Wildlife and Fisheries, 1996). Mostof this total is accounted for by the crawfish catch in Multnomahand Yamhill Counties. While it is likely that improvements in waterquality have led to improvements in social welfare through lowerprices for these species, the value is likely of a very smallmagnitude.

A Benefits Assessment of Water Pollution Control Programs Since 1972:Part 1, The Benefits of Point Source Controls for Conventional Pollutants in Rivers and Streams
6-16
Recreation
In the 1960s, the Willamette was one of the “filthiest rivers in theNorthwest and one of the most polluted in the country.” Recentwater quality improvements, however, have helped the study areabecome “one of the most heavily used recreation rivers in theUnited States” (ODEQ, undated). In addition to water qualityimprovements, the increased availability of recreation sites in theWillamette Basin has positively affected participation in manywater-dependent recreation activities. For instance, the State Parksand Recreation Department coordinated the “Greenways” programto develop parks and access sites for hiking, fishing, camping, andlaunching boats.
Recreation benefits are valued here as the product of the estimateddifference in recreation activity between the with-CWA andwithout-CWA levels and the unit value of each activity evaluated. To develop without-CWA activity levels, we considered the degreeof water contact associated with each activity. We assumed thatpoor water quality conditions have the greatest effect onindividuals’ willingness to engage in direct contact activities, suchas swimming. For these recreational categories, we assumed awithout-CWA activity level of zero (i.e., the Willamette Basin couldnot support these activities today had steps to improve andmaintain water quality not been undertaken). Since waterresources that could provide similar recreational opportunities arerelatively remote and thus poor substitutes, we treated all currentactivity levels as a net gain and based our estimate of the benefits ofimproved water quality on these activity levels. For activities thatinclude indirect water contact (e.g., fishing) or no water contact(e.g., wildlife viewing), we attributed smaller portions of currentactivity to water quality improvements, on the assumption thatsome activity would currently exist even in the absence of efforts toimprove water quality.
We monetized the estimated changes in uses of the Basin byapplying a benefits transfer approach. This approach applies unitvalues for recreation activities drawn from the literature onrecreation demand to the case study setting.

Section 6 — Case Study: The Willamette River Basin
6-17
Table 6-3 summarizes our findings. As shown, estimated annualbenefits range from $121.1 million to $259.4 million, andrecreational fishing is the largest component. We describe theseresults in detail in the sections below.
Recreational Fishing. The return of a diverse fish population to theWillamette Basin during the 1970s resulted in a surge ofrecreational fishing activity. Anglers now enjoy catching a varietyof highly valued species of sportfish. We used the results of the1991 Oregon Angler Survey and Economic Study (The ResearchGroup, 1991), conducted for the Oregon Department of Fish andWildlife, to obtain an estimate of the number of current fishing tripsand days for different fish species in the Willamette Basin (TheResearch Group, 1991). This study provides activity estimates forsalmon, steelhead, trout, warmwater, sturgeon, and “other” fishingdays and trips by sampling fishing license holders in Oregon. Eventhough the fish population may have dropped significantly in the1960s, anglers may have continued to fish in the Willamette Basindespite low catch rates. Continued fishing is also likely given thatthe Willamette Basin covers such an extensive geographic area (i.e.,
Table 6-3. Summary of Annual Recreation Benefits for WillametteResources (1997 $)
ActivityLower Bound(millions $/yr)
Upper Bound(millions $/yr)
Recreational fishing $63.7 $88.0
Swimming $20.0 $31.7
Beach use $9.1 $9.7
Windsurfing $5.4
Water skiing $9.0 $10.5
Jet skiing $1.2 $2.3
Cruising (boating) $3.4 $9.8
Sailing $0.4 $1.4
Wildlife viewing $9.1 $46.5
Total benefits $121.1 $259.4
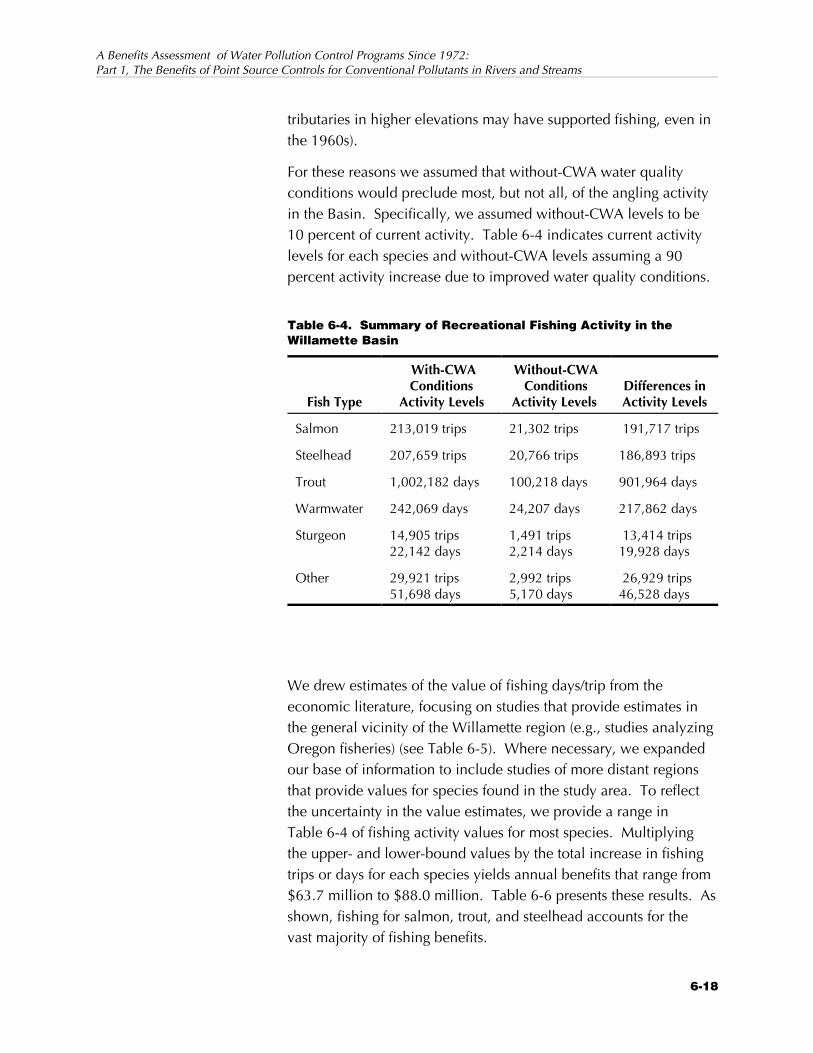
A Benefits Assessment of Water Pollution Control Programs Since 1972:Part 1, The Benefits of Point Source Controls for Conventional Pollutants in Rivers and Streams
6-18
tributaries in higher elevations may have supported fishing, even inthe 1960s).
For these reasons we assumed that without-CWA water qualityconditions would preclude most, but not all, of the angling activityin the Basin. Specifically, we assumed without-CWA levels to be10 percent of current activity. Table 6-4 indicates current activitylevels for each species and without-CWA levels assuming a 90percent activity increase due to improved water quality conditions.
We drew estimates of the value of fishing days/trip from theeconomic literature, focusing on studies that provide estimates inthe general vicinity of the Willamette region (e.g., studies analyzingOregon fisheries) (see Table 6-5). Where necessary, we expandedour base of information to include studies of more distant regionsthat provide values for species found in the study area. To reflectthe uncertainty in the value estimates, we provide a range inTable 6-4 of fishing activity values for most species. Multiplyingthe upper- and lower-bound values by the total increase in fishingtrips or days for each species yields annual benefits that range from$63.7 million to $88.0 million. Table 6-6 presents these results. Asshown, fishing for salmon, trout, and steelhead accounts for thevast majority of fishing benefits.
Table 6-4. Summary of Recreational Fishing Activity in theWillamette Basin
Fish Type
With-CWAConditions
Activity Levels
Without-CWAConditions
Activity Levels Differences inActivity Levels
Salmon 213,019 trips 21,302 trips 191,717 trips
Steelhead 207,659 trips 20,766 trips 186,893 trips
Trout 1,002,182 days 100,218 days 901,964 days
Warmwater 242,069 days 24,207 days 217,862 days
Sturgeon 14,905 trips22,142 days
1,491 trips2,214 days
13,414 trips19,928 days
Other 29,921 trips51,698 days
2,992 trips5,170 days
26,929 trips46,528 days
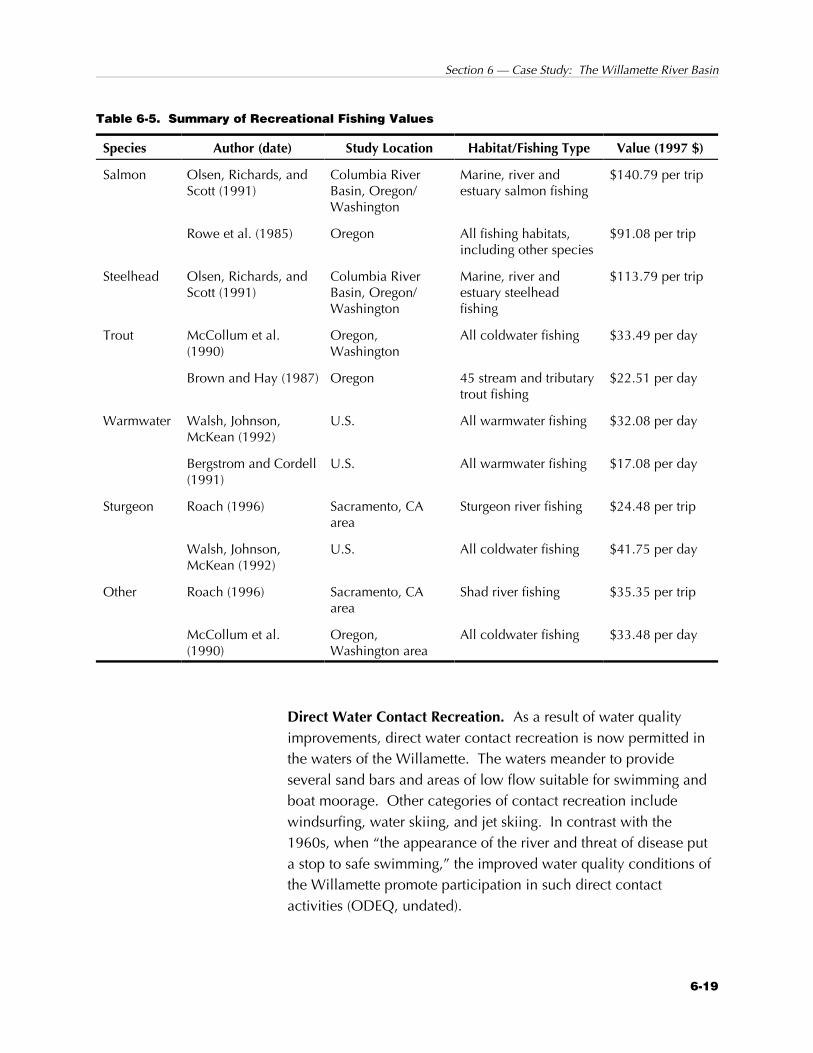
Section 6 — Case Study: The Willamette River Basin
6-19
Direct Water Contact Recreation. As a result of water qualityimprovements, direct water contact recreation is now permitted inthe waters of the Willamette. The waters meander to provideseveral sand bars and areas of low flow suitable for swimming andboat moorage. Other categories of contact recreation includewindsurfing, water skiing, and jet skiing. In contrast with the1960s, when “the appearance of the river and threat of disease puta stop to safe swimming,” the improved water quality conditions ofthe Willamette promote participation in such direct contactactivities (ODEQ, undated).
Table 6-5. Summary of Recreational Fishing Values
Species Author (date) Study Location Habitat/Fishing Type Value (1997 $)
Salmon Olsen, Richards, andScott (1991)
Columbia RiverBasin, Oregon/Washington
Marine, river andestuary salmon fishing
$140.79 per trip
Rowe et al. (1985) Oregon All fishing habitats,including other species
$91.08 per trip
Steelhead Olsen, Richards, andScott (1991)
Columbia RiverBasin, Oregon/Washington
Marine, river andestuary steelheadfishing
$113.79 per trip
Trout McCollum et al.(1990)
Oregon,Washington
All coldwater fishing $33.49 per day
Brown and Hay (1987) Oregon 45 stream and tributarytrout fishing
$22.51 per day
Warmwater Walsh, Johnson,McKean (1992)
U.S. All warmwater fishing $32.08 per day
Bergstrom and Cordell(1991)
U.S. All warmwater fishing $17.08 per day
Sturgeon Roach (1996) Sacramento, CAarea
Sturgeon river fishing $24.48 per trip
Walsh, Johnson,McKean (1992)
U.S. All coldwater fishing $41.75 per day
Other Roach (1996) Sacramento, CAarea
Shad river fishing $35.35 per trip
McCollum et al.(1990)
Oregon,Washington area
All coldwater fishing $33.48 per day

A Benefits Assessment of Water Pollution Control Programs Since 1972:Part 1, The Benefits of Point Source Controls for Conventional Pollutants in Rivers and Streams
6-20
The Oregon State Comprehensive Outdoor Recreation Plan,Recreational Needs Bulletin (SCORP) provides 1987 regionalestimates of activity days for direct contact recreation, includingbeach swimming, beach use, and windsurfing (Oregon State Parksand Recreation Department, 1991). To develop benefit estimatesfor our analysis, we relied on the SCORP’s activity data forRegions 7 and 8, which include the counties of the WillametteBasin: Benton, Clackamas, Columbia, most of Lane, Linn, Marion,Multnomah, Polk, Washington, and Yamhill. Since the SCORPdata may include some Columbia River participation, these activitylevels are likely to overstate 1987 participation rates for theWillamette Basin; conversely, the estimates are somewhat datedand may understate current activity, because they ignore likelyincreases in participation due to recent population growth.
In contrast to the recreational uses discussed above, data on waterskiing and jet skiing activity are relatively current. The 1996Oregon Recreational Boating Survey provides 1995 county andwater body-specific estimates of water skiing and jet skiingactivities (Oregon State Marine Board, 1996). Based on these data,we estimate that 244,200 water skiing days and 54,700 jet skiing
Table 6-6. Annual Recreational Fishing Benefits in the Willamette Basin
Fish Type
EstimatedDifferences inActivity Levels
Value per Day or TripaBenefits
(millions 1997$/yr)
Low Estimate High EstimateLowerBound Upper Bound
Salmon 191,717 trips $92 per trip $141 per trip $17.6 $27.1
Steelhead 186,893 trips $114 per trip $114 per trip $21.3 $21.3
Trout 901,964 days $22 per day $34 per day $19.9 $30.4
Warmwater 217,862 days $17 per day $32 per day $3.7 $6.8
Sturgeon 13,414 trips19,928 days
$24 per trip $42 per day $0.3 $0.8
Other 26,929 trips46,528 days
$36 per trip $34 per day $0.9 $1.6
Total $63.7 $88.0
a Based on estimates summarized in Table 6-5.

Section 6 — Case Study: The Willamette River Basin
6-21
days currently occur in Willamette waters annually (see Table 6-7). We estimated water skiing and jet skiing activity levels for theWillamette Basin using county and water body participationestimates relevant to the study area.
Although data describing 1960s activity levels for direct contactrecreation are unavailable, the swimming bans in the Basin prior to1972 precluded direct water contact activities (Oregon State MarineBoard and Oregon State Parks, 1995). Since these bans were notlifted until 1972, we assumed that no direct contact recreationwould be permitted under without-CWA water quality conditions.
Assuming a without-CWA level of zero for these activities, weestimated annual benefits for each water contact recreationcategory as follows:
Boat Cruising and Sailing. Improvements in water quality increaseopportunities for and enhance the enjoyment of recreationalboating. The Oregon State Marine Board’s survey of registeredOregon boaters indicates that the growth of Oregon registered boatshas exceeded statewide population growth. The data indicate agrowth from 30 registered boats per 1,000 population in 1965 to60.5 registered boats per 1,000 population in 1992 (Oregon StateMarine Board, 1997). In addition, the availability of boat launchsites has grown. According to the Oregon State Marine Board,parks and moorages have increased over the years due in large partto the improved water quality of the Willamette Basin (Broggi,1997).
Table 6-7. Selected Recreation Benefits
CategoryAnnual
Activity Days
Value per DayBenefits
(millions 1997$/yr)
Lower Upper Lower Upper
Swimming 1,001,859 $20 $32 $20 $31.7
Beach Use 1,710,293 $5 $35 $9.1 $59.4
Windsurfing 146,282 $37 $66 $5.4 $9.7
Water skiing 244,197 $37 $43 $9.0 $10.5
Jet skiing 54,703 $22 $43 $1.2 $2.3
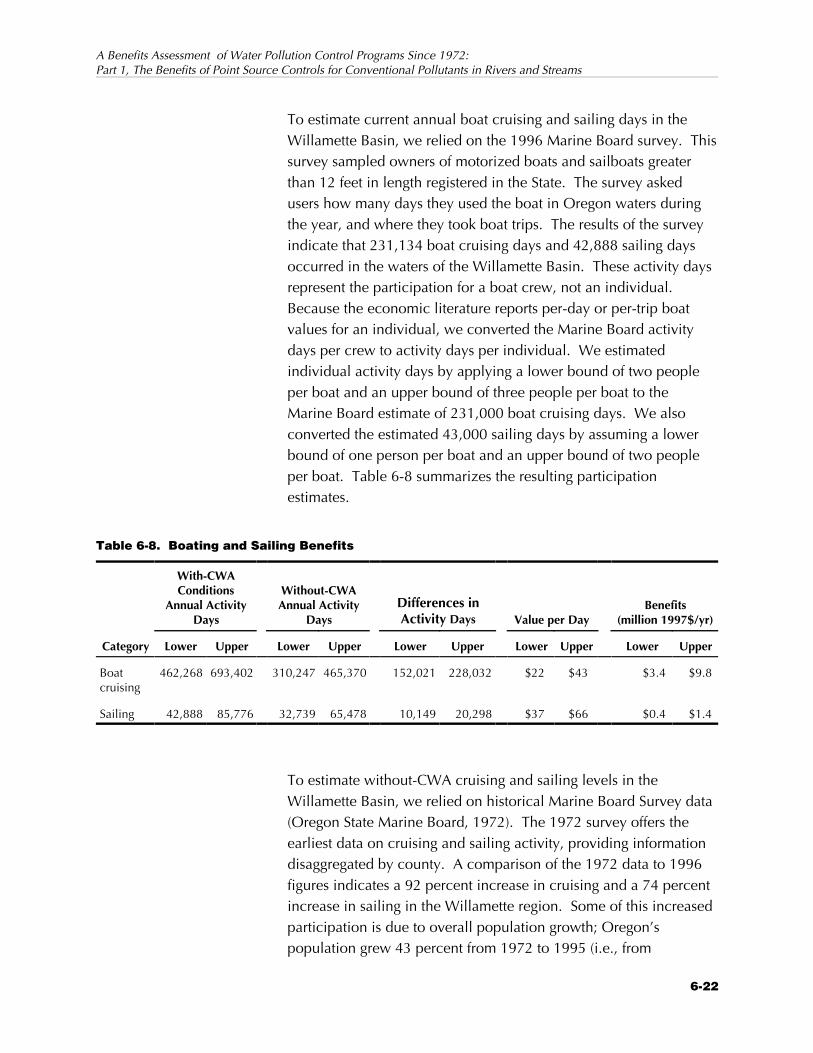
A Benefits Assessment of Water Pollution Control Programs Since 1972:Part 1, The Benefits of Point Source Controls for Conventional Pollutants in Rivers and Streams
6-22
To estimate current annual boat cruising and sailing days in theWillamette Basin, we relied on the 1996 Marine Board survey. Thissurvey sampled owners of motorized boats and sailboats greaterthan 12 feet in length registered in the State. The survey askedusers how many days they used the boat in Oregon waters duringthe year, and where they took boat trips. The results of the surveyindicate that 231,134 boat cruising days and 42,888 sailing daysoccurred in the waters of the Willamette Basin. These activity daysrepresent the participation for a boat crew, not an individual. Because the economic literature reports per-day or per-trip boatvalues for an individual, we converted the Marine Board activitydays per crew to activity days per individual. We estimatedindividual activity days by applying a lower bound of two peopleper boat and an upper bound of three people per boat to theMarine Board estimate of 231,000 boat cruising days. We alsoconverted the estimated 43,000 sailing days by assuming a lowerbound of one person per boat and an upper bound of two peopleper boat. Table 6-8 summarizes the resulting participationestimates.
To estimate without-CWA cruising and sailing levels in theWillamette Basin, we relied on historical Marine Board Survey data(Oregon State Marine Board, 1972). The 1972 survey offers theearliest data on cruising and sailing activity, providing informationdisaggregated by county. A comparison of the 1972 data to 1996figures indicates a 92 percent increase in cruising and a 74 percentincrease in sailing in the Willamette region. Some of this increasedparticipation is due to overall population growth; Oregon’spopulation grew 43 percent from 1972 to 1995 (i.e., from
Table 6-8. Boating and Sailing Benefits
Category
With-CWAConditions
Annual ActivityDays
Without-CWAAnnual Activity
DaysDifferences inActivity Days Value per Day
Benefits(million 1997$/yr)
Lower Upper Lower Upper Lower Upper Lower Upper Lower Upper
Boatcruising
462,268 693,402 310,247 465,370 152,021 228,032 $22 $43 $3.4 $9.8
Sailing 42,888 85,776 32,739 65,478 10,149 20,298 $37 $66 $0.4 $1.4

Section 6 — Case Study: The Willamette River Basin
6-23
2,195,000 to 3,132,000) (U.S. Department of Commerce, 1994;Center for Population Research and Census, 1995). Assuming thatwater quality improvements are responsible for increases in boatingactivity net of population growth, we calculated that water qualityimprovements increase cruising activity from 462,000 days to693,000 days per year, and sailing activity from 43,000 days to86,000 days per year. Table 6-8 reports these activity estimates.
To value boat cruising, we used estimates of motorized boatingfrom Bergstrom and Cordell (1991) and Walsh, Johnson, andMcKean (1992). These nationwide estimates range from $22 to $43per day. For sailing, we applied the Bergstrom and Cordell valuefor “rowing/other boating” to represent the lower-bound value. Weapplied the Walsh, Johnson, and McKean value for nonmotorizedboating to represent the upper-bound sailing value. Thesenationwide estimates range from $37 to $66 per day. For eachactivity, we multiplied the upper- and lower-bound values by theupper- and lower-bound activity change estimates, respectively, toobtain total benefits. This procedure yields an estimate of annualboat cruising benefits that ranges from $3.4 million to $9.8 million,and an estimate of annual sailing benefits that ranges from $0.4million to $1.4 million. Results are presented in Table 6-8.
Wildlife Viewing. Improvements in water quality restore wildlifehabitat and enhance the wildlife viewing experience by eliminatingodors and improving visual aesthetics. In addition, newly procuredGreenways parcels in the Willamette Valley have increasedparklands and public access along the waters, enabling visitors toenjoy the scenery and thriving bird populations more readily.
These elements have contributed to an increase in shoreline-viewing activities. Using Oregon SCORP data on nature andwildlife observation (for Regions 7 and 8), we estimated currentparticipation in wildlife viewing along the Willamette or itstributaries. To obtain this estimate, we scaled the 2.4 million daysreported in the SCORP to reflect viewing in wildlife areas thatdirectly border the water. As our scaling factor, we employed the

A Benefits Assessment of Water Pollution Control Programs Since 1972:Part 1, The Benefits of Point Source Controls for Conventional Pollutants in Rivers and Streams
6We calculated the total land area of the following refuges and wildlifeviewing areas: Fern Ridge Wildlife Area, William L. Finley NationalWildlife Refuge, Ankeny and Baskett Slough National Wildlife Refuges,Molalla River State Park, Oxbow Park, Metro Washington Park Zoo,Audubon Society of Portland, Tryon Creek State Park, Jackson BottomWetlands Preserve, Sauvie Island Wildlife Management Area, TualitinRiver National Wildlife Refuge, Burlington Bottom, and Oaks Bottom. The refuges we determined to be on the river or one of its tributariesinclude Fern Ridge, Molalla River State Park, Tryon Creek, JacksonBottom, Sauvie Island, and Tualitin. To obtain the 2,032,436 upper-bound estimate of wildlife viewing days along the Willamette and itstributaries, we scaled the original estimate of 2,422,761 wildlifeviewing days within SCORP Regions 7 and 8 by 0.84 (36,996acres/44,101 acres).
6-24
ratio of refuge land area in close proximity to the Willamette or itstributaries to total refuge land area in the ten counties of the Basin. 6
The level of wildlife viewing activity near the Willamette in 1965 isunclear; the SCORP data do not provide such estimates. It is likely,however, that the river’s poor condition had an adverse effect onparticipation rates. A short documentary film on the Willamettesupports this assumption, noting that “at times people completelyavoided the river because of the stench” (ODEQ, undated). Toreflect our uncertainty concerning the without-CWA conditions, weestimated a range of without-CWA activity levels that reflectbetween 25 and 75 percent of current activity levels. Table 6-9presents these estimates and the resulting upper- and lower-boundestimates of changes in wildlife viewing activity due to improvedwater quality.
To value the estimated change in wildlife viewing activity, weemployed use-day values from Bergstrom and Cordell (1991) andWalsh, Johnson, and McKean (1992). We used Bergstrom andCordell’s wildlife observation estimate of $18 per day as the lower-
Table 6-9. Annual Wildlife Viewing Benefits
Estimate
With-CWAConditions
Activity Days
Without-CWA Activity
Days
Differencein Activity
DaysValue per
Day Benefits
(millions 1997$/yr)
Lower Bound 2,032,436 1,524,327 508,109 $18 $9.1
Upper Bound 2,032,436 508,109 1,524,327 $31 $46.5

Section 6 — Case Study: The Willamette River Basin
6-25
bound value and the Walsh, Johnson, and McKean wildlife viewingestimate of $31 per day as the upper-bound value. Multiplyingthese values by the estimated change in activity levels due toimproved water quality yields annual wildlife viewing benefits thatrange from $9.1 million to $46.5 million. Table 6-9 presents theseresults.
We may understate benefits if our analysis excludes categories ofrecreation affected by water quality. For example, we haveexcluded the following categories:
• Camping: Camping along the Willamette has becomemore accessible over the years with the procurement ofpublicly owned Greenway parcels. While improvedwater quality may have made camping experiencesmore pleasing for some participants, it is difficult tojudge the overall impact of water quality improvementson this activity. Since we are unable to measure thesepotential benefits and exclude this category from ouranalysis, our benefit estimates may underestimate thebenefits of water quality improvements.
• Hunting: We exclude this activity from our analysisbecause the physical effects of pollution on waterfowlare not well established in the Willamette region.
• Hiking: We exclude this benefit category from theanalysis because available data do not allow us tocalculate the number of river-associated hiking days.
The net effect of these uncertainties is not clear; our approach mayunder- or overstate the true recreational benefits of water qualityimprovements in the Willamette Valley.
Aesthetic Services
A number of studies have attempted to disentangle the valuespeople have for a resource. For example, Desvousges , Smith, andFisher (1987) evaluated annual WTP per household for improvedwater quality in the Monongahela River (Pennsylvania). In thesurvey, households were asked to estimate their total WTP for waterquality improvements and then to indicate what portion of thisvalue was due to their actual use of the river. Based on this study,
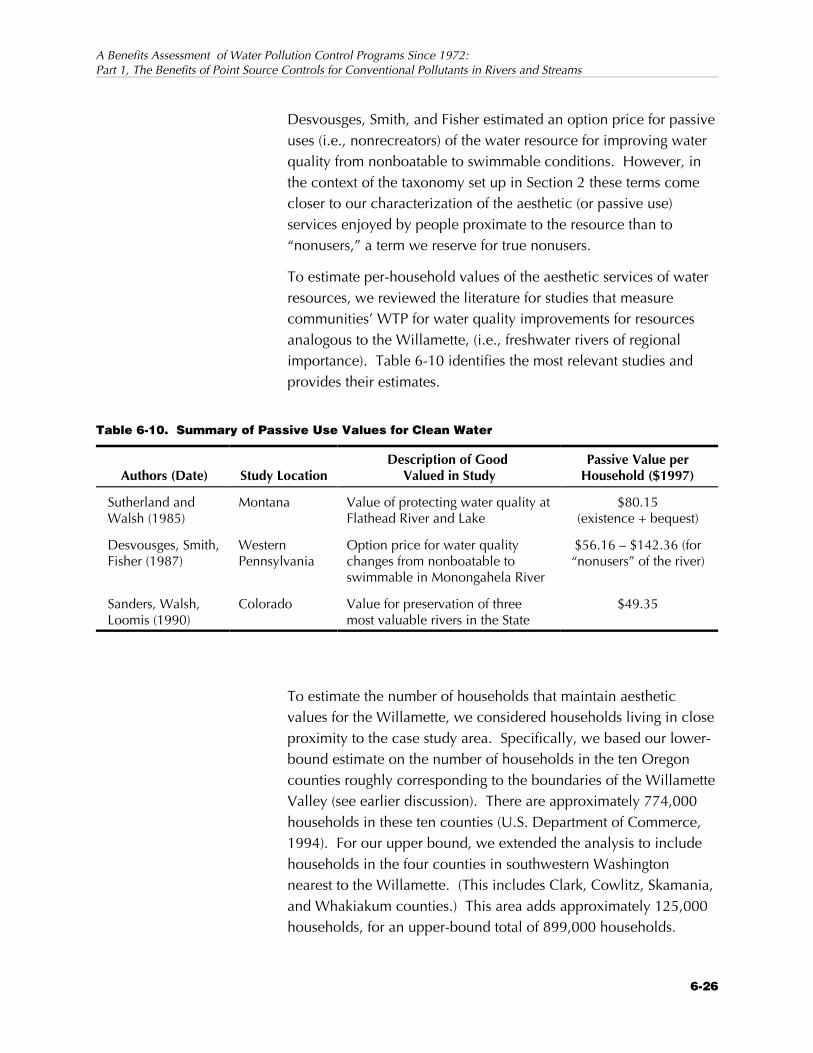
A Benefits Assessment of Water Pollution Control Programs Since 1972:Part 1, The Benefits of Point Source Controls for Conventional Pollutants in Rivers and Streams
6-26
Desvousges, Smith, and Fisher estimated an option price for passiveuses (i.e., nonrecreators) of the water resource for improving waterquality from nonboatable to swimmable conditions. However, inthe context of the taxonomy set up in Section 2 these terms comecloser to our characterization of the aesthetic (or passive use)services enjoyed by people proximate to the resource than to“nonusers,” a term we reserve for true nonusers.
To estimate per-household values of the aesthetic services of waterresources, we reviewed the literature for studies that measurecommunities’ WTP for water quality improvements for resourcesanalogous to the Willamette, (i.e., freshwater rivers of regionalimportance). Table 6-10 identifies the most relevant studies andprovides their estimates.
To estimate the number of households that maintain aesthetic values for the Willamette, we considered households living in closeproximity to the case study area. Specifically, we based our lower-bound estimate on the number of households in the ten Oregoncounties roughly corresponding to the boundaries of the WillametteValley (see earlier discussion). There are approximately 774,000households in these ten counties (U.S. Department of Commerce,1994). For our upper bound, we extended the analysis to includehouseholds in the four counties in southwestern Washingtonnearest to the Willamette. (This includes Clark, Cowlitz, Skamania,and Whakiakum counties.) This area adds approximately 125,000households, for an upper-bound total of 899,000 households.
Table 6-10. Summary of Passive Use Values for Clean Water
Authors (Date) Study LocationDescription of Good
Valued in StudyPassive Value per
Household ($1997)
Sutherland andWalsh (1985)
Montana Value of protecting water quality atFlathead River and Lake
$80.15(existence + bequest)
Desvousges, Smith,Fisher (1987)
WesternPennsylvania
Option price for water qualitychanges from nonboatable toswimmable in Monongahela River
$56.16 – $142.36 (for“nonusers” of the river)
Sanders, Walsh,Loomis (1990)
Colorado Value for preservation of threemost valuable rivers in the State
$49.35

Section 6 — Case Study: The Willamette River Basin
6-27
Since passive use value estimates vary according to researchmethod, study location, and proximity to the affected resource, weprovide a low and high estimate of passive values for theWillamette. Specifically, we applied WTP estimates ranging from$42 to $84 per household per year. Combining these estimateswith the corresponding lower- and upper-bound estimates ofhouseholds yields an estimate of passive use value of between $33million and $76 million per year. These results are presented inTable 6-11.
Table 6-12 summarizes the benefit estimates for the case study ofthe Willamette River Basin. Recreation benefits total between $121million and $259 million, and aesthetic benefits range from $33million to $76 million. In total, therefore, the estimated benefitsrange from $275 million to $594 million per year.
Table 6-11. Annual Benefits Attributable to Aesthetic Values forthe Willamette Basin
EstimateNumber ofHouseholds
Value perHousehold
Total Passive UseValue
(million 1997$/yr)
Lower Bound 774,000 $42 $32.6
Upper Bound 899,000 $84 $75.7
Table 6-12. Summary of Case Study Estimates of Annual CleanWater Benefits for the Willamette River Basin
Benefits (million 1997$/yr)Benefit Category Lower Bound Upper BoundRecreation
Fishing 63.70 88.00Swimming 20.00 31.70Beach use 9.10 59.40Windsurfing 5.40 9.70Water skiing 9.00 10.50Jet skiing 1.20 2.30Boat cruising 3.40 9.80Sailing 0.40 1.40Wildlife viewing 9.10 46.50Total recreation 121.30 259.30
Aesthetic 32.60 75.70Total Estimated Benefits 275.20 594.30

A Benefits Assessment of Water Pollution Control Programs Since 1972:Part 1, The Benefits of Point Source Controls for Conventional Pollutants in Rivers and Streams
6-28
6.6 APPLYING THE NWPCAM TO THEWILLAMETTE RIVER BASIN
An alternative to the benefits transfer approach used above is toapply the NWPCAM and Mitchell and Carson values to the tencounties surrounding the Willamette River Basin. This providesboth an alternative estimate and basis for comparison of the twomethodologies. The results are in general agreement. The riverand stream miles attaining recreational use support under thewith-CWA scenario are presented in Table 6-13. These reflect theestimated conditions in the mid-1990s. In Table 6-14 we presentthe corresponding miles of beneficial use attainment for thewithout-CWA (i.e., without the CWA) scenario. Finally, we presentlocal recreation and aesthetic benefits estimates for these cases inTable 6-15.
Table 6-13. Estimated River and Stream Miles AttainingBeneficial Uses for Recreation in the Willamette River Basin Withthe CWA, Mid-1990s
Highest Use Supported Miles Proportion (%)
Swimmable 3,650 84%
Fishable 4,208 97%
Boatable 4,269 98%
Nonsupport 75 2%
Total 4,344
Table 6-14. Estimated Impact of the CWA on River and StreamMiles Attaining Beneficial Uses for Recreation in the WillametteRiver Basin, Mid-1990s
Highest UseSupport
Without-CWAConditions
Changes withCWA
Changes withCWA (%)
Swimmable 3,493 157 4.5%
Fishable 4,106 102 2.5%
Boatable 4,174 95 2.3%
Nonsupport 170 -95 -55.9%

Section 6 — Case Study: The Willamette River Basin
6-29
The case study found recreation benefits of $121 million to $259million annually at late 1980s to early 1990s rates (see Table 6-3). The application of the national methodology, which incorporates asomewhat more expansive set of services, finds a value of $103million, close to the lower-bound estimate of the case study.
It is important to keep in mind, however, that there are fundamentaldifferences between the NWPCAM as applied to the WillametteRiver Basin and the case study presented in this section. Amongother differences, the NWPCAM, as applied in this context, canonly loosely approximate the magnitude of benefits of local waterquality changes. The Mitchell-Carson benefits estimates used withthe NWPCAM were derived using a national probability sample of households to determine a representative, or average, WTPmeasure. To the extent that household and site-specificcharacteristics in the Willamette River Basin differ from the nationalaverage, the results derived using the NWPCAM will differ fromthose of the case study.
Table 6-15. Estimated Annual Value of Selected In-PlaceBenefits of the CWA in the Willamette River Basin, Mid-1990s
Use AttainmentIn-Place Benefitsa
(million 1997$/yr)
Boatable $34
Fishable $25
Swimmable $44
Total $103
a Local recreation and aesthetic services.

7-1
7Directions for FutureResearch
This analysis represents part of an ongoing effort by the Agency todevelop a comprehensive assessment of the benefits of the CWAusing modern valuation methods. Because this is a work-in-progress, it is especially important to identify areas where furtherresearch would be useful in improving the analysis. These areasgenerally address extending the scope of the analysis andimproving the methodologies employed.
7.1 RESOURCE COVERAGE
This study examines only a subset of the surface waters affected bythe CWA. In particular, the site database used in this analysis, RF1,includes major river and stream reaches but does not include mostlakes (including the Great Lakes), estuaries, or the marine coast. Akey area for improvement in terms of resource coverage is to extendthe analysis to include coastal and estuarine waters. Theseresources are critical because a substantial share of the UnitedStates population resides near the Nation’s coastal and estuarinewaters and uses these water resources for recreational activities. They are also a critical source of habitat, ecological diversity, andbiological production. Including a broader coverage of lakes andsmaller streams will also be an important enhancement to theNWPCAM and will support a more complete assessment ofbenefits.

A Benefits Assessment of Water Pollution Control Programs Since 1972:Part 1, The Benefits of Point Source Controls for Conventional Pollutants in Rivers and Streams
7-2
7.2 POLLUTANT COVERAGE
In this study we were able to characterize with- and without-CWApollutant loadings for oxygen-demanding wastes, an infectiousagent, and sediment. These are critical pollutants, affecting waterquality and the services of water resources; however, they are notcomprehensive. Pollutants including toxic chemicals and nutrientsalso have large impacts on water quality and, hence, the servicesprovided by surface waters. Including these pollutants is animportant priority in expanding the capabilities of the NWPCAM.
7.3 SOURCE COVERAGE
Expanding the NWPCAM’s coverage of point and nonpoint sourceswill be an important complement to expanding its coverage ofpollutants and water resources. In addition, the loadings for CSOsand NPSs in this study are assumed to be the same under the with-and without-CWA conditions. Data on the implementation andeffectiveness of NPS controls and controls on CSOs would furtherimprove the comprehensiveness of the analysis.
7.4 SERVICES COVERAGE
A subset of the in-place services affected by water quality is valuedin this study, and no withdrawal services are included. The nextstep would be to develop a methodology for incorporating allservices of surface water into a national water quality benefitsmodel. Many of the benefits of the omitted services, especially thewithdrawal services, will be transmitted through markets in theform of commodity price or income changes. Others may bedirectly experienced by households. Characterizing all the linkagesbetween water quality and individual welfare will be important indeveloping an approach for including all of those services in thebenefits valuation.
Some of the impacts of water quality changes are registered in theperformance of ecosystems. Like water resources, per se, thesesystems provide services of value to humans. Consideration shouldbe given to developing a taxonomy of these services andincorporating estimates of the change in their service flows due tochanges in water quality.

Section 7 — Directions for Future Research
7-3
7.5 WTP ESTIMATES
The WTP estimates developed by Mitchell and Carson (Mitchelland Carson, 1986; Carson and Mitchell, 1993) used in this studyare rather dated, and their resource and service coverage isincomplete. They estimate the freshwater in-place water qualitybenefits accruing to households, expressly excluding commercialin-place and withdrawal benefits. Although updating the estimatesto account for the relationship between income growth and WTPhas been possible, it is not clear how other factors have affectedWTP over the last 14 years.

R-1
References
Bennett, Donald E. September 1995. 1994 Willamette River SpringChinook Salmon Run, Fisheries, and Passage at WillametteFalls. Oregon Department of Fish and Wildlife, FishDivision, Columbia River Management.
Bergstrom, John C., Kevin J. Boyle, Charles A. Job, and Mary JoKealy. 1996. “Assessing the Economic Benefits of GroundWater for Environmental Policy Decisions.” WaterResources Bulletin 32(2):279-291.
Bergstrom, J., and H. Cordell. 1991. “An Analysis of the Demandfor and Value of Outdoor Recreation in the United States.”Journal of Leisure Research 23(1):67-86.
Broggi, Jill, Oregon State Marine Boards. Personal conversation. March 4, 1997.
Brown, Gardner Jr. and Michael J. Hay. March 1987. “NetEconomic Recreation Values for Deer and WaterfowlHunting and Trout Fishing, 1980.” Division of Policy andDirectives Management, U.S. Fish and Wildlife Service,Working Paper No. 23.
Carson, Richard T. Personal communication with Tayler Bingham. April 11, 1997.
Carson, Richard, and Robert Mitchell. 1993. “The Value of CleanWater: The Public’s Willingness to Pay for Boatable,Fishable, Swimmable Water Quality.” Water ResourcesResearch 29(7):2445-2454.
A Benefits Assessment of Water Pollution Control Programs Since 1972:Part 1, The Benefits of Point Source Controls for Conventional Pollutants in Rivers and Streams
R-2
Center for Population Research and Census, School of PublicAffairs. 1995. “Population Estimates for Oregon: July 1,1995.” Portland State University.
Clark, Matthew, Mary Jo Kealy, Virginia Kibler, and Raffael Stein. 1995. “Impacts of Municipal Wastewater Treatment: ARetrospective Analysis.” Washington, DC: U.S. Environmental Protection Agency, Office of Water.
Council on Environmental Quality. 1973. Fourth Annual Report onEnvironmental Quality. Washington, DC: Council onEnvironmental Quality.
Council on Environmental Quality. 1995. The Twenty-FifthAnniversary Report of the Council on EnvironmentalQuality.
Desvousges, William H., V. Kerry Smith, and Ann Fisher. 1987. “Option Price Estimates for Water Quality Improvements: AContingent Valuation Study for the Monongahela River.” Journal of Environmental Economics and Management 14:248-267.
Dimick, R.E., and F. Merryfield. June 1945. The Fishes of theWillamette River System in Relation to Pollution . OregonState College Engineering Experiment Station Bulletin SeriesNo. 20. p. 7-55.
Federal Emergency Management Agency (FEMA). 1987. 36 DGEM: The 36 Sector Dynamic General EquilibriumModel. Final Report. Washington, DC: FEMA.
Federal Register. July 3, 1996. “Part VI: Environmental ProtectionAgency: Effluent Guideline Plan; Notice.” 61(129):35041-35054.
Fogarty, John P.C. 1991. “Short History of Federal Water PollutionControl Act.” In Clean Water Deskbook: TheEnvironmental Law Reporter. Washington, DC:Environmental Law Institute.
General Accounting Office. Case Study Evaluations. November1990. Washington, DC: Program Evaluation andMethodology Division.
Gleeson, G.W. 1972. The Return of a River, the Willamette River,Oregon. Corvallis, OR: Oregon State University.

References
R-3
King, Steve, Oregon Department of Fish and Wildlife. Personalcommunication.
Krutilla, J. 1967. “Conservation Reconsidered.” AmericanEconomic Review 57:777-786.
Leland, Dave. Oregon Health Division. Personal communication. February 28, 1997.
Lovejoy, Stephen B. 1989. Changes in Cropland Loadings toSurface Waters: Interim Report No. 1 for the Developmentof the CSC National Water Quality Model. West Lafayette,IN: Purdue University.
Lovejoy, Stephen B., and Barbara Dunkelberg. 1990. WaterQuality and Agricultural Policies in the 1990s: InterimReport No. 3 for Development of the SCS National WaterQuality Model. West Lafayette, IN: Purdue University.
McCollum, Daniel W., George L. Peterson, J. Ross Arnold, DonaldC. Markstrom, and Daniel M. Hellerstein. 1990. The NetEconomic Value of Recreation in the National Forests:Twelve Types of Primary Activity Trips Across Nine ForestService Regions. U.S. Department of Agriculture, ForestService, Research Paper, RM-289.
Mitchell, R.C., and R.T. Carson. 1986. The Use of ContingentValuation Data for Benefit/Cost Analysis in Water PollutionControl. CR-810224-02. Prepared for U.S. EnvironmentalProtection Agency, Office of Policy Planning andEvaluation. Washington, DC.
Olsen, Darryll, Jack Richards, and R. Douglas Scott. January 1991. ”Existence and Sport Values for Doubling the Size ofColumbia River Basin Salmon and Steelhead Runs.” Rivers 2(1):44-56.
Oregon Department of Environmental Quality. Undated. “A RiverRestored: Oregon’s Willamette.” Video produced byImageSound.
Oregon Department of Environmental Quality. December 1970. Water Quality Control in Oregon. Portland, OR: OregonDepartment of Environmental Quality.

A Benefits Assessment of Water Pollution Control Programs Since 1972:Part 1, The Benefits of Point Source Controls for Conventional Pollutants in Rivers and Streams
R-4
Oregon Department of Environmental Quality. 1990. Oregon1990 Water Quality Status Assessment Report - 305(b)Report. Portland, OR: Oregon Department ofEnvironmental Quality. 135 pp.
Oregon Department of Environmental Quality. 1995. WillametteRiver Basin Water Quality Study: Summary and Synthesisof Study Findings. Portland, OR: Oregon Department ofEnvironmental Quality.
Oregon Department of Wildlife and Fisheries. March 1996. 1993Pounds and Value of Commercially Caught Fish andShellfish Landed in Oregon.
Oregon State Marine Board. 1972. Pleasure Boating in Oregon.
Oregon State Marine Board. Oregon Recreational Boating Survey,1996.
Oregon State Marine Board. February 1997. Boating Recreation inOregon: Economic Importance, Trends, and Implicationsfor the Future. Prepared by Robert Neely, Bruce DeYoung,and Rebecca Johnson.
Oregon State Marine Board and Oregon State Parks. May 1, 1995. Willamette River Recreation Guide.
Oregon State Parks and Recreation Department. 1991.Recreational Needs Bulletin: Oregon State ComprehensiveOutdoor Recreation Plan.
Oregon State Sanitary Authority. May 1964. Report on WaterQuality and Waste Treatment Needs for the WillametteRiver. Portland, OR: Division of the State Board of Health.
The Research Group. June 1991. Oregon Angler Survey andEconomic Study. Prepared for Oregon Department of Fishand Wildlife.
Research Triangle Institute. 1997a. The Benefits of the Urban WetWeather Management Program. Prepared for the U.S.Environmental Protection Agency. Research Triangle Park,NC: Research Triangle Institute.
Research Triangle Institute. 1997b. “A Comparative Analysis ofBeneficial Use Attainment in Major U.S. Rivers and Streamsunder Alternative Water Pollution Control Scenarios.” Research Triangle Park, NC: Research Triangle Institute.

References
R-5
Rickert, D.A., V.C. Kennedy, S.W. McKenzie, and W.G. Hines. 1977. A Synoptic Survey of Trace Metals in BottomSediments of the Willamette River, Oregon . U.S.Geological Survey Circular 715-F. Arlington, VA: U.S.Department of the Interior.
Roach, Brian. March 1996. “Angler Benefits Along Four CaliforniaRivers: An Application of Tobit Analysis,” Davis, CA: University of California, Division of Environmental Studies.
Rowe, Robert W., et al. June 1985. Valuing Marine RecreationalFishing on the Pacific Coast. National Marine FisheriesService, Southwest Fisheries Center, LJ-85-18C.
Sanders, L.D., R.G. Walsh, and J.B. Loomis. 1990. “TowardEmpirical Estimation of the Total Value of ProtectingRivers.” Water Resources Research 26(7):1345-1357.
Schneider, Paul. 1997. “Clear Progress: 25 Years of the CleanWater Act.” Audubon 99(5):36-47, 106-107.
Sedell, J.R., and J.L. Frogatt. 1984. “Importance of StreamsideForests to Large Rivers: The Isolation of the WillametteRiver, Oregon, U.S.A. from its Floodplain by Snagging andStreamside Forest Removal.” Verh. Internat. Limnol.22:1828-1834.
Smith, V. Kerry. 1996. “Contingent Valuation and Different PublicGoods.” Land Economics 73(2):139-151.
Starbird, E.A., and L.J. Georgia. 1972. “A River Restored: Oregon’s Willamette.” National Geographic 141(6):816-835.
Starr, Ken, Oregon Water Resources Department. February 20,1997. Personal communication.
Stokey, Edith, and Richard Zeckhauser. 1978. A Primer for PolicyAnalysis. New York: W.W. Norton & Company, Inc.
Sutherland, Ronald J., and Richard G. Walsh. 1985. “Effect ofDistance on the Preservation Value of Water Quality.” Land Economics 61(3):281-291.
Szeramek, Jake, Oregon Water Resources Department. February 21, 1997. Personal communication.

A Benefits Assessment of Water Pollution Control Programs Since 1972:Part 1, The Benefits of Point Source Controls for Conventional Pollutants in Rivers and Streams
R-6
Tetra Tech. 1993. Support to the 1992 Needs Survey CSO CostAssessment, CSO Water Quality Modeling. EPA ContractNo. 68-C9-0013. Prepared for the U.S. EnvironmentalProtection Agency, Washington, DC.
Tetra Tech. 1997. Willamette River Basin: A Review of WaterQuality Improvements and Issues. Prepared for the U.S.Environmental Protection Agency. Fairfax, VA: Tetra Tech.
U.S. Department of Commerce, Bureau of the Census. 1991. Populated Places. Washington, DC.
U.S. Department of Commerce, Bureau of the Census. 1994. County and City Data Book. Washington, DC.
U.S. Department of Commerce, Bureau of the Census. 1999. Statistical Abstract of the United States . 119th ed. Washington, DC.
U.S. Department of Commerce. August 1997. Survey of CurrentBusiness. Washington, DC.
U.S. Environmental Protection Agency. 1976. The NationalCommission on Water Quality. The National ResidualsDischarge Inventory. NTIS #NCWQ 75/104. Springfield,VA.
U.S. Environmental Protection Agency. 1992a. NationalEnvironmental Benefits of Secondary Treatment: ARetrospective Look at Progress Made Under the 1992 CleanWater Act. Washington, DC.
U.S. Environmental Protection Agency. 1992b. Output Effects ofCostly Water Pollution Controls. Washington, DC: Office ofPolicy Planning and Evaluation, Economic Analysis andResearch Branch.
U.S. Environmental Protection Agency. 1993. Total WatersDatabase. Washington, DC: Office of Water.
U.S. Environmental Protection Agency. 1995. National WaterQuality Inventory: 1994 Report to Congress. EPA 841-R-95-005. Washington, DC: Office of Water.

References
R-7
U.S. Environmental Protection Agency. June 1996. EcologicalBenefits Assessment Model: Documentation Manual.Prepared for the U.S. Environmental Protection Agency,Office of Pollution Prevention and Toxics. Cambridge, MA:Industrial Economics, Incorporated.
U.S. Environmental Protection Agency. 1997. World Wide Website: <http://www.epa.gov.docs/epacfr40/contents.html>.
U.S. Geological Survey. 1992. Estimated Use of Water in theUnited States in 1990. Tables available from<http://www.h2o.usgs.gov/public/watuse>.
U.S. Geological Survey. 1996. Estimated Water Use and GeneralHydrologic Conditions for Oregon: 1985 and 1990, WaterResources Investigations Report 96-4080.
Walsh, Richard G., Donn M. Johnson, and John R. McKean. 1992. “Benefit Transfer of Outdoor Recreation Demand Studies,1968-1988,” Water Resources Research Vol. 28(3):707-713.
Westgarth, W.C., and M. Northcraft. 1964. Water Quality andWaste Treatment Needs for the Willamette River . ReportOregon State Sanitary Authority.
Wittaker, Carol, James River Corporation. Personalcommunication. February 24, 1997.
Yon, Don, Oregon Department of Environmental Quality. Personalcommunication. February 26, 1997.