Embed Size (px)
Citation preview
ARTICLE IN PRESS
Available at www.sciencedirect.com
WA T E R R E S E A R C H 4 0 ( 2 0 0 6 ) 1 6 2 – 1 7 4
0043-1354/$ - see frodoi:10.1016/j.watres
�Corresponding aE-mail addresses:
journal homepage: www.elsevier.com/locate/watres
A bench-scale aeration study using batch reactorson swine manure stabilization to control odour inpost treatment storage
ZhiJian Zhanga, Jun Zhub,�, Keum J. Parkc
aDepartment of Environmental Engineering, Zhejiang University, Hangzhou 310029, PR ChinabDepartment of Biosystems and Agricultural Engineering, Southern Research and Outreach Center, University of Minnesota,
35838 120th Street, Waseca, MN 56093, USAcDepartment of Biomachinery Engineering, Sunchon National University, South Korea
a r t i c l e i n f o
Article history:
Received 22 September 2003
Received in revised form
24 January 2005
Accepted 8 November 2005
Available online 19 December 2005
Keywords:
Manure
Stabilization
Aeration
Odour generation potential
nt matter & 2005 Elsevie.2005.11.004
uthor. Tel.: +1 507 837 [email protected] (Z
A B S T R A C T
A bench-scale study on swine manure stabilization for odour control was conducted using
batch aeration reactors. In trial 1, two aeration lengths, i.e., 0.5 and 4.0 day, were used
under uncontrolled ambient temperature that increased gradually over the experimental
period. While in trial 2, a 16.0-day aeration scheme was employed under constant 17 1C. An
airflow rate of 1.2 L/s/m3 was used for both trials to aerate batch reactors containing
finishing pig manure with initial total solids (TS) levels ranging from 0.5 to 4.0%. Manure
stabilization during the 90-day post-treatment storage was evaluated by the changes in
organic materials, nitrogen and volatile fatty acids (VFA). The odour generation potential in
the treated manure was determined by the changes in VFA. Up to 827 mL of liquid was lost
due to aeration related foaming. The reductions in total volatile solids (TVS), 5-day
biochemical oxygen demand (BOD5), total Kjeldahl nitrogen (TKN) and VFA during storage
were improved when aeration length increased. Low solids levels offered a more
advantageous circumstance for manure stabilization and odour control. Biodegradation
of organic matter, removal of nitrogen, and breakdown of VFA would increase with
increasing ambient temperature. VFA removals in manure under 16.0-day aeration were
higher than those under 0.5- and 4.0-day aeration; however, VFA regeneration started to
exceed its consumption on day 20 (4 days after the aeration treatment). BOD5 was the best
estimate of VFA concentration in the aerated manure during storage. The 4.0-day aeration
scheme was sufficient to stabilize manure to effectively assuage odour generation potential
during the 90-day storage under increasing ambient temperature conditions.
& 2005 Elsevier Ltd. All rights reserved.
1. Introduction
Presently, cost-effective engineering technologies that can be
used on a massive scale for animal manure treatment are still
in the process of optimization for energy and cost savings. As
such, manure stabilization becomes one of the popular
r Ltd. All rights reserved.
6; fax: +1 507 835 3622.. Zhang), zhuxx034@um
options for treating manure before disposal; however, the
associated odour issue is considered as a ‘bottle-neck’ in the
application of this treatment.
Aerobic treatment is regarded as any process that attempts
to improve the supply of oxygen to aerobic microorganisms
responsible for the conversion of waste into a relatively
n.edu (J. Zhu), [email protected] (K.J. Park).
ARTICLE IN PRESS
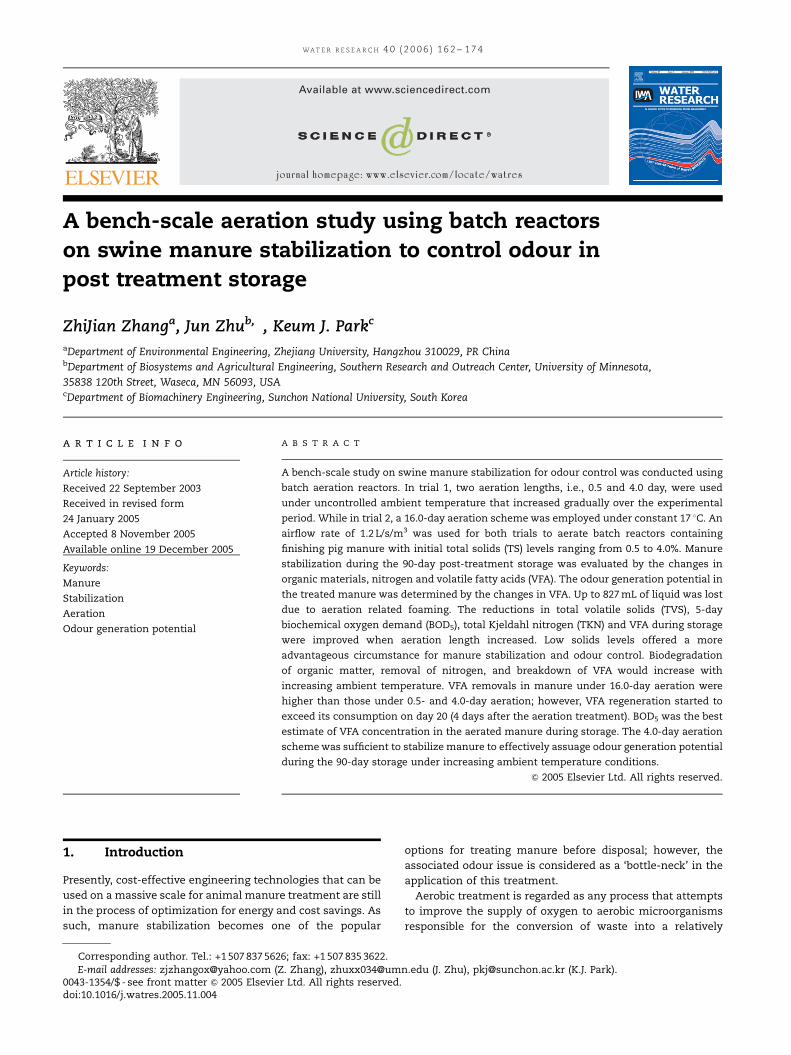
Insoluble organics
Soluble organics
Hydrolysis
Enzymes Assimilation
Decay
Microorganism
+ Soluble organics
Nitrogenous
component
Sulfuric
component
VFA and
carbohydrate
Aeration
Aerobic reactor
CO2, H2O, SO4, NH4/NH3 (or NO3) and other oxides
Biodegrad
ation
Aeration process storage
Anaerobic reactor
Biodegrad
ation CO2, H2O, CH4, H2S, NH4, N2, sulfides, and other reductants
Post-aeration/open storage
Assimilation
Fig. 1 – Possible manure stabilization for odor control in storage (based on references from Burton, 1992; Zhang et al., 1997;
Grady et al., 1999; Westerman and Bicudo, 2002).
WAT ER R ES E A R C H 40 (2006) 162– 174 163
biologically stable end product (Robinson, 1974). An overview
of the biological processes involved in manure stabilization in
storage is pictured in Fig. 1. The aeration process prevents or
reduces the activity of anaerobic microorganisms that convert
the waste into incomplete end products, many of which are
noxious, odourous, or toxic (Robinson, 1974; Burton, 1992;
Zhu, 2000). Therefore, aeration process may offer a pathway
for biologically stabilizing manure for odour control.
Odour releases appear to be related to manure total solids
(TS) content, e.g., 2.7 OUE s�1 m�2 for 0.45% TS, and
1.9 OUE s�1 m�2 for 0.34% TS in swine lagoon water (Lim et
al., 2003). Odour control should be adequate if O2 is supplied
to satisfy 50% of the chemical oxygen demand (Westerman
and Zhang, 1997). Generally, total volatile solids (TVS) would
have more contribution to odour generation than the coarse
fraction of TS during decomposition of manure by aerobic
treatment process (Burton, 1992; Zhang and Westerman,
1997). Research found that release of ammonia and the
reduced malodourous gases to which odour concentrations
proportionally responded was directly proportional to the
volatile solids loading rate (Lim et al., 2003). Thus, biodegra-
dation of TVS by aeration should be beneficial to manure
stabilization.
Odourous nitrogen (N) compounds, such as volatile amines,
and part of volatile fatty acids (VFA) may accumulate under
prevailing anaerobic conditions (Zhu, 2000). While under
aerobic conditions, the nitrogen compounds (proteins, pep-
tides, and amino acids) could be converted to ammonium and
then oxidized to nitrate eventually (Westerman and Zhang,
1997). Ammonia stripping and nitrogen gas emission (includ-
ing nitrous oxide) by the nitrification–denitrification process
are commonly considered as the two most important path-
ways available for nitrogen losses associated with various
aeration technologies (Hashimoto, 1974; Loynachan et al.,
1976; Munch et al., 1996; Beline et al., 1999; Bernet et al., 2000;
Ni et al., 2000). Therefore, it can be inferred that aeration
process could enhance the stability of aerobically treated
manure by removing nitrogen, thereby reducing odour
emission.
Odour may be assessed by olfactometry evaluation (scored
by a group of panelists) (Lim et al., 2003; Zhang et al., 1997;
Burton et al., 1998). However, when the odour offensiveness
test is accepted as a measurement of manure odour, its
frequent use for routine monitoring of the performance of
treatment systems is normally too expensive, because of the
panelists’ time involved. Although a variety of compounds in
swine manure are responsible for producing malodour (such
as alcohols, carbonyl compounds, sulfur-containing com-
pounds, fatty acids, aromatic carboxylic acids, phenols and
indoles etc.), VFA has been found to be a suitable indicator of
manure odours (Williams, 1984; Zhu et al., 1999). Uses of VFA
were numerously reported to evaluate the effectiveness of
techniques for swine manure odour reduction. Some of the
typical studies include continuous aerobic treatment at pilot-
scale (Sneath et al., 1992) or farm scale aeration plants
(Burton and Sneath, 1995), aerated ponds (Westerman and
Bicudo, 2002), a laboratory study of surface aeration for
anaerobic lagoons (Zhang et al, 1997), and anaerobic sequen-
cing batch reactors (Zhang et al., 2000). Research showed that
VFA was formed mainly from the solids in the smallest
particle size in manure by microbial degradation (Yasuhara et
al., 1984; Zhu et al., 2001). Also, the biochemical oxygen
demand (BOD5) concentrations correlated well with VFA in
the manure (Zhu et al., 2001). Since aeration treatment
enhances the decomposition of organic compounds in
manure, evaluating the effectiveness of odour control by
specially designed aeration treatments based on the changes
of solids and BOD5 in the treated manure should be
considered appropriate.
The aerobic–thermophilic treatment through semi-contin-
uous feeding with a 6-day hydraulic retention time was
reported for stabilization of liquid manure (Burton, 1997).
Mean residence times of between 1.7 and 6.3 days under the
target aeration level, Eh of +91 to +191 mV, could maintain 28
days of subsequent anaerobic storage without offensive
odour in the treated pig slurry (TS ranging from 1.9% to
3.2%) (Burton et al., 1998). However, high operation cost due
mainly to energy consumption could impair farmers’ en-
thusiasm. Post-aeration storage is a process in which micro-
organisms are used under anaerobic conditions to convert
biodegradable organic materials to odourless gases, such as
methane and carbon dioxide, and nonbiodegradable solids
(Zhu, 2000; Williams et al., 1984). It thus implies that
the manure that has been biodegraded to some extent by
ARTICLE IN PRESS
WA T E R R E S E A R C H 4 0 ( 2 0 0 6 ) 1 6 2 – 1 7 4164
short-term aeration could continue its decomposition during
the post-aeration storage. Little information is available in
relation to the length of short-term aeration that affects
manure stabilization in the subsequent storage.
In this paper, a bench-scale study was conducted to reveal
the effect of short-term aeration treatment on manure
stabilization and reduction in odour generation potential
based on the analysis of characteristics of organic materials,
nitrogen, and VFA during the 90-day post-treatment storage.
The experiments consisted of 0.5-, 4.0-, and 16.0-day aeration
schemes using batch reactors filled with finishing pig manure
at initial TS levels ranging from 0.5% to 4.0%. The manure
stabilization was evaluated by the changes in TVS, BOD5, total
Kjeldahl nitrogen (TKN) and VFA. Besides, VFA was also used
to evaluate the odour generation potential.
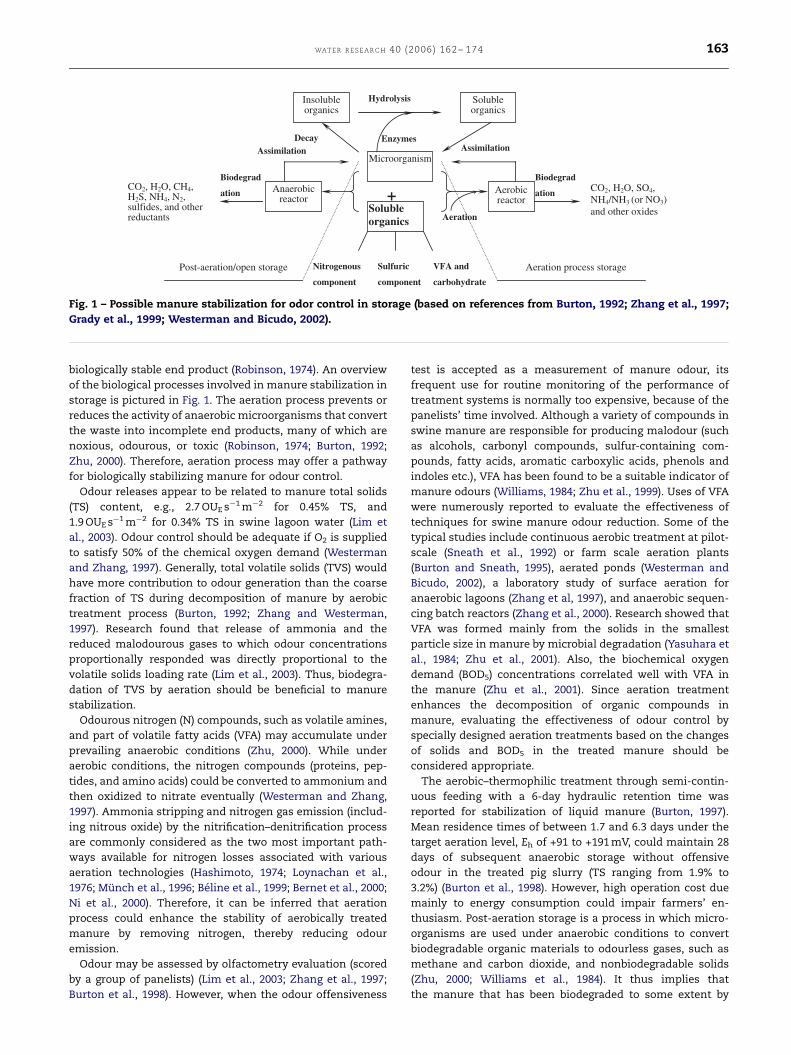
pH meter
DO meter
Stirrer
15.3 cm
Air flow meter
Air pump
Tygon tube
Air bubble stone
91.6 cm
Fig. 2 – Schematic of the aeration apparatus used in the
experiment.
2. Materials and methods
2.1. Manure sources
Two sources of fresh finishing manure were available for the
study in southern Minnesota. One source was located in
Waseca for trial 1, while the other in New Richland for trial 2.
Pigs at both sources were fed on a regular corn (71%) soybean
(25%) meal with other ingredients including tallow, mineral
and vitamin. The finishing facilities at both locations featured
a pull–plug manure handling system. Prior to the experiment,
the collected manure was screened using a sieve with 2 mm
openings to remove coarse materials. The characteristic of
the sieved liquid manure is shown in Table 1. In general, the
manure compositions for the two trials did not differ much
from each other. However, the pH in the manure for trial 2
was 0.5 unit higher than that for trial 1 while VFA in the
manure for trial 2 was half that in the manure for trial 1.
2.2. Experimental setup
The screened manure for both trials was categorized into four
solids levels, i.e., 0.5, 1.0, 2.0, and 4.0% by diluting the manure
with tap water. Relatively speaking, the nutrients and organic
matter concentrations (data not shown) in tap water were
considered negligible. Therefore, the TKN, VFA, and BOD5
concentrations in the diluted manure at the four TS levels
before experiment were assumed to be linearly proportional
to the initial concentrations in the screened manure.
The aeration apparatus simulating a batch reactor for both
trials was shown in Fig. 2. The columns were made of PVC
materials, 91.6 cm in height and 15.3 cm in internal diameter.
Table 1 – Characteristics of the screened finishing manure for
Manure pH TS TSS TVS TVS/TS
TKN NH4–N
(%) (%) (%) (mgN/L)
(mg NL)
Trial 1 7.26 4.06 3.28 2.60 0.64 6429 5012
Trial 2 7.74 4.50 3.45 2.84 0.63 5325 4426
Manure in each column was 76.3 cm deep with the top
15.3 cm as a headspace. For trial 1, two aeration lengths were
used to treat the manure, i.e., 0.5 and 4.0 days. The
experiment was thus composed of a 4�2 factorial design,
and a total of 16 reactors for the batch were built to
accommodate duplication. Trial 1 started from May 23 to
August 21. The columns in the experiment were housed
under ambient temperatures ranging from 15 1C to 32 1C
during both aeration and post-aeration storage. For trial 2,
the aeration length was set at 16 days. Totally four columns
were used for four solids levels without duplication under a
constant room temperature of 17 1C. Aeration for both trials
was realized by pumping air through columns from the
bottom using an air pump (Catalog No. 13-875-220, Fisher
Scientific) at an airflow rate of 1.2 L/s/m3. For trial 2, the
dissolved oxygen concentration in the manure was measured
during aeration using an oxygen meter (Extech, Model
407510). After the treatment, the manure was left in the
original columns up to 90 days to simulate the long-term
post-aeration storage before land application.
2.3. Sampling and analysis
Two well-mixed samples from the sieved manure were
collected one day before the experiment, representing the
the two trials
BOD5 VFA VFA/TKN
VFA/BOD5
COD TP
/ (mg/L) (mg/L) (mg/L) (mg P/L)
20608 18397 2.86 0.89 48392 1581
19200 9570 1.80 0.50 32400 1603
ARTICLE IN PRESS
WAT ER R ES E A R C H 40 (2006) 162– 174 165
initial manure characteristics for the two individual trials.
During aeration and post-aeration storage, liquid manure
samples from each column were collected on day 5, 10, 20, 40,
60, and 90. All liquid samples, including the two initial
samples, were drawn from a location approximately half way
down from the liquid surface during mixing using a
motorized paddle-stirrer (Tline Laboratory Stirrer, Model
102). At the same time, the manure pH was measured by a
DIGI-SENSE digital pH/temperature/mV/ORP meter (catalog
number: 5938-10, Coleparmer Company, Vernon Hills, Illinois,
USA). The samples were stored at �20 1C immediately after
collection, and only thawed and allowed to reach room
temperature prior to analysis.
American Public and Health Association (APHA) Standard
methods were used to run the liquid manure sample analyses
for TS, TVS, BOD5, and TKN (APHA et al., 1998). According to
Hach (Hach Company, 1993), the VFA measurement is based on
esterification of the carboxylic acids present in the sample
followed by colorimetric determination of the esters produced
by the ferric hydroxamate reaction. The concentration of VFA
was measured at a wavelength of 495 nm by a DR/3000
spectrophotometer. All volatile acids are reported as their
equivalent mg/L acetic acid. The concentration of chemical
oxygen demand (COD) was measured according to the dichro-
mate reflux method presented by Hach (Hach Company, 1993).
The removal efficiency (R) for solids, BOD5, TKN and VFA
was determined with a presumption that the chemical and
biochemical compositions of the initial screened manure
(Table 1) remained unchanged throughout the duration of
experiment. Therefore, the percent removal efficiency was
calculated by dividing the difference between the initial and
measured concentrations of a concerned parameter during
storage by the initial concentration, and then multiplied by
100. A formula for this calculation is presented below:
Rð%Þ ¼Cin � Ct
Cin� 100%,
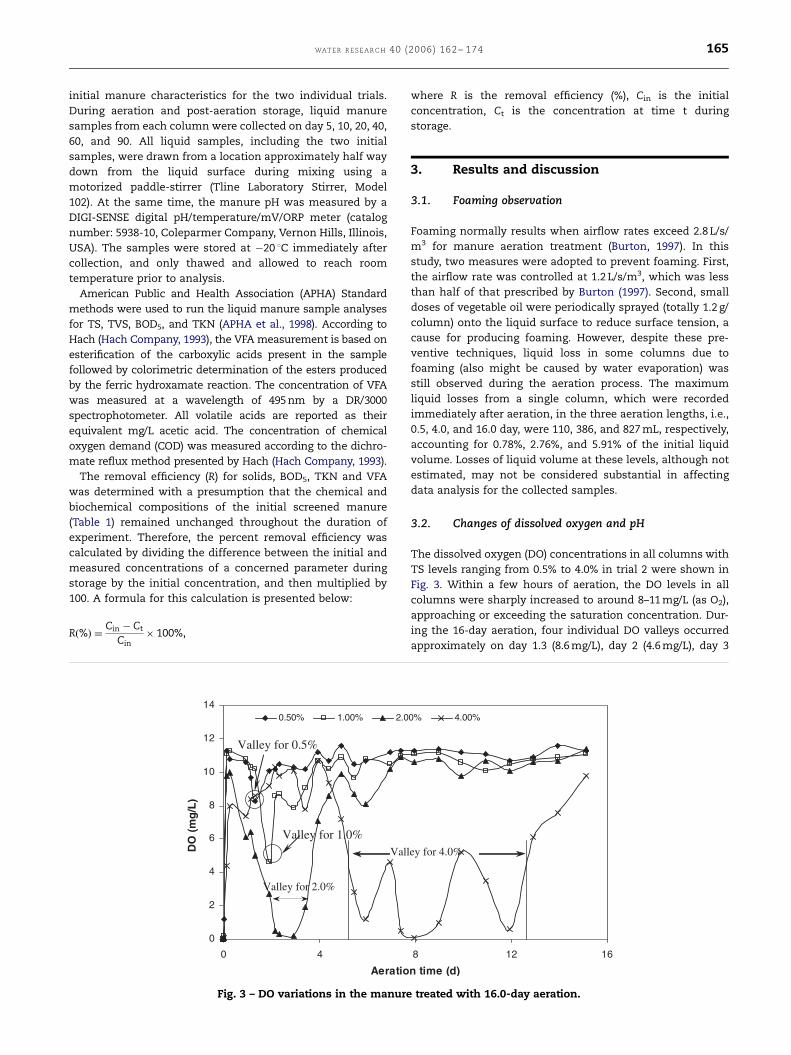
0
2
4
6
8
10
12
14
0 4
Aeratio
DO
(m
g/L
)
0.50% 1.00% 2.0
Valley for 2.0%
Vall
Valley for 1.0%
Valley for 0.5%
Fig. 3 – DO variations in the manure
where R is the removal efficiency (%), Cin is the initial
concentration, Ct is the concentration at time t during
storage.
3. Results and discussion
3.1. Foaming observation
Foaming normally results when airflow rates exceed 2.8 L/s/
m3 for manure aeration treatment (Burton, 1997). In this
study, two measures were adopted to prevent foaming. First,
the airflow rate was controlled at 1.2 L/s/m3, which was less
than half of that prescribed by Burton (1997). Second, small
doses of vegetable oil were periodically sprayed (totally 1.2 g/
column) onto the liquid surface to reduce surface tension, a
cause for producing foaming. However, despite these pre-
ventive techniques, liquid loss in some columns due to
foaming (also might be caused by water evaporation) was
still observed during the aeration process. The maximum
liquid losses from a single column, which were recorded
immediately after aeration, in the three aeration lengths, i.e.,
0.5, 4.0, and 16.0 day, were 110, 386, and 827 mL, respectively,
accounting for 0.78%, 2.76%, and 5.91% of the initial liquid
volume. Losses of liquid volume at these levels, although not
estimated, may not be considered substantial in affecting
data analysis for the collected samples.
3.2. Changes of dissolved oxygen and pH
The dissolved oxygen (DO) concentrations in all columns with
TS levels ranging from 0.5% to 4.0% in trial 2 were shown in
Fig. 3. Within a few hours of aeration, the DO levels in all
columns were sharply increased to around 8–11 mg/L (as O2),
approaching or exceeding the saturation concentration. Dur-
ing the 16-day aeration, four individual DO valleys occurred
approximately on day 1.3 (8.6 mg/L), day 2 (4.6 mg/L), day 3
8 12 16
n time (d)
0% 4.00%
ey for 4.0%
treated with 16.0-day aeration.
ARTICLE IN PRESS
WA T E R R E S E A R C H 4 0 ( 2 0 0 6 ) 1 6 2 – 1 7 4166
(0.2 mg/L), and between day 6 (1.2 mg/L) and 12 (0.6 mg/L) for
manure with initial TS content of 0.5%, 1.0%, 2.0%, and 4.0%,
respectively. It appeared that the higher the solids content,
the longer the time was needed to reach DO valleys featuring
lower DO values. This could be due to the abundance of
nutrients in manure of high solids content with which both
aerobic population and activity were enhanced by aeration,
leading to rapid depletion of oxygen available in the solution
(Loynachan et al., 1976). Also, it was reported that higher
organic solids content in the wastewater generally would
impede oxygen transfer (Westerman and Zhang, 1997),
leading to low DO in the liquid. These two factors may
explain the observed low values of DO valley in the manure of
high solids content.
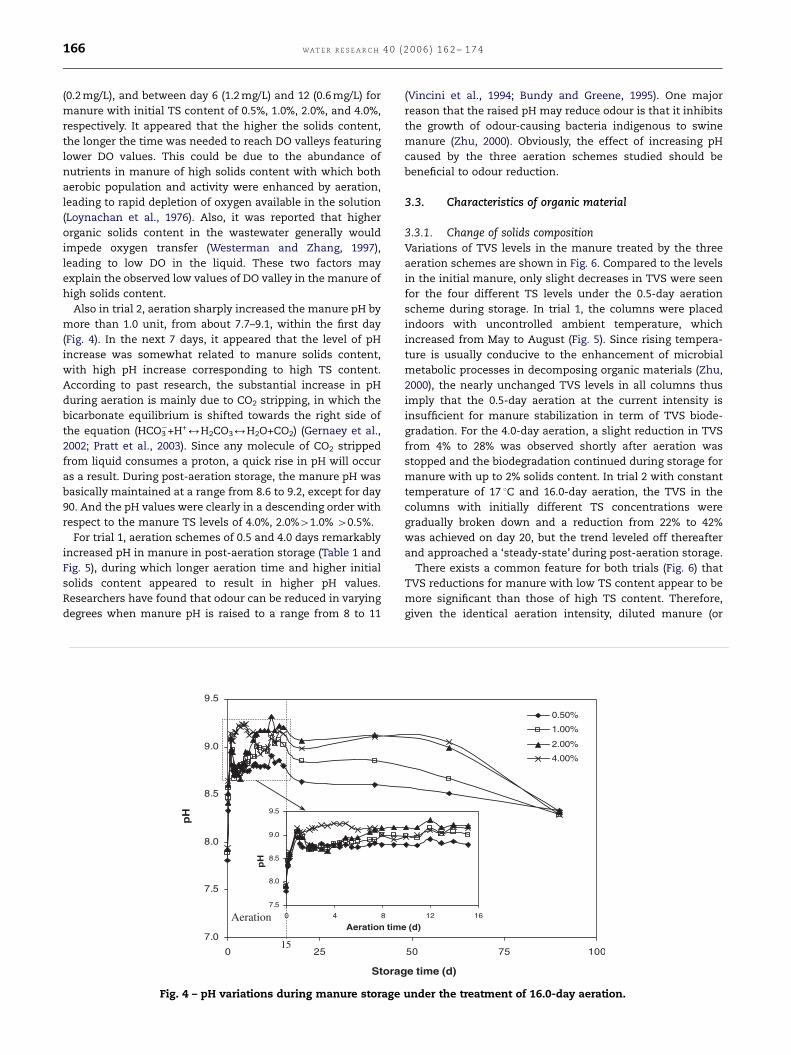
Also in trial 2, aeration sharply increased the manure pH by
more than 1.0 unit, from about 7.7–9.1, within the first day
(Fig. 4). In the next 7 days, it appeared that the level of pH
increase was somewhat related to manure solids content,
with high pH increase corresponding to high TS content.
According to past research, the substantial increase in pH
during aeration is mainly due to CO2 stripping, in which the
bicarbonate equilibrium is shifted towards the right side of
the equation (HCO3�+H+2H2CO32H2O+CO2) (Gernaey et al.,
2002; Pratt et al., 2003). Since any molecule of CO2 stripped
from liquid consumes a proton, a quick rise in pH will occur
as a result. During post-aeration storage, the manure pH was
basically maintained at a range from 8.6 to 9.2, except for day
90. And the pH values were clearly in a descending order with
respect to the manure TS levels of 4.0%, 2.0%41.0% 40.5%.
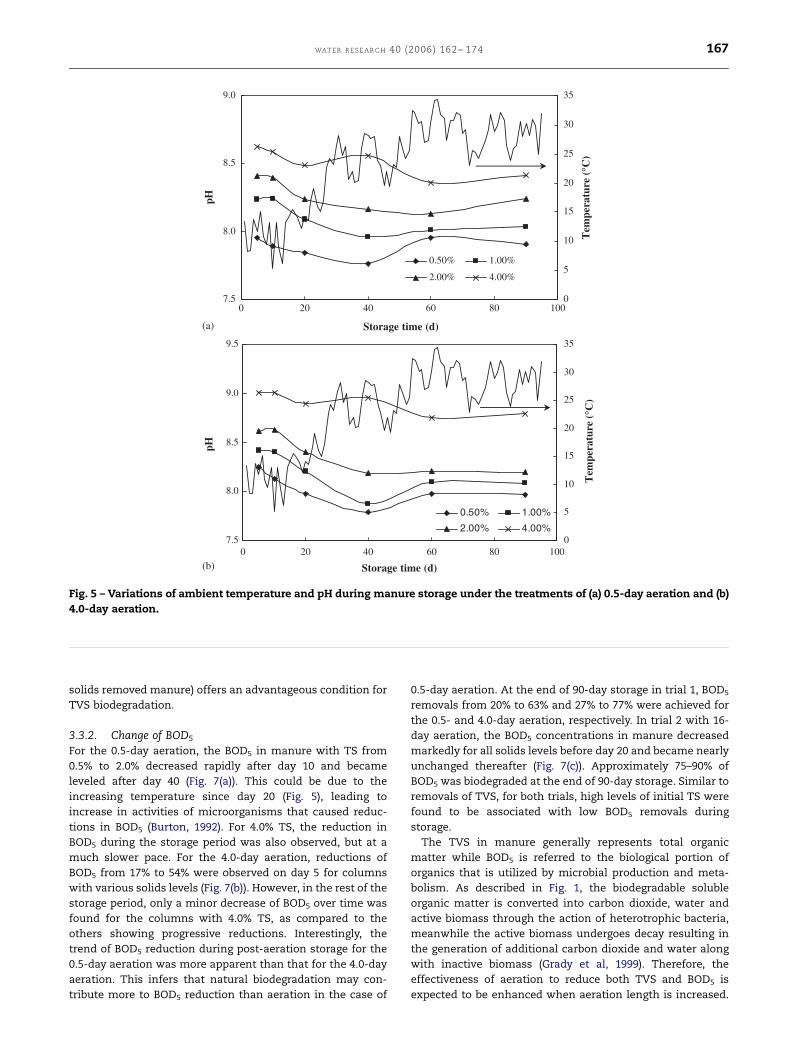
For trial 1, aeration schemes of 0.5 and 4.0 days remarkably
increased pH in manure in post-aeration storage (Table 1 and
Fig. 5), during which longer aeration time and higher initial
solids content appeared to result in higher pH values.
Researchers have found that odour can be reduced in varying
degrees when manure pH is raised to a range from 8 to 11
7.0
7.5
8.0
8.5
9.0
9.5
0 25
pH
7.5
8.0
8.5
9.0
9.5
0 4 8
pH
Aeration
15
Aeration tim
Storag
Fig. 4 – pH variations during manure storage
(Vincini et al., 1994; Bundy and Greene, 1995). One major
reason that the raised pH may reduce odour is that it inhibits
the growth of odour-causing bacteria indigenous to swine
manure (Zhu, 2000). Obviously, the effect of increasing pH
caused by the three aeration schemes studied should be
beneficial to odour reduction.
3.3. Characteristics of organic material
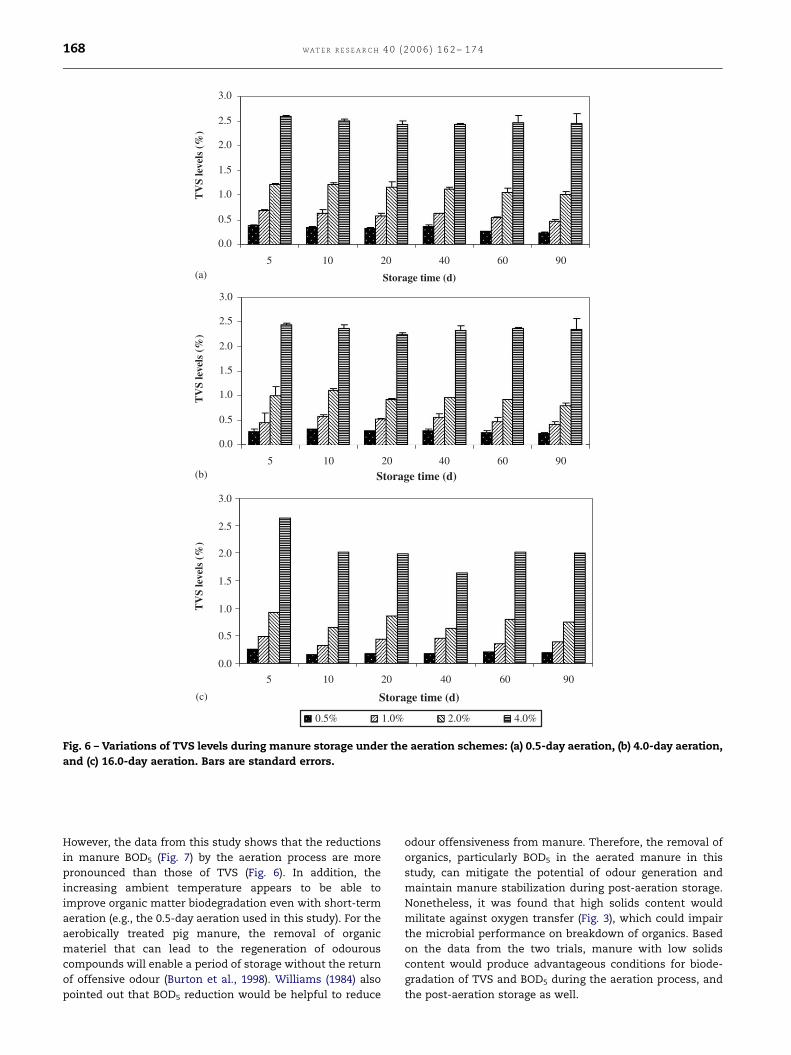
3.3.1. Change of solids compositionVariations of TVS levels in the manure treated by the three
aeration schemes are shown in Fig. 6. Compared to the levels
in the initial manure, only slight decreases in TVS were seen
for the four different TS levels under the 0.5-day aeration
scheme during storage. In trial 1, the columns were placed
indoors with uncontrolled ambient temperature, which
increased from May to August (Fig. 5). Since rising tempera-
ture is usually conducive to the enhancement of microbial
metabolic processes in decomposing organic materials (Zhu,
2000), the nearly unchanged TVS levels in all columns thus
imply that the 0.5-day aeration at the current intensity is
insufficient for manure stabilization in term of TVS biode-
gradation. For the 4.0-day aeration, a slight reduction in TVS
from 4% to 28% was observed shortly after aeration was
stopped and the biodegradation continued during storage for
manure with up to 2% solids content. In trial 2 with constant
temperature of 17 1C and 16.0-day aeration, the TVS in the
columns with initially different TS concentrations were
gradually broken down and a reduction from 22% to 42%
was achieved on day 20, but the trend leveled off thereafter
and approached a ‘steady-state’ during post-aeration storage.
There exists a common feature for both trials (Fig. 6) that
TVS reductions for manure with low TS content appear to be
more significant than those of high TS content. Therefore,
given the identical aeration intensity, diluted manure (or
50 75 100
0.50%
1.00%
2.00%
4.00%
12 16
e (d)
e time (d)
under the treatment of 16.0-day aeration.
ARTICLE IN PRESS
7.5
8.0
8.5
9.0
0 20 40 60 80 100
pH
0
5
10
15
20
25
30
35
0.50% 1.00%
2.00% 4.00%
7.5
8.0
8.5
9.0
9.5
0 20 40 60 80 100
pH
0
5
10
15
20
25
30
35
0.50% 1.00%
2.00% 4.00%
Storage time (d)
Storage time (d)
Tem
pera
ture
(°C
)T
empe
ratu
re (
°C)
(a)
(b)
Fig. 5 – Variations of ambient temperature and pH during manure storage under the treatments of (a) 0.5-day aeration and (b)
4.0-day aeration.
WAT ER R ES E A R C H 40 (2006) 162– 174 167
solids removed manure) offers an advantageous condition for
TVS biodegradation.
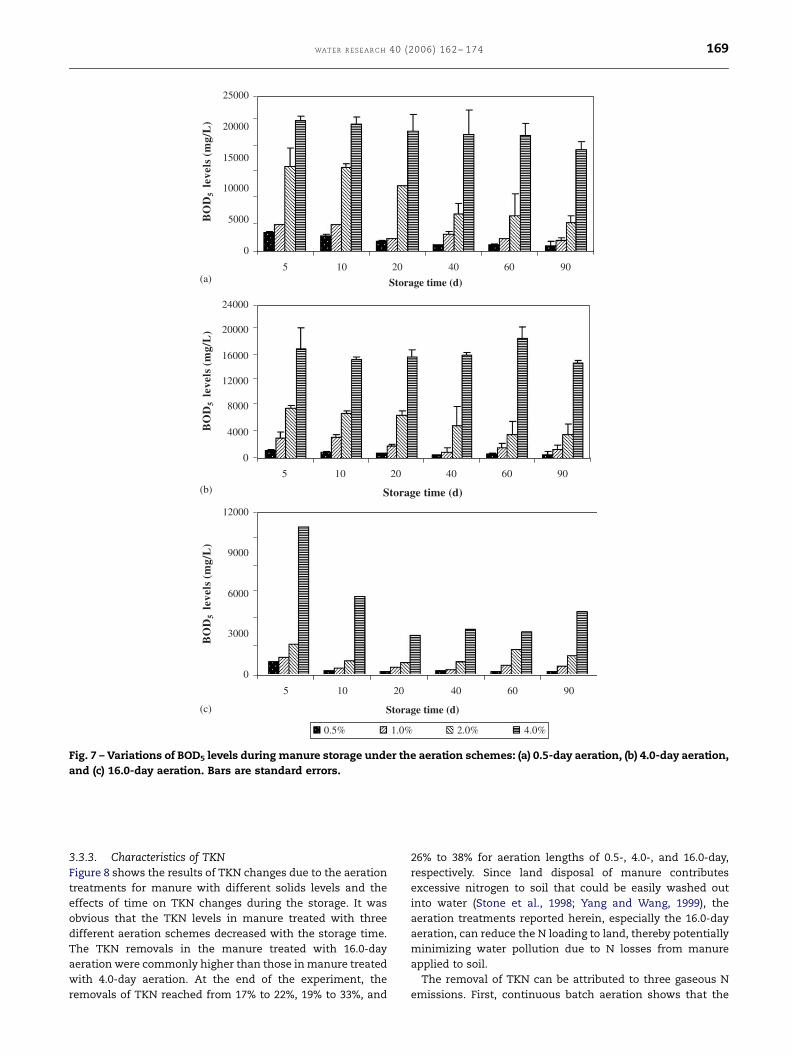
3.3.2. Change of BOD5
For the 0.5-day aeration, the BOD5 in manure with TS from
0.5% to 2.0% decreased rapidly after day 10 and became
leveled after day 40 (Fig. 7(a)). This could be due to the
increasing temperature since day 20 (Fig. 5), leading to
increase in activities of microorganisms that caused reduc-
tions in BOD5 (Burton, 1992). For 4.0% TS, the reduction in
BOD5 during the storage period was also observed, but at a
much slower pace. For the 4.0-day aeration, reductions of
BOD5 from 17% to 54% were observed on day 5 for columns
with various solids levels (Fig. 7(b)). However, in the rest of the
storage period, only a minor decrease of BOD5 over time was
found for the columns with 4.0% TS, as compared to the
others showing progressive reductions. Interestingly, the
trend of BOD5 reduction during post-aeration storage for the
0.5-day aeration was more apparent than that for the 4.0-day
aeration. This infers that natural biodegradation may con-
tribute more to BOD5 reduction than aeration in the case of
0.5-day aeration. At the end of 90-day storage in trial 1, BOD5
removals from 20% to 63% and 27% to 77% were achieved for
the 0.5- and 4.0-day aeration, respectively. In trial 2 with 16-
day aeration, the BOD5 concentrations in manure decreased
markedly for all solids levels before day 20 and became nearly
unchanged thereafter (Fig. 7(c)). Approximately 75–90% of
BOD5 was biodegraded at the end of 90-day storage. Similar to
removals of TVS, for both trials, high levels of initial TS were
found to be associated with low BOD5 removals during
storage.
The TVS in manure generally represents total organic
matter while BOD5 is referred to the biological portion of
organics that is utilized by microbial production and meta-
bolism. As described in Fig. 1, the biodegradable soluble
organic matter is converted into carbon dioxide, water and
active biomass through the action of heterotrophic bacteria,
meanwhile the active biomass undergoes decay resulting in
the generation of additional carbon dioxide and water along
with inactive biomass (Grady et al, 1999). Therefore, the
effectiveness of aeration to reduce both TVS and BOD5 is
expected to be enhanced when aeration length is increased.
ARTICLE IN PRESS
(c)
(b)
(a)
Storage time (d)
Storage time (d)
Storage time (d)
4.0%2.0%1.0%0.5%
900 600 40 25 1
3.0
2.5
2.0
1.5
1.0
0.5
0.0
00 90 60 40 25 1
3.0
2.5
2.0
1.5
1.0
0.5
0.0
TV
S le
vels
(%
)T
VS
leve
ls (
%)
TV
S le
vels
(%
)
00 90 60 40 25 1
3.0
2.5
2.0
1.5
1.0
0.5
0.0
Fig. 6 – Variations of TVS levels during manure storage under the aeration schemes: (a) 0.5-day aeration, (b) 4.0-day aeration,
and (c) 16.0-day aeration. Bars are standard errors.
WA T E R R E S E A R C H 4 0 ( 2 0 0 6 ) 1 6 2 – 1 7 4168
However, the data from this study shows that the reductions
in manure BOD5 (Fig. 7) by the aeration process are more
pronounced than those of TVS (Fig. 6). In addition, the
increasing ambient temperature appears to be able to
improve organic matter biodegradation even with short-term
aeration (e.g., the 0.5-day aeration used in this study). For the
aerobically treated pig manure, the removal of organic
materiel that can lead to the regeneration of odourous
compounds will enable a period of storage without the return
of offensive odour (Burton et al., 1998). Williams (1984) also
pointed out that BOD5 reduction would be helpful to reduce
odour offensiveness from manure. Therefore, the removal of
organics, particularly BOD5 in the aerated manure in this
study, can mitigate the potential of odour generation and
maintain manure stabilization during post-aeration storage.
Nonetheless, it was found that high solids content would
militate against oxygen transfer (Fig. 3), which could impair
the microbial performance on breakdown of organics. Based
on the data from the two trials, manure with low solids
content would produce advantageous conditions for biode-
gradation of TVS and BOD5 during the aeration process, and
the post-aeration storage as well.
ARTICLE IN PRESS
0
5000
10000
15000
20000
25000
5 10 20 40 60 90
BO
D5
leve
ls (
mg/
L)
BO
D5
leve
ls (
mg/
L)
BO
D5
leve
ls (
mg/
L)
4000
8000
12000
16000
20000
24000
5 10 20 40 60 90
0
3000
6000
9000
12000
5 10 20 40 60 90
Storage time (d)
0.5% 1.0% 2.0% 4.0%
0
Storage time (d)
Storage time (d)(a)
(b)
(c)
Fig. 7 – Variations of BOD5 levels during manure storage under the aeration schemes: (a) 0.5-day aeration, (b) 4.0-day aeration,
and (c) 16.0-day aeration. Bars are standard errors.
WAT ER R ES E A R C H 40 (2006) 162– 174 169
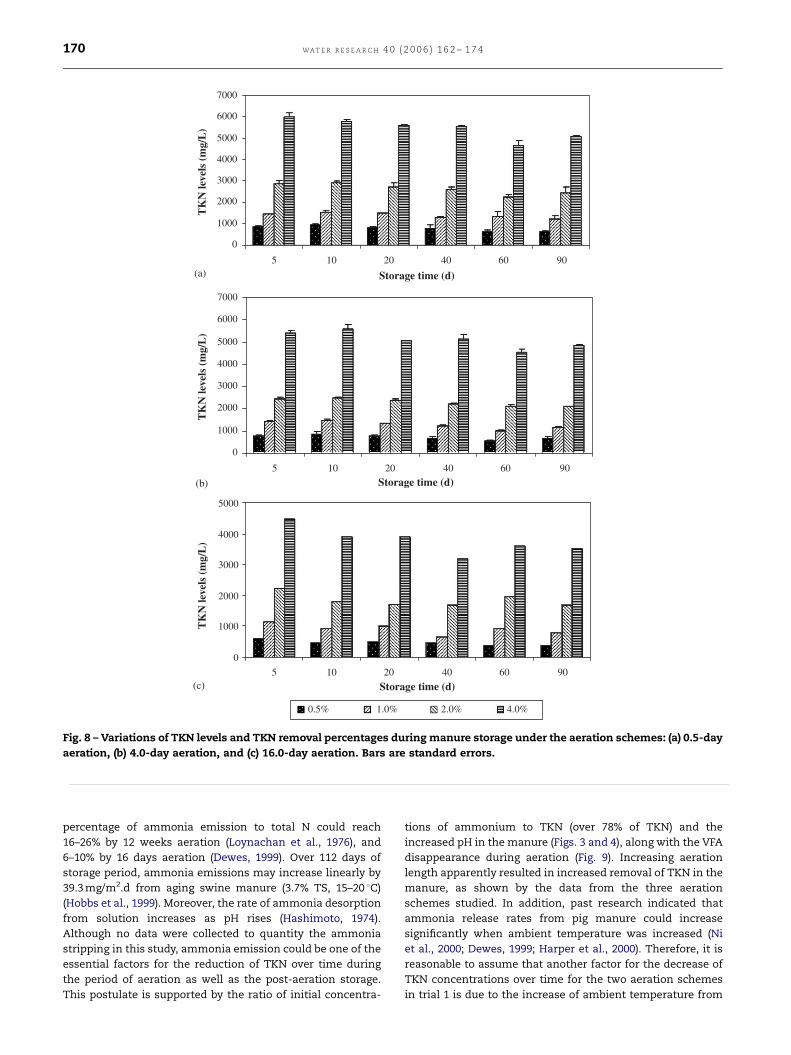
3.3.3. Characteristics of TKNFigure 8 shows the results of TKN changes due to the aeration
treatments for manure with different solids levels and the
effects of time on TKN changes during the storage. It was
obvious that the TKN levels in manure treated with three
different aeration schemes decreased with the storage time.
The TKN removals in the manure treated with 16.0-day
aeration were commonly higher than those in manure treated
with 4.0-day aeration. At the end of the experiment, the
removals of TKN reached from 17% to 22%, 19% to 33%, and
26% to 38% for aeration lengths of 0.5-, 4.0-, and 16.0-day,
respectively. Since land disposal of manure contributes
excessive nitrogen to soil that could be easily washed out
into water (Stone et al., 1998; Yang and Wang, 1999), the
aeration treatments reported herein, especially the 16.0-day
aeration, can reduce the N loading to land, thereby potentially
minimizing water pollution due to N losses from manure
applied to soil.
The removal of TKN can be attributed to three gaseous N
emissions. First, continuous batch aeration shows that the
ARTICLE IN PRESS
0
1000
2000
3000
4000
5000
6000
7000
5 10 20 40 60 90
0
1000
2000
3000
4000
5000
6000
7000
5 10 20 40 60 90
0
1000
2000
3000
4000
5000
5 10 20 40 60 90
0.5% 1.0% 2.0% 4.0%
Storage time (d)
Storage time (d)
Storage time (d)
TK
N le
vels
(m
g/L
)T
KN
leve
ls (
mg/
L)
TK
N le
vels
(m
g/L
)
(a)
(b)
(c)
Fig. 8 – Variations of TKN levels and TKN removal percentages during manure storage under the aeration schemes: (a) 0.5-day
aeration, (b) 4.0-day aeration, and (c) 16.0-day aeration. Bars are standard errors.
WA T E R R E S E A R C H 4 0 ( 2 0 0 6 ) 1 6 2 – 1 7 4170
percentage of ammonia emission to total N could reach
16–26% by 12 weeks aeration (Loynachan et al., 1976), and
6–10% by 16 days aeration (Dewes, 1999). Over 112 days of
storage period, ammonia emissions may increase linearly by
39.3 mg/m2.d from aging swine manure (3.7% TS, 15–20 1C)
(Hobbs et al., 1999). Moreover, the rate of ammonia desorption
from solution increases as pH rises (Hashimoto, 1974).
Although no data were collected to quantity the ammonia
stripping in this study, ammonia emission could be one of the
essential factors for the reduction of TKN over time during
the period of aeration as well as the post-aeration storage.
This postulate is supported by the ratio of initial concentra-
tions of ammonium to TKN (over 78% of TKN) and the
increased pH in the manure (Figs. 3 and 4), along with the VFA
disappearance during aeration (Fig. 9). Increasing aeration
length apparently resulted in increased removal of TKN in the
manure, as shown by the data from the three aeration
schemes studied. In addition, past research indicated that
ammonia release rates from pig manure could increase
significantly when ambient temperature was increased (Ni
et al., 2000; Dewes, 1999; Harper et al., 2000). Therefore, it is
reasonable to assume that another factor for the decrease of
TKN concentrations over time for the two aeration schemes
in trial 1 is due to the increase of ambient temperature from

ARTICLE IN PRESS
0
4000
8000
12000
16000
20000
5 10 20 40 60 90
VFA
s le
vels
(m
g/L
)V
FAs
leve
ls (
mg/
L)
VFA
s le
vels
(m
g/L
)
0
4000
8000
12000
16000
20000
5 10 20 40 60 90
0
1000
2000
3000
4000
5000
5 10 20 40 60 90
0.5% 1.0% 2.0% 4.0%
Storage time (d)
Storage time (d)
Storage time (d)
(a)
(b)
(c)
Fig. 9 – Variations of VFA levels during manure storage under the aeration schemes: (a) 0.5-day aeration, (b) 4.0-day aeration,
and (c) 16.0-day aeration. Bars are standard errors.
WAT ER R ES E A R C H 40 (2006) 162– 174 171
spring to summer during the experiment. Second, Beline et al.
(1999) reported that 7–31% of the total N of the raw swine
manure could be lost as nitrous oxide (N2O) in the headspace
gas during 4–6 days of aeration, which implied that some of
the TKN in the manure could be released into atmosphere as
N2O in this experiment. Finally, nitrogen gas loss from
wastewater by denitrification normally occurs in the
anoxic stage after nitrification by aeration (Munch et al.,
1996; Bernet et al., 2000; Westerman and Bicudo, 2002). The
total nitrogen losses in the aerated manure sampled on day 5
in trial 1 and on day 20 in trial 2 should therefore include a
portion of nitrogen gas emission caused by nitrification–de-
nitrification.
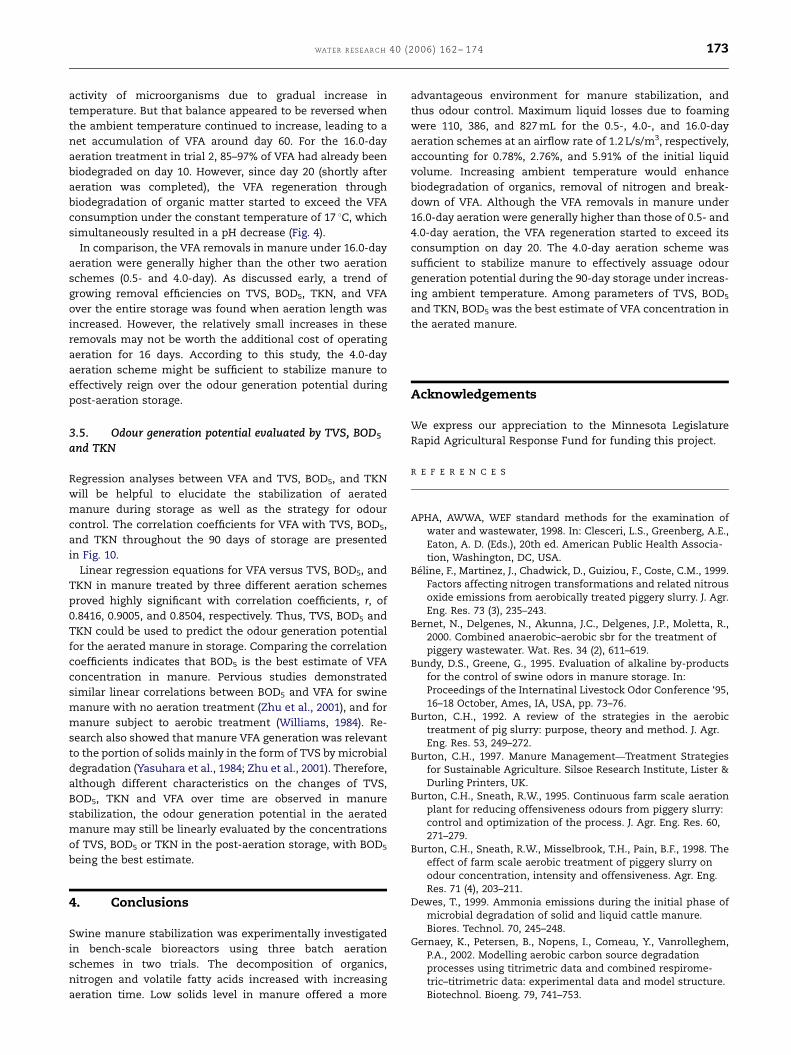
3.4. The odour generation potential (VFA)
The changes in VFA concentrations in manure over the 90-
day storage are shown in Fig. 9. Under 0.5-day aeration, a
slightly progressive breakdown on VFA was found in manure
with initial TS content less than 4.0%; however, under 4.0-day
aeration, the VFA levels in the same solids categories
fluctuated (Fig. 9(b)). Huge fluctuations of VFA in manure
ARTICLE IN PRESS
WA T E R R E S E A R C H 4 0 ( 2 0 0 6 ) 1 6 2 – 1 7 4172
with 4.0% TS were found under both aeration schemes in trial
1, particularly a surge on day 60. Under 16.0-day aeration with
fixed temperature, the VFA levels in all columns, regardless of
solids content, decreased rapidly until day 20, and started to
increase thereafter due possibly to VFA regeneration. VFA
reductions from 40% to 86%, 30% to 90%, and 45% to 92% were
found at the end of 90-day storage under aeration schemes of
0.5, 4.0, and 16.0 days, respectively. Again, the VFA removal
rates are related to the TS level in the manure in the order
from high to low of 0.5%41.0%42.0%44.0% under all
aeration schemes.
y = 4431.2x - 1r = 0.8416
0
5000
10000
15000
20000
0.0 0.5 1.0
y = 0.6167x - 305.31r = 0.9005
0
5000
10000
15000
20000
0 5000 10000
y = 2.1714x - 1794.8r = 0.8504
0
5000
10000
15000
20000
0 1000 2000 3000
VF
As
leve
ls (m
g/L
)V
FA
s le
vels
(mg/
L)
VF
As
leve
ls (m
g/L
)
BOD
TVS
TKN l
Fig. 10 – The overall linear relationships for VFA concentrations
lumped data from all three aeration schemes.
The volatile fatty acids are the intermediate products
generated during the microbial decomposition of manure
(Zhang et al., 1997). The key to preventing odour generation is
that the production of acids by the indigenous bacteria and
the consumption of acids by the methanogens to produce
methane and carbon dioxide have to be in equilibrium (Zhu,
2000). Since there are abundant substrates in manure with
4.0% TS, such equilibrium is probably difficult to be main-
tained under increasing ambient temperature in trial 1. From
day 5–40, the biodegradation of VFA might exceed the VFA
regeneration, which was normally a result of the enhanced
436.7
1.5 2.0 2.5 3.0
15000 20000 25000
4000 5000 6000 7000
5 levels (%)
levels (%)
evels (mg/L)
versus TVS, TKN, and BOD5 during 90 days of storage with
ARTICLE IN PRESS
WAT ER R ES E A R C H 40 (2006) 162– 174 173
activity of microorganisms due to gradual increase in
temperature. But that balance appeared to be reversed when
the ambient temperature continued to increase, leading to a
net accumulation of VFA around day 60. For the 16.0-day
aeration treatment in trial 2, 85–97% of VFA had already been
biodegraded on day 10. However, since day 20 (shortly after
aeration was completed), the VFA regeneration through
biodegradation of organic matter started to exceed the VFA
consumption under the constant temperature of 17 1C, which
simultaneously resulted in a pH decrease (Fig. 4).
In comparison, the VFA removals in manure under 16.0-day
aeration were generally higher than the other two aeration
schemes (0.5- and 4.0-day). As discussed early, a trend of
growing removal efficiencies on TVS, BOD5, TKN, and VFA
over the entire storage was found when aeration length was
increased. However, the relatively small increases in these
removals may not be worth the additional cost of operating
aeration for 16 days. According to this study, the 4.0-day
aeration scheme might be sufficient to stabilize manure to
effectively reign over the odour generation potential during
post-aeration storage.
3.5. Odour generation potential evaluated by TVS, BOD5
and TKN
Regression analyses between VFA and TVS, BOD5, and TKN
will be helpful to elucidate the stabilization of aerated
manure during storage as well as the strategy for odour
control. The correlation coefficients for VFA with TVS, BOD5,
and TKN throughout the 90 days of storage are presented
in Fig. 10.
Linear regression equations for VFA versus TVS, BOD5, and
TKN in manure treated by three different aeration schemes
proved highly significant with correlation coefficients, r, of
0.8416, 0.9005, and 0.8504, respectively. Thus, TVS, BOD5 and
TKN could be used to predict the odour generation potential
for the aerated manure in storage. Comparing the correlation
coefficients indicates that BOD5 is the best estimate of VFA
concentration in manure. Pervious studies demonstrated
similar linear correlations between BOD5 and VFA for swine
manure with no aeration treatment (Zhu et al., 2001), and for
manure subject to aerobic treatment (Williams, 1984). Re-
search also showed that manure VFA generation was relevant
to the portion of solids mainly in the form of TVS by microbial
degradation (Yasuhara et al., 1984; Zhu et al., 2001). Therefore,
although different characteristics on the changes of TVS,
BOD5, TKN and VFA over time are observed in manure
stabilization, the odour generation potential in the aerated
manure may still be linearly evaluated by the concentrations
of TVS, BOD5 or TKN in the post-aeration storage, with BOD5
being the best estimate.
4. Conclusions
Swine manure stabilization was experimentally investigated
in bench-scale bioreactors using three batch aeration
schemes in two trials. The decomposition of organics,
nitrogen and volatile fatty acids increased with increasing
aeration time. Low solids level in manure offered a more
advantageous environment for manure stabilization, and
thus odour control. Maximum liquid losses due to foaming
were 110, 386, and 827 mL for the 0.5-, 4.0-, and 16.0-day
aeration schemes at an airflow rate of 1.2 L/s/m3, respectively,
accounting for 0.78%, 2.76%, and 5.91% of the initial liquid
volume. Increasing ambient temperature would enhance
biodegradation of organics, removal of nitrogen and break-
down of VFA. Although the VFA removals in manure under
16.0-day aeration were generally higher than those of 0.5- and
4.0-day aeration, the VFA regeneration started to exceed its
consumption on day 20. The 4.0-day aeration scheme was
sufficient to stabilize manure to effectively assuage odour
generation potential during the 90-day storage under increas-
ing ambient temperature. Among parameters of TVS, BOD5
and TKN, BOD5 was the best estimate of VFA concentration in
the aerated manure.
Acknowledgements
We express our appreciation to the Minnesota Legislature
Rapid Agricultural Response Fund for funding this project.
R E F E R E N C E S
APHA, AWWA, WEF standard methods for the examination ofwater and wastewater, 1998. In: Clesceri, L.S., Greenberg, A.E.,Eaton, A. D. (Eds.), 20th ed. American Public Health Associa-tion, Washington, DC, USA.
Beline, F., Martinez, J., Chadwick, D., Guiziou, F., Coste, C.M., 1999.Factors affecting nitrogen transformations and related nitrousoxide emissions from aerobically treated piggery slurry. J. Agr.Eng. Res. 73 (3), 235–243.
Bernet, N., Delgenes, N., Akunna, J.C., Delgenes, J.P., Moletta, R.,2000. Combined anaerobic–aerobic sbr for the treatment ofpiggery wastewater. Wat. Res. 34 (2), 611–619.
Bundy, D.S., Greene, G., 1995. Evaluation of alkaline by-productsfor the control of swine odors in manure storage. In:Proceedings of the Internatinal Livestock Odor Conference ‘95,16–18 October, Ames, IA, USA, pp. 73–76.
Burton, C.H., 1992. A review of the strategies in the aerobictreatment of pig slurry: purpose, theory and method. J. Agr.Eng. Res. 53, 249–272.
Burton, C.H., 1997. Manure Management—Treatment Strategiesfor Sustainable Agriculture. Silsoe Research Institute, Lister &Durling Printers, UK.
Burton, C.H., Sneath, R.W., 1995. Continuous farm scale aerationplant for reducing offensiveness odours from piggery slurry:control and optimization of the process. J. Agr. Eng. Res. 60,271–279.
Burton, C.H., Sneath, R.W., Misselbrook, T.H., Pain, B.F., 1998. Theeffect of farm scale aerobic treatment of piggery slurry onodour concentration, intensity and offensiveness. Agr. Eng.Res. 71 (4), 203–211.
Dewes, T., 1999. Ammonia emissions during the initial phase ofmicrobial degradation of solid and liquid cattle manure.Biores. Technol. 70, 245–248.
Gernaey, K., Petersen, B., Nopens, I., Comeau, Y., Vanrolleghem,P.A., 2002. Modelling aerobic carbon source degradationprocesses using titrimetric data and combined respirome-tric–titrimetric data: experimental data and model structure.Biotechnol. Bioeng. 79, 741–753.
ARTICLE IN PRESS
WA T E R R E S E A R C H 4 0 ( 2 0 0 6 ) 1 6 2 – 1 7 4174
Grady, C.P.L., Daigger, G.L., Lim, H.C., 1999. Biological WastewaterTreatment, second ed. Marcel Dekker, Inc., New York, USA, pp.72–75.
Hach Company, 1993. Procedure Manual. P.O. Box 389, Loveland,CO 80539-9987.
Harper, L.A., Sharpe, R.R., Parkin, T.B., 2000. Gaseous nitrogenemissions from anaerobic swine lagoons: ammonia, nitrousoxide, and dinitrogen gas. J. Environ. Qaul. 29, 1356–1365.
Hashimoto, A.G., 1974. Aeration of poultry wastes for odor andnitrogen control. Trans. ASAE, 978–982.
Hobbs, P.J., Misselbrook, T.H., Cumby, T.R., 1999. Production andemission of odours and gases from aging pig waste. J. Agr. Eng.Res. 72, 291–298.
Lim, T.T., Heber, A.J., Ni, J.Q., Sutton, A.L., Shao, P., 2003. Odor andgas release from anaerobic treatment lagoons for swinemanure. J. Environ. Qual. 32, 406–416.
Loynachan, T.E., Bartholomew, W.V., Wollum II, A.G., 1976.Nitrogen transformation in aerated swine manure slurries. J.Environ. Qual. 5 (3), 293–297.
Munch, E.V., Paul, L., Keller, J., 1996. Simultaneous nitrificationand denitrification in bench-scale sequencing batch reactors.Water Res. 30 (2), 277–284.
Ni, J-Q., Heber, A.J., Diehl, C.A., Lim, T.T., 2000. Ammonia,hydrogen sulphide and carbon dioxide release from pigmanure in under-floor deep pits. J. Agr. Eng. Res. 77 (1),53–66.
Pratt, S., Yuan, Z., Gapes, D., Dorigo, M., Zeng, R., Keller, J., 2003.Development of a novel titration and off-gas analysis (TOGA)sensor for study of biological processes in wastewater treat-ment systems. Biotechnol. Bioeng. 81, 482–495.
Robinson, K., 1974. The use of aerobic processes for thestabilization of animal wastes. Crit. Rev. Environ. Control 4(1), 173–219.
Sneath, R.W., Burton, C.H., Williams, A.G., 1992. Continuousaerobic treatment of piggery slurry for odour control scaledup to a farm-size unit. J. Agr. Eng. Res. 53, 81–92.
Stone, K.C., Hunt, P.G., Humenik, F.J., Johnson, M.H., 1998. Impactof swine waste application on ground and stream water
quality in an eastern coastal plain watershed. Trans. ASAE 41(6), 1665–1670.
Vincini, M., Carini, F., Silva, S., 1994. Use of alkaline fly ash as anamendment for swine manure. Biores. Technol. 49, 213–222.
Westerman, P.W., Bicudo, J.R., 2002. Application of mixed andaerated pond for nitrification and denirtification of flushedswine manure. Appl. Eng. Agr. 18 (3), 351–358.
Westerman, P.W., Zhang, R.H., 1997. Aeration of livestock manureslurry and lagoon liquid for odor control: a review. Appl. Eng.Agr. 13 (2), 245–249.
Williams, A.G., 1984. Indicators of piggery slurry odour offensive-ness. Agr. Wastes 10, 15–36.
Williams, A.G., Shaw, M., Adams, S.J., 1984. The biological stabilityof aerobically treated piggery slurry during storage. J. Agr. Eng.Res. 29 (2), 231–239.
Yang, P.Y., Wang, Z.Y., 1999. Integrating an intermittent aerator ina swine wastewater treatment system for land-limited con-ditions. Biores. Technol. 69 (3), 191–198.
Yasuhara, A., Fuwa, K., Jimby, M., 1984. Identification of odorouscompounds in fresh and rotten swine manure. Agr. Biol.Chem. 48, 3001–3010.
Zhang, R.H., Westerman, P.W., 1997. Solid–liquid separation ofanimal manure for odor control and nutrient management.Appl. Eng. Agr. 13 (3), 385–393.
Zhang, R.H., Dugba, P.N., Bundy, D.S., 1997. Laboratory study ofsurface aeration of anaerobic lagoons for odor control of swinemanure. Trans. ASAE. 40 (1), 185–190.
Zhang, R.H., Tao, J., Dugba, P.N., 2000. Evaluation of two-stageanaerobic sequencing batch reactor systems for animalwastewater treatment. Trans. ASAE. 43 (6), 1795–1801.
Zhu, J., Riskowiski, G.L., Torremorell, M., 1999. Volatile fatty acidsas odor indicators in swine manure—a critical review. Trans.ASAE. 42 (1), 175–182.
Zhu, J., 2000. A review of microbiology in swine manure odorcontrol. Agr. Ecosystem Environ. 78, 93–106.
Zhu, J., Ndegwa, P.M., Luo, A., 2001. Effect of solid–liquidseparation on BOD and VFA in swine manure. Environ.Technol. 22 (10), 1237–1243.