Embed Size (px)
Citation preview
1
A BEHAVIOURAL MODEL OF THE DOT.COM BUBBLE AND CRASH Abstract
This paper looks at stock market bubbles and crashes from an inter-disciplinary perspective, with
particular reference to the high-tech bubble and crash of the late 1990s and early 2000s. It suggests that
psychology and sociology are at least as important as finance and economics for the explanation of
such phenomena.
---------------------------------------------------------------------------------------------------------------------------- The initial issue is how stock market bubbles start. Kindleberger and Aliber (2005) argued that bubbles
typically begin with a justifiable rise in stock prices. The justification may be a technological advance
or a general rise in prosperity. Examples of technological advance stimulating stock price rises might
include the development of the automobile and radio in the 1920s, and the emergence of the internet in
the late 1990s. Cassidy (2002) suggested that this initial stage is characterised by a new idea or product,
which causes changes in expectations about the future. Early investors in companies involved with the
innovation make very high returns, which attract the attention of others. The early investors can be seen
as making information trades, which are share trades arising from new information.
A general rise in prosperity can stimulate the emergence of a stock market bubble by allowing the
accumulation of saving (Galbraith 1988). Those savings are available for investment. The facility of
borrowing in order to enhance the level of stock holding also strengthens the conditions for the
development of a bubble. Stock purchases from accumulated savings or from borrowing could be seen
as liquidity trades. The purchase of shares is encouraged by the availability of finance for their
purchase.
The Liquidity Theory of Asset Prices
Pepper and Oliver (2006) have proposed the Liquidity Theory of Asset Prices. Their suggestion is that
a major driver of stock markets is the amount of liquidity available for investment. In other words, if
people have more money to invest they will invest more and thereby push up share prices. Money is
created when loans are made. So the act of financing share purchases with borrowed money increases
the money supply (liquidity). The sellers of the shares then have money available for investment, and
2
may use the money for the purchase of other shares thereby pushing share prices up. The people who
sell those shares will receive money, some of which will be used for share purchases. This process can
continue through a number of rounds, and at each round share prices are pushed up. The cumulative
increase in expenditure on shares can be estimated by means of a multiplier equation:
I = E x [1/(1 – k)]
where I is the cumulative increase in spending on shares, E is the initial expenditure on shares, and k is
the proportion of receipts from sales of shares that is invested in other shares. A high rate of
reinvestment (a high level of k) produces a large multiplier effect and a large cumulative expenditure
on shares (a large I). There would be strong upward pressure on share prices. It should be borne in
mind that decreases in liquidity can occur with consequent downward multiplier effects.
Caginalp, Porter and Smith (2001) provided evidence, from experiments, that was consistent with the
liquidity theory of asset prices. The experiments entailed the provision of both shares and cash to
participants. The average, and maximum, share prices attained during the experiments were both
related to the provision of cash relative to the provision of shares. High levels of cash endowment
relative to share endowment resulted in high share prices. The researchers also reported that initial
under-valuation of shares resulted in larger price bubbles; this was interpreted as evidence for the
effects of momentum.
Congdon (2006) demonstrated that institutional investors (life assurance and pensions) have a fairly
stable demand for liquidity in the sense of the ratio of liquid assets to other assets. If the institutional
investors experience a change in liquidity that moves the liquidity ratio away from the desired level,
they will attempt to restore the desired ratio. Money is a form of liquidity. An increase in the money
supply could disturb the liquidity ratio of institutional investors. The institutions attempt to restore their
liquidity ratios to the desired values by spending the surplus liquidity on assets such as shares. This
would drive share prices up. So long as the holding of liquidity exceeds the desired amount investment
spending will continue. To the extent that each institution’s expenditure is another institution’s receipt
of money, the attempt by each institution to reduce its holding of liquidity does not reduce the
aggregate holding of liquidity by institutions.

3
Some of the additional money will be lost to the institutions, for example to individual shareholders
who sell to institutions, but much will remain with the institutions. If the institutions hold a high
proportion of the total value of shares, most of the additional money may remain with the institutions.
The desired ratio of liquidity to other assets is restored by a rise in share prices.
Suppose that institutional investors, in aggregate, hold £1,000 billion of shares. Also suppose that, on
average, the institutions desire to hold liquid assets equal to 4% of non-liquid assets. Together they
require £40 billion of liquid assets to match the shareholdings. If they receive additional money of £30
billion, they would have a liquid assets ratio of 7%. In aggregate they would not rid themselves of the
surplus £30 billion, since the institutions would tend to pass the money between themselves as shares
are bought from each other. Some of the money, say £10 million, would be lost to the institutions. This
would reduce the aggregate holding of liquidity to 6% of the original value of shares. The institutions
would still have £60 billion of liquid assets.
The desired ratio of liquid assets to shareholdings is restored by a rise in share prices. Share prices
would rise until the desired ratio is restored. So long as the actual ratio exceeds the desired ratio
spending on shares would continue, as would the resulting rise in share prices. Prices would rise until
the total value of shares reached £1,500 billion. The liquidity ratio of 4% would then have been
restored (£60 billion of liquid assets against £1,500 billion of shares). An initial £30 billion increase in
the money held by the institutions leads to a £500 billion increase in the aggregate value of shares held
by the institutions. This £500 billion increase results from a 50% rise in share prices. An initial
reduction in liquidity would generate falling prices.
The amount of liquidity lost to the institutions in this process would be low if the institutions held a
high proportion of the available shares. A low loss would entail a high rise in share prices. For example
if all of the £30 billion increase in the money supply remained with institutional investors, the
aggregate value of shares would need to rise to £1,750 billion. The institutions would have liquidity
amounting to £70 billion (the original £40 billion plus the new £30 billion) and the restoration of a 4%
liquidity ratio would require share prices to rise until the total value of shares reached £1,750 billion.
Share prices would rise by 75%.

4
A form of the quantity theory of money may be applicable. The quantity theory of money could be
expressed as:
MV = PT
where M is the liquidity (money) held by institutional investors, V is the inverse of the liquidity ratio, P
is an index of stock prices, and T is the total quantity of shares. If V and T were to remain unchanged,
changes in M would be associated with proportionate changes in P.
Allen and Gale (2000) suggested that bubbles have three phases. The first phase starts with monetary
expansion, which leads to an increase in the prices of assets such as stocks and property. Continued
monetary expansion leads to the emergence of a bubble in prices. The second phase is characterised by
a bursting of the bubble and a collapse in asset prices. The third phase entails defaults on debts incurred
to buy stocks or property at inflated prices. Widespread debt defaults entail losses for the banks, and a
banking crisis ensues.
Familiarity and Celebrity Stocks
Best (2005) investigated the internet stock bubble, which occurred in the late 1990s and burst in 2000.
One conclusion was that internet stocks acquired a form of celebrity status. Their prices exceeded
fundamental value just as the earnings of celebrities appear to surpass the talent of the individuals
concerned. Just as the perception of celebrities has an emotional dimension, investors in internet stocks
were seen as having an emotional attachment to them. Just as the media promotes celebrities, and the
cult of celebrity, the media promoted internet investing and a culture of internet investing.
Part of the reasoning of the analysis provided by Best is similar to the familiarity bias of behavioural
finance. The familiarity bias leads people to prefer to invest in things they think they know and
understand. At the time of the internet stock bubble large numbers of people were beginning to use the
internet, which therefore felt familiar to them. The internet was new, exciting and appeared to offer
huge potential. It is possible that internet stocks, by association with the internet itself, came to be seen
as exciting investments with huge potential.

5
Arguably an internet culture was emerging, wherein the internet came to be seen as symbolic of a new
age; the information age. A social mood emerged amongst internet enthusiasts. People who identified
with the information age saw use of the internet as an expression of their personalities; they saw
themselves as part of the new era. Investment in internet stocks was an extension of their personal
attachment to the internet. This parallels celebrity cults. The celebrities with whom a person identifies
become part of that person’s perception of self. To a fan, a celebrity is more than an actor or singer. To
many buyers of internet stocks, the shares were more than financial investments. Another comparison
might be with supporters of a football team; such supporters identify with the team and have an
emotional attachment such that association with the team helps to describe them as individuals. Cassidy
(2002) suggested that people want to become players in an ongoing drama in which ownership of
stocks gives them a sense of being part of a social movement. People invest because they do not want
to be left out of the exciting developments. Behavioural finance has identified both familiarity, and
emotional involvement, with particular investments as influences on financial decision-making. It
seems likely that these factors were influential during the internet stock bubble of the late 1990s.
Cooper, Dimitrov and Rau (2001) found that companies which added ‘dot.com’ or ‘dot.net’ to their
names during the internet stock bubble experienced share price increases of about 74% at the time of
the change (even though nothing else about the businesses had changed). During the bear market of the
early 2000s there were gains for firms which removed ‘dot.com; or ‘dot.net’ from their names (Cooper,
Khorana, Osobov, Patel and Rau; 2005). It has been suggested that internet-related names attracted
positive affect (feelings and emotions) during the bull phase and negative affect during the bear phase
(Statman, Fisher and Anginer 2008).
Hirschey, Richardson and Scholz (2000) reported evidence that internet users tended to be very naïve
with respect to investments. In particular they appeared to be highly influenced by stock
recommendations posted on the internet. Stock purchases on the basis of such recommendations may
have provided additional impetus to the bubble in high-technology stocks.
Best emphasised the role of the media in talking up the prices of internet stocks, and the creation of
celebrity status for such stocks. Shiller (2000) argued that the media had become more involved in
6
reporting stock market news, and in generating an investment culture. In doing so the media has made
the subject of investment more entertaining and exciting to many people. An investment culture has
been promoted, with investment being seen as part of a lifestyle option. Within this context it is not
surprising that the media focused attention on internet stocks since such stocks offered excitement and
glamour. The media became part of the process of generating the internet stock price bubble (Lovink
2002). The media played an important role in the creation of the celebrity status of internet stocks, just
as the media plays an important role in the creation of celebrity status for people.
Momentum
Pepper and Oliver suggest that, if monetary imbalance persists in one direction for a long period,
extrapolative expectations can result. By extrapolative expectations is meant the tendency to expect
that price changes will continue in the direction recently observed. Extrapolative expectations lead to
momentum (positive feedback) trading with the effect that a price movement continues in a particular
direction. The psychological bias of representativeness helps to explain the emergence of extrapolative
expectations. If extrapolative expectations are widespread the result is herd trading, and herd trading
can overwhelm any tendency for price trades to restore ‘efficient’ prices.
The rise in share prices, if substantial and prolonged, leads to members of the public believing that
prices will continue to rise. People who do not normally invest begin to buy shares in the belief that
prices will continue to rise. More and more people, typically people who have no knowledge of
financial markets, buy shares. This pushes up prices even further. There is euphoria and manic buying.
This causes further price rises. There is a self-fulfilling prophecy wherein the belief that prices will rise
brings about the rise, since it leads to buying. People with no knowledge of investment often believe
that if share prices have risen recently, those prices will continue to rise in the future. Cassidy divides
this process into a boom stage and a euphoria stage. In the boom stage share price rises generate media
interest, which spreads the excitement across a wider audience. Even the professionals working for
institutional investors become involved. In the euphoria stage investment principles, and even common
sense, are discarded. Conventional wisdom is rejected in favour of the view that it is ‘all different this
time’. Prices lose touch with reality.

7
One assumption of the Efficient Market Hypothesis is that investors are rational. This does not require
all investors to be rational, but it does require that the rational investors outweigh the irrational ones.
However there are times when irrational investors are dominant. A possible cause of market
overreaction is the tendency of some investors (often small investors) to follow the market. Such
investors believe that recent stock price movements are indicators of future price movements. In other
words they extrapolate price movements. They buy when prices have been rising and thereby tend to
push prices to unrealistically high levels. They sell when prices have been falling and thereby drive
prices to excessively low levels. There are times when such naïve investors outweigh those that invest
on the basis of fundamental analysis of the intrinsic value of the shares. Such irrational investors help
to generate bubbles and crashes in stock markets.
Some professional investors may also participate on the basis of the greater fool theory. The greater
fool theory states that it does not matter if the price paid is higher than the fundamental value, so long
as someone (the greater fool) will be prepared to pay an even higher price. The theory of rational
bubbles suggests that investors weigh the probability of further rises against the probability of falls. So
it may be rational for an investor to buy shares, knowing that they are overvalued, if the probability-
weighted expectation of gain exceeds the probability-weighted expectation of loss. Maximising returns
entails following prices upwards until they peak. Selling too soon causes a loss of potential profits.
Someone pursuing such a strategy expects to be able to sell before the market falls, and hence the
person must believe that he/she is more astute than other investors. Fisher and Statman (2002) surveyed
investors during the high-tech bubble of the late 1990s and found that, although many investors
believed stocks to be overpriced, they expected prices to continue rising.
The illusion of control is the tendency to believe that chance events are amenable to personal control
(Langer, 1975). This may take the form of investors believing that they can forecast price movements,
which are unpredictable. The illusion of control can cause an underestimation of risk. If events are seen
as controllable, they will be seen as less risky (Gollwitzer and Kinney, 1989). De Bondt (1998)
suggested that one manifestation of the illusion of control was the belief of many investors that they
would be sufficiently astute to sell before a large fall in prices. This belief that they would be able to
avoid losses by selling in time causes such investors to underestimate the risks of their investments.

8
The degree of illusion of control can be affected by the individual’s environment (Taylor and Armor,
1996). Competitive and stressful environments can produce illusion of control (Friedland, Keinan, and
Regev, 1992). Fenton O’Creevy, Nicholson, Soane and Willman (2005) found that traders in financial
markets were subject to the illusion of control. They also found that the illusion of control was
associated with poorer performance.
A number of attributes have been identified as fostering the illusion of control (Presson and Benassi,
1996). One of these is the outcome sequence. Positive outcomes early give a person more illusion of
control than negative outcomes early. This is akin to the tendency for some people to become addicted
to gambling if their first few bets are successful. In a rising stock market people investing for the first
time will experience gains. This is likely to engender the illusion of control, overconfidence, and the
inclination to invest more. If significant numbers of people invest more, prices will continue to rise
thereby reinforcing these psychological biases.
In addition to the outcome sequence Presson and Benassi showed that choice, task familiarity,
information, and active involvement foster the illusion of control. Barber and Odean (2002) pointed out
that online investors tend to experience these attributes. In particular they make choices, become
familiar with the process of trading, and have access to large amounts of information. The implication
is that the development of online trading is likely to enhance the illusion of control, and hence any
market instability to which the illusion of control might contribute.
Another attribute that fosters the illusion of control is the acquisition of information. Increased
information increases the illusion of control and the degree of overconfidence. This has been called the
illusion of knowledge (Nofsinger 2005; Peterson and Pitz 1988). The illusion of knowledge is the
tendency for people to believe that additional information always increases the accuracy of their
forecasts. It is the belief that more information increases the person’s knowledge and hence improves
decisions. For example people often believe that knowledge of previous drawings of lottery numbers
improves their ability to predict future lottery numbers.
9
The information may or may not be relevant to the investments. Particularly for investors with little
knowledge of investment, information does not give them as much understanding as they think because
they lack the expertise to interpret it. They may be unable to distinguish relevant and reliable
information from irrelevant and unreliable information. However to the extent that stock market gains
lead investors to seek information, the information obtained is likely to increase the illusion of control
and the extent of investing. The resulting investment will help to perpetuate the share price rises and
thereby the psychological biases.
Some information is irrelevant, or may be beyond a person’s ability to interpret, but the person may
still regard the information as improving their ability to forecast. Tumarkin and Whitelaw (2001) found
that, despite providing no useful information, website message board postings increased trading
volume in the respective shares. Despite the absence of useful information from the messages, as
indicated by subsequent price movements, it appeared that some investors believed that it added to
their knowledge and expertise (and traded as a result). The illusion of knowledge causes investors to be
overconfident and to misinterpret the amount of risk from an investment. Investors, who overestimate
the accuracy of their forecasts, underestimate the risks taken.
Montier (2002) offers Keynes’ (1936) beauty contest as an explanation of stock market bubbles. The
first level of the contest is to choose the stocks that you believe to offer the best prospects. The second
level is to choose stocks that you believe others will see as offering the best prospects. This is based on
the view that price movements arise from buy and sell decisions of investors. A third level is to choose
the stocks that you believe that others will expect the average investor to select. This is based on the
view that others realise that buy and sell decisions of investors drive prices. A fourth stage might
involve choosing stocks that you believe that others will expect the average investor to see as most
popular amongst investors. In other words, the beauty contest view sees investors as indulging in levels
of second-guessing other investors. Even if every investor believes that a stock market crash is coming
they may not sell stocks. They may even continue to buy. They may plan to sell just before others sell.
In this way they expect to maximize their profits from the rising market. The result is that markets
continue to rise beyond what the vast majority of investors would consider to be the values consistent
with economic fundamentals. It is interesting to note that Shiller’s survey following the 1987 crash

10
(Shiller 1987) found that 84% of institutional investors and 72% of private investors said that they had
believed that the market was overpriced just before the crash. Shiller suggested that people did not
realise how many others shared their views that the market was overpriced.
Abreu and Brunnermeier (2002, 2003) highlighted the difficulties faced by investors when trying to
ascertain the thinking of other investors. It may be rational to buy overpriced stocks if the purchases of
other investors will cause them to become even more overpriced (a rational bubble). Knowing the
intentions of other investors, and knowing the degree of synchronisation of intentions, is problematic.
Synchronisation is the tendency for an overwhelming majority to share an opinion about the direction
of price movement, and synchronisation can cause bubbles and crashes. If an investor is to change
investment strategy that investor may feel the need to be certain that there is synchronisation of views
about the direction of stock price movement. A switch from buying in an overpriced market to selling
in such a market may require a conviction that there is synchronisation of views about the change in
market direction. It is impossible to be certain about changes in market views, and about the extent of
synchronisation, and hence an investor faces a source of risk. It is possible that relatively minor pieces
of information can affect the perception of investor expectations, and the perception of the extent of
synchronisation. If a piece of information causes a change in perception, say from synchronised
bullishness to synchronised bearishness, the direction of the market could abruptly change. However
for a switch from strong bullishness (a bubble) to strong bearishness (a crash) to occur the change in
perception would have to be synchronised. Investors would have to share a view about each other’s
prospective behaviour. If investor views were dispersed (not synchronised), there would be neither
strong bullishness nor strong bearishness.
The piece of information that causes changes in perceptions could be a change in direction of a stock
index. Stock price movements could be interpreted as indicators of how other investors are thinking.
The stage is set for an information cascade and positive feedback trading, which generate
synchronisation of market views and investing behaviour. A change in direction of a stock index could
cause a reversal of trading behaviour thereby reinforcing the change in direction and reinforcing the
information that the new market direction is seen as providing. The question arises as to when investors
can be sure that the change in direction is not a temporary aberration. Perhaps technical analysis tries to
11
ascertain such matters. Technical analysis might provide the information, which investors see as
indicating a synchronised change in investor views and hence change in market direction.
The role of momentum in the development of the high-tech bubble was particularly significant
according to Boswijk, Hommes and Manzan (2007). They divided investors into two groups. One
group comprised fundamentalists (price traders) who believed in the mean-reversion of stock prices
towards a true (fundamental) value such that deviations from true values would be corrected. The other
group consisted of trend followers (herd traders) who believed that a direction of price movement
would continue. The proportions of investors in the two groups vary over time. The researchers found
that in the late 1990s almost all investors were trend following, and that the dominance of trend
followers persisted for several years. This is consistent with strong momentum in the formation of the
bubble. The studies by Best (2005), and by Muga and Santamaria (2007), indicated that high-
technology (including dot.com) stocks were particularly susceptible to momentum trading (trend
following).
Research on investor psychology has indicated certain features about the behaviour of uninformed
investors, who are often referred to as noise traders in the academic literature. Tversky and Kahneman
(1982) found that they have a tendency to over-react to news. De Bondt (1993) found that they
extrapolate trends, in other words they tend to believe that the recent direction of movement of share
prices will continue. Shleifer and Summers (1990) found evidence that they become overconfident in
their forecasts. This latter point is consistent with the view that bubbles and crashes are characterised
by some investors forgetting that financial markets are uncertain, and coming to believe that the
direction of movement of share prices can be forecast with certainty. Barberis (1998) suggested that
noise traders, as a result of misinterpretation of information, see patterns where there are none. Lee
(1998) mentioned that a sudden and drastic trend reversal may mean that earlier cues of a change in
trend had been neglected. Clark and Statman (1998) found that noise traders tend to follow newsletters,
which in turn are prone to herding.
It seems that many investors not only extrapolate price trends but also extrapolate streams of good or
bad news, for example a succession of pieces of good news leads to the expectation that future news

12
will also be good. Barberis, Shleifer, and Vishny (1998) showed that shares that had experienced a
succession of positive items of news tended to become overpriced. This indicates that stock prices
overreact to consistent patterns of good or bad news. Lakonishok, Shleifer, and Vishny (1994)
concluded that investors appeared to extrapolate the past too far into the future.
There is evidence that the flow of money into institutional investment funds (such as unit trusts) has an
impact on stock market movements. Evidence for a positive relationship between fund flows and
subsequent stock market returns comes from Edelen and Warner (2001), Neal and Wheatley (1998),
Randall, Suk and Tully (2003), and Warther (1995). It has been suggested by Indro (2004) that market
sentiment (an aspect of crowd psychology) plays an important role. Indro found that poll-based
measures of market sentiment were related to the size of net inflows into equity funds. It appears that
improved sentiment (optimism) generates investment into institutional funds, which in turn brings
about a rise in stock market prices (and vice versa for increased pessimism). If stock market rises
render market sentiment more optimistic, a circular process occurs in which rising prices and
improving sentiment reinforce each other.
It has often been suggested that small investors have a tendency to buy when the market has risen and
to sell when the market falls. Karceski (2002) reported that between 1984 and 1996 average monthly
inflows into US equity mutual funds were about eight times higher in bull markets than in bear
markets. The largest inflows were found to occur after the market had moved higher and the smallest
inflows followed falls. Mosebach and Najand (1999) found interrelationships between stock market
rises and flows of funds into the market. Rises in the market were related to its own previous rises,
indicating a momentum effect, and to previous cash inflows to the market. Cash inflows also showed
momentum, and were related to previous market rises. A high net inflow of funds increased stock
market prices, and price rises increased the net inflow of funds. In other words, positive feedback
trading was identified.
One interpretation of representativeness is that investments that have shown recent price rises are
representative of longer term successes (and conversely for those showing recent price falls). Another
way of looking at representativeness views it as suggesting that people see patterns and trends where

13
they do not exist. Recent upward price movements are interpreted as an upward trend that will continue
into the future (conversely with price falls).
The concept of representativeness helps to explain the apparent tendency for investors to chase the
market. Many people seem to believe that recent price rises will continue into the future, likewise
recent price falls. As a result they buy when they see that prices have been rising, causing prices to rise
further, and sell when they see that prices have been falling, accentuating the price falls. DeBondt
(1993) reported a study of 38,000 forecasts of stock prices and exchange rates. He found that non-
experts expected the continuation of apparent past trends in prices. They were optimistic in bull
markets and pessimistic in bear markets. Byrne (2005), when researching the behaviour of retail
consumers of institutional investments, found that the provision of past performance information
appeared to create an expectation of future returns around the same level as the past returns.
This buy-high / sell-low investment strategy may be predicted by the ‘house money’ and ‘snake bite’
effects (Thaler and Johnson 1990). After making a gain people are willing to take risks with the
winnings since they do not fully regard the money gained as their own (it is the ‘house money’). So
people may be more willing to buy following a price rise. Conversely the ‘snake bite’ effect renders
people more risk-averse following a loss. The pain of a loss (the snake bite) can cause people to avoid
the risk of more loss by selling investments seen as risky. When many investors are affected by these
biases, the market as a whole may be affected. The house-money effect can contribute to the
emergence of a stock market bubble. The snake-bite effect can contribute to a crash.
The tendency to buy following a stock market rise, and to sell following a fall, can also be explained in
terms of changes in attitude towards risk. Clarke and Statman (1998) reported that risk tolerance fell
dramatically just after the stock market crash of 1987. In consequence investors became less willing to
invest in the stock market after the crash. MacKillop (2003) and Yao, Hanna and Lindamood (2004)
found a relationship between market prices and risk tolerance. The findings were that investors became
more tolerant of risk following market rises, and less risk tolerant following falls. The implication is
that people are more inclined to buy shares when markets have been rising and more inclined to sell
when they have been falling; behaviour which reinforces the direction of market movement. Shefrin
14
(2000) found similar effects among financial advisers and institutional investors. Byrne (2005), when
examining the behaviour of retail consumers of institutional investments, found that a positive outcome
history led to a higher risk propensity; in other words market gains increased the inclination of
investors to invest more. Grable, Lytton and O’Neill (2004) found a positive relationship between stock
market closing prices and risk tolerance. As the previous week’s closing price increased, risk tolerance
increased. When the market dropped, the following week’s risk tolerance also dropped. Since risk
tolerance affects the willingness of investors to buy risky assets such as shares, the relationship
between market movements and risk tolerance tends to reinforce the direction of market movement.
During market rises people become more inclined to buy shares, thus pushing share prices up further.
After market falls investors are more likely to sell, thereby pushing the market down further.
Projection bias is high sensitivity to momentary information and feelings such that current attitudes and
preferences are expected to continue into the future (Loewenstein, O’Donoghue and Rabin, 2003).
Mehra and Sah (2002) found that risk tolerance varied over time and that people behaved as if their
current risk preference would persist into the future. In other words the current level of risk tolerance
was subject to a projection bias such that it was expected to continue into the future. Grable, Lytton,
O’Neill, Joo and Klock (2006) pointed out that this interacts with the effects of market movements on
risk tolerance. A rise in the market enhances risk tolerance, projection bias leads to a belief that current
risk tolerance will persist, people buy more shares, share purchases cause price rises, price rises
increase risk tolerance, and so forth. A virtuous circle of rising prices and rising risk tolerance could
emerge. Conversely there could be a vicious circle entailing falling prices and rising risk aversion.
Peterson (2007) in a review of recent neuroscience literature concluded that the evidence indicated the
existence of separate brain systems for risk-taking and risk-avoiding behaviours. Both systems entailed
emotional responses. Excessive activation or suppression of either brain system could result in biased
investment decisions. Recent financial gains or losses change investor behaviour. Investors who have
recently experienced a loss may be subject to feelings of nervousness, sensitivity to possible future
losses, and hesitancy about investing. Investors who have recently enjoyed gains may feel celebratory,
self-confident and inclined to ignore prospective risks.

15
These emotional reactions to losses and gains could bias investment decisions in a way that reinforces
bear and bull markets. In a falling market the losses engender anxiety, raise sensitivity to risk and
increase risk-aversion. These feelings reduce purchases of stocks and increase sales, thereby
reinforcing the downward market movement. When the market rises the gains being experienced might
generate enthusiasm, overemphasis on potential returns and reduced attention to risk. Risks may be
underestimated and risk-aversion reduced. These emotional responses to a rising market could induce
further purchases of stock, thereby reinforcing the upward movement.
Social Mood
People transmit moods to one another when interacting socially. People not only receive information
and opinions in the process of social interaction, they also receive moods and emotions. Moods and
emotions interact with cognitive processes when people make decisions. There are times when such
feelings can be particularly important, such as in periods of uncertainty and when the decision is very
complex. The moods and emotions may be unrelated to a decision, but nonetheless affect the decision.
The general level of optimism or pessimism in society will influence individuals and their decisions,
including their financial decisions.
There is a distinction between emotions and moods. Emotions are often short term and tend to be
related to a particular person, object or situation. Moods are free-floating and not attached to something
specific. A mood is a general state of mind and can persist for long periods. Mood may have no
particular causal stimulus and have no particular target.
Positive mood is accompanied by emotions such as optimism, happiness, and hope. These feelings can
become extreme and result in euphoria. Negative mood is associated with emotions such as fear,
pessimism, and antagonism. Nofsinger (2005a) suggested that social mood is quickly reflected in the
stock market, such that the stock market becomes an indicator of social mood. Prechter (1999, 2001),
in proposing a socionomics hypothesis, argued that moods cause financial market trends and contribute
to a tendency for investors to act in a concerted manner and to exhibit herding behaviour.

16
One factor that can affect mood, and the level of optimism, is the recent performance of stock markets.
A market rise is likely to improve the mood of investors, and their degree of optimism. A positive
feedback cycle could emerge. Price rises improve mood and increase optimism. In consequence there
are net purchases, so prices rise. These price rises positively affect mood and optimism. Such a
positive feedback cycle could contribute to the development of a bubble. Conversely a downward
vicious circle could arise with falling prices, worsening moods, and declining optimism.
Many psychologists would argue that actions are driven by what people think, which is heavily
influenced by how they feel. How people feel is partly determined by their interactions with others.
Prechter’s socionomic hypothesis suggests that human interactions spread moods and emotions. When
moods and emotions become widely shared, the resulting feelings of optimism or pessimism cause
uniformity in financial decision-making. This amounts to herding and has impacts on financial markets
at the aggregate level.
Information can spread through society in a number of ways; books, magazines, newspapers,
television, radio, the internet and personal contact. Nofsinger suggests that personal contact is
particularly important since it readily conveys mood and emotion as well as information. Interpersonal
contact is important to the propagation of social mood. Such contact results in shared mood as well as
shared information.
Prechter suggested that economic expansions and equity bull markets are associated with positive
feelings such as optimism and enthusiasm whereas economic recessions and bear markets correspond
to an increase in negative emotions like pessimism, fear and anger. During a stock market uptrend
society and investors are characterised by feelings of calmness and contentment, at the market top they
are happy and enthusiastic, during the market downturn the feelings are ones of sadness and insecurity,
whilst the market bottom is associated with feelings of anger, hostility and tension.
Dreman (2001) suggested that at the peaks and troughs of social mood, characterised by manias and
panics, psychological influences play the biggest role in the decisions of investment analysts and fund
managers. Forecasts will be the most positive at the peak of social mood and most negative at the

17
troughs. Psychological influences can contaminate rational decision-making, and may be dominant at
the extreme highs and lows of social mood. At the extremes of social mood the traditional techniques
of investment analysis might be rejected by many as being no longer applicable in the new era.
Studies by psychologists have found that mood appears to affect predictions about the future. People in
a good mood are more optimistic about the future than people in a bad mood (Wright and Bower 1992).
The impact of mood on financial decisions has been referred to as the ‘misattribution bias’ (Nofsinger
2005). If a person is in a good mood, there will be a tendency to be optimistic when evaluating an
investment. Good moods may cause people to be more likely to make risky investments (for example
choosing shares rather than bonds).
Mood affects investment behaviour (Baker and Nofsinger 2002, Nofsinger 2002). It has been suggested
that good moods make people less critical. Good moods can lead to decisions that lack detailed
analysis. Determinants of mood include weather, and the number of hours of daylight. Research by
Hirshleifer and Shumway (2001), and by Kamstra, Kramer and Levi (2001), has indicated that these
factors affect investment behaviour. Good weather, and long hours of sunlight, appears to encourage
net buying and market rises. Nofsinger (2002b) has suggested an optimism bias. Optimism reduces
critical analysis during the investment process, and it causes investors to ignore negative information.
According to the socionomic hypothesis (Prechter, 1999; Nofsinger 2005) moods can be transmitted
through social contact and a widely shared, or social, mood emerges. Contact between people conveys
mood as well as information. Collectively shared moods influence individual decisions, with the effect
that trends emerge. At times mood can dominate reason in the decision-making process. It has been
found that people in depressed moods are less willing to take risks (Yuen and Lee, 2003) and a
negative mood is associated with a desire for asset preservation and safety (Kavanagh, Andrade, and
May 2005). Positive mood renders people more trusting (Dunn and Schweitzer, 2005), and for many
people trust in the financial services industry is a big issue when considering investments. Positive
social mood results in perceptions of trustworthiness, low risk and high returns whilst negative social
mood is associated with low trust, high perceived risk and low anticipated returns (Olson, 2006).

18
It has often been suggested that investors in institutional investments such as unit trusts and OEICs
have a tendency to buy when the market has risen and to sell after the market has fallen. The tendency
to buy when prices are high, and to sell when they are low, could be explained by social mood. As
social mood reaches its peak the level of optimism in society draws more people into investment. The
optimistic social mood causes, normally very risk-averse, investors to begin investing. They buy at the
peak of social mood, which coincides with the peak of the stock market. Conversely the pessimism
associated with low social mood leads to the selling of investments, just when the stock market is at its
lowest. This helps to explain the tendency for many investors, particularly retail investors, to buy at
high prices and sell at low prices. Buying at high prices and selling at low prices results in losses.
The discussion of stock market bubbles and crashes in terms of social and psychological factors seems
to be broadly consistent with the post-Keynesian interpretation, which is particularly associated with
Galbraith (for example, Galbraith 1988). Galbraith has focused on social mood and excessive
optimism: the latter often manifesting itself as a belief that the stock market offers a means to ‘get rich
quick’. Stock market speculation is seen as most likely to occur after a period of prosperity, which has
allowed the accumulation of a substantial amount of savings. Those savings are available for
investment. The facility of borrowing in order to enhance the level of stock holding also strengthens the
conditions for the development of a bubble. The role of the accumulation of money (liquidity) available
for investment is a factor emphasised in both the post-Keynesian and monetarist traditions. The
monetarist view gives the money supply the central role in the explanation of bubbles and crashes. The
liquidity theory of asset prices could be seen as being in the monetarist tradition.
Olsen (1997, 1998) took the view that investment analysis is an example of ‘Complex, ill-structured
tasks’, which are common in the social sciences. Complex ill-structured tasks are characterised by a
lack of agreement concerning what is relevant information and how it should be analysed. The wide
variety of approaches to investment analysis is symptomatic of a complex, ill-structured task. Experts
do little better than novices when dealing with such tasks. The evidence on the performance of
investment analysts and fund managers indicates that professional analysts and managers show little, if
any, tendency to outperform passive strategies such as index tracking.
19
Investment analysis, as a complex ill-structured task, gives rise to considerable variety in opinions
partly because of the wide variety of techniques of investment analysis. Such tasks are also likely to be
subject to psychological, emotional and social influences. Psychological and social factors can be
particularly important in times of great uncertainty.
Shiller (1984) took the view that stock prices are likely to be particularly vulnerable to social mood
because there is no generally accepted approach to stock pricing; different analysts use different
models in different ways. The potential influence of social mood is even greater among non-
professionals who have little, or no, understanding of pricing models and financial analysis. Nofsinger
saw the link to be so strong that stock market prices could be used as a measure of social mood.
Dufwenberg, Lindqvist and Moore (2005) reported that laboratory experiments had shown that bubbles
tend to occur with inexperienced traders but not with experienced traders. The extent to which this
provides insights into the operation of real markets depends upon whether real markets are dominated
by experienced or inexperienced investors. Dufwenberg, Lindqvist and Moore conducted experiments
with mixtures of experienced and inexperienced traders. They found that bubbles were eliminated if at
least one-third of participants were experienced. Since experienced investors probably dominate real
markets, the implication is that bubbles are likely to be rare and unlikely to be caused by the relatively
small proportion of inexperienced investors. They observed that bubbles and crashes in real markets
were unusual (for example US stock markets had experienced just three clear cases in the twentieth
century). They suggested that markets might be understood as being based on fundamentals for most of
the time, with occasional lapses.
In general, the evidence from experimental trading (Caginalp, Porter and Smith) has indicated that
speculative bubbles are more likely to emerge where:
1. The proportion of inexperienced traders is high.
2. The uncertainty about true (fair or fundamental) value is high.
3. The investment promises a small chance of profit, but that profit would be very high.
4. It is possible to finance purchases by borrowing money.
5. Short selling is difficult (i.e. it is difficult to borrow shares for the purpose of selling them).
20
It is interesting to note how well these characteristics describe the market in high-tech shares in the
few years up to 2000.
Peaks and troughs of social mood are characterised by emotional decision-making rather than rational
evaluation. Cognitive evaluations indicating that stocks are overpriced are dominated by a mood of
optimism. Support for one’s downplaying of rational evaluation receives support from the fact that
others downplay rational evaluation. The optimism of others validates one’s own optimism. It is often
argued that the normal methods of evaluation are no longer applicable in the new era.
Emotions
Investment decisions can be affected by unrelated emotions (Loewenstein, Weber, Hsee and Welch
2001; Slovic, Finucane, Peters and MacGregor 2002). A favourable sports result or good news about a
friend can engender a good feeling, and the good feeling can affect investment decisions. The effect of
emotions increases with the complexity and uncertainty surrounding the decision. Decisions about
complex and uncertain matters are particularly influenced by emotions (Forgas 1995).
Emotions can be particularly important when there is ‘ego-involvement’, which entails investors
identifying with their investment choices (Dweck and Leggett, 1988). There is evidence that such
people may hold on to particular investments too long (Sandelands, Brockner, and Glynn, 1988). Ego-
involvement is also likely to magnify the effects of stress (Riess and Taylor, 1984) and thereby reduce
the quality of investment decision-making.
Baker and Nofsinger (2002) suggest an attachment bias, whereby investors become emotionally
attached to particular investments. Emotional attachment can cause investors to focus on good features
and ignore bad ones. Bad news may be ignored. This could hinder the incorporation of information into
a share price. If investors ignore bad news, the share price may fail to fully reflect that bad news. Baker
and Nofsinger suggest that one way to avoid the effects of emotion, and perhaps other psychological
biases, is to invest in index tracker funds. Arguably investors are relatively unlikely to become
emotionally attached to index tracker funds.

21
Investors not only have feelings, they are also prone to superstitions. Kahneman and Tversky (1983)
have suggested the existence of a ‘conjunction fallacy’. The conjunction fallacy is the belief that
contiguous events have a causal relationship. Unrelated, but simultaneous, events in two markets might
be seen as causally linked whereas they are actually unrelated. Also events in successive time periods
may be seen as forming a pattern when in reality they are independent events. From this perspective
technical analysis might be seen as a complex set of superstitions.
Evidence on the possibility of negative effects of emotions and moods on investment decision-making
comes from research on expert systems. Expert systems are computer programmes that use
relationships, provided by experts, to make decisions. Camerer (1981) found that expert systems
frequently out-performed the experts whose knowledge had been used in their creation. This
phenomenon is known as bootstrapping. It may be the case that the superior performance of the
computer arises from the absence of the effects of emotions and moods.
Slovic, Finucane, Peters and MacGregor (2002) proposed an affect heuristic. Affect refers to feelings,
which are subtle and of which people may be unaware. Impressions and feelings based on affect are
often easier bases for decision-making than an objective evaluation, particularly when the decision is
complex. Since the use of affect in decision-making is a form of shortcut, it could be regarded as a
heuristic. Loewenstein, Weber, Hsee and Welch (2001) showed how emotions interact with cognitive
thought processes and how at times the emotional process can dominate cognitive processes. Forgas
(1995) took the view that the role of emotions increased as the complexity and uncertainty facing the
decision-maker increased.
Positive Feedback Trading
Positive feedback trading involves buying because prices have been rising and selling when prices have
been falling. This may occur because price movements are seen as providing information about the
views of other investors. Price rises indicate optimism and hence encourage buying, conversely with
price falls. Buying pushes prices yet higher (and thereby stimulates more buying) and selling pushes

22
prices lower (and hence encourages more selling). Such trading behaviour contributes to stock market
bubbles and crashes.
Representativeness helps to explain why many investors seem to extrapolate price movements. Many
investors appear to believe that if prices have been rising in the past then they will continue to rise, and
conversely with falling prices. The concept of representativeness suggests that this is because those
investors see an investment with recent price increases as representative of longer-term successful
investments, conversely with price falls.
The concept of representativeness helps to explain the apparent tendency for investors to chase the
market. Many people seem to believe that recent price rises will continue into the future, likewise
recent price falls. As a result they buy when they see that prices have been rising, causing prices to rise
further, and sell when they see that prices have been falling, accentuating the price falls. DeBondt
(1993) reported a study of 38,000 forecasts of stock prices and exchange rates. He found that non-
experts expected the continuation of apparent past trends in prices. They were optimistic in bull
markets and pessimistic in bear markets.
One interpretation of representativeness is that investments that have shown recent price rises are
representative of longer term successes (and conversely for those showing recent price falls). Another
way of looking at representativeness views it as suggesting that people see patterns and trends where
they do not exist. Recent upward price movements are interpreted as an upward trend that will
continue into the future (conversely with price falls).
Thus representativeness explains how opinions about price trends can emerge, and through affecting
trading those opinions become self-fulfilling. The persistence of such opinions, and hence the resulting
bubbles or crashes, may be explained by the concepts of conservatism and confirmation bias.
Conservatism renders people unwilling to change their opinions in the light of new information, so they
may adhere to a view about the direction of prices even when those prices have moved too far.
Confirmation bias is the tendency for people to pay attention to information that supports their

23
opinions, and to ignore contrary evidence. Again this causes them to persist with market views, and
trading behaviour, even when evidence suggests that those views may be incorrect.
Narrow Framing suggests that investors focus too much on the short term. In consequence the very
recent behaviour of share prices is focused upon and the longer term past is ignored. This reinforces the
tendency of representativeness to lead to unjustified long term expectations on the basis of short term
price movements.
These ideas are consistent with the emergence of stock price bubbles and crashes. Recent price
increases cause expectations of future increases and investors buy shares. This pushes prices up further,
hence generates expectations of more increases and leads to yet more buying. There is an upward spiral
often referred to as positive feedback trading or as ‘chasing the market’. There is a corresponding, but
opposite, pattern as the market falls.
Herding
Smith (1991) put forward the view that bubbles and crashes seem to have their origin in social
influences. Social influence may mean following a leader, reacting simultaneously and identically with
other investors in response to new information, or imitation of others who are either directly observed
or observed indirectly through the media. Social influence appears to be strongest when an individual
feels uncertain and finds no directly applicable earlier personal experience.
As Hirshleifer (2001) points out, people have a tendency to conform to the judgments and behaviours
of others. People may follow others without any apparent reason. Such behaviour results in a form of
herding, which helps to explain the development of bubbles and crashes. If there is a uniformity of
view concerning the direction of a market, the result is likely to be a movement of the market in that
direction. Furthermore, the herd may stampede. Shiller (2000) said that the meaning of herd behaviour
is that investors tend to do as other investors do. They imitate the behaviour of others and disregard
their own information.

24
Deutsch and Gerard (1955) distinguish between ‘normative social influence’ and ‘informational social
influence’. Normative social influence does not involve a change in perceptions or beliefs, merely
conformity for the benefits of conformity. An example of normative social influence would be that of
professional investment managers who copy each other on the grounds that being wrong when
everyone else is wrong does not jeopardize one’s career, but being wrong when the majority get it right
can result in job loss. This is a form of regret avoidance. If a bad decision were made, a result would be
the pain of regret. By following the decisions of others, the risk of regret is reduced. This is safety in
numbers. There is less fear of regret when others are making the same decisions.
Informational social influence entails acceptance of a group’s beliefs as providing information. For
example share purchases by others delivers information that they believe that prices will rise in future.
This is accepted as useful information about the stock market and leads others to buy also. This is an
informational cascade; people see the actions of others as providing information and act on that
information. Investors buy because they know that others are buying, and in buying provide
information to other investors who buy in their turn. Informational cascades can cause large, and
economically unjustified, swings in stock market levels. Investors cease to make their own judgements
based on factual information, and use the apparent information conveyed by the actions of others
instead. Investment decisions based on relevant information cease, and hence the process whereby
stock prices come to reflect relevant information comes to an end. Share price movements come to be
disconnected from relevant information.
Walter and Weber (2006) distinguished between intentional and unintentional herding. Intentional
herding was seen as arising from attempts to copy others. Unintentional herding emerges as a result of
investors analysing the same information in the same way. Intentional herding could develop as a
consequence of poor availability of information. Investors might copy the behaviour of others in the
belief that those others have traded on the basis of information. When copying others, in the belief that
they are acting on information, becomes widespread there is an informational cascade.
Another possible cause of intentional herding arises as a consequence of career risk. If a fund manager
loses money whilst others make money, that fund manager’s job may be in jeopardy. If a fund manager
25
loses money whilst others lose money, there is more job security. So it can be in the fund manager’s
interests to do as others do (this is sometimes referred to as the reputational reason for herding). Since
fund managers are often evaluated in relation to benchmarks based on the average performance of fund
managers, or based on stock indices, there could be an incentive to copy others since that would
prevent substantial underperformance relative to the benchmark.
Walter and Weber found positive feedback trading by mutual fund managers. In other words the
managers bought stocks following price rises and sold following falls. If such momentum trading is
common, it could be a cause of unintentional herding. Investors do the same thing because they are
following the same strategy. It can be difficult to know whether observed herding is intentional or
unintentional.
Hwang and Salmon (2006) investigated herding in the sense that investors, following the performance
of the market as a whole, buy or sell simultaneously. Investigating the US, UK, and South Korea they
found that herding increases with market sentiment. They found that herding occurs to a greater extent
when investor expectations are relatively homogeneous. Herding is strongest when there is confidence
about the direction in which the market is heading. Herding appeared to be persistent and slow moving.
This is consistent with the observation that some bubbles have taken years to develop.
Kirman (1991) suggests that investors may not necessarily base decisions on their own views about
investments but upon what they see as the majority view. The majority being followed are not
necessarily well-informed rational investors. The investors that are followed may be uninformed and
subject to psychological biases that render their behaviour irrational (from the perspective of
economists). Rational investors may even focus on predicting the behaviour of irrational investors
rather than trying to ascertain fundamental value (this may explain the popularity of technical analysis
among market professionals).
There are theories of the diffusion of information based on models of epidemics. In such models there
are ‘carriers’ who meet ‘susceptibles’ (Shiller, 1989). Stock market (and property market) bubbles and
crashes are likened to the spread of epidemics. There is evidence that ideas can remain dormant for
26
long periods and then be triggered by an apparently trivial event. Face-to-face communication appears
to be dominant, but the media also plays a role.
The media are an integral part of market events because they want to attract viewers and readers.
Generally, significant market events occur only if there is similar thinking among large groups of
people, and the news media are vehicles for the spreading of ideas. The news media are attracted to
financial markets because there is a persistent flow of news in the form of daily price changes and
company reports. The media seek interesting news. The media can be fundamental propagators of
speculative price movements through their efforts to make news interesting (Shiller 2000). They may
try to enhance interest by attaching news stories to stock price movements, thereby focusing greater
attention on the movements. The media are also prone to focus attention on particular stories for long
periods. Shiller refers to this as an ‘attention cascade’. Attention cascades can contribute to stock
market bubbles and crashes.
Davis (2006) confirmed the role of the media in the development of extreme market movements. The
media were found to exacerbate market responses to news, and to magnify irrational market
expectations. At times of market crisis the media can push trading activity to extremes. The media can
trigger and reinforce opinions.
It has been suggested that memes may play a part in the process by which ideas spread (Lynch, 2001).
Memes are contagious ideas. It has been suggested that the success of a meme depends upon three
critical factors: transmissivity, receptivity, and longevity. Transmissivity is the amount of
dissemination from those with the idea. Receptivity concerns how believable, or acceptable, the idea is.
Longevity relates to how long investors keep the idea in mind.
People in a peer group tend to develop the same tastes, interests and opinions (Ellison and Fudenberg
1993). Social norms emerge in relation to shared beliefs. These social norms include beliefs about
investing. The social environment of an investor influences investment decisions. This applies not only
to individual investors, but also to market professionals. Fund managers are a peer group; fundamental
analysts are a peer group; technical analysts are a peer group. Indeed market professionals in aggregate

27
form a peer group. It is likely that there are times when these peer groups develop common beliefs
about the direction of the stock market. Common beliefs tend to engender stock market bubbles and
crashes.
Welch (2000) investigated herding among investment analysts. Herding was seen as occurring when
analysts appeared to mimic the recommendations of other analysts. It was found that there was herding
towards the prevailing consensus, and towards recent revisions of the forecasts of other analysts. A
conclusion of the research was that in bull markets the rise in share prices would be reinforced by
herding.
Overconfidence
Self-deception is the process whereby people exaggerate their abilities. People tend to think that they
are better than they really are. One psychological bias is overconfidence. Overconfidence arises partly
from self-attribution bias. This is a tendency on the part of investors to regard successes as arising from
their expertise whilst failures are due to bad luck or the actions of others. This leads to excessive
confidence in one’s own powers of forecasting. It is capable of explaining a number of types of
apparently irrational behaviour. For example it can explain why some investors hold poorly diversified
portfolios. If investors are highly confident about their selection abilities, they will not feel the need to
reduce risk by means of diversification. It could also explain why some investors trade very frequently,
to the point where transaction costs cause their investment behaviour to be loss making.
Overconfidence can explain why some investors churn their portfolios; that is persistently sell and buy.
A confident belief in one’s ability to forecast price movements increases the likelihood of buying
expected winners and selling expected losers. This behaviour entails a new set of transaction costs or
initial charges each time with the effect that the investors lose. This churning may be recommended by
overconfident financial advisers (who incidentally receive a new set of commission payments each
time the churning occurs).
Psychological research has indicated that there is a self-attribution bias in decision-making. When an
investment is successful, the investor believes that it is due to his or her skill. An unsuccessful
investment is seen to fail as a result of bad luck or the actions of others. This self-attribution bias leads
28
to overconfidence. Overconfidence is also reinforced by the hindsight bias, which is the false belief
held by people who know the outcome of an event that they would have predicted the outcome.
Overconfidence may be particularly characteristic of inexperienced investors who find that their initial
investments are profitable. Their belief in their own skill leads them to invest more. So a bull market
can generate overconfidence, which causes more investing thereby reinforcing the upward price
movement. There is a Wall Street adage, which says: ‘Don’t confuse brains with a bull market’.
However there are those who interpret their gains in a bull market as arising from their own skills.
They see certainty where there is uncertainty. This can lead them to invest beyond a rational level, and
painful losses result when the market falls.
Overconfidence can arise from excessive confidence in the quality of one’s information and an
exaggerated view of one’s ability to interpret that information. This leads to an unwarranted degree of
certainty about the accuracy of one’s forecasts and a corresponding underestimation of risk (Barber and
Odean 1999). In consequence overconfident investors are prone to invest to a greater extent than would
be the case if they properly understood the quality of their forecasts. Barber and Odean have found that
overconfident investors tend to take more risk than less confident investors.
During the late 1990s there was a bull market, particularly in technology stocks. During the bull
market, individual investors increased their levels of trading. Investors allocated higher proportions of
their portfolios to shares, invested in riskier (often technology) companies, and many investors
borrowed money in order to increase their shareholdings (Barber and Odean, 2001). It is likely that,
during the bull market, individual investors attributed too much of their success to their own expertise
and became overconfident as a result.
Odean (1998) has shown that one of the effects of overconfidence is that turnover of investments tends
to be high, that is people trade shares more as a result of overconfidence. Statman, Thorley and
Vorkink (2006) found that trading volumes rose when stock prices had recently risen, which was seen
as consistent with the overconfidence bias; overconfident investors trade more frequently following
market gains since they mistakenly attribute their gains to their investment skills. Barber and Odean
(2000) have shown that as turnover rises net profits tend to fall. Psychological research has found that

29
men tend to be more overconfident than women. Barber and Odean (2001a) found that single men trade
67% more than single women. Correspondingly single men on average experienced investment returns
3.5% per year lower than single women.
Another psychological bias, which is related to overconfidence, is referred to as optimism or as self-
enhancement bias. Most people believe that they are above average. Researchers have found that this
belief relates to choosing investments, academic performance, and driving ability.
To the extent that some investors attribute profits from rising markets to their own talents, rising
markets could be self-perpetuating. Overconfident investors may be encouraged to invest further and
thereby reinforce an upward movement in stock prices. Conversely a falling market reduces confidence
and investing. This is consistent with the view that markets exhibit over-reaction; they rise too high and
fall too low (known as the over-reaction hypothesis). It also helps to explain why small investors tend
to buy following market rises, and sell following falls.
Another bias based on optimism is the outcome bias, which causes people to expect to get what they
want. Decisions are made in the expectation that what is wanted to happen will happen; in other words,
wishful thinking. An investor may expect a high return on an investment because a high return is what
is wanted. This could generate overconfidence and an underestimation of risk. Overconfidence could
be based on excessive belief in one’s own talents or on the belief that events will turn out to be
favourable. In both cases investors may overestimate the accuracy of their forecasts and underestimate
risk when making investment decisions.
Overconfident investors may be tempted to borrow money in order to buy additional shares. A feature
of bubbles is that share purchases are often financed with borrowed money. This is sometimes referred
to as buying on margin, or leveraged buying. Shares are used as collateral for loans taken out for their
purchase. There can be a circular process that entails rising share prices. This circular process is
illustrated by figure 1.
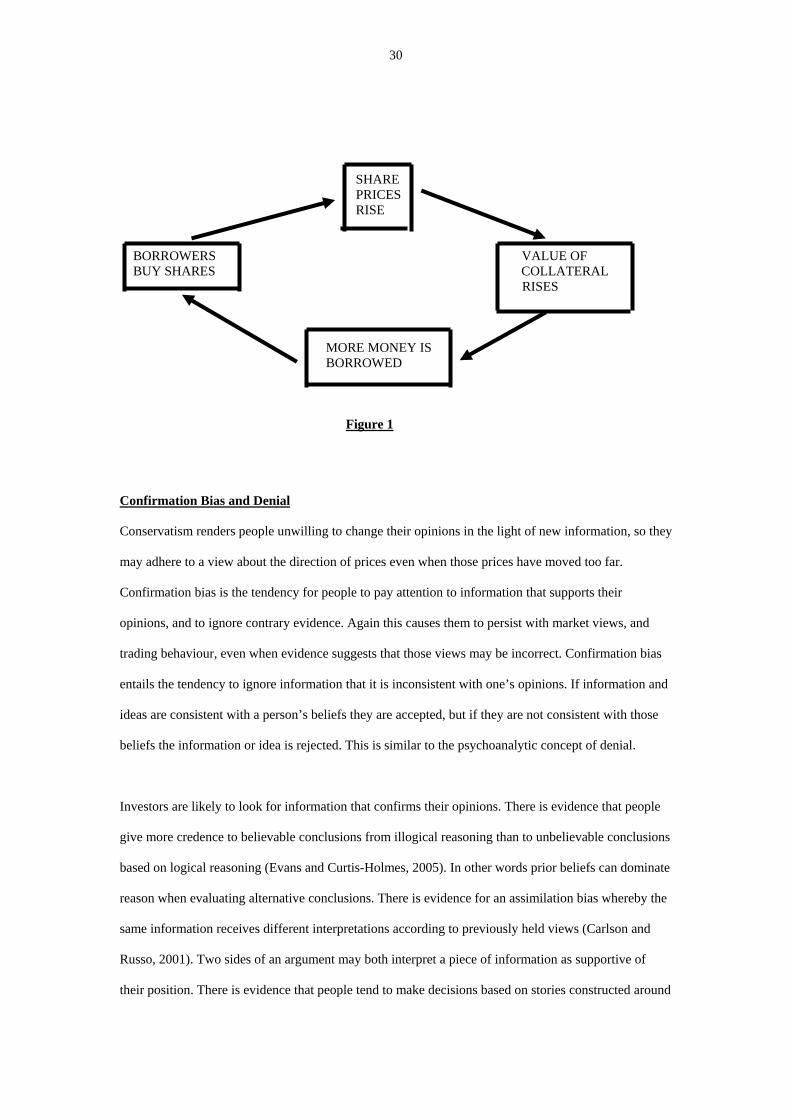
30
SHARE PRICES RISE BORROWERS VALUE OF BUY SHARES COLLATERAL RISES MORE MONEY IS BORROWED Figure 1
Confirmation Bias and Denial
Conservatism renders people unwilling to change their opinions in the light of new information, so they
may adhere to a view about the direction of prices even when those prices have moved too far.
Confirmation bias is the tendency for people to pay attention to information that supports their
opinions, and to ignore contrary evidence. Again this causes them to persist with market views, and
trading behaviour, even when evidence suggests that those views may be incorrect. Confirmation bias
entails the tendency to ignore information that it is inconsistent with one’s opinions. If information and
ideas are consistent with a person’s beliefs they are accepted, but if they are not consistent with those
beliefs the information or idea is rejected. This is similar to the psychoanalytic concept of denial.
Investors are likely to look for information that confirms their opinions. There is evidence that people
give more credence to believable conclusions from illogical reasoning than to unbelievable conclusions
based on logical reasoning (Evans and Curtis-Holmes, 2005). In other words prior beliefs can dominate
reason when evaluating alternative conclusions. There is evidence for an assimilation bias whereby the
same information receives different interpretations according to previously held views (Carlson and
Russo, 2001). Two sides of an argument may both interpret a piece of information as supportive of
their position. There is evidence that people tend to make decisions based on stories constructed around

31
facts rather than upon the facts themselves (Mulligan and Hastie, 2005). This could lead people to
favour information, which is consistent with their stories (explanations of events).
Taffler and Tuckett (2002) provided a psychoanalytic perspective on the technology-stock bubble and
crash of the late 1990s and early 2000s, and in so doing gave a description of investor behaviour totally
at odds with the efficient markets view of rational decision-making based on all relevant information.
They made it clear that people do not share a common perception of reality; instead everyone has their
own psychic reality. These psychic realities will have varying degrees of connection with objective
reality. Decisions are driven by psychic reality, which is a realm of feelings and emotions. Reason may
be secondary to feeling. Feeling affects the perception of reality. People are seen as engaging in wish-
fulfilment wherein they perceive reality so that it accommodates to what they want. People see what
they want to see. Unpleasant aspects of reality may be subject to denial, which is the pretence that
unpleasant events and situations have not happened. Denial reduces the ability to learn from unpleasant
experiences, since unpleasant experiences are removed from conscious awareness.
The unconscious mind operates as a censor that keeps out unpleasant information. People are
constantly bombarded by far more information than the human mind can handle. The unconscious
mind reduces incoming information to a quantity that can be dealt with. Although much of this rejected
information is rejected because it is peripheral to needs, some information may be rejected because it is
unpleasant. The conscious mind, the mind of which we are aware, does not receive complete
information. The efficient markets view of rational investors who base decisions on all relevant
information does not sit comfortably with this psychoanalytic view of mental processes.
In relation to stock market bubbles, the psychoanalytic view of Taffler and Tuckett sees stocks as
taking on a significance for the unconscious mind, which reflects experiences of infancy. The
unconscious mind has considerable influence over thinking and decision-making. Since people are not
aware of their unconscious minds, they are not aware of the influence of the unconscious mind over
decision-making. The unconscious mind may exclude uncomfortable aspects of reality from awareness.
When the bubble bursts, and prices fall, it becomes impossible to completely exclude unpleasant

32
aspects of objective reality from awareness. Feelings of anxiety, loss, panic and shame emerge. Selling
the shares as quickly as possible could then become part of the process of denial.
In the view of Bargh and Chartrand (1999) people’s goals, as well as their behaviours, are affected by
factors outside conscious awareness. Investment behaviour is likely to be affected by emotions, which
are outside conscious awareness (as well as by emotions of which the person is aware).
The Market Fall
Bubbles and crashes have a history that goes back at least to the 17th century (MacKay 1852). Some
writers have suggested that bubbles show common characteristics. Band (1989) said that market tops
exhibited the following features:
1. Prices have risen dramatically.
2. Widespread rejection of the conventional methods of share valuation, and the emergence of
new ‘theories’ to explain why share prices should be much higher than the conventional
methods would indicate.
3. Proliferation of investment schemes offering very high returns very quickly.
4. Intense, and temporarily successful, speculation by uninformed investors.
5. Popular enthusiasm for leveraged (geared) investments.
6. Selling by corporate insiders, and other long-term investors.
7. Extremely high trading volume in shares.
The bubble phase leads to share prices reaching unrealistic levels. These are share price levels far in
excess of what can be justified by fundamental analyses using dividend discount models or price-
earnings ratios. Indeed one feature of bubbles, identified by Kindleberger and Aliber (2005), is the
emergence of 'new age' theories. New age theories are ad hoc theories that seek to justify why prices
should be far in excess of what conventional share valuation models suggest.
There may then be an occurrence that causes prices to fall rapidly. One such occurrence might be the
emergence of new companies. The new companies compete with existing ones and push down their
profits. Also when the new companies float on the stock market, the additional supply of shares will

33
help to depress share prices. Towards the end of the 1999-2000 technology stock bubble many new
companies were issuing shares. This increased supply of shares overtook the growth in demand for
shares. The result was that the prices of shares in the technology sector began to fall.
Rising interest rates could be another occurrence that leads to falling share prices. Bubbles often
involve people borrowing money in order to buy shares. High interest rates could cause investors to sell
shares in order to pay the interest. Such sales could set off a crash. In Japan in 1990 interest rates rose
sharply. This was followed by collapses in the prices of both shares and property. Rising interest rates
can also reduce the demand for shares by making alternatives such as bank deposits more attractive.
Higher interest rates also reduce expenditure on goods and services and thereby lower corporate profits.
Lower expected profits can cause a fall in share prices.
Other factors that can precipitate share price collapses include share sales resulting from negative
statements by people who are looked upon as experts. These may be genuine experts such as governors
of central banks, or self-appointed experts such as newspaper gurus. Also prospective investors may
stop buying because they deplete their sources of money. The flow of new investors on to the market
will eventually stop. These factors can start a crash by increasing sales of shares and decreasing
purchases. Cassidy suggested that a crash could be precipitated by a random event, or have no apparent
catalyst, if stock prices have reached sufficiently unrealistic levels.
Lux (1995) provided a model of bubbles and crashes in which the decline in the numbers of new
investors plays an important part in the development of a crash. The model entailed contagion and herd
behaviour pushing stock prices to excessively high, or excessively low, levels. Declines from bubbles,
and recoveries from crashes, come about because fundamentals play a role in investment decisions. In
particular as the rate of return on investments declines, due to the rate of price increase slowing, and
the number of new buyers declines the market will turn down. The exhaustion of the pool of potential
buyers is an important factor in the slowdown of stock price rises. The bubble is replaced by a decline,
which becomes powered by contagion and herding. The decline ends in a crash, which is reversed in a
manner similar to the ending of the bubble. A slowing rate of decline, and reduction in number of
34
sellers, improves sentiment and provides the basis for a market rise. The market thus moves between
over-valuation and under-valuation.
Experimental findings on bubbles from Caginalp and Ilieva (2008) appear to be broadly consistent with
the model offered by Lux. The Caginalp and Ilieva analysis puts the emphasis on potential buyers
running out of money rather than the supply of new buyers declining. Investor response to changes in
the rate of increase in prices played a role in the Caginalp and Ilieva analysis as well as in the Lux
model.
Caginalp and Ilieva found that some investors changed strategy between momentum (following market
trends) and fundamental (believing that there is a correct price towards which the market will move).
When the market was rising rapidly some fundamental investors switched to a momentum strategy,
thereby reinforcing the upward trend in prices. When the rate of price increase slowed there was a
tendency to switch back to a fundamental strategy, thereby reducing purchases and reinforcing the
slowdown. At the peak of the market, momentum traders had no remaining cash for further investment
and fundamental investors had no wish to buy at high prices. In consequence stock prices fell.
According to Pepper and Oliver a long period of rising prices is associated with an accumulation of
investors who need to sell (since their holdings of money are less than the desired levels). Such
investors may delay asset sales while prices continue to rise. A continuing rise in prices is likely to
attract speculative investors who do not plan to hold the investments for the long term; Pepper and
Oliver refer to their investments as being loosely held. A long period of rising prices would lead to
many investors needing to sell shares in order to raise money for other purposes, and to many
speculators with loosely held shares. When the expectation of price rises disappears, both groups of
investors will sell. Share prices fall sharply.
Eventually social mood passes its peak and cognitive rationality comes to dominate social mood.
Investors sell and prices fall. If social mood continues to fall, the result could be a crash in which stock
prices fall too far. The situation is then characterised by an unjustified level of pessimism, and
investors sell shares even when they are already under-priced. Investors’ sales drive prices down
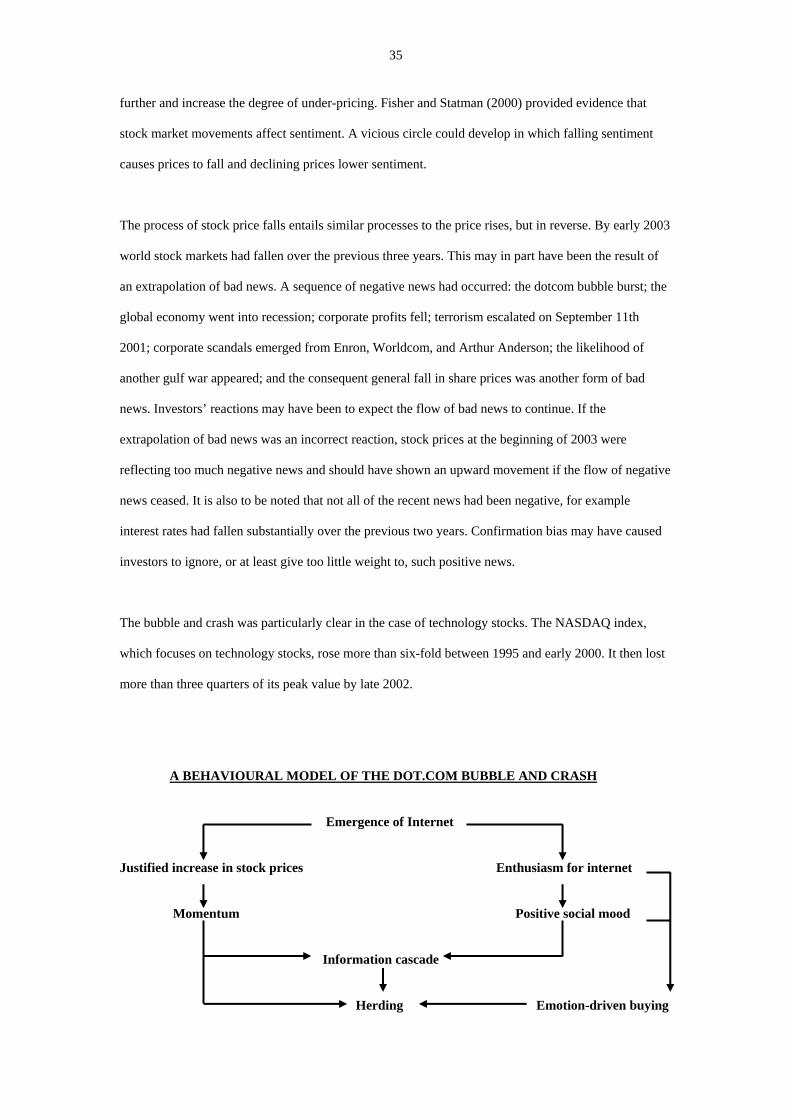
35
further and increase the degree of under-pricing. Fisher and Statman (2000) provided evidence that
stock market movements affect sentiment. A vicious circle could develop in which falling sentiment
causes prices to fall and declining prices lower sentiment.
The process of stock price falls entails similar processes to the price rises, but in reverse. By early 2003
world stock markets had fallen over the previous three years. This may in part have been the result of
an extrapolation of bad news. A sequence of negative news had occurred: the dotcom bubble burst; the
global economy went into recession; corporate profits fell; terrorism escalated on September 11th
2001; corporate scandals emerged from Enron, Worldcom, and Arthur Anderson; the likelihood of
another gulf war appeared; and the consequent general fall in share prices was another form of bad
news. Investors’ reactions may have been to expect the flow of bad news to continue. If the
extrapolation of bad news was an incorrect reaction, stock prices at the beginning of 2003 were
reflecting too much negative news and should have shown an upward movement if the flow of negative
news ceased. It is also to be noted that not all of the recent news had been negative, for example
interest rates had fallen substantially over the previous two years. Confirmation bias may have caused
investors to ignore, or at least give too little weight to, such positive news.
The bubble and crash was particularly clear in the case of technology stocks. The NASDAQ index,
which focuses on technology stocks, rose more than six-fold between 1995 and early 2000. It then lost
more than three quarters of its peak value by late 2002.
A BEHAVIOURAL MODEL OF THE DOT.COM BUBBLE AND CRASH Emergence of Internet Justified increase in stock prices Enthusiasm for internet Momentum Positive social mood Information cascade Herding Emotion-driven buying
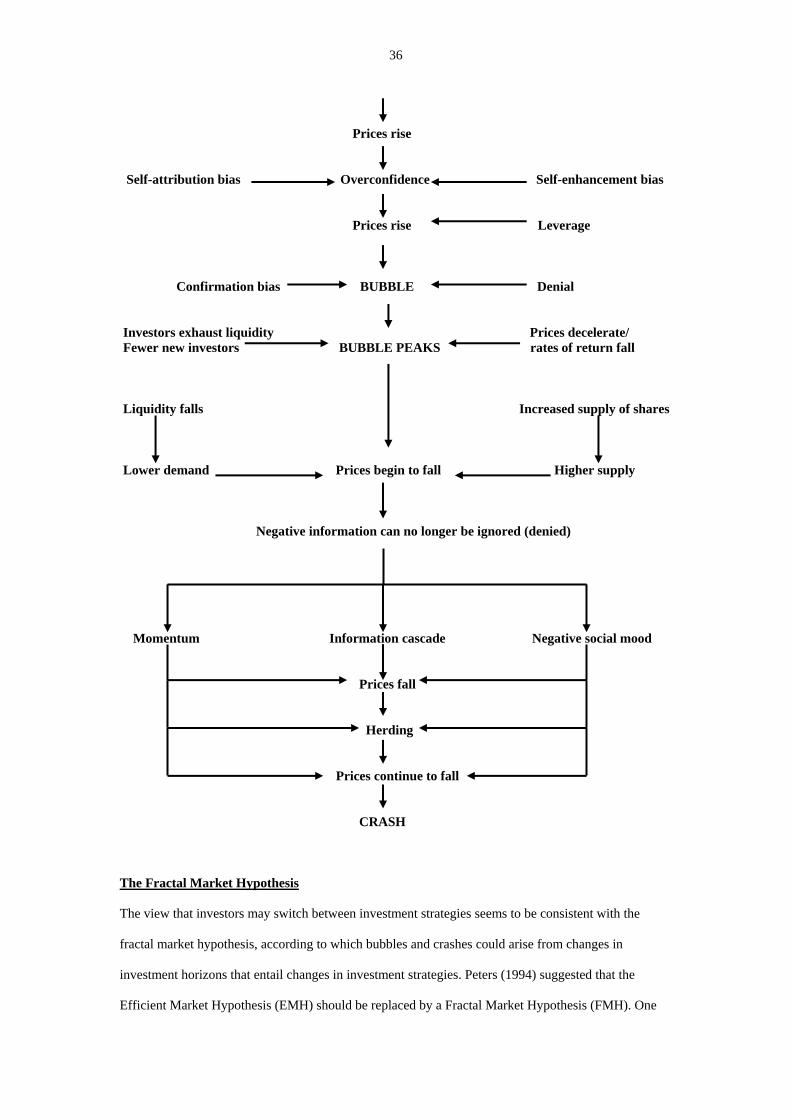
36
Prices rise Self-attribution bias Overconfidence Self-enhancement bias Prices rise Leverage Confirmation bias BUBBLE Denial Investors exhaust liquidity Prices decelerate/ Fewer new investors BUBBLE PEAKS rates of return fall Liquidity falls Increased supply of shares Lower demand Prices begin to fall Higher supply Negative information can no longer be ignored (denied) Momentum Information cascade Negative social mood Prices fall Herding Prices continue to fall CRASH The Fractal Market Hypothesis The view that investors may switch between investment strategies seems to be consistent with the
fractal market hypothesis, according to which bubbles and crashes could arise from changes in
investment horizons that entail changes in investment strategies. Peters (1994) suggested that the
Efficient Market Hypothesis (EMH) should be replaced by a Fractal Market Hypothesis (FMH). One

37
feature of fractal analysis is that it allows for a multiplicity of investment horizons. This contrasts with
the Capital Asset Pricing Model, which assumes that all investors have the same investment horizon.
Peters offered some basic assumptions of the FMH, including:
1. The market consists of many individuals covering a large number of investment horizons. At
one extreme is the day trader who changes the investment portfolio on a daily basis, whereas
at the other extreme may be a pension fund that changes its portfolio slowly and has a long
investment horizon. However both types of investor trade in the market, and they both provide
liquidity for the other.
2. Reaction to information depends upon the investment horizon. Short-horizon investors and
long-horizon investors react to different types of information. Correspondingly they may use
different types of analysis; perhaps technical analysis in the case of short-horizon investors
and fundamental analysis in the case of long-horizon investors.
3. The stability of the market depends on depth and liquidity, and a large number of investors
with many different investment horizons create depth and liquidity in the market. A market
crash, as perceived by a short-horizon investor, may be a buying opportunity when seen by a
long-horizon investor. The sales of the former provide the purchases of the latter, and stability
ensues. If long-horizon investors shorten their investment horizons, perhaps due to increased
uncertainty, the liquidity and stability from the variety of horizons is reduced. When horizons
become uniform a market bubble, or market crash, could ensue as all investors react to the
same news in the same way.
4. Prices reflect a combination of short-term technical trading and long-term fundamental
valuation. The long-term trend in the market reflects changes in expected earnings, which are
likely to be related to economic cycles. Short-term trends are more likely to reflect crowd
psychology. Economic cycles are less volatile than trading activity, which makes long-term
stock market returns less volatile than short-term movements (Rachev, Weron and Weron
1999).
References Abreu, D. and M. Brunnermeier (2002). “Synchronization Risk and Delayed Arbitrage”, Journal of Financial Economics , 66.

38
Abreu, D. and M. Brunnermeier (2003). “Bubbles and Crashes”, Econometrica , 71. Allen, F. and D. Gale (2000). “Bubbles and Crises”, Economic Journal , 110, pp. 236-255. Baker, H.K. and J.R.Nofsinger (2002). “Psychological Biases of Investors”, Financial Services Review , 11. Band, R.E. (1989). ‘Contrary Investing for the ‘90s’, St Martin’s Press. Barber, B. and T. Odean (1999). “The Courage of Misguided Convictions”, Financial Analysts Journal , 55. Barber, B. and T.Odean (2000). “Trading is Hazardous to Your Wealth: the Common Stock Investment Performance of Individual Investors”. Journal of Finance, 55. Barber, B. and T. Odean (2001a). “Boys Will Be Boys: Gender, Overconfidence, and Common Stock Investment”, Quarterly Journal of Economics , 116. Barber, B. and T. Odean (2001). “The Internet and the Investor”, Journal of Economic Perspectives , 15. Barber, B. and T. Odean (2002). “Online Investors: Do the Slow Die First?”, Review of Financial Studies , 15. Barberis, N., A. Shleifer and R.Vishny (1998). “A Model of Investor Sentiment”, Journal of Financial Economics, 49. Bargh, J.A. and T.L. Chartrand (1999). “The Unbearable Automaticity of Being”, American Psychologist , 54. Best, K. (2005). “Celebrity.com: Internet Finance and Frenzy at the Millennium”, Consumption, Markets and Culture , 8. Boswijk, H.P., C.H. Hommes and S. Manzan (2007). “Behavioral Heterogeneity in Stock Prices”, Journal of Economic Dynamics & Control , 31. Byrne, K. (2005). “How Do Consumers Evaluate Risk in Financial Products?”, Journal of Financial Services Marketing , 10, 1, pp. 21-36. Caginalp, G. and V. Ilieva (2008). “The Dynamics of Trader Motivations in Asset Bubbles”, Journal of Economic Behavior & Organization , 66, 3/4, pp. 641-656. Caginalp, G.; D. Porter and V. Smith (2000). “Overreaction, Momentum, Liquidity and Price Bubbles in Laboratory and Field Asset Markets”, Journal of Psychology and Financial Markets, 1. Caginalp, G.; D. Porter and V. Smith (2001). “Financial Bubbles: Excess Cash, Momentum, and Incomplete Information”, Journal of Psychology and Financial Markets , 2, 2, pp.80-99. Camerer, C.F. (1981). “General Conditions for the Success of Bootstrapping Models”, Organizational Behavior and Human Performance , 27. Carlson, K.A. and J.E. Russo (2001). “Biased Interpretation of Evidence by Mock Jurors”, Journal of Experimental Psychology: Applied , 7. Cassidy, J. (2002). ‘dot.con: the Greatest Story Ever Told’, Penguin. Clarke, R.G. and M. Statman (1998). “Bullish or Bearish”, Financial Analysts Journal , 54.

39
Congdon, T. (2006). “Money, Asset Prices and the Boom-Bust Cycles in the UK: An Analysis of the Transmission Mechanism from Money to Macro-Economic Outcomes”, in K. Matthews and P. Booth (Ed) ‘Issues in Monetary Policy’, Wiley. Cooper, M.; I. Dimitrov and R.Rau (2001). “A Rose.com by Any Other Name”, Journal of Finance , 56. Cooper, M. J.; A. Khorana; I. Osobov, A. Patel and P.R. Rau (2005). “Managerial Actions in Response to a Market Downturn: Valuation Effects of Name Changes in the Dot.com Decline”, Journal of Corporate Finance , 11, 1-2, pp. 319-335. Davis, A. (2006). “The Role of the Mass Media in Investor Relations”, Journal of Communication Management , 10. DeBondt, W.F.M. (1993). “Betting on Trends: Intuitive Forecasts of Financial Risk and Return”, International Journal of Forecasting, 9. DeBondt, W.F.M. (1998). “A Portrait of the Individual Investor”, European Economic Review , 42. Deutsch, M. and H.Gerard (1955). “A Study of Normative and Informational Influence upon Individual Judgment”, Journal of Abnormal and Social Psychology , 51. Dreman, D. (2001). “The Role of Psychology in Analysts’ Estimates”, Journal of Psychology and Financial Markets , 2. Dufwenberg, M.; T. Lindqvist and E. Moore (2005). “Bubbles and Experience: An Experiment”, American Economic Review , 95. Dunn, J.R. and M.E. Schweitzer (2005). “Feeling and Believing: The Influence of Emotions on Trust”, Journal of Personality and Social Psychology , 88. Dweck, C.S. and E.L. Leggett (1988). “A Social-Cognitive Approach to Motivation and Personality”, Psychological Review , 95. Edelen, R.M. and J.B. Warner (2001). “Aggregate Price Effects of Institutional Trading: A Study of Mutual Fund Flow and Market Returns”, Journal of Financial Economics , 59. Ellison, G. and D. Fudenberg (1993). “Rules of Thumb for Social Learning”, Journal of Political Economy , 101. Evans, J. ST.B.T. and J. Curtis-Holmes (2005). “Rapid Responding Increases Belief Bias: Evidence for the Dual Process Theory of Reasoning”, Thinking and Reasoning , 11. Fenton-O’Creevy, M.; N. Nicholson; E. Soane and P.Willman (2005). ‘Traders: Risks, Decisions, and Management in Financial Markets’, Oxford University Press. Fisher, K.L. and M. Statman (2000). “Investor Sentiment and Stock Returns”, Financial Analysts Journal , 56. Fisher, K.L. and M. Statman (2002). “Blowing Bubbles”, Journal of Psychology and Financial Markets , 3. Forgas, J.P. (1995). “Mood and Judgment: The Affect Infusion Model (AIM)”, Psychological Bulletin, 117. Friedland, N.; G. Keinan, and Y. Regev (1992). “Controlling the Uncontrollable – Effects of Stress on Illusory Perceptions of Controllability”, Journal of Personality and Social Psycholgy , 63. Galbraith, J.K. (1988). ‘The Great Crash 1929’, Houghton Mifflin.
40
Gollwitzer, P.M. and R.F.Kinney (1989). “Effects of Deliberative and Implemental Mind-Sets on Illusion of Control”, Journal of Personality and Social Psychology , 56. Grable, J.; R. Lytton and B. O’Neill (2004). “Projection Bias and Financial Risk Tolerance”, Journal of Behavioral Finance , 5. Grable, J.; R.H. Lytton; B. O’Neill; S-H. Joo and D. Klock (2006). “Risk Tolerance, Projection Bias, Vividness, and Equity Prices”, Journal of Investing , 15. Hirschey, M., V.J. Richardson and S. Scholz (2000). “How ‘Foolish’ Are Internet Investors?’, Financial Analysts Journal , 56 (1), pp. 62-69. Hirshleifer, D. (2001). “Investor Psychology and Asset Pricing.” Journal of Finance ,56. Hirshleifer, D. and T. Shumway (2003). “Good Day Sunshine: Stock Returns and the Weather”, Journal of Finance , 58. Hwang, S. and M. Salmon (2006). “Sentiment and Beta Herding”, Paper presented to the Behavioural Finance and Market Efficiency Workshop, University of Warwick, March. Indro, D.C. (2004). “Does Mutual Fund Flow Reflect Investor Sentiment?”, Journal of Behavioral Finance , 5. Kahneman, D. and A. Tversky (1983). “Extensional Versus Intuitive Reasoning: the Conjunction Fallacy in Probability Judgement”, Psychological Review . Kamstra, M., L. Kramer and M. Levi (2003). “Winter Blues: A Sad Stock Market Cycle”, American Economic Review , 93. Karceski, J. (2002). “Returns-Chasing Behavior, Mutual Funds, and Beta’s Death”, Journal of Financial and Quantitative Analysis , 37. Kavanagh, D.J.; J. Andrade and J. May (2005). “Imaginary Relish and Exquisite Torture: The Elaborated Intrusion Theory of Desire”, Psychological Review , 112. Keynes, J. M. (1936). ‘The General Theory of Employment, Interest and Money.’ Macmillan. Kindleberger, C. P. (1989). ‘Manias, Panics, and Crashes: A History of Financial Crises.’ Macmillan. Kindleberger, C. P. and R.Z. Aliber. (2005). ‘Manias, Panics, and Crashes: A History of Financial Crises.’ (5th Ed), Palgrave Macmillan. Kirman, A.P. (1991). “Epidemics of Opinion and Speculative Bubbles in Financial Markets”. In M. Taylor (ed.), ‘Money and Financial Markets’. MacMillan. Lakonishok, J.; A. Shleifer and R. W. Vishny (1994). ‘Contrarian Investment, Extrapolation and Risk’. Journal of Finance, 49. Langer, E.J. (1975). “The Illusion of Control”, Journal of Personality and Social Psychology , 32. Lee, I.H. (1998). “Market Crashes and Informational Avalanches”, Review of Economic Studies , 65. Loewenstein, G.; T. O’Donoghue and M. Rabin (2003). “Projection Bias in Predicting Future Utility”, Quarterly Journal of Economics , 118. Loewenstein, G.F.; E.U. Weber; C.K. Hsee and N. Welch (2001). “Risk as Feelings”, Psychological Bulletin , 127. Lovink, G. (2002). ‘Dark Fiber: Tracking Critical Internet Culture’, MIT Press.

41
Lux, T. (1995). “Herd Behaviour, Bubbles and Crashes”, Economic Journal , 105 (431), pp.881-896. Lynch, A. (2001). “Thought Contagions in the Stock Market”, Journal of Psychology and Financial Markets, 1. MacKay, C. (1852). ‘Extraordinary Popular Delusions and the Madness of Crowds’, (republished by Barnes & Noble 1989). MacKillop, S. (2003). “Confidence Builder”, Investment Advisor , March. Mehra, R. and R. Sah (2002). “Mood Fluctuations, Projection Bias, and Volatility of Equity Prices”, Journal of Economic Dynamics and Control , 26. Montier, J. (2002), ‘Behavioural Finance’, Wiley. Mosebach, M. and M. Najand (1999). “Are the Structural Changes in Mutual Funds Investing Driving the U.S. Stock Market to Its Current Levels?”, Journal of Financial Research , 22. Mulligan, E.J. and R. Hastie (2005). “Explanations Determine the Impact of Information on Financial Investment Judgements”, Journal of Behavioural Decision Making , 18. Neal, R. and S.M. Wheatley (1998). “Do Measures of Investor Sentiment Predict Returns?”, Journal of Financial and Quantitative Analysis , 33. Nofsinger, J.R. (2002). ‘The Psychology of Investing’ (1st Ed.). Pearson Education/Prentice Hall. Nofsinger, J.R. (2002b). “Do Optimists Make the Best Investors?”, Corporate Finance Review , 6. Nofsinger, J.R. (2005). ‘The Psychology of Investing’ (2nd Ed.). Pearson Education/Prentice Hall. Nofsinger, J.R. (2005a). “Social Mood and Financial Economics”, Journal of Behavioral Finance , 6. Northcraft, G. and M. Neale (1987). “Experts, Amateurs, and Real Estate: an Anchoring Perspective on Property Pricing Decisions”, Organizational Behavior and Human Decision Processes , 39. Odean, T. (1998). “Volume, Volatility, Price and Profit When All Traders are Above Average”, Journal of Finance, 53. Odean, T. (1999). “Do Investors Trade Too Much?”, American Economic Review , 89. Olsen, R.A. (1997). “Investment Risk: The Experts’ Perspective”, Financial Analysts Journal , 53. Olsen, R.A. (1998). “Behavioral Finance and its Implications for Stock-Price Volatility”, Financial Analysts Journal , 54. Olson, K.R. (2006). “A Literature Review of Social Mood”, Journal of Behavioral Finance , 7. Pepper, G. and M.J.Oliver (2006). ‘The Liquidity Theory of Asset Prices’. Wiley Peters, E.E. (1994). ‘Fractal Market Analysis: Applying Chaos Theory to Investment and Economics’, Wiley. Peterson, D. and G. Pitz (1988). “Confidence, Uncertainty, and the Use of Information”, Journal of Experimental Psychology , 14. Peterson, R.L. (2007). “Affect and Financial Decision-Making: How Neuroscience Can Inform Market Participants”, Journal of Behavioral Finance , 8, 2, pp.70-78. Prechter, R.R. (1999). ‘The Wave Principle of Human Social Behavior and the New Science of Socionomics’, New Classics Library.

42
Prechter, R.R. (2001). “Unconscious Herding Behavior as the Psychological Basis of Financial Market Trends and Patterns”, Journal of Psychology and Financial Markets , 2. Presson, P. and V. Benassi (1996). “Illusion of Control: A Meta-Analytic Review”, Journal of Social Behavior and Personality , 11. Rachev, S.T.; A. Weron, and R. Weron (1999). “A DEC Model for Asset Returns and the Fractal Market Hypothesis”, Mathematical and Computer Modelling , 29. Randall, M.R.; D.Y. Suk and S.W. Tully (2003). “Mutual Fund Cash Flows and Stock Market Performance”, Journal of Investing , 12. Riess, M. and J.Taylor (1984). “Ego-Involvement and Attributions for Success and Failure in a Field Setting”, Personality and Social Psychology Bulletin , 10. Sandelands, L.E.; J. Brockner, and M.A. Glynn (1988). “If At First You Don’t Succeed, Try, Try Again: Effects of Persistence Performance Contingencies, Ego Involvement, and Self-Esteem on Task Persistence”, Journal of Applied Psychology , 73. Shefrin, H. (2000). “Beyond Fear and Greed: Understanding Behavioral Finance and the Psychology of Investing”. Harvard Business School Press. Shiller, R.J. (1984). “Stock Prices and Social Dynamics”, Brookings Papers on Economic Activity , 2. Shiller, R.J. (1987). ‘Investor Behavior in the October 1987 Stock Market Crash: Survey Evidence’, National Bureau of Economic Research, Working Paper No. 2446. Shiller, R.J. (1989). ‘Market Volatility’. MIT Press. Shiller, R.J. (2000, 2005). ‘Irrational Exuberance’, Princeton University Press. Shleifer, A. and L.H. Summers (1990). “The Noise Trader Approach to Finance”, Journal of Economic Perspectives, 4. Slovic, P.; M. Finecane; E. Peters and D. MacGregor (2002). “The Affect Heuristic” in ‘Heuristics and Biases: The Psychology of Intuitive Judgment’, Gilovich, T.; D. Griffin and D. Kahneman (Eds), Cambridge University Press. Smith, V.L. (1991). “Rational Choice: The Contrast Between Economics and Psychology”, Journal of Political Economy , 99. Statman, M.; K.L. Fisher and D. Anginer (2008). “Affect in a Behavioral Asset-Pricing Model”, Financial Analysts Journal , 64, 2, pp. 20-29. Statman, M.; S. Thorley and K. Vorkink (2006). “Investor Overconfidence and Trading Volume”, Review of Financial Studies , 19. Taffler, R.J. and D.A. Tuckett (2002). “Anomalous Valuations of Internet Stocks: A Psychoanalytic Interpretation of dot.com Mania”, Sixth Annual Financial Reporting and Business Communication Conference, Cardiff Business School. Taylor, S.E. and D.A. Armor (1996). “Positive Illusions and Coping with Adversity”, Journal of Personality , 64. Thaler, R. and E. Johnson (1990). “Gambling with the House Money and Trying to Break Even: The Effects of Poor Outcomes on Risky Choice”, Management Science , 36. Tumarkin, R. and R.F. Whitelaw (2001). “News or Noise? Internet Postings and Stock Prices”, Financial Analysts Journal , 57.

43
Tversky, A. and D. Kahneman (1982). “Judgment Under Uncertainty: Heuristics and Biases”. In D. Kahneman, P. Slovic and A. Tversky (eds) ‘Judgment Under Uncertainty: Heuristics and Biases.’ Cambridge University Press. Walter, A. and F.M. Weber (2006). “Herding in the German Mutual Fund Industry”, European Financial Management , 12. Warther, V.A. (1995). “Aggregate Mutual Fund Flow and Security Returns”, Journal of Financial Economics ,39. Welch, I. (2000). “Herding among Security Analysts”, Journal of Financial Economics , 58. Wright, W. and G. Bower (1992). “Mood Effects on Subjective Probability Assessment”, Organizational Behavior and Human Decision Processes , 52. Yao, R.; S.D. Hanna and S. Lindamood (2004). “Changes in Financial Risk Tolerance, 1983-2001”, Financial Services Review , 13. Yuen, K.S.L. and T.M.C. Lee (2003). “Could Mood State Affect Risk-Taking Decisions?”, Journal of Affective Disorders , 75.
Keith Redhead Coventry University Business School 4th August 2008