Embed Size (px)
Citation preview
1
A Basic Checklist for Observational Studies in Political Science
Yiqing Xu ([email protected])
March 2021
I have been teaching Intro to Statistics and Causal Inference to political science students at the graduate level over the past few years. I find that I was constantly repeating myself on some very basic points. Below is a checklist for analyzing observational data that I hope will be helpful to new practitioners. They are extremely basic and are in no way comprehensive, but in my humble opinion, can remove many potential spurious results in empirical analyses. The bottom line is: please look at your data first! 1. Draw the histograms of the key variables, including the treatment and the outcome. Are these distributions highly skewed or have outliers?
Source: https://afit-r.github.io/histograms
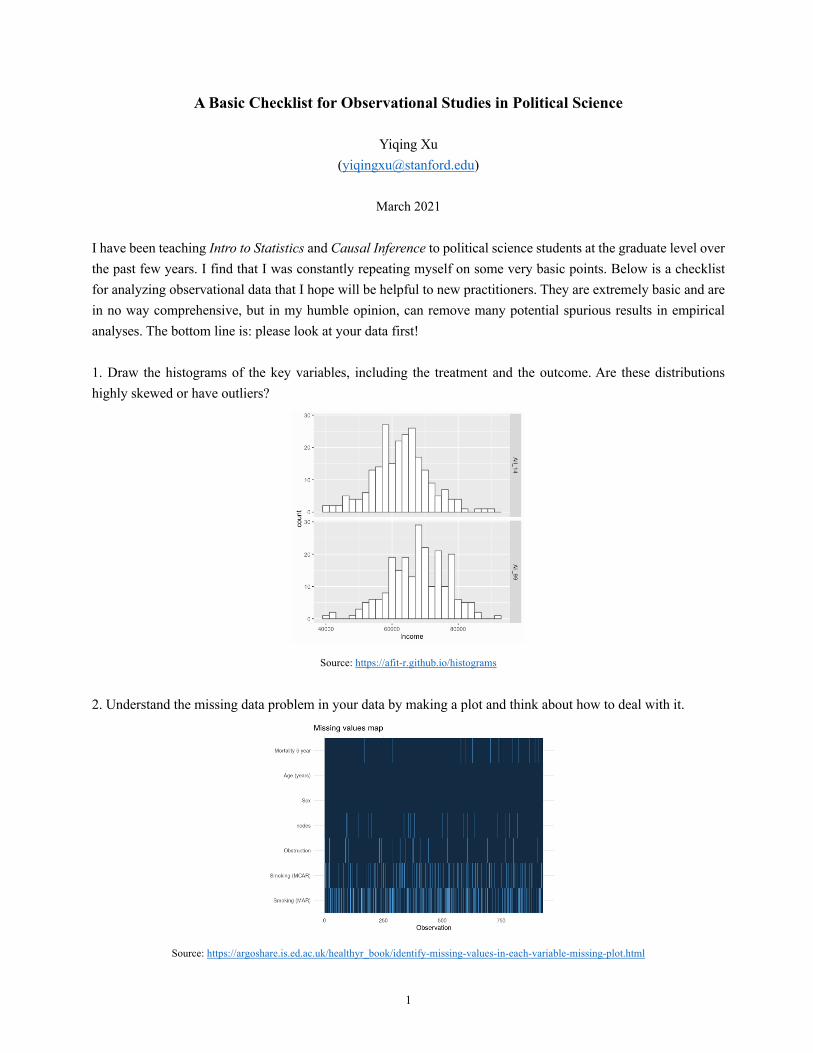
2. Understand the missing data problem in your data by making a plot and think about how to deal with it.
Source: https://argoshare.is.ed.ac.uk/healthyr_book/identify-missing-values-in-each-variable-missing-plot.html

2
3. Draw a bivariate scatterplot of the treatment and the outcome or a scatterplot between the residualized treatment and residualized outcome. Overlay it with a loess curve. Does your result hold when you “winsor” 5% of the extreme values in your treatment or outcome variables?
Source: https://learnr.wordpress.com/2009/03/10/loess-smoothing/
4. Check whether your “treatment” and “control” groups overlap on key pretreatment covariates. 5. Remember to cluster your standard errors properly—ideally using blocked (wild) bootstrap. One sanity check is to collapse your data to the level where treatment is assigned and run a simple regression using the collapsed data. 6. If you model includes an interaction term, check whether the linearity assumption looks plausible.
Source: http://bit.ly/interflex

3
7. If you’re analyzing panel data, understanding where your treatment variation comes is crucial. Draw a plot to show how the treatment status changes within a unit over time, for example:
Source: http://bit.ly/panelView
8. If you use difference-in-differences design (or use a twoway fixed effects model), draw a dynamic treatment effect plot.
Source: https://bit.ly/2NZZGo7

4
9. If you use a regression discontiguity (RD) design, draw a RD plot for the reduced form. If it’s a fuzzy RD, draw one for the first stage as well. Same for an interrupted time series design.
Source: https://wytham.rbind.io/html/cbus_dsmeetup/econ_toolkit_2019-06-19.html#54
10. If you use an instrumental variable (IV) design, compare your IV estimates with your OLS estimates. A big discrepancy is suspicious (if your primary concern for the OLS is upward bias) and needs explanation. When your instrument, treatment, and outcome variables are continuous, plotting both the first-stage and the reduced form relationships will be helpful.
Source: https://academic.oup.com/qje/article-abstract/114/2/533/1844228