Embed Size (px)
Citation preview
The emission band spectrum of chlorine 469
D escription of Plate 29
F ig . 2. (a) Microphotometer record of spectrogram showing ultra-violet continua of Cl2 excited by high-frequency discharge.
(b) Record of spectrum of Cl2 in active nitrogen, on same wave-length scale as (a).The diffuse bands are indicated by dots (above the recording line for the long progression, below for the short progression). The bands near the maximum 2580 A cannot be seen, as there the photographic image is too dense. The intensities of the maximum at 2580 are comparable in (a) and (b).
(c) and (d) Shorter exposures of the spectra shown in (a) and ( ) respectively, showingmore detail near the maximum at 2580 A. Note the absence of structure in the high frequency spectrum (c).
(e) Enlargement of plate used for making record (d), on approximately the same wave-length scale as the record.
A band spectrum attributed to NBr
By A. Elliott, Ph .D., D.Sc.Physics Department, The University of Sheffield
(Communicated by S. R. Milner, F.R.S.— Received 26 September 1938)
[Plate 30]
Introduction
In the course of an investigation on the spectra of the halogens and other substances excited by active nitrogen, Strutt and Fowler (1912) observed that, when bromine was admitted into the glowing nitrogen, a feeble orange luminosity was developed. Visual observation with a spectroscope revealed eight narrow bands in the orange region of the spectrum, at intervals of about 28 A. In addition to these bands, a broad symmetrical band with ill-defined edges at 2930 and 2890 A was photographed. This work does not appear to have been followed up.' As the apparatus used for a recent similar investigation with chlorine was available (Cameron and Elliott 1938), it seemed worth while attempting to photograph the orange bands with the rapid panchromatic material now available. This attempt has proved successful, and the results will now be described.
3 0 - 2
on November 6, 2018http://rspa.royalsocietypublishing.org/Downloaded from
470 A. Elliott
Experimental
Liquid bromine was contained in a small bulb immersed in melting ice, connected by means of a long fine capillary tube to the after-glow tube containing streaming active nitrogen. The bromine vapour passed through the capillary tube, and in the after-glow tube the orange glow referred to above was produced. The light from the glowing gas mixture was examined spectroscopically. A single glass prism Littrow instrument, of which the
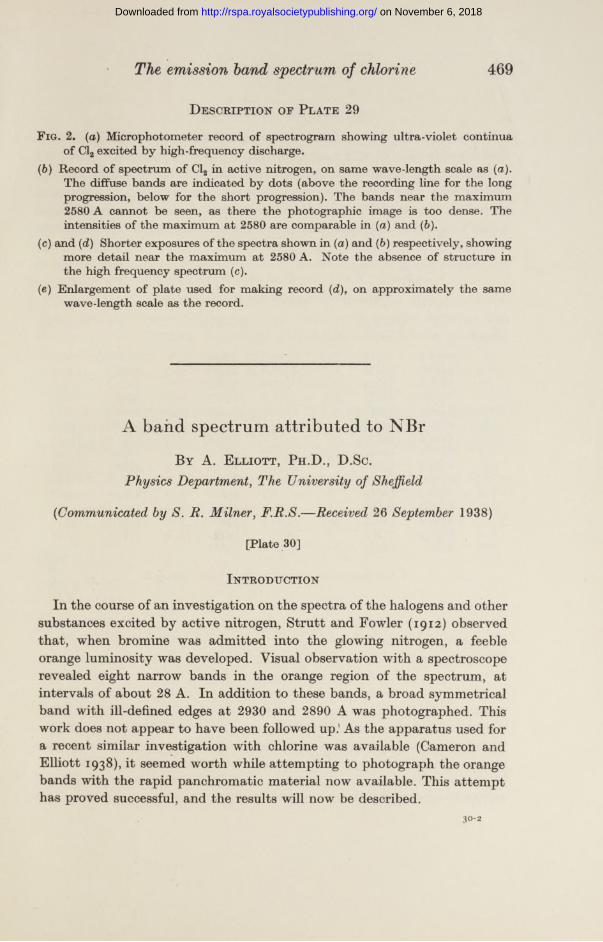
Table I. Wave-lengths and wave numbers ofBAND HEADS ATTRIBUTED TO 14N81Br
A Wave n<Band A cm.-1
* 6544-4 152766-6 6487-5 15410
* 6468-2 15456* 6460-2 15475
7-7 6445-7 15510* 6418-8 15575
1-0 6404-8 156102-1 6370-1 156949-9 6363-6 15710
* 6352-7 157373-2 6335-4 157804-3 6300-2 15868
* 6282-4 159135-4 6265-9 159556-5 6231-1 16044
A Wave no.Band A cm.-17-6 6196-0 161358-7 6163-5 162209-8 6127-6 163152-0 6104-4 163773-1 6075-9 16454
* 6070-0 16470* 6063-0 16489
4-2 6047-9 16530* 6037-0 16560
5-3 6019-5 16608* 6013-7 16624* 6007-6 16641
6-4 5990-7 16688* 5978-5 16722
7-5 5962-4 16767
A Wave nBand A cm.-1
* 5947-2 168108-6 5933-8 16848
* 5919-7 168889-7 5905-0 16930
10-8 5876-2 170136-3 5764-4 173437-4 5741-9 174118-5 5718-6 174829-6 5695-1 17554
10-7 5671-5 176277-3 5534-0 180658-4 5515-1 181279-5 5496-6 18188
10-6 5477-9 18250
* Indicates that a band has not been classified.
dispersion in the region near 6000 A was 30 A/mm., was used. With Ilford Hypersensitive Panchromatic plates, a good photograph was obtained with an exposure of 6 hr., using a spectroscope slit width of 0*05 mm. An enlargement of this photograph is reproduced in fig. 1, Plate 30. With a slit width of 0-025 mm. and the same exposure time (which was the longest it was found practicable to employ), the stronger bands were recorded, with rather better resolution: this plate was used for the measurement of the vibrational isotope separations (see later). Light from a neon tube gave a comparison spectrum, by reference to which the wave numbers of the band heads were measured. The results are given in Table I, and appear to be correct to one or two wave numbers.
on November 6, 2018http://rspa.royalsocietypublishing.org/Downloaded from
\ yv ' \
0
1
2
3
4
5
6
7
8
9
10
A band spectrum attributed to NBr 471
D escription op the spectrum
Fig. 1, Plate 30 shows that S trutt and Fowler’s eight bands form part of a fairly large system of bands, degraded to the violet. The system extends from about 5500 to 6500 A ; the latter limit is doubtless due to diminishing sensitivity of the photographic plate. The bands have very well-marked heads, which are quite sharp in the neighbourhood of 6300 A, less so near 5900 A, and from 5700 A towards the violet are clearly double, with about equal intensity in the two heads. The photograph taken when the spectrograph slit was narrow, referred to above, shows doubling of the band heads near 5900 A.
I t is worthy of remark that the bands are decidedly stronger in the upper and lower parts of the spectrum than in the middle, showing that the light producing them is stronger near the walls of the after-glow tube than along its axis.
Vibrational analysis
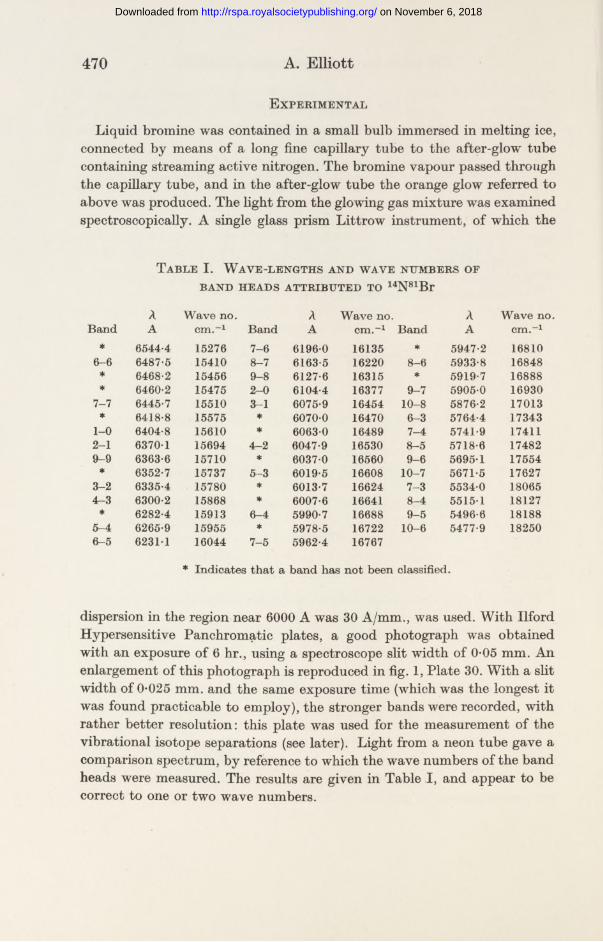
The appearance suggests strongly that the spectrum is of the type with well-marked sequences (v' — v" — constant), rather than that in which progressions are prominent, and the analysis, given in Table II, shows this
Table II. Vibrational scheme for band heads attributed to 14N81Br
0 1 2 3 4 5 6 7 8
15610767
16377 | 15694 760
16454 5 15780 750
16530 1 15868 740
16608 | 15955735 733
17343 | 16688 | 16044 « 15410 722 723 723
18065 1 17411 | 16767 | 16135 g 15510CO co co C©716 715 713
18127 g 17482 g 16848 g 16220 706 706
18188 g 17554 g 16930 g i 63i 5 |696 697 698
18250 g 17627 | 17013
9
15710
on November 6, 2018http://rspa.royalsocietypublishing.org/Downloaded from
472 A. Elliott
to be the case. This table, like Table I, gives only the less refrangible of the double heads, when these are resolved.
The absolute values of v" are decided by the fact that the sequence v' — v"— \ terminates abruptly at the 1-0 band; no bands in this sequence can be observed on the low-frequency side of 1-0. No such criterion is available for deciding v', however. For deciding the v' numbering we have two clues, given respectively by the distribution of intensity of the bands in the system and by the vibrational isotope effect. In Table II the most intense bands in a horizontal row {v" progression) are printed in heavy type. I f a smooth curve is drawn through the middle of the squares occupied by these bands, it should, if the numbering is correct, be part of a parabola whose axis is inclined at 45° to the horizontal and passes through the 0-0 band (Franck-Condon parabola). The parabola in the present instance is of the “ closed” type, which corresponds to a small difference in the moment of inertia of the molecule in the upper and lower electronic states, and with the numbering adopted satisfies the above conditions. This method of deciding v' is not, however, very accurate. The evidence based on the isotope effect will be considered in the next section. The band head formula to which the heads have been fitted is as follows:
i^ead = 14791 + 785(v' + £) - 4-45(1/ + 693(i/ ' + |) + 5-0(i/' + -|)2.
Vibrational isotope effect : emitter of the spectrum
Since the vibrational frequency of Br2 in its ground state is 324 cm.-1, whereas this constant in the case of the bands under consideration is as high as 785 cm.-1, it is evident that these bands cannot be due to Br2. Under the circumstances it is natural to consider whether the molecule responsible for their production is NBr.
As bromine has isotopes of masses 79 and 81 respectively, present in approximately equal amounts, we should expect all the bands of NBr to consist of two components of approximately equal intensity. I t has been shown that the spectrum contains double-headed bands, and these may be ascribed to 14N79Br and 14N81Br. The isotope displacement coefficient p — 1 for these molecules is 0-0019.
Table II I gives the measured isotope separations along with those calculated on the assumption that the emitter of the bands is NBr. As the separations were measured on a plate taken when the spectrograph slit was narrow (see above), the results are given to one-tenth of a wave number, though it must be remarked that systematic errors are certain to
on November 6, 2018http://rspa.royalsocietypublishing.org/Downloaded from

be present in measurements of band head separations when the heads are only just resolved. The agreement of observed and calculated separations is as good as can be expected under the circumstances; alteration of the v' numbering results in poorer agreement.
Table III. Separation of the band heads attributed to 14N79Br and 14N81Br, in cm . - 1
Band Obs. separation Calc, separation
A band spectrum attributed to NBr 473
6- 4 2-3 3-47- 5 2-6 3-68- 6 3-3 3-79- 7 4-2 3-87- 4 4-8 4-78- 5 4-8 4-89- 6 5-3 4-9
It may be objected that the accuracy of measurement of the isotope effect is insufficient to warrant the assumption that the carrier of the spectrum is NBr and not, for instance, OBr (in which case the isotope displacement coefficient would be 0-0021). Oxygen is known to be a common impurity of active nitrogen, and it is necessary to consider whether OBr can be excluded on chemical grounds.
The apparatus for generating active nitrogen was constructed for the purpose of observing the spectrum of chlorine in the ultra-violet region (Cameron and Elliott 1938). During the earlier stages of this research, the bands of NO were found superposed on the Clj continuum. Special precautions were thereupon taken to eliminate the oxygen responsible for the production of these bands. The quantity of phosphorus in the storage vessels was increased, and its temperature was maintained at well over 20° C, since phosphorus is known to become rather inert at temperatures below about 15° C. A very extensive drying system, consisting in all of about five metres of phosphorus pentoxide tubes, was employed, for Strutt (1917) has shown that water vapour must be removed if the ft bands of active nitrogen (NO) are to be suppressed.
These measures were successful; no trace of the NO bands in the Cl2 spectrum was found even when the exposures were of several hours duration. The same apparatus was used in the experiments described above, and it is certain that the oxygen concentration in the active nitrogen employed was very low. As a further test, a small air leak, in the form of a needle valve connected to the discharge tube, was introduced. The apparatus was run so as to produce the orange glow and a small quantity
on November 6, 2018http://rspa.royalsocietypublishing.org/Downloaded from
474 A. Elliott
of air was allowed to flow into the tube. The orange glow was diminished in intensity, though the yellow after-glow of active nitrogen (due to the first positive bands of N2) in the space between the discharge tube and the after-glow tube was not at this stage materially affected. Increasing the rate of flow of air into the discharge tube ultimately reduced the intensity of the first positive bands of N2 as well as that of the bands attributed to NBr. This evidence shows fairly conclusively that oxygen is detrimental to the production of the orange bands, and hence OBr may be excluded as a possible carrier of these bands.
U nclassified bands
Of the bands in Table I which have not been assigned to specific vibrational transitions, some may well be members of fragmentary progressions. Those bands which are situated approximately midway between consecutive members of the sequence in which — can hardly be sodisposed of, however, for they form a sequence with intervals of about the same magnitude as those in the sequence referred to, and are probably connected with it.
The appearance of these unclassified bands is distinctly different from that of the classified bands which they accompany. In addition to being weaker, their heads are more diffuse and have not that concentration of intensity which characterises the classified bands. A possible explanation is that each strong band is really only a branch, and that the nearest diffuse band on the short wave side comprises the corresponding R branch. This would account for the difference in sharpness of the two heads, for the R branch, in a band degraded to the violet, does not really form a head in the usual sense of the word, but simply starts from the origin of the band and runs towards the violet with increasing spaces between the lines which comprise it. If this explanation is correct, the rotation constants for the upper and lower levels must differ by a very small amount, for the separation of the band origin and the P head (which depends on this difference) is unusually large (of the order of 35 cm.-1). An objection which might be raised to the proposed explanation Is that the intensity of the R branch appears to be much less than that of the P branch. This difference is probably only apparent, due to the properties of the photographic plate and to the fact that the concentration of P lines near the head is much greater than that of the R lines. Because of their apparent low intensity, it is only in the strongest bands that the R branches are observable.
on November 6, 2018http://rspa.royalsocietypublishing.org/Downloaded from

'd Outov,
co
^ m
9
tNI
I f
i r—
)(D
N
® 0
5 £3 m
mm
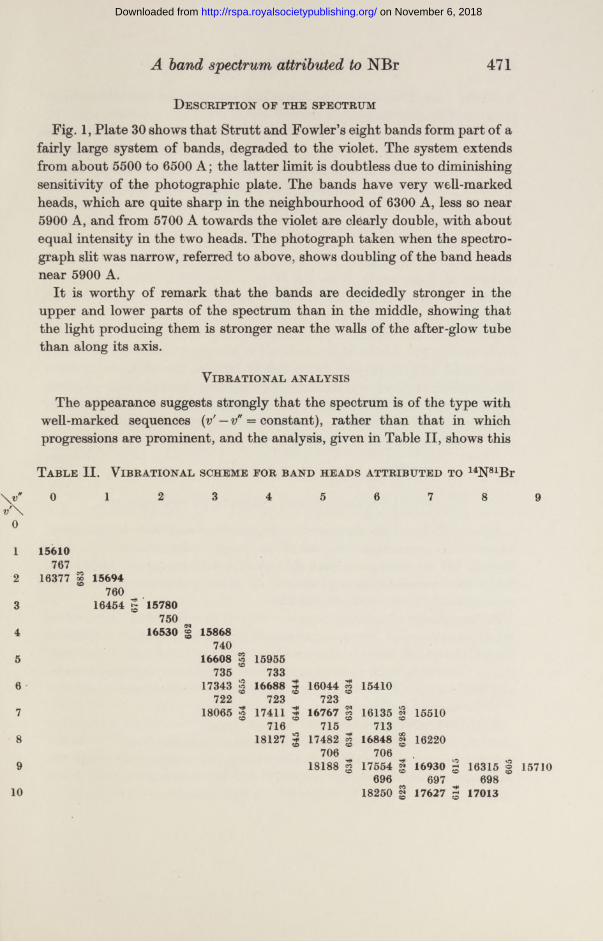
Fig
. 1.
B
and
spec
trum
of
NB
r.
Upp
er s
pect
rum
: Sp
ectr
um o
f the
aft
er-g
low
of
nitr
ogen
con
tain
ing
brom
ine
vapo
ur.
The
ban
d he
ads
indi
cate
d by
lin
es a
re
attr
ibut
ed t
o N
Br;
tho
se n
ot s
o m
arke
d ar
e th
e fir
st p
osit
ive
band
s of
N2.
Exp
osur
e ti
me
6 hr
.L
ower
spe
ctru
m:
Com
pari
son
spec
trum
(ne
on).
Exp
osur
e tim
e 30
sec
.T
he sp
ectr
al r
egio
n of
wav
e-le
ngth
bel
ow 5
656
A h
as n
ot b
een
incl
uded
on
the
plat
e, a
s th
e fa
intn
ess
of t
he b
ands
the
re r
ende
red
it u
nsui
tabl
e fo
r re
prod
uctio
n.
Elliott Proc. Roy. A, 169, Plate 30
on
Nov
embe
r 6,
201
8ht
tp://
rspa
.roy
also
ciet
ypub
lishi
ng.o
rg/
Dow
nloa
ded
from
A band spectrum attributed to NBr 475
Summary
1. The spectrum of the after-glow of nitrogen containing bromine vapour has been photographed.
2. The vibrational structure of the band system so observed has been analysed, and the band heads fitted to a formula of the usual type.
3. Considerations based on the isotope effect and on chemical evidence support the view that the bands are emitted by the molecule NBr.
References
Cameron, W. H. B. and Elliott, A. 1938 Proc. Roy. Soc. A, 169, 463. Strutt, R. 3". 1917 Proc. Roy. Soc. A, 93, 254.Strutt, R. J. and Fowler, A. 1912 Proc. Roy. Soc. A, 86, 105.
on November 6, 2018http://rspa.royalsocietypublishing.org/Downloaded from