Embed Size (px)
Citation preview

Paul Taylor, Project Director Rich Morin, Senior Editor Rakesh Kochhar, Senior Researcher Kim Parker, Senior Researcher D‟Vera Cohn, Senior Writer Mark Hugo Lopez, Senior Researcher Richard Fry, Senior Researcher Wendy Wang, Research Associate Gabriel Velasco, Research Analyst Daniel Dockterman, Research Assistant Rebecca Hinze-Pifer, Intern Soledad Espinoza, Intern MEDIA INQUIRIES CONTACT: Pew Research Center‟s Social & Demographic Trends Project 202.419.4372
http://pewsocialtrends.org
A Balance Sheet at 30 Months
How the Great Recession Has Changed Life in America
FOR RELEASE: JUNE 30, 2010

Table of Contents
Executive Summary ........................................................................................ i
1 Overview ............................................................................................... 1
2 The Great Recession: 2007—20?? ................................................................. 13
3 The Slow Road to Recovery ......................................................................... 35
4 Household Finances, Social Class, Future Generations ...................................... 43
5 Work and Unemployment .......................................................................... 57
6 Spending, Saving, Borrowing, Retirement Confidence ........................................ 69
7 The Housing Bust ..................................................................................... 79
Appendices
Survey Methodology ................................................................................... 85
Topline Questionnaire ................................................................................ 93
i
A Balance Sheet at 30 Months
How the Great Recession Has Changed Life in America
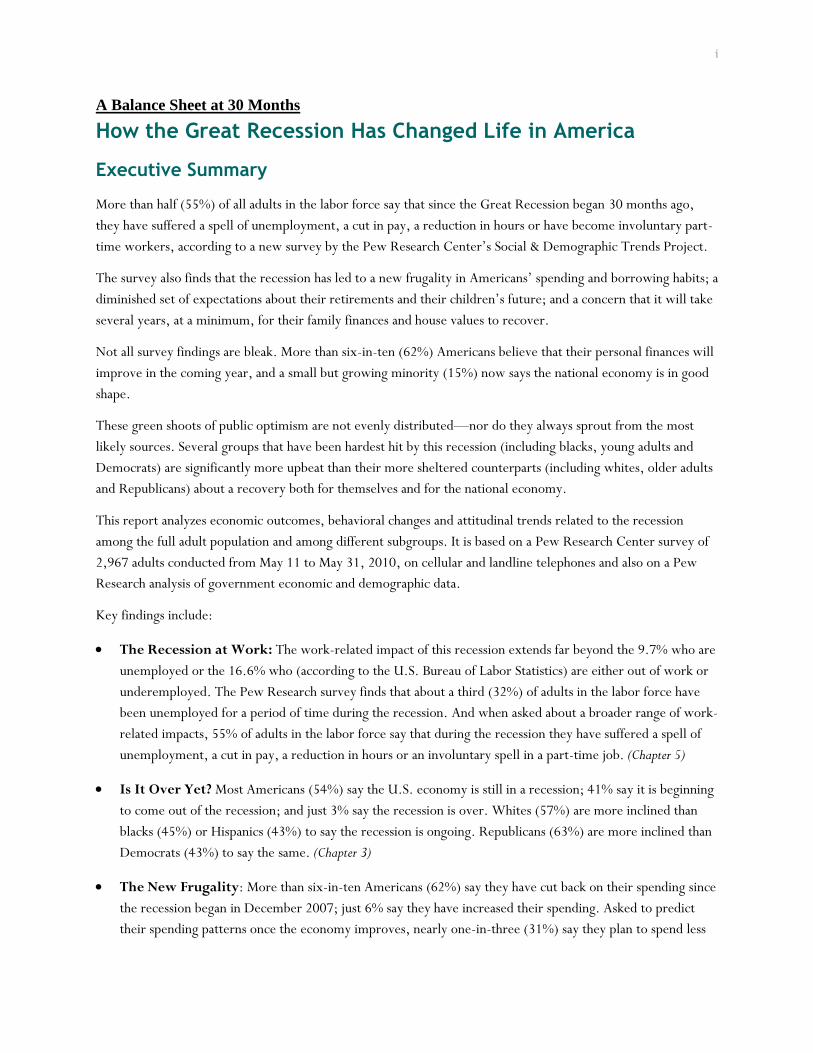
Executive Summary
More than half (55%) of all adults in the labor force say that since the Great Recession began 30 months ago,
they have suffered a spell of unemployment, a cut in pay, a reduction in hours or have become involuntary part-
time workers, according to a new survey by the Pew Research Center‘s Social & Demographic Trends Project.
The survey also finds that the recession has led to a new frugality in Americans‘ spending and borrowing habits; a
diminished set of expectations about their retirements and their children‘s future; and a concern that it will take
several years, at a minimum, for their family finances and house values to recover.
Not all survey findings are bleak. More than six-in-ten (62%) Americans believe that their personal finances will
improve in the coming year, and a small but growing minority (15%) now says the national economy is in good
shape.
These green shoots of public optimism are not evenly distributed—nor do they always sprout from the most
likely sources. Several groups that have been hardest hit by this recession (including blacks, young adults and
Democrats) are significantly more upbeat than their more sheltered counterparts (including whites, older adults
and Republicans) about a recovery both for themselves and for the national economy.
This report analyzes economic outcomes, behavioral changes and attitudinal trends related to the recession
among the full adult population and among different subgroups. It is based on a Pew Research Center survey of
2,967 adults conducted from May 11 to May 31, 2010, on cellular and landline telephones and also on a Pew
Research analysis of government economic and demographic data.
Key findings include:
The Recession at Work: The work-related impact of this recession extends far beyond the 9.7% who are
unemployed or the 16.6% who (according to the U.S. Bureau of Labor Statistics) are either out of work or
underemployed. The Pew Research survey finds that about a third (32%) of adults in the labor force have
been unemployed for a period of time during the recession. And when asked about a broader range of work-
related impacts, 55% of adults in the labor force say that during the recession they have suffered a spell of
unemployment, a cut in pay, a reduction in hours or an involuntary spell in a part-time job. (Chapter 5)
Is It Over Yet? Most Americans (54%) say the U.S. economy is still in a recession; 41% say it is beginning
to come out of the recession; and just 3% say the recession is over. Whites (57%) are more inclined than
blacks (45%) or Hispanics (43%) to say the recession is ongoing. Republicans (63%) are more inclined than
Democrats (43%) to say the same. (Chapter 3)
The New Frugality: More than six-in-ten Americans (62%) say they have cut back on their spending since
the recession began in December 2007; just 6% say they have increased their spending. Asked to predict
their spending patterns once the economy improves, nearly one-in-three (31%) say they plan to spend less

ii
than they did before the recession
began, while just 12% say they
plan to spend more. A majority say
they expect to spend about what
they did before the recession.
(Chapter 6)
Family Finances: About half the
public (48%) say they are in worse
financial shape now than before the
recession began; one-in-five (21%)
say they are in better shape.
Grouped by income, those with
annual household incomes below
$50,000 are the most likely to say
they are in worse shape. Grouped
by age, those in late middle age (50
to 64) are most likely to say this.
Also, government data show that
average household wealth fell by
about 20% from 2007 to 2009,
principally because of declining
house values and retirement
accounts. This is the biggest
meltdown in U.S. household
wealth in the post-World War II
era. (Chapters 2,4)
A Slow Road to Recovery: Of
those who say their family finances
have lost ground during the
recession, 63% say it will take at
least three years to recover. Blacks
who lost ground believe that their
recovery time will be shorter than
do whites who lost ground.
(Chapter 4)
Retirement Worries: A third
(32%) of adults now say they are
not confident that they will have enough income and assets to finance their retirement, up from 25% who
said that in February 2009. Among adults ages 62 and older who are still working, a third say they have
About the Data
Findings presented in this report are primarily based on two sources: a new national survey conducted by the Pew Research Center and data gathered by the federal government and analyzed by Pew Research Center staff.
Results for this survey are based on telephone interviews conducted with a nationally representative sample of 2,967 people ages 18 and older living in the continental United States. A combination of landline and cellular random digit dial (RDD) samples was used to represent all adults in the continental United States who have access to either a landline or cellular telephone. A total of 1,893 interviews were completed with respondents contacted by landline telephone and 1,074 with those contacted on their cellular phone. The data are weighted to produce a final sample that is representative of the general population of adults in the continental United States. For more details, see Appendix I.
Interviews conducted May 11-31, 2010
2,967 interviews
Margin of sampling error is plus or minus 2.2 percentage points
for results based on the total sample at the 95% confidence
level.
Survey interviews were conducted under the direction of
Princeton Survey Research Associates International. Interviews
were conducted in English or Spanish.
The economic analyses presented in Chapter 2 are primarily drawn
from U.S. Bureau of Labor Statistics and Pew Research Center
tabulations of the Census Bureau‟s Current Population Survey.
Data are also drawn from the U. S. Commerce Department‟s
National Income and Product Accounts (NIPA) reports, which track
household consumption and savings, and the Federal Reserve
Bank‟s Flow of Funds Accounts, which monitor household debt and
wealth.
Additional estimates of household wealth come from the University
of Michigan‟s Panel Study of Income Dynamics (PSID). Other data
on household finances are drawn from the federal government‟s
Survey of Consumer Finances. Information on debt service ratios
comes from the Federal Reserve Bank. For more details, see
Chapter 2.
Note on terminology: Whites include only non-Hispanic whites.
Blacks include only non-Hispanic blacks. Hispanics are of any race.
The terms “labor force” and “work force” are used
interchangeably.

iii
already delayed retirement because of the recession. And among workers in their 50s, about six-in-ten say
they may have to do the same. (Chapter 4)
The Recession Hits Home: About half of all homeowners (48%) say the value of their home has declined
during the recession. Of those who say this, nearly half (47%) believe it will take three to five years for the
value to return to pre-recession levels, and nearly four-in-ten (39%) expect it will take six years or longer.
Yet the vast majority (80%) of Americans say that owning a house is the best long-term investment a person
can make. (Chapter 7)
Diminished Expectations for Children’s Future: More than a quarter (26%) of Americans say that
when their children become the age they are now, their children will have a worse standard of living than
they now have. A decade ago, just 10% of Americans had this concern. Blacks, Hispanics and young adults
are more upbeat about the idea of intra-family intergenerational progress than are whites and older adults.
(Chapter 3)
A Partisan Switch: Throughout most of the decade of the 2000s, Republicans were significantly more
upbeat than Democrats about the state of the economy. That pattern is now reversed. Across six different
measures of confidence in both personal finances and the national economy, Democrats are now much more
upbeat than Republicans, even though they have lower incomes and less wealth and have suffered more job
losses during the recession. To be sure, Republicans have had to endure their own distinctive mix of
recession-related hardships. They are more likely than Democrats to say their house has lost value, and
because they are more likely than Democrats to have investments in the stock market, they‘ve been more
exposed to its volatile swings up and down. (Chapter 1)
About the Report
This report is the work of Pew Research Center‘s Social & Demographic Trends project, including staff
members Paul Taylor, project director; Rich Morin, senior editor; Rakesh Kochhar, senior researcher; Kim
Parker, senior researcher; D‘Vera Cohn, senior writer; Mark Lopez, senior researcher; Richard Fry, senior
researcher; Wendy Wang, research associate; Gabriel Velasco, research analyst; Daniel Dockterman, research
assistant; Rebecca Hinze-Pifer, intern and Soledad Espinoza, intern.
Morin led the team that developed and analyzed the survey questionnaire. Kochhar led the team that conducted
the economic research. Taylor served as overall report editor; he also wrote Chapters 1 and 3. Kochhar wrote
Chapter 2. Parker wrote Chapter 4. Morin wrote Chapters 5 and 7. Cohn wrote Chapter 6.


1
Chapter 1: Overview
Of the 13 recessions that the American public has
endured since the Great Depression of 1929-33,
none has presented a more punishing combination
of length, breadth and depth than this one.
A new Pew Research survey finds that 30 months
after it began, the Great Recession has led to a
downsizing of Americans‘ expectations about their
retirements and their children‘s future; a new
frugality in their spending and borrowing habits;
and a concern that it could take several years, at a
minimum, for their house values and family
finances to recover.
The survey also finds that more than half
of the adults in U.S. labor force (55%)
have experienced some work-related
hardship—be it a spell of unemployment,
a cut in pay, a reduction in hours or an
involuntary move to part-time work. In
addition, the bursting of the pre-
recession housing and stock market
bubbles has shrunk the wealth of the
average American household by an
estimated 20%, the deepest such decline
in the post-World War II era, according
to government data.
While nearly all Americans have been
hurt in one way or another, some groups
have suffered more than others. Blacks,
Hispanics and young adults have borne a
disproportionate share of the job losses.
Middle-aged adults have gotten the worst
of the downturn in house values,
household finances and retirement
accounts. Men have lost many more jobs
than women. And across most indicators,
those with a high school diploma or less
education have been hit harder than those with a college degree or more.
Are You Spending More, Less or the Same?
% saying that since the recession began, they have …
Note: “Don‟t know/Refused” responses not shown, N=2,967.
62
30
6
Cut back
Spent about the same
Increased
F
The Recession at Work % of each group who experienced each of the following since the recession began
*The under-employed are part-time workers who say they want a full-
time job but do not have one because they cannot find full-time employment or because of other economic reasons.
28
23
12
11
6
55
Work hours reduced
Pay cut
Had to take unpaid leave
Forced to switch to part-time
Unemployed now or sometime during recession
Underemployed*
Among total labor force (n=2,256)
Among currently employed (n=1,604)
Total experiencing any work-related problem
32

2
Whether by choice or necessity, many
Americans have already significantly scaled back
their pre-recession borrow-and-spend habits.
According to government data, household
spending has gone down, savings rates have
gone up, consumer credit has remained stable
and mortgage debt has plunged during this
recession.
The survey finds that the public is starting to
see some light at the end of the tunnel. More
than six-in-ten survey respondents (62%) say
they expect their personal financial situation to
improve in the coming year—the most
optimistic reading on this question since before
the recession began. Likewise, about six-in-ten
(61%) say they believe the damage the
recession has inflicted on the U.S. economy
will prove to be temporary rather than
permanent.
This report sets out to present a comprehensive
balance sheet on the Great Recession by
looking at economic outcomes, behavioral
changes and attitudinal trends among the full
population as well as various subgroups. Our analysis is drawn from two sources—a comprehensive Pew
Research telephone survey of a representative, national sample of 2,967 adults conducted from May 11 to May
31, 2010 (see Appendix for details) and a Pew Research analysis of government economic and demographic
trend data.
One striking finding of the survey is that some of the demographic groups that have suffered the worst economic
hits are also the ones most optimistic about a recovery—both for themselves personally and for the U.S.
economy as a whole.
Blacks and Hispanics are more upbeat than whites. The young are more optimistic than middle-aged and older
Americans. And Democrats are more upbeat than Republicans, even though Democrats have lower incomes and
less wealth and have suffered more recession-related job losses.
These group differences are apparent not just in responses to specific survey questions, but also in a set of
statistical models that examine the independent impact of race, partisanship and age on the likelihood that a
respondent will express optimism on six different attitudes about the economy tested in the survey, controlling
Some Groups More Optimistic than Others % saying, over the next year, their financial situation will…
Note: Hispanics are of any race. Whites and blacks include only non-Hispanics. “Stay the same” and “Don‟t know/Refused” responses not shown.
19
22
9
10
8
14
27
29
27
10
20
62
57
81
74
85
69
52
35
55
70
62
All
White
Black
Hispanic
18-29
30-49
50-64
65+
Republican
Democrat
Independent
Get worse Improve

3
for a range of demographic variables
and recession-related experiences.1
The analysis finds that blacks,
Democrats and, on most questions,
younger adults are more likely than
whites, Republicans and older adults
to hold positive views about the
national economy and their personal
finances, regardless of their income,
education, gender or whether they
have had difficulty paying their bills,
making mortgage or rent payments;
getting or paying for medical care; or
have had to cut spending during the
recession.
One likely explanation for these
seemingly counterintuitive patterns
is that in an age of highly polarized
politics, Democrats and Republicans differ not only in their values, attitudes and policy positions, but,
increasingly, in their basic perceptions of reality.
This is not the first Pew Research survey taken in the past year that shows that the election of Barack Obama
(which came at the height of the recession in November 2008) appears to have put his most enthusiastic
supporters—especially blacks, Democrats and young adults—in a more positive frame of mind than Obama‘s
detractors about many aspects of national life.2
For example, since Obama was elected Democrats have become more optimistic than Republicans about the
state of the national economy. For most of the time that George W. Bush was in office, the reverse was true:
Republicans were more upbeat—often, much more upbeat—than Democrats.
1 In addition to race, party identification and age, the logistic regression models include gender, education, income and whether the respondent had experienced recession-related problems to predict the respondents‘ views on the current state of the economy, their personal financial situation and how they think their family will fare financially in the coming year. 2 For similar findings of this nature from another Pew Research Center survey, see ―Blacks Upbeat about Black Progress, Prospects, ‖ January 12, 2010 (http://pewsocialtrends.org/pubs/749/blacks-upbeat-about-black-progress-obama-election ).
A Partisan Switch in Perceptions of U.S. Economy
% rating the economy as excellent or good
Source: 1992-2003 Gallup, 2004-2010 Pew Research Center for the People & the Press.
0
25
50
75
100
1992 1994 1996 1998 2000 2002 2004 2006 2008 2010
Republican Democrat

4
An Historical Perspective
Modern-era recessions in the U.S.
have generally been less severe than
those of the 19th and early 20th
centuries. But this one stands out for
two features that, taken together,
validate its by-now-familiar
designation as the worst recession
since the Great Depression.
The Surge in Long-term
Unemployment: The typical
unemployed worker today has
been out of work for nearly six
months (23.2 weeks). This is
almost double the previous post-
World War II peak for this
measure—12.3 weeks—in
1982-83. Long-term
unemployment of this magnitude
and duration raises a vexing
question: Beyond a ―normal‖
cyclical downturn, might the U.S.
economy be going through some
long-term structural changes that
will lead to relatively high rates of
unemployment for years to come?
The Meltdown in Household
Wealth: This recession has
eroded more household wealth
than any other episode in the
post-World War II era—not
surprising in that it was triggered
by the bursting of bubbles in both
the housing and stock markets,
the two principal sources of
household wealth. According to
the Panel Survey of Income
Median Duration of Unemployment in Weeks January 1970 to May 2010, seasonally adjusted
Weeks
Notes: Shaded areas depict periods of recession as determined by the National Bureau of Economic Research. The end date for the recession that started in December 2007 has not yet been announced. Revisions to the CPS in 1994 affect the comparability of data over time (see text box).
Source: U.S. Bureau of Labor Statistics
4.8
12.3
8.4
23.2
0
5
10
15
20
25
1970 1975 1980 1985 1990 1995 2000 2005 2010
Recessions in the Modern Era (As determined by the National Bureau of Economic Research)
Beginning—End Duration Lag Between End and Declaration of End
(Months) (Months) December 2007—? ?? --
March 2001—November 2001 8 20
July 1990—March 1991 8 21
July 1981—November 1982 16 8
January 1980—July 1980 6 12
November 1973—March 1975 16 *
December 1969—November 1970 11 *
April 1960—February 1961 10 *
August 1957—April 1958 8 *
July 1953—May 1954 10 *
November 1948—October 1949 11 *
February 1945—October 1945 8 *
May 1937—June 1938 13 *
August 1929—March 1933 43 *
*The National Bureau of Economic Research (NBER) has tracked business cycle dates since 1929. It did not formally announce recession end dates until the establishment of its Business Cycle Dating Committee in 1978.

5
Dynamics (PSID)3, median household wealth decreased
by an estimated 19% from 2007 to 2009. On a
percentage basis, this loss of wealth was greater among
middle-income households than among those in either
the lower or upper income tiers. Similarly, it took a
much bigger percentage bite out of the (relatively
modest) wealth of black and Hispanic households than of
white households.
Two-and-a-half years after this recession began, it‘s easier to
take stock of its effects than to be certain of its duration. The
nation‘s gross domestic product has been registering gains for
nearly a year, leading some economists to assert that the
recession is already over—and has been for some time. But
with the nation‘s overall unemployment rate remaining
stubbornly high—9.7% as of May 2010—the quasi-official arbiters of the nation‘s business cycles at the National
Bureau of Economic Research4 (NBER) have yet to declare that it is over. To further complicate matters, this
doesn‘t necessarily mean it isn’t over. Because of the way the NBER operates, there is often a lag time of a year
or more between its declaration of the end of a recession and the date that recession is retrospectively said to
have ended. (For details, see Chapter 2).
Here are highlights from the Pew Research Center survey:
The Recession: An Overview
It Ain’t Over Till It’s Over: The public shares the NBER‘s
caution about declaring the recession over. More than half
(54%) of the respondents to the Pew Research survey say
the economy is still in a recession, 41% say it‘s beginning to
come out of the recession and just 3% say the recession is
over. Whites (57%) are more inclined than blacks (45%) or
Hispanics (43%) to say the recession is ongoing. Republicans
(63%) are more inclined than Democrats (43%) to say the
same.
Half Say Their Finances Are in Worse Shape: About half
of Americans (48%) say their household‘s current financial
situation is worse now than before the recession. About
3 The PSID, started in 1968, is a longitudinal study of U.S. families, that is, it follows the same families and individual members of those families over time. It features an oversample of low-income families. The original sample size was about 4,800 families, and it has grown since to about 8,000 families today. A refresher sample of immigrant families was added in 1997 to keep the study representative of the U.S. population. The study is conducted at the Survey Research Center, Institute for Social Research, University of Michigan. 4 The NBER is a private, not-for-profit economic research organization based in Cambridge, Mass. It counts more than 1,000 professors of economics among its research associates. Since forming its Business Cycle Dating Committee in 1978, it has been the quasi-official arbiter of the timing of expansions and recessions in the U.S. economy.
Most Say the Recession Continues
Note: “Don‟t know/Refused” responses are included but not labeled.
54%
41%
3%
Still in recession
Starting to recover
Recession is over
The Recession’s Personal Toll
Household financial situation now vs. before the recession
Note: “Don‟t know/Refused” responses are included but not labeled.
21%
48%
29%
Better shapeWorse shape
No difference(VOL.)

6
one-in-five (21%) say they are in better shape. The rest say
there has been no change. Grouped by income, those at the
lower end of the scale are most likely to say they are in worse
shape. Grouped by age, those in late middle age (50 to 64) are
the most likely to say they are in worse shape.
Many Foresee a Long Road to Recovery: Among those who
say their family finances have lost ground during the recession,
63% predict it will take at least three years to recover. Blacks
are more optimistic than whites that their recovery time
period will be two years or less (55% versus 29%). Among
college graduates who lost ground, fully 30% believe it will
take six or more years to recover. Among those who did not
attend college and lost ground, just 18% see a recovery period
of six or more years.
A Growing Lower Class? Asked to place themselves into one
of five socioeconomic classes (upper, upper-middle, middle,
lower-middle and lower), a slightly higher share of Americans put themselves in the lower two groups now than
before the recession began—29% now vs. 25% in March 2008. Half say they are middle class (down from 53%
in 2008), while 20% place themselves in the upper two classes (virtually unchanged from 2008). Blacks, as a
group, are an exception to this overall pattern. The
share of blacks who now identify with the upper class has
gone up during this recession, to 20% now from 15%
two years ago.
Not Everyone Got Whacked: Even in these bad times,
some people have made out OK. As noted above, about
two-in-ten (21%) adults say their household finances are
in better shape now than before the recession began.
Among all currently employed workers, 20% say they
were promoted or found a better job during the
recession. And about four-in-ten say they have gotten at
least one raise during the past 30 months (a proportion
that is likely much lower than it would have been if the
economy had been more robust).
A Long Recovery Period How long will it take you/your family to recover from the recession?
Hurt by Recession*
%
Less than a year 5
One to two years 27
Three to five years 40
Six to 10 years 13
Longer than 10 years/never 10
Don‟t know/Refused 6
* Based on those who say their household financial situation is worse now than it was before the recession (n=1,591). Note: Percentages may not total 100% due to rounding.
The Growing Lower Class? % of Americans identifying themselves as …
2008 2010
Upper class (NET) 21 20
Upper 2 2
Upper-middle 19 18
Middle class 53 50
Lower class (NET) 25 29
Lower-middle 19 21
Lower 6 8
Don‟t know/Refused 1 1
Number of respondents 2,413 2,967

7
The New Frugality
Making Ends Meet:
Americans have changed
their lifestyles in many
different ways to make ends
meet during this recession.
More than seven-in-ten
(71%) say they have bought
less expensive brands. Nearly
six-in-ten (57%) say they
have cut back or canceled
vacation plans. About half
(49%) say they have loaned
money to someone, and 24%
report having borrowed
money from someone.
Three-in-ten say they have
cut back on alcohol or
cigarettes. Nearly one-in-ten
(9%) say they have moved back in with their
parents (among adults ages 18 to 29, this figure
rises to 24%). Overall, higher-income adults report
making fewer of all these lifestyle adjustments than
do lower-income adults. Likewise, adults ages 65
and older report making fewer of them than do
younger and middle-aged adults.
Neither a Spender Nor a Borrower Be: More
than six-in-ten (62%) Americans say that since the
recession began, they‘ve cut back on household
spending. Half say they have reduced the amount
they owe on mortgages, credit cards, car loans and
other borrowing. Of those who have savings or
retirement accounts, more than four-in-ten (42%)
say they‘ve adopted a more conservative approach
to saving and investing, compared with just 8%
who say they‘ve taken a more aggressive approach.
These new habits of thrift and caution could well
outlive this recession. Asked to predict their
financial behaviors once the economy recovers,
How the Public Has Experienced the Recession
% saying this happened to them during the recession …
*Among ages 18-29, this share is 24%.
71
57
49
30
27
24
20
15
11
9
2
Bought less expensive brands
Cut back/canceled vacation
Loaned money to someone
Spent less on alcohol/cigarettes
Had trouble paying medical bills
Borrowed money from friends/family
Had problems paying rent/mortgage
Increased credit card debt to pay bills
Postponed marrying/having baby
*Moved back in with parents
Lost home to foreclosure
Are You Borrowing More Money or Cutting Back on What You Owe?
% saying during the recession, they …
Note: “Don‟t know/Refused” responses not shown.
Question wording: I‟d like you to think about the money you owe on your credit cards, mortgage, car loans and other kinds of loans. During the recession, did you have to borrow more money to pay your monthly bills, or did you take steps to cut back what you owe?
13
50
19
2
15
Borrowed more
Cut back
Neither borrowed more nor cut back (VOL.)
Did both (VOL.)
No debts or loans (VOL.)
F

8
48% say they plan to save more, 31% say they
plan to spend less and 30% say they plan to
borrow less. Only small percentages say the
reverse—that they plan to save less and borrow
and spend more.
Retirement Worries
Retirement Confidence Down: Even though
the stock market has rallied by more than 50%
from its recession-era bottom in March 2009,
Americans have continued to lose confidence in
their ability to afford retirement. Some 32% of
adults now say they are ―not too‖ or ―not at all‖
confident they will have sufficient income and
assets for retirement, up from 25% who said
the same in February 2009. This uncertainty is
greater among younger and middle-aged adults
than among older adults. It is also greater
among adults with low incomes.
Retirement Delayed: Among adults ages 62
and older who are still working, 35% say
they‘ve already delayed retirement because of
the recession. Among adults ages 50 to 61 who
are currently employed, six-in-ten say they may
have to delay retirement because of the
recession.
Raiding the Cookie Jar: Four-in-ten adults
(41%) who have a checking, savings or
retirement account say that during the recession
they have had to withdraw money from their
savings account, 401(k) account or some other
retirement account to pay their bills. Younger
and middle-aged adults report having done this
at higher rates than those ages 65 and older.
Lower-income adults have done it at higher
rates than have upper-income adults.
Borrowing Plans When the Economy Improves
% saying when the economy improves they will...
Note: “Don‟t know/Refused” responses not shown.
9
54
30
Increase borrowing
Borrow about the same amount
Decrease borrowing
F
A Downturn in Retirement Confidence
% saying they are … that they will have enough income and assets for retirement
Note: In 2010, 1% say they won‟t have anything or were unable to save. “Don‟t know/Refused” responses not shown.
30
23
41
41
16
19
9
13
2009
2010
Very confident Somewhat confident
Not too confident Not at all confident
F
The Recession and Retirement
% saying, because of the recession they…
Note: Based on non-retirees ages 50-61,n=600.
60
34
5
Might have to delay retirement
Won't have to delay retirement
Don't know (VOL.)

9
Short-term Optimism; Long-term Uncertainty
Next Year Will Be Better: More than
six-in-ten (62%) adults say they expect
their financial situation to improve in
the coming year, compared with just
19% who say they expect it to get
worse. That is the most upbeat reading
on this measure since September 2007,
just before the recession began. Among
the most optimistic demographic
groups are blacks (81% expect their
finances to improve in the coming
year), Hispanics (74%) and 18- to 29-
year-olds (85%).
But Will Our Children Do Better?
During the past decade, Americans
have grown increasingly skeptical about
the standard of living of future
generations—and this skepticism has
deepened during this recession. Today fewer than half (45%) of adults believe that when their children become
the age they are now, their children will enjoy a better standard of living than they have now. Even more
striking, 26% now say their children‘s
standard of living will be lower. This is a
―positive/negative‖ gap of just 19
percentage points on a question that tests
the public‘s faith in a core tenet of the
American dream—the idea that children
grow up to live better than their parents. At
the start of the recession in early 2008, this
gap was 35 percentage points. In 2002, it
was 51 percentage points. Overall, blacks,
Hispanics and young adults are more upbeat
about the idea of generational progress than
are whites and older adults.
Public Says Mix of Economic News Is
Unchanged: About two-thirds of adults
(65%) say that these days they are hearing a
mix of good and bad news about the
economy, while 30% say they are hearing
What Will Life Be Like for the Next Generation?
When your children are at the age you are now …(%)
Note: 1994-2008 data are from the General Social Survey
0
10
20
30
40
50
60
70
1994 1996 1998 2000 2002 2004 2006 2008 2010
Standard of living will be better
Standard of living will be worse
45
20
45
26
10
61
What Americans Are Hearing about the Economy
% saying they are hearing …
Source: Pew Research Center for the People & the Press, June 10-13 survey, n=1,010.
14 5 4
80
31 29 30
19
64 6565
Dec Feb Apr Jun Aug Oct Dec Feb Apr Jun
Mix of good& bad news
Mostlybad news
Mostlygood news
08 ------------2009------------------ -----2010------

10
mostly bad news and just 4% say they are hearing
mostly good news. These shares have barely
budged in the past year. However, back in
December 2008, when the recession was about a
year old, fully 80% of adults said they were
hearing mostly bad news about the economy.
Recession Impact: Permanent or Temporary?
Most Americans (70%) believe that the recession
has inflicted major changes on the U.S. economy,
but most (61%) say that these changes will prove
to be temporary. Older adults are more
downbeat than younger adults (21% of those ages
50 and older see major, permanent changes,
compared with just 13% of those ages 18-24);
college graduates are more pessimistic than
whose with a high school diploma or less
education (22% of the former see major,
permanent change, compared with 14% of the
latter); and Republicans are more pessimistic
than Democrats (22% vs. 12%). When asked a
similar battery of questions about the impact of
the recession on the way they live their lives, a
smaller share of respondents—just 8%—say they
believe the changes will prove to be both major
and permanent. An additional 12% say the
changes will be minor and permanent.
Still the Land of Prosperity? By a two-to-one
margin, 63% to 31%, Americans agree with the
statement that ―although there may be bad times
every now and then, America will always continue to be prosperous and make economic progress.‖ Blacks,
Hispanics, Democrats and young adults register the most optimistic views on this question. Also, those who self-
identify with the middle class are more optimistic than those who classify themselves as upper or lower class.
Is America Still a Land of Prosperity?
% who agree
Question wording:“Do you agree or disagree: although there may be bad times every now and then, America will always continue to be prosperous and make economic progress?”
63
59
81
75
70
66
59
56
57
75
60
63
70
52
75
56
40
All
White
Black
Hispanic
18-29
30-49
50-64
65+
Republican
Democrat
Independent
Upper class
Middle class
Lower class
Two years or less
Three to five years
Six years or longer
How long will it take your personal finances to recover?
Self-defined class

11
The Labor Force
The Unemployment Blues: High as they are, measures such
as the unemployment rate (9.7% in May 2010) and the
median length of unemployment (23.2 weeks) still don‘t fully
convey the scope of the employment crisis that has unfolded
during this recession. A broader measure from the U.S.
Bureau of Labor Statistics that also includes involuntary part-
timers and other marginal workers puts the combined
unemployment and underemployment rate at 16.6%. And the
Pew Research survey finds that among all adults in the labor
force, fully 32% say that they are either now unemployed or
that they had been unemployed for some period of time since
the recession began.
The Long-term Blues: Of all currently-unemployed adults,
46% have been out of work for six months or more, by far
the highest share measured by the U.S. Bureau of Labor
Statistics in the post-World War II era. Short-term spells of
unemployment typically do not lead to significant breaks in
career paths or major financial losses—but long-term spells
often do.
The Payday Blues: The unemployed are not the only ones
hit by this recession. More than four-in-ten (42%) currently
employed workers say that during the recession they have
experienced at least one of the following: had their hours
reduced (28%); had their pay cut (23%); had to take unpaid leave (12%) or saw their full-time jobs shrink to
part time (11%). Workers across all demographic groups were affected, but these blows landed most heavily on
minorities and workers with only a high school diploma or less education.
Career Impact: About a quarter (24%) of all adults—and 43% of all currently unemployed adults—say the
recession will have a big impact on their ability to achieve their long-term career goals. Also, workers who lost a
job during this recession but have since found a new one (26% of currently employed adults) are less likely than
other workers to say they are satisfied with their job and more likely to say they are overqualified.
The Recession and the Workforce % of workers in each group who said they were forced to …
Work Take Switch from fewer unpaid full-time to hours leave to part-time
% % % Total 28 12 11 Gender Men 30 12 12 Women 25 12 9 Age 18-29 32 11 15 30-49 26 13 10 50+ 27 12 9 Race/Ethnicity White 22 10 9 Black 42 19 17 Hispanic 40 16 14 Education College grad 14 9 5 Some college 29 14 11 HS grad or less 39 13 15 Note: Asked of adults currently employed full time or part time, n=1,604. Hispanics are of any race.
White and blacks include only non-Hispanics.

12
The Recession Hits the Home
The Housing Bubble Bursts: About half of all homeowners
(48%) say the value of their house has declined during the
recession (26% say ―‗a lot,‖ and 22% say ―a little.‖) A third
say their homes have held their value during the recession,
and one-in-eight say their homes have increased in value.
Homeowners most likely to report their home lost value
include those who are middle-aged, upper income and live in
the West. Also, Republicans (52%) are more likely than
Democrats (42%) to say their homes have lost value.
“Underwater”: More than two-in-ten (21%) of all
homeowners say they currently owe more on their mortgage
or other home loans than they could sell their house for in
today‘s market. In real estate vernacular, they are
―underwater.‖ Hispanic and black homeowners are more
likely than whites to be in this circumstance; lower-income
homeowners are more likely than upper-income
homeowners to face this problem, and middle-aged homeowners more likely than either younger or older
homeowners to be in this situation.
Not Coming Back Anytime Soon: Among those who say their houses have lost value during this recession, the
overwhelming majority believe it will take at least three years for values to return to pre-recession levels. This
includes 47% who say they expect it will
take three to five years and 39% who say it
will take six years or longer. Just 10% say
they expect a recovery in two or less years.
Despite this, eight-in-ten Americans agree
that a house is the best long-term investment
the average person can make. (However, the
share who ―strongly agree‖ with this
statement is just 39% now, down by 10
percentage points from the share who said
the same in a 1991 survey.)
How Long for Home Value to Recover? Among homeowners who say their house has lost value, % saying it will take … to recover
Note: n=934
10%
47%
39%
Two years or less
Three to five years
Six years or longer
Home Values Tumble % of homeowners who say that during the recession their home value has …
Note: n=1,937
DK/Ref.
33%
Gone down a lot
Gone down a little
Gone up a lot
22%
Stayed the same
26%
8%
4%
Gone upa little

13
Chapter 2: The Great Recession, 2007—20??
News accounts have routinely described the
current recession as the worst since the Great
Depression. Are there data to support such a
claim?
This is the 13th recession to have hit the U.S.
economy since the Great Depression ran for
43 months from 1929 to 1933. These modern-
era recessions have varied in duration, depth
and breadth; some have hit different parts of
the economy and different groups in the
population harder than others.
Thirty months after it began, the current
recession may or may not already be over (see
box). But whatever its official life span, this
recession has two striking features that do
indeed earn it the unhappy distinction of being
the worst downturn since the Great
Depression:
The typical unemployed worker in
this recession is staying out of work
longer than at any time in the post-
World War II era. Nearly half of
unemployed workers have been
without a job longer than six months.
This could well have deep and
lingering effects on the long term
employment and income prospects of
some of these workers.
This recession has eroded more
household wealth than any other
episode in modern economic history.
That was perhaps inevitable given that the roots of the recession are in asset price bubbles in the
financial and housing sectors. Hispanic and black households, relatively more exposed to subprime loans
and property foreclosures, have been hit particularly hard. Because Hispanics and blacks were also more
likely to experience job losses, they face a longer and harder climb back from the recession.
Is It Over Yet?
Is the Great Recession over? Maybe. And maybe not. The National Bureau of Economic Research (NBER), the quasi-official arbiter of business cycles, traces the beginning of this recession to December 2007. Some economists, pointing to continuous growth in the U.S. gross domestic product dating to the third quarter of 2009, believe it ended nearly a year ago. The NBER defines a recession as the period between a peak and a trough in a nation‟s economic activity. It defines an expansion as the period between a trough and a peak. By definition, then, the economy is always in one state or the other. The NBER has yet to declare this recession over. This doesn‟t mean it isn‟t over. In recent decades, there have been long lag times—ranging from eight to 21 months—between the date of an NBER declaration and the retrospectively determined date of the official end of a recession. The NBER‟s Business Cycle Dating Committee says on its website that it waits long enough “so that the existence of a recession is not at all in doubt” and so that it is confident it can assign an accurate date.
The committee considers a multitude of factors in making its decision. After it last met on April 8, 2010, it issued the
following statement: “Although most indicators have turned up, the committee decided that the determination of the trough date on the basis of current data would be premature.” Whether or not the recession is officially over, it is clear that economic troubles linger. The primary concern of policy makers and the public is with the lack of recovery in the labor market. In the first two years of the recession, the unemployment rate doubled from 5.0% in December 2007, when 7.7 million were unemployed, to 10.0% in December 2009, when 15.3 million were unemployed. Five months later, job growth is anemic. The Bureau of Labor Statistics estimates that the private sector added only 41,000 jobs to its payrolls in May 2010, and the unemployment rate remains high, standing at 9.7% in May 2010, with 15.0 million out of work.

14
This chapter of the report
focuses on the impact of the
Great Recession on workers
and households. Labor
market indicators, such as
employment and
unemployment, are
considered alongside
indicators of the financial
well-being of households,
such as consumption,
savings, debt and wealth. For
analytical purposes, it is
assumed that the recession is
still ongoing 30 months after
it started. If it is eventually
determined that the
recession is already over,
some aspects of the analysis
presented in this chapter
would have to be revisited.
Recessions in the Modern Era
(As determined by the National Bureau of Economic Research)
Beginning—End
Duration Lag Between End and Declaration of End
(Months) (Months)
December 2007—? ?? --
March 2001—November 2001 8 20
July 1990—March 1991 8 21
July 1981—November 1982 16 8
January 1980—July 1980 6 12
November 1973—March 1975 16 *
December 1969—November 1970 11 *
April 1960—February 1961 10 *
August 1957—April 1958 8 *
July 1953—May 1954 10 *
November 1948—October 1949 11 *
February 1945—October 1945 8 *
May 1937—June 1938 13 *
August 1929—March 1933 43 *
*The National Bureau of Economic Research (NBER) has tracked business cycle dates since 1929. It did not formally announce recession end dates until the establishment of its Business Cycle Dating Committee in 1978.

15
The Labor Market in the Great Recession
The principal indicator of the health of the labor market is the rate at which it is creating jobs. Faster job growth
puts more of the working-age population (16 and older) to work, that is, it raises the employment rate. At the
same time, relatively few of those in the labor force, either working or actively looking for work, lack for jobs
and the unemployment rate is lowered. Thus, the ups and downs in the employment and unemployment rates
are important clues to the state of the labor market.
But the simple trends in these two indicators do not tell the whole story. Unemployment may be short-lived, or
it may linger; if the latter, it inflicts far greater consequences on careers and finances. Similarly, some employed
workers may be underemployed. For example, many workers seeking full-time work have to settle for part-time
work in times of recession. Thus, this section also considers other indicators, such as the duration of
unemployment and measures of underemployment, to provide a more complete portrait of the effects of the
Great Recession on the U.S. labor market.
The Employment Rate and the Unemployment Rate
The Great Recession is historic by most labor market indicators. The broadest indicator is the employment rate,
or the share of the working-age population that is at work. The rate has fallen more in this recession than in any
other recession in the post-WWII era. Prior to the current recession, the latest high point for the employment
rate was 63.3% in the first quarter of 2007. Three years later, in the first quarter of 2010, the employment rate
was down to 58.5%, a drop of 4.8 percentage points.5
By contrast, the two recessions in
the early 1980s had a more muted
effect on the employment rate.
The first of those recessions began
in the first quarter of 1980. Just
prior to that date, in the fourth
quarter of 1979, the employment
rate was at its high point for that
era—60.0%. More than three
years later, and after the second
recession had officially ended, the
employment rate had fallen to
57.1% in the first quarter of 1983.
That was a decrease of 2.9
percentage points, much less than
the drop induced by the Great
Recession.
5 Unless otherwise stated, labor market statistics reported in this section are seasonally adjusted.
The Employment Rate First Quarter 1970 to First Quarter 2010 Seasonally adjusted %
Notes: Shaded areas depict periods of recession as determined by the National Bureau of Economic Research. The end date for the recession that started in December 2007 has not yet been announced.
Source: U.S. Bureau of Labor Statistics
60.0
57.1
63.3
58.5
50
52
54
56
58
60
62
64
66
1970 1975 1980 1985 1990 1995 2000 2005 20108200
0

16
Likewise, the unemployment rate
increased more in a shorter length
of time in this recession than in the
1980s. The low point for the
unemployment rate prior to the
Great Recession was 4.5% in the
second quarter of 2007. The
unemployment rate in the first
quarter of 2010 was 9.7%, an
increase of 5.2 percentage points
in just less than three years. In the
early 1980s, the unemployment
rate rose by 5.0 percentage points
in 3½ years, from 5.7% in the
second quarter of 1979 to 10.7%
in the fourth quarter of 1982.6
Duration of Unemployment
The most striking feature of the
Great Recession is that those
without jobs are enduring the
longest spells of unemployment
recorded in modern economic
history. Short-lived spells of
unemployment, say one month,
typically do not lead to significant
financial losses or breaks in career
paths. However, ―long-term‖
unemployment, meaning being out
of work for at least six months, is
associated with severe
consequences for career, income,
health and other aspects of well-
being. Thus, the current spike in
6 Some analysts have argued that comparisons between the unemployment rate today and the rate in the early 1980s should allow for the changing demography of the labor force. In particular, the labor force in the early 1980s was much younger and would be expected to have a higher unemployment rate even under identical economic conditions. Correcting for differences in the age structure suggests that the current unemployment rate is at least as high, and possibly higher, than the rate in the early 1980s. See John Schmitt and Dean Baker, ―Is the U.S. Unemployment Rate Today Already as High as It Was in 1982?‖ Center for Economic and Policy Research, March 2009 (http://www.cepr.net/documents/publications/ur-2009-03.pdf).
The Unemployment Rate First Quarter 1970 to First Quarter 2010 Seasonally adjusted %
Notes: Shaded areas depict periods of recession as determined by the National Bureau of Economic Research. The end date for the recession that started in December 2007 has not yet been announced.
Source: U.S. Bureau of Labor Statistics
5.7
10.7
4.5
9.7
0
2
4
6
8
10
12
1970 1975 1980 1985 1990 1995 2000 2005 2010
Median Duration of Unemployment in Weeks January 1970 to May 2010, seasonally adjusted
Weeks
Notes: Shaded areas depict periods of recession as determined by the National Bureau of Economic Research. The end date for the recession that started in December 2007 has not yet been announced. Revisions to the CPS in 1994 affect the comparability of data over time (see text box).
Source: U.S. Bureau of Labor Statistics
4.8
12.3
8.4
23.2
0
5
10
15
20
25
1970 1975 1980 1985 1990 1995 2000 2005 2010

17
long-term unemployment is a significant development.
The median duration of unemployment in May 2010 was 23.2 weeks, almost six months long and the highest in
the post-WWII era. This means that 7.5 million of the 15 million unemployed workers have been looking for
work for more than five months. The highest level recorded before this date was 12.3 weeks in May 1983 (see
text box for issues regarding comparisons of duration of unemployment over time). The increase in the duration
of unemployment in the Great Recession has also been dramatic. At the start, in December 2007, the median
duration of unemployment was 8.4 weeks.
The share of workers unemployed for more than six months—long-term unemployed—has skyrocketed in the
Great Recession. In May 2010, 46.0% of the unemployed—6.8 million workers—had been out of work for
more than six months. In December 2007, when the recession started, 17.3% of the unemployed—1.3 million
workers—had been without work for more than six months.
The mirror image of the increase in long-term unemployment, of course, is a decrease in short-term
unemployment. The share of workers unemployed less than five weeks fell from 35.8% in December 2007 to
18.7% in May 2010. The number of workers unemployed less than five weeks is unchanged at 2.8 million.
7 See Anne E. Polivka and Stephen M. Miller, ―The CPS After the Redesign: Refocusing the Economic Lens,‖ in John Haltiwanger, Marilyn E. Manser and Robert Topel (eds.), Labor Statistics Measurement Issues, National Bureau of Economic Research, University of Chicago Press, January 1998 (http://www.nber.org/chapters/c8362.pdf).
Comparing the Duration of Unemployment Over Time
Comparisons of the duration of unemployment over time are affected by revisions to the Current Population Survey in 1994. For many indicators, such as the unemployment rate, the effect has been minor. However, measures of the duration of unemployment were strongly impacted by the 1994 CPS revision. Research at the Bureau of Labor Statistics found that prior to 1994, short-term unemployment (less than five weeks) was overstated and that unemployment spells of 15 weeks or more were understated. This means that the median duration of unemployment in May 1983 was not 12.3 weeks but some higher number. Unfortunately, the answer to ―how much higher‖ is not known with precision. BLS estimates7 of the effects of the 1994 CPS revision still suggest that long-term unemployment in the early 1980s was not nearly as high as in the Great Recession. According to published BLS statistics from the early 1980s, the share of unemployed workers who were out of work 15 weeks or more peaked at 41.1% in May 1983. After adjusting for the effects of the CPS revision, that share increases to 48.0%. That is still much less than the modern-day impact of the Great Recession—the share of unemployed workers without work for 15 weeks or more most recently peaked at 61.3% in April 2010.

18
Percent of Unemployed Workers with Long-term Duration of Unemployment January 1970 to May 2010, seasonally adjusted %
Percent of Unemployed Workers with Short-term Duration of Unemployment January 1970 to May 2010, seasonally adjusted %
Notes: Shaded areas depict periods of recession as determined by the National Bureau of Economic Research. The end date for the recession that started in December 2007 has not yet been announced. Revisions to the CPS in 1994 affect the comparability of data over time (see text box).
Source: U.S. Bureau of Labor Statistics
7.6
26.0
16.2
46.0
0
10
20
30
40
50
60
1970 1975 1980 1985 1990 1995 2000 2005 2010
Unemployedmore than 26 weeks
52.2
31.1
38.6
18.7
0
10
20
30
40
50
60
1970 1975 1980 1985 1990 1995 2000 2005 2010
Unemployed less than 5 weeks

19
An unfortunate consequence of long-term
unemployment is that it feeds upon itself—
the likelihood of finding a job diminishes
with the length of time spent out of work.
That is evident from the labor market
experience of workers in March 2009
depending on whether or not they
experienced unemployment in 2008 and
the duration of that unemployment.8
Consider first the effect that any experience
with unemployment in 2008 has on labor
force status in 2009. Among workers who
experienced at least one week of
unemployment in 2008, one-third (33.9%)
were still unemployed in March 2009.9
That contrasts sharply with the experience
of full-year workers—those who worked at
least 48 weeks in 2008. Only 3.2% of full-
year workers from 2008 were unemployed
in March 2009.10
Unemployed workers who went through
long periods without work in 2008 were
the least likely to be employed in March
2009. If a worker was unemployed for less than 12 weeks in 2008, there was a 24.8% chance that the worker
was also unemployed in March 2009. Being without a job for 12 to 24 weeks boosted the odds of unemployment
in March 2009 to 34.8%. Among workers who had been unemployed for more than 24 weeks in 2008, 41.6%
were also unemployed in March 2009.11 Given the negative consequences associated with unemployment—loss
in income, career interruptions, ill effects on families and health—the sharp rise in the duration of
unemployment in the Great Recession is worrisome from more than one perspective.12
8 This particular analysis uses the March 2009 Annual Social and Economic Supplement (ASEC) file. In the ASEC, workers are directly asked about their labor market experiences in the preceding calendar year. The slight disadvantage of using this file is that workers self-report their employment status in 2008. That could differ from the employment status ascribed to workers by the Bureau of Labor Statistics based on a different series of questions. 9 Some 54.5% of workers experiencing some unemployment in 2008 were employed in 2009 and an additional 11.6% had chosen to leave the labor force, either permanently or because they were temporarily discouraged from looking for work. 10 Some 94.9% of full-year workers in 2008 were employed in 2009, and only 1.9% had left the labor force. 11 Similar evidence was presented by Jesse Rothstein, chief economist, U.S. Department of Labor, at the Economic Policy Institute (EPI) on May 26, 2010 (http://www.epi.org/publications/entry/labor_departments_jesse_rothstein_on_long-term_unemployment/). Rothstein looked at the change in the labor force status of workers from one month to the next in 2009. The longer a worker had been unemployed, the less likely it was that the worker was employed the next month. See also Michael W. Elsby, Bart Hobijn and Aysegul Sahin, ―The Labor Market in the Great Recession,‖ National Bureau of Economic Research, Working Paper 15979, May 2010 (http://www.nber.org/papers/w15979). 12 For example, see Till von Wachter and Daniel Sullivan, ―Job Displacement and Mortality: An Analysis Using Administrative Data,‖ The Quarterly Journal of Economics, Vol. 124, No. 3, August 2009: 1265-1306
Likelihood of Unemployment in March 2009,
by Duration of Unemployment in 2008
Employment Share Status in Unemployed in 2008 March 2009 (%)
Unemployment Share Duration Unemployed in in 2008 March 2009 (%)
Notes: Full-year workers are people who reported working at least 48 weeks. Duration of unemployment in 2008 is self-reported by respondents.
Source: Pew Research Center tabulations of the Current Population Survey, Annual Social and Economic Supplement, March 2009
3.2
33.9
Full-year worker, no unemployment
Unemployed one week or more
24.8
34.8
41.6
Less than 12 weeks
12 to 24 weeks
More than 24 weeks

20
Reasons for Unemployment
The duration of unemployment is also related to the reason someone is out of work. Temporary layoffs, where
workers have an expectation of returning to their old jobs, are less likely to result in long spells of
unemployment. But if unemployment is driven by permanent job cuts, meaning employers do not foresee
returning to old staffing levels, or if there is an influx of new workers in a tough economy, it is more likely that
unemployment spells will last longer.
A unique feature of the Great Recession is that, for the first time, the majority of the unemployed workers had
lost their jobs for good.13 In May
2010, 52.2% of unemployed
workers had lost a job for a reason
other than a temporary layoff, an
increase from 37.8% in December
2007. These workers had no
expectation of recall to their old
job.
The use of temporary layoffs by
businesses has actually diminished
in relative importance since
2007—9.9% of unemployed
workers were on temporary layoffs
in May 2010, compared with
12.7% in December 2007. That is
in contrast to the recessions in the
early 1980s when both temporary
layoffs and permanent job losses
had spiked.
The reason for unemployment and the duration of unemployment are closely related. Workers on temporary
layoffs are likely to have shorter spells of unemployment, and workers who have lost jobs for other reasons are
likely to face long-term unemployment.
According to the Bureau of Labor Statistics (BLS), in 2009, 7.3% of the unemployed on temporary layoff had
been out of work for more than six months and 47.5% had been without work one month or less.14 At the same
time, in 2009 among other workers who lost their job involuntarily, 36.4% had been out of work for more than
six months and 16.8% had gone without work for one month or less. Thus, the fact that the majority of
(http://www.mitpressjournals.org/doi/abs/10.1162/qjec.2009.124.3.1265?journalCode=qjec), and Till von Wachter, Jae Song and Joyce Manchester, ―Long-Term Earnings Losses due to Mass Layoffs During the 1982 Recession: An Analysis Using U.S. Administrative Data from 1974 to 2004,‖ working paper, April 2009 (http://www.columbia.edu/~vw2112/papers/mass_layoffs_1982.pdf). 13 Data on reason for unemployment are available starting in 1967. 14 These data from the BLS are available at http://www.bls.gov/cps/cpsaat29.pdf.
Temporary Layoffs and Other Involuntary Job Losses (Percent of Unemployed) January 1970 to May 2010, seasonally adjusted
%
Notes: Shaded areas depict periods of recession as determined by the National Bureau of Economic Research. The end date for the recession that started in December 2007 has not yet been announced. Revisions to the CPS in 1994 affect the comparability of data over time.
Source: U.S. Bureau of Labor Statistics
0
10
20
30
40
50
60
1970 1975 1980 1985 1990 1995 2000 2005 2010
Other involuntary job losses
Temporary layoffs

21
unemployed workers have lost their jobs without possibility of recall does not bode well for the duration of
unemployment in the near future.
The Discouraged and Other Underemployed
The unemployment rate, which encompasses only workers actively looking for work, can understate the extent
of ―slack‖ in the labor market. There are at least two other groups of workers whose ranks swell in tough
economic times. One group, known as ―marginally attached workers,‖ includes those not working or actively
looking for work but who are available to work, are interested in work and have looked for work sometime in
the past 12 months. Discouragement in weak labor markets causes more workers to become marginally
attached.
Another group of workers captures some of the underemployed. Those are workers who would like to work full
time but because of economic conditions are pushed into part-time work.15 The share of those ―involuntary part-
time workers‖ typically increases during recessions.16
Taking account of the marginally attached and the involuntary part-time workers, it is evident that the Great
Recession has created a wide
chasm between the official
unemployment rate and the
broader measure of slack in the
labor market. At the start of the
recession in December 2007, the
unemployment rate was 5.0% and
the broader measure was 8.8%, a
gap of 3.8 percentage points. By
May 2010, the unemployment rate
had increased to 9.7%. However,
the broader measure stood at
16.6%, a gap of some seven
percentage points.17
The measures of marginally
attached workers and involuntary
part-time workers were not
available prior to 1994. Thus, a
15 A discussion of various measures of underemployment is available in Steve E. Haugen, ―Measures of Labor Underutilization from the Current Population Survey,‖ Working Paper 424, March 2009, U.S. Department of Labor, U.S. Bureau of Labor Statistics, Office of Employment and Unemployment Statistics (http://www.bls.gov/ore/pdf/ec090020.pdf). 16 Involuntary part-time employment is a partial measure of underemployment. However, other types of underemployment, such as mismatches between the true capabilities of a worker and the actual job requirements, are difficult to measure. 17 BLS data show that the number of persons working part time for economic reasons increased from 4.4 million in 2007 to 8.9 million in 2009. Also, the number of persons not in the labor force but interested in a job increased from 4.7 million in 2007 to 5.9 million in 2009.
Alternative Measures of Unemployment January 1994 to May 2010, seasonally adjusted
%
Notes: Shaded areas depict periods of recession as determined by the National Bureau of Economic Research. The end date for the recession that started in December 2007 has not yet been announced.
Source: U.S. Bureau of Labor Statistics
5.0
9.78.8
16.6
0
5
10
15
20
1994 1996 1998 2000 2002 2004 2006 2008 2010
Unemployment rate
Unemployment rate plus marginally attached and involuntary part-time workers

22
comparable measure of slack in the labor market does not exist for the recessions in the early 1980s. However,
the Great Recession drove this measure as high as 17.4% in October 2009. The previous high was 11.8% in
January 1994, the first date for which data on this measure are available.
Job Losses for Different Groups of Workers
The impact of a recession usually differs across groups of workers. Workers with lower levels of education or in
blue-collar occupations tend to lose jobs in greater numbers. And because men are relatively more concentrated
in production work, they often are on the front line of jobs lost. The same is true of minorities and younger
workers. In these respects, the Great Recession resembles its siblings.18
Unemployment rates at the start of the recession and two years into the recession for selected groups of workers
are shown in the accompanying table. Because seasonally adjusted data are not available for all groups of
workers, the data shown are for the fourth quarters in 2007 and 2009. In that two-year period, the overall
unemployment rate, not seasonally adjusted, increased from 4.8% to 10.0%, a change of 5.2 percentage points.
Men have fared relatively worse than women during the recession. The unemployment rate for men in the
fourth quarter of 2007 (4.9%) was similar to the rate for women (4.7%). However, at the end of 2009 the
unemployment rate for men was much higher—11.2% compared with 8.7% for women.
Changes in the unemployment rate by age group show clearly that being young in the Great Recession is a severe
disadvantage. About one-in-five (19.1%) workers ages 16 to 24 were unemployed in the fourth quarter of
2009.19 That was eight percentage points higher than the unemployment rate for this age group in the fourth
quarter of 2007. Both the levels and changes in the unemployment rate are less sizable among older age groups.
Education is also an important factor in surviving tough economic conditions. Workers who did not complete a
high school level of education have fared the worst. Their unemployment rate increased from 7.7% in the fourth
quarter of 2007 to 15.3% in the fourth quarter of 2009. Meanwhile, the unemployment rate of workers who
have completed college was still less than five percent in the fourth quarter of 2009.
Hispanics and blacks generally have higher than average rates of unemployment through good times and bad.
The Great Recession is no exception. Job losses for Latino and black workers have been greater and their
unemployment rates have been driven much higher—12.5% for Hispanics in the fourth quarter of 2009 and
15.5% for blacks.
A look at unemployment among native-born and foreign-born workers suggests, on the surface, that immigrant
workers have fared worse in the recession. In the fourth quarter of 2007, the unemployment rate for foreign-
born workers (4.5%) was a smidgen less than the rate for native-born workers (4.6%). By the fourth quarter of
2009, the situation had changed—the rate for foreign-born workers was 10.1%, and the rate for native-born
workers was 9.5%.
18 See, for example, Michael W. Elsby, Bart Hobijn and Aysegul Sahin, ―The Labor Market in the Great Recession,‖ National Bureau of Economic Research, Working Paper 15979, May 2010 (http://www.nber.org/papers/w15979). 19 A detailed analysis of unemployment among youth is available in Kathryn Anne Edwards and Alexander Hertel-Fernandez, ―The Kids Aren‘t Alright: A Labor Market Analysis of Young Workers,‖ Economic Policy Institute, Briefing Paper 258, April 7, 2010 (http://www.epi.org/publications/entry/bp258).

23
The Unemployment Rate, by Selected Characteristics of Workers Fourth Quarter 2007 and Fourth Quarter 2009
Unemployment
Rate (%)
Percentage Point
Change
2007:4 2009:4
All 4.8 10.0 5.2
Men 4.9 11.2 6.3
Women 4.7 8.7 4.0
Age
16-24 11.1 19.1 8.0
25-34 4.8 10.4 5.6
35-44 3.6 8.8 5.2
45-54 3.4 7.8 4.4
55-64 2.9 6.9 4.0
65+ 3.2 6.5 3.3
Age 25 and older 3.8 8.6 4.8
Less than high school 7.7 15.3 7.6
High school diploma 4.6 10.7 6.1
Some college 3.6 9.0 5.4
College degree or more 2.1 4.9 2.7
Hispanics 5.8 12.5 6.7
Whites 3.7 8.0 4.3
Blacks 8.6 15.5 6.9
Asians 3.7 7.8 4.1
Native born 4.6 9.5 4.8
Hispanic 6.7 13.6 6.9
Non-Hispanic 4.5 9.1 4.6
Foreign born 4.5 10.1 5.6
Hispanic 5.1 11.6 6.5
Non-Hispanic 3.9 8.5 4.6
Industry
Construction 7.2 20.3 13.0
Manufacturing 4.5 12.2 7.7
Education & Health 2.7 5.7 3.0
Government 2.2 3.5 1.3
Notes: Hispanics are of any race. Whites, blacks, and Asians include only non-Hispanics. Data for workers by education level are seasonally adjusted; all other data are non-seasonally adjusted. Source: U.S. Bureau of Labor Statistics and Pew Research Center tabulations of Current Population Survey data

24
However, closer inspection reveals that
being an immigrant is not necessarily
harmful in and of itself during the Great
Recession. Latino immigrants had a
lower rate of unemployment than
native-born Latinos both before the
recession and at the end of 2009. The
same is true for non-Hispanic
immigrants. In other words, both within
the Latino workforce and the non-
Latino workforce, immigrants did
better in the recession than native-born
workers.
However, a very high share of the
immigrant workforce is Hispanic (50%
in the fourth quarter of 2009), and a
relatively small share of the native-born
workforce is Hispanic (8% in the fourth
quarter of 2009). Thus, the general
misfortune of Latino workers, not just
the misfortune of immigrant Latinos,
had a much bigger impact on the
unemployment rate of foreign-born
workers as a whole. That drove the
overall impression of a more negative
impact on immigrants.
Changes in unemployment rates for
workers in selected industries clearly
reveal the roots of the recession. The
bursting of the housing bubble more
than doubled the unemployment rate
among workers in the construction
industry—from 7.2% in the fourth
quarter of 2007 to 20.3% in the fourth
quarter of 2009. But job losses in the education and health sector and the government sector were very limited
in contrast.
Which group of workers has experienced the biggest losses in the labor market from the Great Recession? A
ranking of groups of workers based on the percentage point change in their unemployment rate from the fourth
The Percentage Point Change in the Unemployment Rate, by Selected Characteristics of Workers Fourth Quarter 2007 to Fourth Quarter 2009
Notes: Hispanics are of any race. Whites, blacks, and Asians include only non-Hispanics. Data for workers by education level are for ages 25 and older and seasonally adjusted; all other data are non-seasonally adjusted. Source: U.S. Bureau of Labor Statistics and Pew Research Center tabulations of Current Population Survey data
2.7
3.3
4.0
4.0
4.1
4.3
4.4
4.8
5.2
5.2
5.4
5.6
5.6
6.1
6.3
6.7
6.9
7.6
8.0
College
65+
Women
55-64
Asians
White
45-54
Native born
All
35-44
Some college
Foreign born
25-34
High school
Men
Hispanics
Blacks
Less than high school
16-24

25
quarter of 2007 to the fourth quarter of 2009 is shown in the accompanying figure (see text box for an
alternative perspective).
The overall change in the unemployment rate was 5.2 percentage points. Less educated workers, younger
workers, Hispanic and black workers, and male workers experienced greater than average increases in the
unemployment rate. The highest increases were for workers ages 16 to 24—eight percentage points—and
workers who did not complete high school—7.6 percentage points. At the other end of the spectrum, the
increase in the unemployment rate was lowest among college-educated workers (2.7 points), workers ages 65
and older (3.3 points) and women (four points).
Who Experienced the Biggest Losses? An Alternative Perspective
Groups of workers with the largest change in their unemployment rates also generally had high levels of unemployment at the start of the recession. For example, in the fourth quarter of 2007, the unemployment rate for workers ages 16 to 24 was 11.1%, for workers with less than a high school level of education it was 7.7% and for black workers it was 8.6%. Therefore, the change in the unemployment rate for these workers—ages 16 to 24, less than a high school level of education, blacks—did not necessarily represent the greatest proportional increase in unemployment. From that alternative perspective, other groups of workers might be seen as having worse experiences in the Great Recession. Among workers grouped by age, the only group that did not experience at least a doubling of its unemployment rate was ages 16 to 24. More specifically, the unemployment rate for workers ages 16 to 24 increased 72% from the fourth quarter of 2007 to the fourth quarter of 2009. All other age groups experienced increases greater than 100%. Similarly, those with less than a high school education, among education groups, and blacks, among racial and ethnicity groups, experienced smaller proportional changes in their unemployment rates.

26
Household Finances in the Recession: Consumption, Savings, Debt and Wealth
The origins of the Great Recession are in the financial sector. But banking, investment and insurance firms were
not the only institutions assuming greater risk in the years leading up to the recession. Households, too, placed a
bet on rising home prices and took on high volumes of mortgage debt. At the same time, they spent more of
their incomes and saved relatively less. Capital gains on homes and other assets masked the underlying
imbalance, but the situation ultimately proved unsustainable.
Households have adopted a more fiscally conservative path since the recession started in 2007. Whether by
choice or circumstance, or because lenders have cut back on the availability of credit, household spending is
down, saving is up, consumer credit is stable and mortgage debt has plunged. However, household wealth is
down because asset values, both financial and nonfinancial, have fallen sharply during the recession.
This section examines changes in household consumption, savings, debt and wealth during the Great Recession
in the context of modern U.S. economic history. The principal sources of data are the U.S. National Income and
Product Accounts (NIPA) and the Flow of Funds Accounts of the United States. The former is the source for
trends in household consumption and savings, and the latter is the source for trends in household debt and
wealth.20
Because the NIPA and Flow of Funds data are aggregate national accounts, they do not contain information on
the finances of individual households.21 That is an important issue for the analysis of wealth because it is very
unevenly distributed across households—many have little to no wealth and a few have lots of wealth.22 The
uneven distribution tends to exaggerate the wealth held by the typical household as estimated from the Flow of
Funds data. For that reason, the median wealth of households—the point at which half the households hold more
wealth and half the households hold less—is often considered a more useful descriptor. Unfortunately, the
principal source of data on the wealth of individual households, the Survey of Consumer Finances (SCF), does
not yield an extended historical series. Also, the latest available data from the SCF is for 2007, before the start of
the Great Recession.
Consumption and Savings
The share of disposable income devoted to consumption rose during the 25 years preceding the Great Recession.
In the 1970s, this share held steady at approximately 88%. The share fell to 86% in 1982, during the last deep
recession, but then increased almost continuously and stood at more than 94% in 2007.23 In dollar amounts, per
capita consumption rose from $19,079 in 1982 to $33,665 in 2007 (figures expressed in 2009 dollars).
20 The principal advantage of the NIPA and Flow of Funds data is that they may be trended back several decades—essential for placing developments in the Great Recession in historical perspective. ―Households‖ in these datasets include nonprofit organizations serving households. Examples of such nonprofit organizations include colleges, religious institutions and medical care facilities. NIPA data for just households are available but only from 1992 onward. The data for households alone show similar trends in consumption and savings as the data for households and nonprofit organizations combined. 21 The two major sources of data on the finances of households are the Consumer Expenditure Survey, from which consistent annual data are available from 1984 to 2008, and the Survey of Consumer Finances, available triennially from 1983 to 2007. Neither is able to provide up-to-date data that cover the entirety of the Great Recession. 22 For example, see Rakesh Kochhar, ―The Wealth of Hispanic Households: 1996 to 2002,‖ Pew Hispanic Center, Washington, D.C., October 2004 (http://pewhispanic.org/reports/report.php?ReportID=34). 23 The peak—95%—was reached in 2005.

27
As spending increased, savings tumbled.
The savings rate—or the share of income
that is saved—decreased from 10.9% in
1982 to 1.7% in 2007.24 In dollar
amounts, per capita saving fell from
$2,426 in 1982 to $613 in 2007 (figures
expressed in 2009 dollars).
Since the start of the recession in 2007,
consumption has fallen and savings have
recovered. The share of income that is
spent dropped from 94% in 2007 to 92%
in 2009. Expenditures per capita, in 2009
dollars, fell from $33,665 in 2007 to
$32,812 in 2009, or $853 less per
person.
The savings rate has more than doubled
since the recession began. It stood at
4.3% in 2009, compared with 1.7% in
2007. Per capita savings, in 2009 dollars,
increased from $613 in 2007 to $1,512 in
2009.
The latest turnabout in consumption and
savings is not unusual for a recessionary
period. The share of consumption in
disposable income also fell by about two
percentage points in the early 1980s.
While the savings rate did not increase at
that time, it held steady at about 10
percent, much higher than the current
savings rate. After the recession in 1981-
82, consumption increased and savings
fell. Whether the current ―correction‖ in household finances will last into the long term is not known.
24 The savings rate was lowest in 2005 at 1.4%.
Household Consumption and Saving as a Share of Disposable Personal Income, Annual, 1970 to 2009
Note: Shares of income devoted to consumption and savings do not total 100 because of other expenses, including non-mortgage interest payments and transfer payments.
Source: Bureau of Economic Analysis, National Income and Product Acounts, Table 2.1
70
80
90
100
1970 1980 1990 2000
88%
86%
F
%
F
Consumption96%
94%
2009
0
10
20
30
1970 1980 1990 2000
F
%
F
Savings
11%
2%
4%
10%
2009

28
Debt
Household debt mostly consists of
mortgages for home purchase and
consumer credit for other purchases. The
rapid escalation of home prices and the
drive to purchase homes starting in the
mid-1990s led to soaring levels of
household debt. However, household
financial liabilities have fallen during the
recession. That could be due to a
combination of factors—lenders are
imposing tougher requirements, new
borrowing by households may be less than
repayments on old loans, and home
foreclosures and personal bankruptcies may
have taken some debt off the books.25
Household liabilities—the outstanding
amount owed by all households—increased
slowly in the 1970s, gathered momentum
in the 1980s, kept up the pace in the 1990s
and then accelerated at the turn of the
century. In 2000, the average U.S.
household carried a debt of $86,346. By
2007, the average household debt had
reached $128,134, an increase of 48% (figures in 2009 dollars).
However, households have reduced their debt since the start of the recession. Average household debt in 2009
was $120,057. That was down $8,077, or 6%, compared with 2007. The last time household debt decreased at
a similar pace was from 1980 to 1982. The recessions of 1990-91 and 2001 had no such effect as households
continued to add to their debt.
25 See Karen Dynan, ―What to Make of Declining Household Debt Burdens,‖ The Brookings Institution, December 22, 2009
(http://www.brookings.edu/opinions/2009/1222_debt_burden_dynan.aspx?p=1).
Financial Liabilities per Household, 1970-2009 (End-of-Period)
(2009 dollars)
Notes: Dollar values deflated by the CPI-U-RS. Aggregate data from Flow of Funds Accounts are divided by number of households in the U.S., as determined by the Census Bureau, to obtain average amounts per household.
Source: Federal Reserve Bank, Flow of Funds Accounts, June 10, 2010 release
$128,134
$120,057
$93,996
$88,191
$0
$20,000
$40,000
$60,000
$80,000
$100,000
$120,000
$140,000
1970 1980 1990 2000
Total
Home Mortgage
Consumer Credit
2009

29
Changes to average household debt on an
annual basis are closely correlated with
changes to home mortgage debt. Annual
changes to consumer credit—credit card
purchases and the like—are generally small
and sometimes negative, meaning payments
exceed new borrowing. Overall, consumer
credit has played a minimal role in elevating
or reducing household debt.
In contrast, mortgage debt has often added
a significant amount of new debt to
household portfolios. It is also the reason
why household debt increased so acutely
from 2002 to 2006. However, mortgage
borrowing and, along with it, total
borrowing, has fallen sharply with the onset
of the recession. In 2008, the average
household reduced its level of outstanding
debt by $6,418. Of that amount, $4,431
was due to a reduction in mortgage debt.
Financial stress on households can also be
gauged by the share of income they must
devote to servicing their debt. That share,
known as the debt service ratio, is the ratio
of payments on mortgage and consumer
debt to disposable personal income. It
reflects the debt obligations a household
must meet each month.
The debt service ratio was relatively low in
the early 1980s—most likely a reflection of
the two recessions during that period.
Starting from a low point of 10.6% in the
first quarter of 1983, the ratio trended up
to about 12% by 1990. The 1990-91
recession caused a brief decline, but the
debt service ratio rose steadily thereafter.
The recession in 2001 had no apparent
effect on debt service obligations. The high
point for the ratio was 13.9% in the first
Change Over the Previous Year in Financial Liabilities per Household, 1970-2009
(2009 dollars)
Notes: Dollar values deflated by the CPI-U-RS. Aggregate data from Flow of Funds Accounts are divided by number of households in the U.S., as determined by the Census Bureau, to obtain average amounts per household.
Source: Federal Reserve Bank, Flow of Funds Accounts, June 10, 2010 release
-$6,000
-$3,000
$0
$3,000
$6,000
$9,000
1970 1980 1990 2000
Total Liabilities
2009
-$6,000
-$3,000
$0
$3,000
$6,000
$9,000
1970 1980 1990 2000
Home Mortgage
2009
-$3,000
$0
$3,000
1970 1980 1990 2000
Consumer Credit
2009

30
quarter of 2008. But households have made
changes since that time and by the end of
2009 the debt service ratio had fallen to
12.6%.
Debt Service Ratio, First Quarter 1980 to Fourth Quarter 2009
(Not seasonally adjusted)
Notes: The debt service ratio is the ratio of payments on mortgages and consumer credit to disposable personal income. Shaded areas show periods of recession as determined by the National Bureau of Economic Research. The end date for the recession that started in December 2007 has not yet been announced.
Source: Federal Reserve Bank
0.139
0.126
0.09
0.10
0.11
0.12
0.13
0.14
0.15
1980 1990 2000 2010
0
0

31
Wealth
Wealth can be a useful buffer against the
financial losses inflicted by unemployment.
But this buffer itself has come under direct
assault during the Great Recession. In
2008, the first year of the recession, mean
household wealth fell by more than in any
year since WWII.26 The reason is the
confluence of a stock market crash and
falling home prices that left few households
unscathed.
Household wealth, or net worth, is the
difference between the value of the assets a
household owns and the amount of its debt.
This section explores historical trends
through the prism of mean wealth, or
wealth per household. Average wealth is
typically much higher than median wealth
because of the concentration of high levels
of wealth in the hands of relatively few
households. A text box below explores the
issue in more detail.
Mean wealth—net worth per household—
peaked at about $600,000 in 2006 (figures
in 2009 dollars). In 2007, as home prices
began to inch downward, net worth fell to
$574,000, a loss of 4%. However, in 2008, average household net worth tumbled to $438,000. That
represented a drop of 24%, by far the largest one-year drop since WWII.27
As shown in the accompanying figure, fluctuations in net worth are mainly a consequence of fluctuations in asset
values. Liabilities have risen slowly and steadily over time. However, there have been two episodes of sharp
declines in asset values since 1970, and both have led to sharp declines in net worth.
26 The severe impact of this recession on household wealth is also analyzed by Kevin B. Moore and Michael G. Palumbo, ―The Finances of American Households in the Past Three Recessions: Evidence from the Survey of Consumer Finances,‖ Finance and Economics Discussion Series, Division of Research and Statistics and Monetary Affairs, Federal Reserve Board, Washington, D.C., December 10, 2009 (http://www.federalreserve.gov/pubs/feds/2010/201006/201006pap.pdf). 27 The previous high for a one-year drop in average household wealth was 11.2% in 1974 in the midst of a 16-month recession.
Mean Assets, Liabilities and Net Worth per Household, 1970-2009
(2009 dollars)
Notes: Dollar values deflated by the CPI-U-RS. Aggregate data from Flow of Funds Accounts are divided by number of households in the U.S., as determined by the Census Bureau, to obtain average amounts per household.
Source: Federal Reserve Bank, Flow of Funds Accounts, June 10, 2010 release
$599,234
$437,656
$0
$100,000
$200,000
$300,000
$400,000
$500,000
$600,000
$700,000
$800,000
1970 1980 1990 2000
Assets
Net Worth
Liabilities
2009

32
The first episode of a plunge in
asset values lasted from 1999 to
2002. The bursting of the dot-com
bubble and 9/11 caused the S&P
500 index to drop from a high of
1,468 in September 2000 to 847 in
March 2003, a fall of 42%.
However, home prices continued
to increase during this period,
limiting the overall loss in the
wealth of households—from 1999
to 2002, mean net worth fell 15%.
The sharp decline in household
wealth in 2007 and 2008 is a
consequence of falling stock prices
and declining home prices. The
S&P 500 index decreased from
1540 in January 2007 to 757 in
March 2009, a drop of 51%.
During this general time period,
home prices were also on the way
down. As measured by the House
Price Index from the Federal
Housing Finance Agency, national
home prices decreased by 4% from
the first quarter of 2007 to the first
quarter of 2009. This combination
was particularly damaging because
for most households home equity
and stocks and bonds add up to the
lion‘s share of wealth.28 As a result,
the Great Recession has caused
households to experience the
greatest loss in wealth in the post-
WWII era.
The stock market has recovered in
recent months as the S&P 500 rose
28 According to the 2007 Survey of Consumer Finances, equity in primary and other residential properties accounted for 39.2% of the wealth of a typical U.S. family. Investments in stocks and bonds, directly or indirectly through retirement accounts, represented 24.7% of wealth for a typical family.
Trends in Mean Net Worth per Household, the S&P 500 and the Home Price Index
(Not seasonally adjusted; net worth in 2009 dollars)
Notes: Dollar values deflated by the CPI-U-RS. Aggregate data from Flow of Funds Accounts are divided by number of households in the U.S., as determined by the Census Bureau, to obtain average amounts per household. Net worth and Home Price Index are measured quarterly. The S&P 500 is the monthly average daily closing.
Sources: Federal Reserve Bank, Flow of Funds Accounts, June 10, 2010 release for net worth; Robert Shiller, Yale University, http://www.econ.yale.edu/~shiller/data.htm for S&P 500; and the Federal Housing Finance Agency for the Home Price Index (All-Transactions Index, not seasonally adjusted)
$0
$150,000
$300,000
$450,000
$600,000
1975 1980 1985 1990 1995 2000 2005 2010
Net Worth
0
400
800
1200
1600
1975 1980 1985 1990 1995 2000 2005 2010
S&P 500
0
100
200
300
400
1975 1980 1985 1990 1995 2000 2005 2010
Home Price Index

33
52% from March 2009 to March 2010. This also caused net worth per household to increase in 2009. However,
home prices have continued to fall, by an additional 7% from the first quarter of 2009 to the first quarter of
2010. That, no doubt, has restrained the extent to which household wealth could recover in 2009.
Mean Household Wealth vs. Median Household Wealth
Mean household wealth, or wealth per household in the U.S., is the only historical indicator of wealth that extends back to cover the recessions in the early 1980s and earlier. However, because wealth is very unevenly distributed, it is an imperfect indicator of the wealth available to the typical household. The issue is better understood by comparing the data from the Flow of Funds Accounts with the data directly collected from households in the Survey of Consumer Finances. According to the Flow of Funds Accounts, wealth per household was $574,000 in 2007. The Survey of Consumer Finances (SCF), last conducted in 2007, estimated that mean household wealth was $577,000. However, median household wealth in the 2007 SCF was much less—$125,000 (all figures in 2009 dollars). Thus, mean household wealth can exaggerate the well-being of the typical household because of the concentration of wealth at the top end of the distribution. The accompanying figure shows the trends in mean and median household wealth as estimated from the Flow of Funds Accounts and the SCF from 1989 to 2007. Estimates of mean household wealth from the two sources are consistent from 2001 onward. It is also apparent that mean household wealth is always much higher than median household wealth. Changes in median wealth are sometimes consistent with changes in the mean, and sometimes not. For example, median household wealth (in 2009 dollars) was virtually unchanged from $105,000 in 2001 to $106,000 in 2004. However, mean household wealth in the SCF increased from $481,000 in 2001 to $510,000 in 2004, a change of 6%. Similarly, the Flow of Funds Accounts indicate an increase in mean wealth from $475,000 in 2001 to $536,000 in 2004, a change of 13%.
Mean and Median Net Worth of Households, 1989-2007
(2009 dollars)
Note: Dollar values deflated by the CPI-U-RS.
Sources: Federal Reserve Bank, Flow of Funds Accounts, June 10, 2010 release and Survey of Consumer Finances
$0
$100,000
$200,000
$300,000
$400,000
$500,000
$600,000
1989 1992 1995 1998 2001 2004 2007
Mean, Flow of Funds Accounts
Mean, Survey of Consumer Finances
Median, Survey of Consumer Finances

34
Wealth of Households by Income, Race and Ethnicity
As noted above, one aspect of wealth is that it is very unevenly distributed. Upper-income households have lots
of it, and lower income households have virtually none. Similarly, the net worth of white households is far in
excess of the wealth of black and Hispanic households.29 Thus, whether or not the Great Recession has
sharpened these inequities is an important question.
This question can be addressed tentatively with data from the PSID.30 The PSID is conducted every two years,
and it collected data on family wealth in 2007 and 2009. A preliminary file for 2009 was released ahead of
schedule so that researchers could examine the impact of the Great Recession on household wealth. It is
important to note that the early version of the 2009 PSID lacks updated weights, current income and
imputations for missing values. The file is also subject to further editing before its final release. Because the
estimates that may be derived from the PSID are tentative, this section discusses only the suggested changes in
household wealth, not the levels.
Subject to the caveats noted, PSID data indicate that median household wealth decreased by 19% from 2007 to
2009. That is consistent with the drop in mean household wealth. As estimated from the Flow of Funds
Accounts, mean household wealth decreased by 20% from 2007 to 2009. The change in median wealth did vary
by the income strata of the household. Lower-income households, which hold few assets in general, experienced
a loss of 7%. The median wealth of upper-income households, which possess more diverse portfolios, decreased
by 12%. The median wealth of middle-income households, which are more dependent on home equity, dropped
by 23%.31
Preliminary evidence from the PSID also suggests that the Great Recession caused a greater proportional
decrease in the median wealth of Hispanic and black households—down by 52% and 30%, respectively—than in
the wealth of white households, which was down by 9%. One reason for this might be that minority households
have been subject to greater exposure to subprime home loans and property foreclosures in recent years.32
Another reason might be that minorities have experienced a greater extent of job losses. Research finds that
households experiencing unemployment also experience sharp drops in wealth.33 The combined force of the two
effects—loss in wealth and greater job losses in the recession—means that the road to recovery for minorities
may be more arduous.
29 Rakesh Kochhar, ―The Wealth of Hispanic Households: 1996 to 2002,‖ Pew Hispanic Center, Washington, D.C., October 2004 (http://pewhispanic.org/reports/report.php?ReportID=34). 30 The PSID, started in 1968, is a longitudinal study of U.S. families, that is, it follows the same families and individual members of those families over time. It features an oversample of low-income families. The original sample size was about 4,800 families, and it has grown since to about 8,000 families today. A refresher sample of immigrant families was added in 1997 to keep the study representative of the U.S. population. The study is conducted at the Survey Research Center, Institute for Social Research, University of Michigan. 31 The classification of households into upper-, middle- and lower-income strata uses the methodology described in ―Inside the Middle Class: Bad Time Hit the Good Life,‖ Pew Research Center, Social and Demographic Trends, April 2008 (http://pewsocialtrends.org/pubs/706/middle-class-poll). 32 Rakesh Kochhar, Ana Gonzalez-Barrera and Daniel Dockterman, ―Through Boom and Bust: Minorities, Immigrants and Homeownership,‖ Pew Hispanic Center, Washington, D.C., May 12, 2009 (http://pewhispanic.org/reports/report.php?ReportID=109). 33 Jonathan Gruber, ―The Wealth of the Unemployed,‖ Industrial and Labor Relations Review, Vol. 55, No. 1, October 2001, 79-94.

35
Chapter 3: The Slow Road to Recovery
In March of 2009, Federal Reserve Board Chairman Ben
Bernanke said he saw the first ―green shoots‖ of an economic
recovery—one that he predicted would ―pick up steam‖ over
time. But more than a year later, almost no one in America
believes the recession is over. Most still can‘t even spot the
green shoots.
The latest Pew Research survey finds that a majority of
Americans (54%) believe the economy is still in a recession.
About four-in-ten (41%) say they think the economy is
starting to come out of the recession. Just 3% say the
recession is over.
The public is also downbeat when asked to rate overall
economic conditions in the country today. Just 1% say the
economy is in excellent shape, and 14% say it is in good
shape. Nearly half (46%) say it is ―only fair,‖ and 38% say it is
―poor.‖
However, even though those
assessments tilt negative, they are
the least negative readings since
January 2008, just as the recession
was beginning. The 38% who
currently rate the U.S. economy as
―poor‖ represents a significant drop
from the 53% who said that as
recently as March 2010 and the
71% who said it in February
2009— the low point in modern
times for the public‘s assessment of
the nation‘s economic conditions.
Likewise, the 15% who now say the
economy is excellent or good are
nearly quadruple the share (4%)
who said that in February of 2009.
So at least by these trend measures, some green shoots in the public‘s confidence in the economy are finally
starting to sprout—albeit more than a year after that initial sighting by Bernanke.
Ratings of the Economy Turn Less Negative
% saying the U.S. economy is …
Note: “Only fair” and “Don‟t know/Refused” responses are not shown.
0
20
40
60
80
Dec-06 Dec-07 Dec-08 Dec-09
Excellent/Good Poor
May-10
Recession began, Dec '07
Most Say the Recession Continues
% saying the U.S. economy is …
Note: “Don‟t know/Refused” responses are included but not labeled.
54%
41%
3%
Still in recession
Starting to recover
Recessionis over

36
This hedged and still somewhat
ambiguous verdict from the court of
public opinion is also evident in response
to another survey question that asks
people about the long-term impact of
the recession on the U.S. economy.
Fully seven-in-ten respondents say the
recession has caused major changes in
the economy, while just 21% say it has
caused minor changes. The rest say it
hasn‘t caused any changes (6%) or have
no opinion (3%). However, most
Americans (61%) say these changes will
prove to be temporary. This is true both
for the respondents who see major
changes (by a ratio of more than two-to-
one, they see temporary rather than
permanent change) and those who see
minor changes (by a ratio of about four-
to-one, they see temporary rather than permanent change).
The majority view that the recession‘s impact on the economy won‘t be permanent is in sync with another
notable finding from this survey. Respondents were asked if they agreed or disagreed with the following
statement: ―Although there may be bad times every now and then, America will always continue to be
prosperous and make economic progress.‖
Even in today‘s bad economy, those who agree with the statement (63%) outnumber those who disagree (31%)
by a ratio of about two-to-one.
This question was asked four different times in the early and mid-1990s,34 at a time of steady economic growth
and relatively low unemployment. Today‘s responses are not much different from those registered back then—
suggesting that the public‘s basic faith in the long-term prosperity of America is resilient enough to withstand a
long bout of hard times. (At the same time, there was a much more positive reading on this question in 1987,
when the economy had been in a robust expansion for several years. In that survey, 71% of respondents agreed
with the statement, while just 11% disagreed.)
Different Groups, Different Perspectives
Different groups of Americans have markedly different views about the impact of this recession. Some of these
differences are predictable. For example, those who have been personally hard-hit by the recession (as a result of
34 The earlier surveys that included this question were conducted by Cambridge Reports/Research International.
Is America Still a Land of Prosperity?
% who say they …
Note: The 1987,1992, 1993,1994,1995 numbers are from Cambridge Reports/Research International.
Question wording: “Do you agree or disagree: „Although there may be bad times every now and then, America will always continue to be prosperous and make economic progress‟?”
6371
31
110
20
40
60
80
1985 1990 1995 2000 2005 2010
Agree Disagree
F

37
the loss of income, wealth or employment) tend
to have a more downbeat view of the national
economy than do those who‘ve escaped
relatively unscathed.
But some group differences play against type and
circumstance. For example, blacks and
Hispanics have a much more upbeat view of the
national economy than do whites—despite the
fact that most economic evidence shows that
these minority groups have felt the sting of the
recession more sharply than have whites.
Similarly, young adults are more upbeat than
middle-aged and older adults about the
economy, even though they have suffered more
job losses than any other age group. And on
some measures, those with only a high school
diploma are more optimistic about the economy
than those who have a college degree—though,
here again, the former group is the one that has
been hit harder by the downturn.
The survey also finds a significant variance by
partisanship in the public‘s views about the
economy. Democrats are more upbeat than
Republicans, even though they tend to have less
income and wealth.
The remainder of this section explores in
greater detail the group differences on all these questions.
That Recession: Is It Over Yet?
While just over half (54%) of the full population of adults say that the economy is still in a recession, notable
differences exist by race, age and, especially, partisanship.
Some 57% of whites say the economy is still in a recession, compared with just 45% of blacks and 43% of
Hispanics. In fact, among those latter two groups, about the same share say the economy is beginning to recover
from the recession (47% of blacks; 46% of Hispanics) as say the recession continues. Whites, by contrast, say by
a ratio of about three-to-two that the economy is still in a recession.
Young adults are the least likely age group to say the economy is still in a recession. Some 47% of 18- to 29-
year-olds say so, compared with 57% of those ages 30-64 and 51% of those 65 and older.
Most Americans Say the Recession Continues
% saying the U.S. economy is …
Note: “Don‟t know/Refused” responses are not shown.
54
57
45
43
47
57
57
51
63
43
55
73
54
42
41
38
47
46
46
38
39
40
33
51
40
24
43
51
3
2
5
5
5
2
2
4
3
3
2
2
2
4
All
White
Black
Hispanic
18-29
30-49
50-64
65+
Republican
Democrat
Independent
Big impact
Small impact
No impact
Still in recession Starting to recover Recession is over
Inpact of recession on career
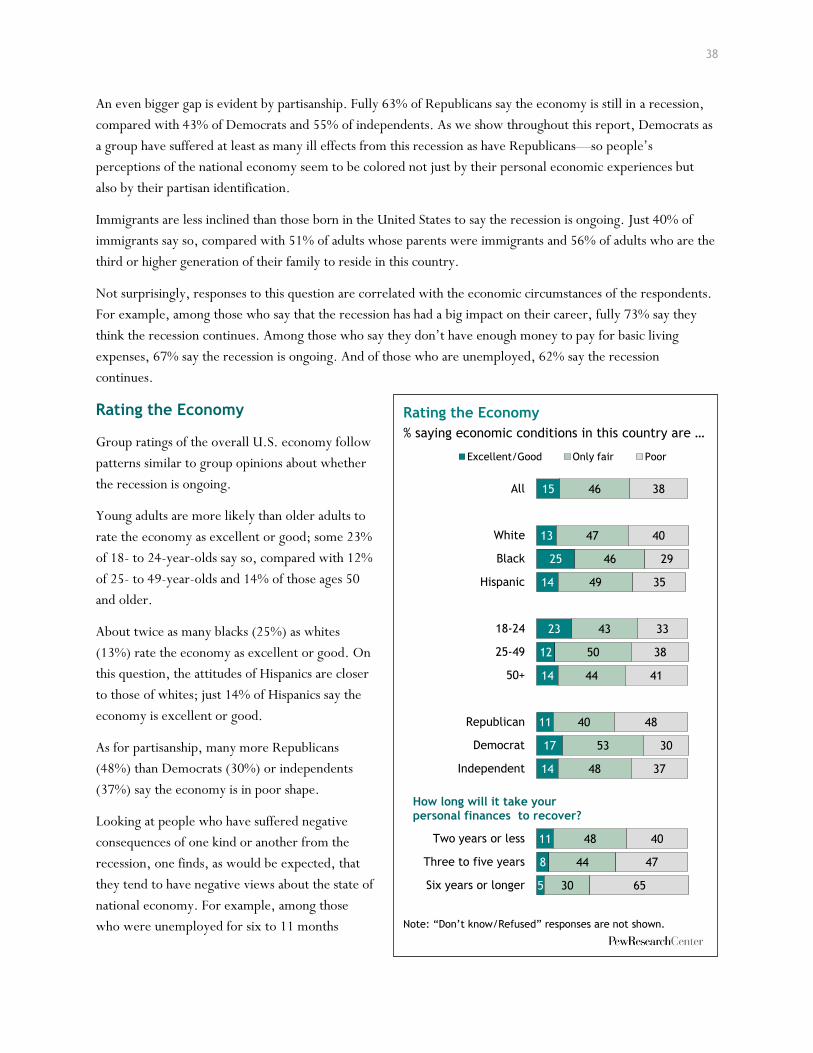
38
An even bigger gap is evident by partisanship. Fully 63% of Republicans say the economy is still in a recession,
compared with 43% of Democrats and 55% of independents. As we show throughout this report, Democrats as
a group have suffered at least as many ill effects from this recession as have Republicans—so people‘s
perceptions of the national economy seem to be colored not just by their personal economic experiences but
also by their partisan identification.
Immigrants are less inclined than those born in the United States to say the recession is ongoing. Just 40% of
immigrants say so, compared with 51% of adults whose parents were immigrants and 56% of adults who are the
third or higher generation of their family to reside in this country.
Not surprisingly, responses to this question are correlated with the economic circumstances of the respondents.
For example, among those who say that the recession has had a big impact on their career, fully 73% say they
think the recession continues. Among those who say they don‘t have enough money to pay for basic living
expenses, 67% say the recession is ongoing. And of those who are unemployed, 62% say the recession
continues.
Rating the Economy
Group ratings of the overall U.S. economy follow
patterns similar to group opinions about whether
the recession is ongoing.
Young adults are more likely than older adults to
rate the economy as excellent or good; some 23%
of 18- to 24-year-olds say so, compared with 12%
of 25- to 49-year-olds and 14% of those ages 50
and older.
About twice as many blacks (25%) as whites
(13%) rate the economy as excellent or good. On
this question, the attitudes of Hispanics are closer
to those of whites; just 14% of Hispanics say the
economy is excellent or good.
As for partisanship, many more Republicans
(48%) than Democrats (30%) or independents
(37%) say the economy is in poor shape.
Looking at people who have suffered negative
consequences of one kind or another from the
recession, one finds, as would be expected, that
they tend to have negative views about the state of
national economy. For example, among those
who were unemployed for six to 11 months
Rating the Economy
% saying economic conditions in this country are …
Note: “Don‟t know/Refused” responses are not shown.
15
13
25
14
23
12
14
11
17
14
11
8
5
46
47
46
49
43
50
44
40
53
48
48
44
30
38
40
29
35
33
38
41
48
30
37
40
47
65
All
White
Black
Hispanic
18-24
25-49
50+
Republican
Democrat
Independent
Two years or less
Three to five years
Six years or longer
Excellent/Good Only fair Poor
How long will it take your personal finances to recover?

39
during the recession but are currently
employed, 53% say the economy is in poor
shape. Of those who say the recession has had a
big impact on their career, 56% rate the
economy as poor. And of those who say it will
take their finances six years or more to recover
from the effects of the recession, 65% rate the
economy as poor.
The Recession: How Big an Impact?
How Lasting?
The plurality view of the public is that the
recession has caused major changes in the U.S.
economy but that these changes will prove to
be temporary. Some 45% of all adults hold this
view. An additional 18% say they believe the
changes will be both major and permanent.
Meantime, 16% believe they will be minor and
temporary, 6% say there have been no changes
and 4% say the changes will be minor but
permanent.
Group differences on the question are most
readily seen by looking at the characteristics of
those who take the most negative view—that
is, the 18% who believe that the changes to the
U.S. economy wrought by the recession have
already been major and will prove to be
permanent.
Here again, whites have a more pessimistic
view than do minorities. Some 19% of whites
believe the changes will prove to be both
major and permanent, compared with just 12%
of both blacks and Hispanics. The familiar
partisan pattern also plays out, with
Republicans (22%) more pessimistic than
Democrats (12%) or independents (18%).
Given that minorities tend to self-identify much
more as Democrats than as Republicans, these
racial and partisan group differences appear to
Which Groups See Major, Permanent Changes in the U.S. Economy?
%
18
19
12
12
13
16
21
22
20
14
22
12
18
All
White
Black
Hispanic
18-24
25-49
50+
College grad or more
Some college
High school or less
Republican
Democrat
Independent
How Has the Recession Changed the U.S. Economy—and for How Long?
% saying
Major change 70
Permanent 18
Temporary 45
Some permanent, others temporary(VOL.) 4
Minor change 21
Permanent 4
Temporary 16
Some permanent, others temporary(VOL.) *
Hasn‟t changed the ecnomy 6
Note: “Don‟t know/Refused” responses are not shown. * indicting percentage less than 0.5.

40
be mutually re-enforcing.
Those with college degrees or more are more
pessimistic than those who received a high school
diploma or less education (22% vs. 14%). This
difference holds up even after we control for
party identification.
All of the group differences described above are
somewhat counterintuitive, given that those in
the more pessimistic camp have generally been at
least as well insulated—and in many cases, better
insulated—against the personal effects of the
recession than have those in the less pessimistic
camp.
However, the survey questionnaire was broad-
ranging enough to allow us to analyze response
patterns not only by these familiar demographic
and political groupings, but also by the various
kinds of personal financial setbacks that different
respondents say they have experienced during
this recession. Looking at the data this way, one
finds a more predictable pattern: Those who have
taken the hardest personal hits are the most likely
to believe that the damage to the national
economy will be long-lasting.
For example, among those who expect it will
take six years or more for their personal finances
to recover from the effects of the recession, 45%
say the impact of the recession on the U.S.
economy will prove to be both major and
permanent. But among those who say they expect their personal finances to recover from the recession within
two years, just 13% say they believe the recession‘s impact on the national economy will be both major and
permanent.
Most Say America Is Still the Land of Prosperity
Prior to asking survey respondents specifically about the recession or the current state of the economy, the
questionnaire posed a more thematic question: ―Do you agree or disagree: ‗Although there may be bad times
every now and then, America will always continue to be prosperous and make economic progress‘?‖
Is America Still a Land of Prosperity?
% who agree
Question wording: “Do you agree or disagree: „Although there may be bad times every now and then, America will always continue to be prosperous and make economic progress‟?”
63
59
81
75
70
66
59
56
57
75
60
63
70
52
75
56
40
All
White
Black
Hispanic
18-29
30-49
50-64
65+
Republican
Democrat
Independent
Upper class
Middle class
Lower class
Two years or less
Three to five years
Six years or longer
How long will it take personal finance to recover?
Self-defined class

41
The overall response—63% agree with the statement while just 31% disagree—is notable in that it reflects a
level of optimism roughly on par with the way respondents answered this same question when it was last asked
in much better economic times in the early and mid-1990s.
It seems likely that the wording of this particular question taps into deeply felt views about the promise of
America in a way that more straightforward questions about the current state of the economy do not.
In any event, the same group differences evident on other questions examined in this section occur here as well.
A higher share of blacks (81%) and Hispanics (75%) agree with the statement than do whites (59%). More
adults ages 18-29 agree with the statement than do adults ages 65 and over (70% vs. 56%). More Democrats
(75%) agree with the statement than do Republicans (57%) or independents (60%). More of those with a high
school diploma or less education agree with the statement than do those with a college degree or more (66% vs.
59%).
There is also an unusual class-based pattern in the responses to this question. Among those who identify
themselves as middle class (nearly half of all respondents), fully 70% agree with the statement that America is
still the land of prosperity and economic progress. Among the one-in-five respondents who describe themselves
as upper class or upper-middle class, just 63% agree with the statement. And among nearly three-in-ten
respondents who self-identify as lower class or lower-middle class, just 52% say they agree with the statement.
In short, belief in the long-term prosperity of the United States is greatest among those who consider themselves
to be in the middle class, then declines in both the upper and lower tiers of self-described socioeconomic class.
This is a counterintuitive finding, but not the only of its kind to emerge from this Pew Research survey. As the
ensuing chapters will show in more detail, attitudes about personal setbacks suffered during the recession as well
as about the overall state of the economy—now and in the future—do not always correlate with someone‘s
income level or self-defined social class.

42

43
Chapter 4: Household Finances, Social Class, Future Generations
Underlying the overall impact the recession has had on the
nation‘s economy is the profound effect it has had on households
across the country. Nearly half of all Americans (48%) say their
household‘s current financial situation is worse now than it was
before the recession started. Three-in-ten (29%) volunteer that
their household financial situation hasn‘t changed, and 21% say
their financial situation is actually better now than before the
recession.
Pluralities of nearly all major demographic groups say their
household finances have taken a hit over the past 30 months.
Among men and women; blacks, whites and Hispanics; young and
old; and college-educated and those who never attended college,
solid pluralities say their household finances are in worse shape
now than they were before the recession started.
That said, some segments of the population
have been hit much harder than others. The
age group that seems to have suffered the most
in this regard is those ages 50-64—many of
whom are still working but nearing retirement
age. A majority (57%) in this age group say
they are in worse shape financially than they
were before the recession. As many as one-in-
five (21%) say they are in much worse shape.
Among those ages 65 and older, only about
half as many (12%) say they are much worse
off. These older Americans are among the
most likely to say their financial situation has
not changed during the recession (45% among
those ages 65 and older). Roughly the same
proportion of those under age 50 (46%) say
things have gotten worse for them.
Lower-income Americans have also been
particularly hard-hit by the recession. Among
those with annual family incomes of less than
$30,000, more than half (55%) say they are in
worse shape financially now than they were
before the recession began, including nearly a
The Recession’s Personal Toll
Household financial situation now vs. before the recession
Note: “Don‟t know/Refused” responses are included but not labeled.
21%
48%
29%
Better shapeWorse shape
No difference(VOL.)
The Differential Impact of the Recession Household financial situation now compared with before the recession (%)
Note: Income levels represent annual family income. “Unemployed” includes those who are not employed, would like to have a job, are available to work and are looking for work. “No difference” and “Don‟t know/Refused” responses not shown.
21
33
23
15
11
27
20
20
25
9
48
43
49
57
42
42
50
55
46
76
All
18-29
30-49
50-64
65+
$75,000+
$30,000-$74,999
<$30,000
Employed
Unemployed
Better shape Worse shape

44
quarter (23%) who say they are in much worse shape. By contrast, 42% of those with annual family incomes of
$75,000 or higher say they are in worse shape now.
Not surprisingly, those who are currently unemployed are more likely than those who are working to say their
household finances have deteriorated over the course of the recession.35 Among the unemployed, three-quarters
(76%) say they are in worse financial shape now than they were before the recession began, with 40% saying
they are in much worse shape. Only 9% say they are in better shape. Among those who have a job, 46% say they
are worse shape now, while 25% say their financial situation is better than it was before the recession started.
Very few households have seen an increase in their overall income in recent years. Only 14% say their family
income has increased from what it was before the recession. A third (34%) say their household income has gone
down, and 49% say it has stayed about the same.
In spite of the widespread pain wrought by the recession, one-in-five Americans (21%) report that their financial
situation has actually improved during the recession. Among certain groups, an even higher proportion say their
household finances are better now than before the recession started. Nearly a third of African Americans (32%)
say they are now in better shape. This is significantly higher than the percentage of whites (18%) or Hispanics
(23%) who say the same. This more positive outlook extends to blacks‘ views about the state of the national
economy as well as their outlook for their own financial future.36
As a group, young adults (ages 18-29) have experienced high levels of unemployment during this recession.
However, in terms of their personal finances, they are more likely than other age groups to say they are better
off now than they were before the recession. A third say they are better off, compared with 23% of those ages
30-49 and only 13% of those ages 50 and older.
In addition, those with family incomes of $75,000 or higher are more likely than those with lower incomes to
report that they are in better financial shape now than they were before the recession started (27% vs. 20%
among those whose family incomes are less than $75,000).
35 Throughout this section, ―unemployed‖ refers to those respondents who are not employed, would like to have a job, are available to work and are looking for work. 36 Earlier research suggested that the election of Barack Obama as the nation‘s first black president may have contributed to increased optimism
among blacks on a whole host of issues. See Pew Research Center, ―Blacks Upbeat about Black Progress, Prospects – A Year After Obama‘s
Election.‖ Jan. 12, 2010. http://pewsocialtrends.org/pubs/749/blacks-upbeat-about-black-progress-obama-election

45
A Downward Tick in Social Class
One way to evaluate the impact of the recession on the
public is to look at it through the prism of social class.
There are no clear guidelines defining the social classes,
but Americans have very little trouble placing
themselves in a distinct category. Half of the public say
they are middle class. One-in-five consider themselves
upper class (either upper or upper-middle). And 29%
say they are in the lower class (lower-middle or lower).
The percentage of Americans who place themselves in
the lower class has increased by four points since the
recession began. In January 2008, 25% of the public
considered themselves lower class. The share placing
themselves in the middle class has fallen slightly from
53% in early 2008, while the share saying they are upper
class is largely unchanged.
The demographic profile of the three social classes has remained relatively stable over the past two years.
College graduates and those with annual family incomes of $100,000 or more are among the most likely to
consider themselves upper class. Roughly three-in-ten college graduates (32%) say they are in the upper class.
Among those with annual incomes in excess of
$100,000, nearly six-in-ten (58%) consider
themselves upper class. New immigrants are
less likely than second- or third-generation
Americans to place themselves in the upper
class. And married people are more likely than
those who are unmarried to identify with the
upper class.
There have, however, been some notable
changes in the demographic makeup of the
social classes over the past two years. The
percentage of blacks who identify themselves as
members of the upper class has increased
marginally since 2008, from 15% to 20%, while
the percentage of Hispanics who identify
themselves as lower class has moved up slightly,
from 30% to 35%. There are now no significant
gaps between black and white Americans in
terms of how they identify their social class.
Race, Ethnicity and Social Class
% saying they belong in each class
Note: Hispanics are of any race. Whites and blacks include only non-Hispanics.
21
51
27
20
46
33
12
52
35
Upper class
Middle class
Lower class
White Black Hispanic
The Growing Lower Class? % of Americans identifying themselves as …
2008 2010
Upper class (NET) 21 20
Upper 2 2
Upper-middle 19 18
Middle class 53 50
Lower class (NET) 25 29
Lower-middle 19 21
Lower 6 8
Don‟t know/Refused 1 1
Number of respondents 2,413 2,967

46
Changes have also occurred along
educational lines. Those who
have attended college but not
graduated appear to have slipped
further into the lower class in
recent years. In 2008, 58% of
this group said they were middle
class and only 24% identified
themselves as lower class. Today,
just half of this group (49%) say
they are middle class, while 31%
place themselves in the lower
class.
Perceptions about social class are
strongly linked to personal impacts of the recession. Nearly as many upper-class Americans say the recession has
had a positive impact on their household finances (33%) as say it has had a negative impact (36%). For 30% of
upper-class Americans, the recession has had little or no impact on their financial situation. Among members of
the middle class, a plurality (45%) say they are worse off now than they were before the recession. One-in-five
(21%) are better off, and 33% say there‘s been no real change. For lower-class Americans, the impact has been
largely negative: 64% say they are in worse shape now than they were before the recession, only 13% say they
are in better shape and 22% say things are
largely unchanged.
Despite some movement around the margins,
Americans feel pretty well rooted in their
current social classes. Overall, 70% of the
public say they are firmly in their social class,
12% say they feel they are falling out of their
social class and 16% say they feel they are
moving up from their social class. Strong
majorities from the upper (73%), middle (71%)
and lower classes (61%) agree they are pretty
firmly in their current class. Lower-class
Americans are more likely than those in the
middle and upper classes to say they are moving
up—21% feel they are on their way up and out
of the lower class.
At least a couple of groups—each hard-hit by the recession—feel particularly vulnerable in this regard.
Unemployed workers are among the most likely to say they are falling out of their social class (24%). Only 55%
Social Class and the Recession’s Impact
Household financial situation now compared with before the recession(%)
Note: “Don‟t know/Refused” responses not shown.
33
21
13
36
45
64
30
33
22
Upper class
Middle class
Lower class
Better shape Worse shape No change
F
Unemployment’s Impact on Social Class
% saying they are falling out, firmly in or moving up from current social class
10
68
18
24
55
19
Falling out
Firmly in
Moving up
Employed Unemployed

47
think they are pretty firmly rooted in their social class. Employed people are much less likely to feel they are
losing ground. Just one-in-ten say they are falling out of their social class. In addition, among those ages 50-64,
17% say they feel they are falling out of their social class. This compares with 10% among those under age 50
and 12% among those ages 65 and older.
Making Ends Meet
Not only has the recession changed the
way some Americans perceive their
place in society, but it also has made it
harder for many to afford life‘s
necessities. The number of Americans
struggling to pay their basic living
expenses has increased significantly over
the course of the recession. Today, 27%
say they have just enough money to meet
their basic expenses (with nothing left
over for extras), and an additional 11%
say they don‘t even have enough to meet
their expenses. In January 2008, at the
beginning of the recession, 22% said
they had just enough to meet basic
expenses and 7% said they could not
meet their expenses. Fewer Americans
now say they live comfortably (30%,
down from 38% in 2008). The same
percentage (30%) say they have enough money to meet basic expenses with a little left over for extras.
Whites are more likely than blacks or Hispanics to say they live comfortably (33% of whites vs. 24% of blacks
and 18% of Hispanics). Among blacks and Hispanics, nearly one-in-five say they don‘t even have enough money
to meet their basic expenses (18% of blacks and 17% of Hispanics). Income and education are strongly linked to
financial well-being. More than half (53%) of those with annual family incomes of $75,000 or higher say they
live comfortably, as do 45% of college graduates. By contrast, only 13% of those with incomes under $30,000
say they live comfortably, while 23% don‘t have enough to meet their basic expenses. In another example of
how employment status affects household finances, only 11% of unemployed workers say they live comfortably.
Three-in-ten say they don‘t have enough money meet their basic expenses.
Household Finances: Fewer Living Comfortably, More Struggling to Pay the Bills
% saying they…
Note: “Don‟t know/Refused” responses not shown.
38
32
22
7
30
30
27
11
Live comfortably
Meet basic expenses with a little left over
Just meet basic expenses
Can't even meet basic expenses
2008 2010

48
Things Are Looking Up, but
Recovery Will Take Time
Looking forward, most Americans think
their financial situation will improve over
the next year. However, for those who are
worse off now than they were before the
recession, it may take years to fully
recover. Overall, 62% of the public expect
their financial situation will improve over
the course of the next year (10% say it will
improve a lot, 52% say it will improve
some). Roughly one-in-five (19%) say their
financial situation will get worse (14% a
little worse, 5% a lot worse). And 16%
volunteer that things will stay the same for
them and their families.
Americans are feeling more optimistic now
than they were early in 2009, when the stock
market was plummeting and unemployment
was continuing to rise. In February 2009, 54%
of the public said their financial situation
would improve over the next year; 29%
thought things would get worse, and 13% said
they would stay about the same. Attitudes
today are almost identical to where they were
in September 2007, before the recession
officially started. At that time, 62% of the
public said their financial situation would
improve over the next year, 18% said it would
get worse and 16% said it would stay the
same.
This general sense of optimism that things will
improve over the next year is shared by most
major demographic groups. Regardless of
income or level of education, strong majorities
say that their financial situation will improve
in the next year. Even among those with
annual incomes of less than $20,000, 64%
Next Year’s Outlook
% saying, over the next year, their financial situation will…
0
10
20
30
40
50
60
70
Improve
Get worse
62
18
62
19
Sep 07 Feb 09 May 10
54
29
Some Groups More Optimistic than Others % saying, over the next year, their financial situation will…
Note: Hispanics are of any race. Whites and blacks include only non-Hispanics. “Stay the same” and “Don‟t know/Refused” responses not shown.
19
22
9
10
8
14
27
29
27
10
20
62
57
81
74
85
69
52
35
55
70
62
All
White
Black
Hispanic
18-29
30-49
50-64
65+
Republican
Democrat
Independent
Get worse Improve

49
expect things to get better.
There are some important differences, however. Blacks and
Hispanics are more likely than whites to say their financial
situation will improve over the next year (81% of blacks and
74% of Hispanics vs. 57% of whites). Young adults are more
optimistic than their older counterparts: 85% of adults under
age 30 say their financial situation will improve over the next
year. This compares with 69% of those ages 30-49 and 45% of
those ages 50 and older.
Democrats are more optimistic than Republicans or
independents about their financial prospects for the next year.
Seven-in-ten Democrats expect their financial situation to
improve, compared with 55% of Republicans and 62% of
independents.
While unemployed workers have been among the hardest hit by
the recession, they are relatively positive about their financial
future. More than seven-in-ten (72%) say their financial situation will improve over the next year. This
compares with 68% of those who are employed. It may be the case that many unemployed workers, given their
current circumstances, believe things can only get better. One-in-five unemployed workers (19%) say their
situation will get worse. This is on par with the general public.
In spite of this overall optimism, for many of those who lost out during the recession it may be a long climb
back. Survey respondents who said they were in worse shape now than they had been before the recession
started (48% of the public) were asked how long they thought it would take them to recover financially. Very
few (5%) thought they would recover their losses in less than a year. Roughly a quarter (27%) said it would take
them one to two years to recover. Four-in-ten said it would take three to five years, and 23% said it would take
them six years or longer.
Compared with blacks, whites who have been hurt by the recession see a longer time horizon in terms of
recovering what they‘ve lost. A majority of blacks (55%) who say they are in worse shape now than they were
before the recession think they will be able to recover financially in less than two years. This compares with 29%
of whites. A plurality of whites (43%) say it will take three to five years for them to recover, while 21% say it
will take longer.
Young people who have been hurt by the recession anticipate a fairly speedy recovery. Nearly half (47%) say
they will have regained what they lost in less than two years. By contrast, only 24% of those ages 50 and older
who were hurt by the recession say they will recover in the next two years. In addition, college graduates who
were hurt by the recession are much more likely than those who never attended college to say it will take them
many years to recover from the effects of the recession. Three-in-ten college graduates say it will take six years
or longer to recover, compared with 18% of those who never attended college.
A Long Recovery Period How long will it take you/your family to recover from the recession?
Hurt by Recession*
%
Less than a year 5
One to two years 27
Three to five years 40
Six to 10 years 13
Longer than 10 years/never 10
Don‟t know/Refused/Depends 6
* Based on those who say their household financial situation is worse now than it was before the recession. Note: Numbers do not total 100% due to rounding.

50
The Long-Term Impact of the Recession
Looking further into the future,
Americans have become more skeptical
about the quality of life for the next
generation. Respondents were asked
whether they thought their children‘s
standard of living would be better,
about the same or worse than their
own. On balance, more say they
expect their children will enjoy a
better standard of living. However, the
percentage saying this has fallen over
the past 10 years. In 2000, 59% of the
public said their children would have a
better standard of living than they
themselves had. By 2002, 61% held
this view. Today, 45% say their
children will have a better standard of
living than they do, while 26% think
their children‘s standard of living will
be worse than theirs. An additional 19% say their children‘s standard of living will be about the same as theirs.
The percentage saying their children‘s standard of living will be worse than theirs is the highest it has been since
the General Social Survey first asked this question in 1994.
Views about what sort of economy the next generation will inherit differ significantly by key demographic
variables. Young adults are much more optimistic about their children‘s future. Among those under age 30, 64%
say when their children are their age, they will enjoy a better standard of living. This compares with 47% of
those ages 30-49 and only 35% of those ages 50 and older.
There is a wide racial gap on this question, and again, blacks are much more upbeat than whites. Roughly seven-
in-ten blacks (69%) say their children will have a better standard of living than they themselves do. This
compares with 38% of whites. Hispanics are just as positive as blacks in this regard: 64% of Hispanics say their
children will enjoy a better standard of living than they themselves do.
What Will Life Be Like for the Next Generation?
When your children are at the age you are now …(%)
Note: 1994-2008 data are from the General Social Survey.
0
10
20
30
40
50
60
70
1994 1996 1998 2000 2002 2004 2006 2008 2010
Standard of living will be better
Standard of living will be worse
45
20
45
26
10
61

51
Income is also linked to views about the next
generation. Those with lower annual family
incomes are more optimistic about their
children‘s future prospects. Among those
making less than $30,000 a year, 53% say
their children will enjoy a better standard of
living than they do. This compares with 46%
of those making between $30,000 and
$75,000, and 40% of those making more than
$75,000 a year. Similarly, the least well-
educated are among the most optimistic.
Among those who never finished high school,
55% say their children will have a better
standard of living than they do. Among college
graduates, only 39% agree.
In keeping with their negative assessments
about their own financial situation,
Republicans are more pessimistic than
Democrats about their children‘s future
prospects. More than half of Democrats (55%)
say their children will have a better standard of
living than they do. Only 37% of Republicans
agree. More than a third of Republicans (35%)
say their children‘s standard of living will be
worse.
In spite of increasing doubts about their
children‘s futures, most Americans say that their own standard of living is better than that of their parents.
When asked to compare their current standard of living to their parents‘ at a comparable age, 57% say their
standard of living is better (31% say it‘s much better, 26% say it‘s somewhat better). Only 17% say their
standard of living is worse than their parents‘. And 23% say it‘s about the same.
Blacks and Hispanics are more likely than whites to see progress in this regard. Nearly two-thirds of blacks
(64%) and 71% of Hispanics say they enjoy a better standard of living than their parents did. This compares with
54% of whites. Higher-income Americans, who are more doubtful about their children‘s prospects, are among
the most likely to say their standard of living exceeds that of their parents. About two-thirds (68%) of those with
annual family incomes of $75,000 or higher say their standard of living is better than their parents‘. Among
middle-income Americans (those making between $30,000 and $75,000), 58% say they have a higher standard
of living than their parents had. And among those making less than $30,000 a year, only 50% agree.
Differing Views on the Future Children‟s future standard of living compared with yours (%)
Note: Income levels represent annual family income.
26
29
17
15
16
22
33
33
29
25
22
35
17
26
46
38
69
64
47
36
34
40
46
53
37
55
44
All
White
Black
Hispanic
18-29
30-49
50-64
65+
$75,000+
$30,000-74,999
<$30,000
Republican
Democrat
Independent
Worse Better
64

52
Changes in Day-to-Day Living
When asked how the recession has changed their everyday lives,
most Americans say it has either caused minor changes in the way
they live (44%) or it hasn‘t changed things at all (31%). One-in-
four say the recession has caused major changes in the way they
live. For most of those who have experienced change, the
changes are temporary rather than permanent. Among those who
have experienced major change, roughly twice as many say the
changes are temporary as say they are permanent. A similar
pattern is evident among those who have experienced minor
change. Among all Americans, a 31% plurality say they have
experienced minor, temporary changes as a result of the
recession. Fewer than one-in-ten (8%) say the recession has
caused permanent, major changes in the way they live.
Blacks and Hispanics are more likely than whites to say that the
recession has caused major changes in the way they live (30% of
both blacks and Hispanics vs. 23% of whites). Among those ages
50-64, three-in-ten say they have experienced major changes in
the way they live as a result of the recession. This compares with
25% of those under age 50. Older Americans (ages 65 and older)
are among the least likely to report major changes in the way they live. Among this age group, only 16% say the
recession has caused them major
changes. Nearly half (47%) say it
hasn‘t changed the way they live
at all.
Higher incomes have shielded
some Americans from the brunt
of the recession. Among those
with annual family incomes of
$75,000 or higher, 53% say the
recession has caused only minor
changes in the way they live.
Only 17% say it has caused major
changes in their lives. Among
middle-income Americans, 27%
say they‘ve experienced major
changes in the way they live. And
for those making less than
$30,000 a year, 31% say the
Income, Employment Protect Some from Recession’s Impact
% saying the recession has caused… in the way they live
Note: Income levels represent annual family income. “Don‟t know/Refused” responses not shown.
17
27
31
24
50
53
42
40
49
32
30
31
29
26
17
$75,000+
$30,000-$74,999
<$30,000
Employed
Unemployed
Major changes Minor changes No change
Recession’s Impact on Daily Life How has the recession changed the way you live? Are those changes permanent or temporary?
Percent (%)
Major changes 25
Permanent 8
Temporary 15
Some of each/DK 2
Minor changes 44
Permanent 12
Temporary 31
Some of each/DK 2
No change 31
Don‟t know 1
Note: Sum of category percentages may not equal net due to rounding. Overall numbers do not total 100% due to rounding.

53
recession has caused them major changes.
Unemployed workers are among the most likely to have experienced major changes in the way they live as a
result of the recession—50% say the recession has caused major changes, and of that group 28% say those
changes are permanent.
Recession’s Biggest Impact: Changes in Spending Habits
Those who have experienced changes in their lives caused
by the recession—whether major or minor—have felt it
most in their wallets. When asked in an open-ended
question to name the biggest change the recession has
caused in the way they live, a plurality (38%) point to
changes in spending. Some specific examples of this include
15% who say they have limited their spending, 7% who say
they have cut back on luxury items and 5% who say they
are eating out less often. Other changes that fall under the
broad category of spending include less travel, cutting back
on gas and utilities, and postponing major expenditures.
In addition to altering their spending habits, respondents
pointed to financial stress and changes in employment
when asked to name the main way in which the recession
had affected them personally. Among those who say their
lives have changed as a result of the recession, 19% say
their personal finances have been hit the hardest. Among
the specific financial challenges mentioned by respondents,
4% say they have had trouble paying their bills, 4% say
their income has gone down and 2% say they have no
discretionary funds.
Employment changes were mentioned by 18% of
respondents. Among those who say they‘ve experienced
change during the recession, 6% say they or their spouse
have lost their job, 4% say they have had trouble finding a
job, 4% point to a loss of job security and 2% say their
salary or hours have been reduced.
The types of changes people have experienced differ widely depending on income and other factors. Those with
annual family incomes of $75,000 or higher have mainly experienced changes in spending habits. More than half
(53%) volunteer something having to do with spending when asked to name the biggest impact the recession has
had on their life. Relatively few (12%) in this income category cite employment changes. For middle-income
Americans, the impact has been more varied. Among those with annual incomes between $30,000 and
$75,000, 38% say the biggest changes in their lives have revolved around spending habits, 23% cite personal
How the Recession Has Changed Lives
What is the biggest change the recession has made in the way you live?
Percent (%)*
Spending habits (NET) 38
Limited spending/budgeting 15 Cut back on luxury items 7 Less eating out 5 Less travel 3 Cut back on everything 3 Personal finance (NET) 19 Finances (general) 5 Trouble paying bills 4 Loss of income 4 Saving more 2 No spending money 2 Employment changes (NET) 18 Lost job/Spouse lost job 6 Can‟t find a job 4 Loss of job security 4 Salary/hours reduced 2 Business has slowed down 2 Higher cost of living 6 Fear, anxiety, worry 3 Changes in living arrangements 2
* Based on those who said the recession had caused major or minor changes in their life, n=2,134. Note: Top five responses from each NET category shown. “Other” and “Don‟t know/Refused” responses not shown.

54
finances and 17% say changes in employment. Lower-income Americans are much more likely than middle- or
upper-income groups to point to changes in employment (26%) Roughly the same proportion (28%) cite
changes in spending, and 19% name some aspect of their personal finances.
The specific impacts of the recession also differ by ethnicity. Whites are more likely than Hispanics to say the
biggest changes have been in spending habits—41% of whites name something related to spending when asked
to identify the biggest change in their life, compared with 32% of Hispanics. Hispanics are among the most likely
to point to changes in employment (27% vs. 16% of whites). Young people have also disproportionately felt the
effects of the recession in the employment arena. Among those under age 30, 26% name an employment-related
issue when asked about the biggest change the recession has made in their lives. And as many as one-in-ten in
this age group (9%) specifically say they have not been able to find a job in the current market.
Less Spending, More Financial Stress
The recession seems to have ushered in a new culture of frugality. The survey tested a series of potential
consequences of the recession and found that the two most common experiences involved cutting back on
spending. Seven-in-ten Americans (71%) say that since the recession began, they have bought less expensive
brands or shopped more at
discount stores. Another
area where the public has
cut back during the
recession is travel—57%
say they have scaled back or
canceled vacation plans.
Roughly half of Americans
(49%) say they have loaned
money to someone to help
with bills or expenses.
Three-in-ten say they have
cut spending on alcohol or
cigarettes. Nearly as many
(27%) have had trouble
getting or paying for
medical care for themselves
or their families.
A quarter of the public (24%) have borrowed money from a family member or friend to help pay the bills, and
20% say they had trouble paying their rent or mortgage. In addition to borrowing, some people have had to pay
their bills on credit—15% say they had to increase their credit card debt to help pay the bills. Beyond the
financial implications, for some Americans the recession has had an impact on their lifestyle. Roughly one-in-ten
(11%) say they have postponed getting married or having a baby. A nearly equal proportion (9%) moved back in
with their parents after living on their own. Two percent say they have lost their home to foreclosure.
How the Public Has Experienced the Recession
% saying this happened to them during the recession …
71
57
49
30
27
24
20
15
11
9
2
Bought less expensive brands
Cut back/canceled vacation
Loaned money to someone
Spent less on alcohol/cigarettes
Had trouble paying medical bills
Borrowed money from friends/family
Had problems paying rent/mortgage
Increased credit card debt to pay bills
Postponed marrying/having baby
Moved back in with parents
Lost home to foreclosure

55
These experiences differ widely by race,
ethnicity, age and income. Blacks are more
likely than whites or Hispanics to report
loaning money to help someone with their
expenses during the recession (59% of
blacks vs. 48% of whites and 40% of
Hispanics). Blacks and Hispanics are more
likely than whites to have had trouble
getting or paying for medical care,
borrowed money from a family member or
friend, or had problems paying their rent
or mortgage. Hispanics are much more
likely than whites or blacks to say they
increased their credit card debt to pay their
bills (31% of Hispanics vs. 12% of whites
and 19% of blacks).
Looking across age groups, older adults
(ages 65 and older) have been largely
sheltered from many of these experiences. They are much less likely than younger age groups to have cut back
on spending, loaned or borrowed money, had trouble paying for medical bills or housing, or had to increase
their credit card debt. Young adults stand out in a couple of specific areas. Among those under age 30, 42% say
they borrowed money from a family member or friend to help pay the bills. This compares with 28% of those
ages 30-49 and only 12% of those ages 50 and older. In addition, 24% of those under age 30 moved back in with
their parents after living on their own.
In much the same way that older adults were shielded from the effects of the recession, upper-income
Americans have been protected from many of the effects felt by those in the middle- and lower-income
categories. Those with annual family incomes of $75,000 or higher experienced every potential problem at a
much lower rate than those with less income. The largest gaps are on paying for medical care and borrowing
money to help pay the bills. Only 10% of those making $75,000 or more a year say they have had trouble
getting or paying for medical care during the recession. This compares with 28% of those making between
$30,000 and $75,000 a year and 44% of those making less than $30,000. Similarly, while 8% of upper-income
Americans say they had to borrow money from a friend or family member to make ends meet, nearly a quarter
(23%) of those making $30,000 to $75,000 and 42% of lower-income Americans were forced to do that.
Unemployed workers have felt the sting of the recession more profoundly than others. In comparing their
experiences with those of employed workers, it is obvious that unemployment affects many areas of their lives.
An overwhelming majority (83%) say they have bought less expensive brands and shopped more at discount
stores during the recession. Three-quarters of unemployed workers say they have cut back on or canceled
vacation travel.
Older Americans Avoid Some Effects of Recession
% saying this happened to them during the recession
73
61
30
28
23
63
42
15
5
7
Bought less expensive brands
Cut back/ canceled vacation
Had trouble paying medical bills
Borrowed money from friends/ family
Had problems paying rent/ mortgage
Under age 65 Age 65+

56
The unemployed are twice as likely as those
with jobs to say they‘ve had trouble paying for
medical care for themselves or their families.
And they are twice as likely to have borrowed
money from a family member or friend to pay
their bills. Nearly half (44%) have had
problems paying their rent or mortgage,
compared with 19% of those who are
working. And 26% have had to increase their
credit card debt to help pay bills, compared
with 15% of employed workers.
Postponing Retirement
For many workers in their 50s and early 60s,
retirement may not come as soon as they had
planned. Among those ages 50-61 who are
currently employed, 60% say they may have
to delay retirement because of the recession.
Roughly a third (34%) say they will not have to delay retirement, and 5% aren‘t sure. A similar question asked
in July 2009 yielded comparable results—63% of workers in this age group said they had delayed retirement
because of economic conditions, and 31% said they had not.
College graduates are less likely than those
without a college degree to say they may have
to delay retirement because of the recession.
Among those ages 50-61 who are employed,
50% of college graduates say their retirement
may be delayed. This compares with 60% of
those who attended some college and 69% of
those who never attended college.
Middle-income workers in this age group are
somewhat more likely than upper-income
workers to say they may have to wait to retire.
Among those with annual incomes between
$30,000 and $75,000, 69% say they might have to delay their retirement. Among those with incomes of
$75,000 or higher, 56% say the same.
Of those ages 62 and older, 13% are not retired. About a third of this group (35%) say they have delayed
retirement because of the recession; 61% say they have not. The percentage saying they had delayed retirement
has changed relatively little over the past year. In July 2009, 38% of workers in this age group said they had
delayed retirement because of the economic conditions.
The Recession and Retirement
% saying, because of the recession they…
Note: Based on non-retirees ages 50-61.
60
34
5
Might have to delay retirement
Won't have to delay retirement
Don't know (VOL.)
Unemployed Struggle to Pay Bills
% saying this happened to them during the recession
53
50
44
26
26
24
19
15
Had trouble paying medical bills
Borrowed money from friends/ family
Had problems paying rent/ mortgage
Increased credit card debt to pay bills
Unemployed Employed

57
Chapter 5: Work and Unemployment
From shop floor to office cubicle to
executive suite, American workers have
been hard-hit by the Great Recession.
About a third of all adults in the labor
force are currently unemployed or have
been out of work sometime since the
official start of the economic downturn in
December 2007, according to a new Pew
Research Center survey and government
employment data.
At the same time, more than four-in-ten
currently employed adults say their
employer cut their pay, reduced their
work hours, forced them to take unpaid
leave or downsized their job during the
recession. Add to the total those part-
time workers who have tried but failed to
find full-time employment in an anemic
job market, and the results suggest that
more than half of all adults in the labor
force (55%) have faced hardship on the
job during the nation‘s longest and
deepest economic downturn since the
1930s.
The government‘s official unemployment rate, which stood at 9.7 percent in May, tells only part of the story.
When asked in the survey, one-in-four currently employed adults (26%) say they were out of work sometime
since the recession began. Taken together, these unemployment figures suggest that as much as 32% of the labor
force is currently jobless or has been unemployed sometime during the recession.
While news about layoffs and lost jobs has dominated the economic headlines, employed Americans also have
been battered by hard times. More than four-in-ten (42%) of all currently employed workers have been forced
to take unpaid leave, saw their full-time jobs shrink to part time or had their pay cut or hours reduced. While
working Americans across the demographic spectrum have been affected, minorities and adults with only a high
school diploma or less education have been particularly exposed.
In a job market that is only now beginning to show faint signs of recovery, about half of all part-time workers
want a full-time job. For a majority of these workers, the bad economy has stood between them and a full-time
employment, the survey found. Nearly four-in-ten part-time workers (37%) say they have looked but cannot
find full-time employment. An additional 23% say that they had a full-time job but that it was downsized. The
The Recession at Work % of each group who experienced each of the following since the recession began
*The underemployed are part-time workers who say they want a full-
time job but do not have one because they cannot find full-time employment or because of other economic reasons.
28
23
12
11
6
55
Work hours reduced
Pay cut
Had to take unpaid leave
Forced to switch to part-time
Unemployed now or sometime during recession
Underemployed*
Among total labor force (n=2,256)
Among currently employed (n=1,604)
Total experiencing any work-related problem
32

58
remainder say that they would like to work full time but that
family duties or other noneconomic reasons keep them from
taking a 9-to-5 job.
A different analysis suggests the breadth of the recession.
When findings on current and past unemployment, hardship
on the job and underemployment are analyzed together, the
result suggests that fully half (55%) of the labor force has
faced unemployment, cutbacks on the job or
underemployment at some point during the recession.
Even this estimate likely understates the full impact of the
economic downturn. For example, the survey found that
only 38% of all workers report they received a pay raise at
their current job since the recession began 2½ years ago.
While comparison data over a comparable time period is not
available, the evidence strongly suggests that significantly
fewer workers have gotten raises during the recession than
when the economy was healthy.37
As layoffs and hiring freezes take their toll on employment
rolls, the workers who remain on the job also report they
have had to work longer and harder. According to the survey,
fully a third of all currently employed workers (33%) say
their employer has made them work longer hours or more overtime since the recession began.38
But the news from the workplace isn‘t all bad. Even in the face of a bad economy, about two-in-ten workers
(20%) say they were promoted or got a better job sometime during the recession, including a third of all
employed young adults.
The sections that follow examine in detail how American workers have fared during the Great Recession. The
first section looks at the experiences of currently employed workers and the recession-related problems they
have faced on the job. The second section looks at the ―re-employed‖ and how spells of unemployment shape
attitudes toward work among those who lost and found jobs during the Great Recession. The third section
examines the problems of underemployed workers.
37 For example, a USA Today/Gallup poll in 2005 found that 63% of all employed adults reported they had gotten a pay raise in the previous 12 months. 38 When those who report having to work longer hours or more overtime are factored into the analysis, a total of 58% of all workers experienced
some job-related cutback during the recession and 67% of the labor force had faced a hardship on the job or a spell of unemployment or are underemployed for economic reasons.
The Recession and the Workforce % of workers in each group who said they were forced to … Work Take Switch from fewer unpaid full-time to hours leave to part-time % % % Total 28 12 11 Gender Men 30 12 12 Women 25 12 9 Age 18-29 32 11 15 30-49 26 13 10 50+ 27 12 9 Race/Ethnicity White 22 10 9 Black 42 19 17 Hispanic 40 16 14 Education College grad 14 9 5 Some college 29 14 11 HS grad or less 39 13 15 Note: Asked of adults currently employed full time or part time. Hispanics are of any race. Whites and blacks include only non-Hispanics.

59
The Recession on the Job
Even a job has not been enough to keep hard times at
bay. According to the survey, nearly three-in-ten (28%)
employed adults say their work hours have been
reduced. The pay of almost a quarter (23%) has been
cut, while smaller shares had to take unpaid leave (12%)
or were forced to switch from full-time to part-time
work (11%).
On most of the hardships tested, minorities, workers
with less education and younger adults are significantly
more likely than other workers to report they have
experienced recession-related problems on the job.
For example, blacks are more likely than whites to say
their work hours were cut (42% vs. 22%), they were
forced to take unpaid leave (19% vs. 10%) or their full-
time job was downsized to part time (17% vs. 9%).
Hispanics also were nearly twice as likely as whites to
report that their work hours were cut (40% vs. 22%).
The recession also has been hard on the youngest and
least experienced members of the labor force. Working
young adults ages 18 to 29 are significantly more likely
than other age groups to say their employer downsized
their job from one that was full time to one that is part
time (15% vs. 9% for workers ages 50 or older).
Without exception, less-educated workers have been the most vulnerable to the harmful effects of the recession,
while college-educated adults have fared considerably better. Those with a high school diploma or less education
are about three times as likely as college graduates to say they were moved from a full-time job to one that is
part time (15% vs. 5%). They also are more than twice as likely as college graduates to report their hours were
reduced (39% vs. 14%).
In particular, workers with less than a high school diploma have been especially vulnerable to problems on the
job. Among this group that comprises about one out of every ten employed adults, nearly half (48%) report that
their hours have been cut during the recession and 23% say their full-time job was downsized to part time.
Pay in a Time of Recession
Nearly one-in-four workers say they have taken a cut in pay since the recession began 30 months ago, including
22% of all full-time workers and 25% of those who are employed part time.
Payday Blues % in each group who said their employer has cut their pay during the recession
Notes: Asked of those currently employed full time or part time (n=1,604). Income levels represent annual family income.
23
24
21
19
22
26
22
23
24
19
20
24
30
All employed
Men
Women
18-29
30-49
50+
Whites
Blacks
Hispanics
$75K+
$50K-$74K
$30K-$49K
LT $30K

60
The demographic profile of workers whose pay was cut during the recession differs in striking ways from the
characteristics of those who experienced the four other job-related cutbacks tested in the survey.
For example, minorities are no more likely than whites to have their pay cut. According to the survey, about
equal shares of employed whites (22%), blacks (23%) and Hispanics (24%) report that their salary has been
reduced sometime during the recession, as do 24% of men and 21% of women.
Similarly, the general finding that younger workers suffered more harm than their older colleagues is reversed.
When it comes to pay cuts, the workers most likely to have taken a hit during the recession are middle-aged
adults ages 50 to 64. Overall, 27% of these workers—who should be at the peak of their careers and earnings
potential—saw their salaries reduced, compared with 19% of younger workers, 22% of workers ages 30 to 49
and 20% of those 65 or older.
At the same time, wage cuts fell heaviest on those who are the least likely to afford them: adults with family
incomes of $30,000 or less. The pay of three-in-ten among this group was cut sometime during the recession,
compared with 19% of workers with family incomes of $75,000 or more.
Taken together, the previous two findings show that among the groups most likely to experience pay cuts are
workers ages 50 to 64 with family incomes less than $30,000 a year. Among this group, nearly four-in-ten
(38%) have had their salary reduced by their employer during the recession, compared with 28% of workers
younger than 50.
But the economic news from America‘s workplaces isn‘t all bad. Despite hard times, 20% of all workers report
getting a promotion or finding a better job during the recession. In addition, 38% of workers say they got a raise
from their current employer, though 61% say they did not.
Younger workers are significantly more likely than older employees
to say they have received a raise (43% of 18- to 29-year-olds got
raises vs. 32% of those ages 50 and older) or to have gotten a better
job or promotion (33% vs. 8%).
Multiple Hardships on the Job
Some employed adults have faced more than one recession-related
problem on the job. According to the survey, about two-in-ten
workers encountered at least two of the four hardships tested (20%).
An additional 22% reported they experienced one, while 58%
experienced none.
When analyzed together, patterns seen in the individual question
snap into sharper focus. Blacks are significantly more likely than
whites to have experienced two or more problems (28% vs. 17%).
At the same time, a large majority of working whites (63%) say that
they did not face any of the four hardships, compared with 46% of
Multiple Job Impacts % of working adults who have experienced this number of job-related hardships during the recession
Problems tested: Work hours reduced; pay cut; forced to take unpaid leave; and forced to switch from full-time to part-time work.
Two or
moreNone
20%58%
22%
One

61
employed blacks and 49% of Hispanics.
Again, the value of a college degree as a buffer against bad times is clear:
Seven-in-ten college grads experienced none of the four hardships
compared with only about half (49%) of workers with a high school
diploma or less education. At the same time, the less-educated are nearly
twice as likely to have experienced two or more job-related problems
during the recession (25% vs. 13%).
Workers who could least afford it are the most likely to experience
recession-related hardships on the job, the survey found. Among those with
family incomes of less than $30,000 a clear majority (56%) experienced at
least one of the four problems tested, compared with 32% of those with
household incomes of $75,000 or more. In fact, a third (34%) of these
lower-income workers reported facing two or more hardships at work,
compared with 13% of those with household incomes of $50,000 or more.
At the same time, less than half (44%) reported facing no difficulty on the
job—a proportion that soars to 67% among higher-earning workers.
Working Longer
For some workers, the recession has meant longer hours on the job.
According to the survey, about a third of all currently employed adults say
they have had to work longer hours or more overtime shifts since the
recession started.
Significantly, the groups that reported encountering the most difficulties on
the job also are more likely to say they have had to work longer hours or
more overtime. Blacks in particular say they have been putting in more
time on the job: Nearly half (46%) say they have worked longer hours or
more overtime, compared with 38% of Hispanics and 30% of whites.
Younger workers also have been spending more time at work. Four-in-ten workers ages 18 to 29 say they have
been working longer, compared with 30% of workers 50 and older. So have workers with a high school diploma
or less education. Among this group, nearly four-in-ten (38%) are putting in longer hours or working more
overtime, compared with 31% of college graduates and 28% of those who attended college but did not
graduate.
Men also are somewhat more likely than women to say they have been working additional hours or more
overtime (36% vs. 30%).
Does more work mean more pay? This survey does not directly answer that question. Among all workers who
say they have had to work longer hours or more overtime, more than a third (37%) say they have gotten a raise
since the recession started 30 months ago, while 30% report their pay has been cut. However, the survey
Who Got Hurt the Most % in each group who have experienced the following number of job-related hardships during the recession. Two or None One more % % % Total 58 22 20 Gender Men 56 24 21 Women 61 21 19 Age 18-29 58 21 21 30-49 60 20 20 50+ 55 25 19 Race/Ethnicity White 63 21 17 Black 46 26 28 Hispanic 49 26 26 Education Coll. grad 70 18 13 Some coll. 56 23 18 HS grad or less 49 21 25 Income $75K+ 67 19 13 $50-74K 67 20 13 $30-49K 51 28 22 LT 30K 44 22 34 Notes: Hispanics are of any race. Whites and blacks include only non-Hispanics. Income levels represent annual family income.

62
question did not distinguish between paid and
unpaid overtime, leaving open the possibility that
many of these workers were compensated for their
extra work.
The Re-employed
The Great Recession has been an employment
roller coaster ride for 26% of currently employed
adults who have experienced at least one spell of
unemployment sometime in the past 30 months.
Perhaps surprisingly, there are few demographic
differences between these re-employed workers
and those who did not lose their jobs during this
period. But the two groups of workers do differ in
terms of their attitudes toward their present jobs.
According to the survey, the re-employed are less
satisfied with their current job and significantly
more likely to say they are overqualified for it.
Still, they don‘t think their spell of unemployment
will cause long-term damage to their careers, and
most say their current job is at least as good or the
same as the one they lost.
For some workers, finding a new job was a short-
lived victory over hard times. According to the
survey, more than a third have suffered two or
more spells of unemployment during the recession,
including 16% who have been out of work three or
more times.
Comparing the Jobs They Lost to the
Jobs They Found
According to the survey, somewhat less than half
(46%) of re-employed workers lost a full-time job
but then found full-time work during the
recession. An additional 14% moved laterally
from one part-time job to another.
At the same time, about one-in-eight re-employed
workers (13%) moved from part-time to full-time
employment. Not surprisingly, this group of new
How Re-employed See their Current Jobs Re-employed less satisfied and less likely to get a sense of identity from their work
78%
39%
89%
53%
Satisfied with current job
Get sense of identity from current job
Lost job during recession
Did not lose job
Who Is Spending More Time at Work % of workers in each group who say they have had to work longer hours or more overtime during the recession
Note: Asked of those currently employed full time or part time (n=1,604). Hispanics are of any race. Whites and blacks include only non-Hispanics. Income levels represent annual family income.
33
36
30
40
32
30
30
46
38
31
28
38
31
33
40
34
All employed
Men
Women
18-29
30-49
50+
Whites
Blacks
Hispanics
College grad
Some college
HS grad or
$75K+
$50K-$74K
$30K-$49K
LT $30K

63
full-time workers is dominated by young people,
many of whom may have gotten their first ―real‖
job. But for one-in-four re-employed workers, the
recession likely marks a backward step in their
careers. Fully 26% of re-employed workers lost a
full-time job and now work part time.
Employed workers who had been out of work
during the recession are somewhat less satisfied
with their present jobs than their colleagues who
were not unemployed during the recession.
Nearly 78% of all workers who lost a job during
the downturn say they are satisfied with their
current job. That is 11 percentage points lower
than the satisfaction levels of workers who did not
experience a spell of unemployment.
Nor do the re-employed get the same sense of
fulfillment from their current jobs as their
colleagues who did not lose a job. About four-in-
ten workers (39%) who experienced job loss
during the recession say they get a sense of identity
from their current position. For the remainder,
their job is just what they do to put bread on the
table. In sharp contrast, more than half (52%) of
all workers who did not lose their jobs during the
recession get a sense of identity from their jobs.
Other survey findings suggest re-employed
workers may have settled for the best-available job
in an anemic job market.
A majority of re-employed adults (54%) say they
are overqualified for their current job, compared
with 36% of other workers. Only a third report
they have the right qualifications for their new job,
more than 20 percentage points lower than the
proportion of workers who did not lose their job.
No More Money, Benefits Aren’t better—but It’s a Better Job How workers compare their current job to the one they lost during the recession
Note: “Don‟t Know/Refused” responses not shown
38
39
22
26
28
39
43
24
30
More
Less
Same
Better
Worse
Same
Better
Worse
Same
Does your new job pay more, less or about the same as your old job?
Does your new job have better, worse or about the same benefits?
Considering everything, is your new job better, worse or about the same?
How Re-employed Workers Fared % of workers in each category who lost a job sometime during the recession but are now employed
Note: “Don‟t know/Refused” responses are included but not labeled.
45%
HHad a full-time job, now work part-time
Had a full-time job, now work full-time
13%
Had a part-time job, now work part-time
26%
14%
Had a part-time job, now work full-time

64
At the same time, a different set of
questions produces somewhat puzzling
results.
Overall, four-in-ten re-employed
workers say their current job pays less
(39%) than the one they lost, while
22% say the pay is about the same.
About four-in-ten (38%) got a better-
paying job despite hard times.
An even larger majority say their new
job has about the same fringe benefits
(39%) or worse (28%) benefits than
their old one. Only a quarter (26%) say their current benefits are better.
Despite these lukewarm assessments, a substantial plurality (43%) says their new job is better than their old one.
While the sample is too small to say with confidence, nearly a third of all workers who say they make less money
and have worse benefits say their new job is better than (12%) or about the same (20%) as their old one.
Some of these rosy assessments may simply mean that in this bad economy, many workers are happy to have any
job—even one that pays less or whose benefits aren‘t as good as in their old job.
Not surprisingly, among adults who lost a full-time job, those who found another full-time position are
significantly more positive about their new job than those who accepted part-time employment (46% vs. 24%).
More than eight-in-ten
full-time to full-time
workers also say they
are satisfied with their
job (82%), nearly as
high a job satisfaction
level as among all
workers. In contrast,
about seven-in-ten
(72%) workers who lost
full-time jobs and now
work part time are
satisfied with their job.
Full-time to full-time
workers also are more
likely than part-timers
to say they get a sense of identity from their current job (48% vs. 34%).
Comparing the Job They Lost to the One They Have Workers who lost full-time jobs but found another full-time position are more positive about their jobs than those who accepted part-time work
46%
82%
48%
24%
72%
35%
New job better than previous job
Completely/mostly satisfied with current job
Get sense of identity from job
Prevous job full-time, current job full-time
Previous job full-time, current job part-time
Most Re-employed More Likely to Say They Are Overqualified for Current Job
54%
34%
36%
57%
Lost job during recession
Did not lose job
Overqualified for current job Right qualifications

65
Career Changes
Many re-employed workers spent the
time they were out of work reconsidering
their job and career options. According
to the survey, about four-in-ten re-
employed workers (39%) say that when
they were unemployed they moved or
seriously considered moving to an area
where jobs were more plentiful. About
six-in-ten changed careers or
contemplated doing so, while 36%
sought job retraining programs or went
back to school.
Taken together, the survey finds that three-quarters of all re-
employed workers took one of the three steps or thought seriously
about doing so—and nearly half (45%) at least considered two or
more options.
Men and younger workers are significantly more likely than other
workers to have contemplated making major changes in their
working lives to get a job when they were out of work.
According to the survey, re-employed men are significantly more
likely than women to say they seriously thought about moving or
actually moved to a new area where jobs were more plentiful (45%
vs. 31%). A somewhat larger share of these working men also
reports they had pursued a job retraining program or more formal
education (39% vs. 33%) while unemployed. But the same share of
men and women (60%) report that while they were unemployed,
they changed careers or seriously thought about going into a new
field.
While unemployed, younger workers were significantly more
likely to consider relocating and getting additional job training or
education. Among re-employed workers ages 18 to 29, nearly half
(47%) say they considered picking up stakes and moving to where
the jobs were, compared with 22% of those 50 or older. Those age
differences are not surprising in that young adults are the least
likely to be married, have a family, own a house or have other
characteristics that tend to keep people anchored in their current
communities.
The Demographics of Career Change % of re-employed workers in each group who said they had done or seriously considered doing each while unemployed Moved Changed Enrolled in to area careers, retraining, with jobs field education % % % Total 39 60 36 Gender Men 45 60 39 Women 31 60 33 Age 18-29 47 55 44 30-49 38 65 33 50+ 22 62 26 Race/Ethnicity White* 39 66 36 Nonwhite 40 51 37 Education Coll. grad 43 64 38 Some coll. 43 62 41 HS grad or less 34 57 33 Notes: Whites include only non-Hispanic whites. Hispanics are included in the nonwhite category and may be of any race. Income levels represent annual family income.
Retooling, Relocating % of re-employed who did or seriously considered doing each while they were out of work
39
60
36
Moved or considered moving
to another part of
Changed or seriously
considered changing career
Pursued job re-retraining or
got more education

66
Among the re-employed, younger workers also are more likely
than older adults to report having pursued job retraining or
having sought more schooling to help them find a job (44% for
those 18 to 29 vs. 25% for workers 50 or older).
Younger workers are less likely than the older re-employed to
say they considered abandoning their chosen careers or
occupations while they were jobless—perhaps because they have
not yet chosen their life‘s work. Overall, more than half (55%)
of those ages 18 to 29 say they switched careers or seriously
thought about doing so. That compares with 65% of those ages
30 to 49 and 62% who are 50 or older.
The Underemployed
Government statistics document the sharp increase in the
number of Americans classified by labor economists as ―underemployed.‖ These part-time workers say they
want to work full time but have not been able to find a full-time job.39 [For a more detailed analysis of the
underemployed, see Chapter 2]
Nearly half of all part-time workers (47%) say they would like to be employed full time, while 52% prefer part-
time employment.
Economic reasons explain why six-in-ten of these
workers do not have full-time jobs. According to the
survey, nearly four-in-ten part-time workers (37%) say
they cannot find a full-time job, while an additional 23%
say their employers cut back their hours. In addition to
these involuntary part-time workers, four-in-ten (39%)
are working part time for noneconomic reasons, such as
family responsibilities or health issues that prevent them
from taking a full-time job.
Men, minorities and workers younger than 50
disproportionately fill the ranks of the underemployed.
A substantial majority of men (60%) who work part
time but only 38% of women who do so say they want a
full-time job. Among all part-time workers, about six-
in-ten minorities but 41% of whites are underemployed,
as are 56% of part-timers with a high school education
or less, compared with slightly more than a third of
39 The Labor Department defines underemployed workers to be those who work part time but want a full-time job and do not have one for
economic reasons, including those who have tried but failed to find full-time employment. Underemployed workers do not include part-time workers who cannot accept a full-time position because of their health, family responsibilities or other noneconomic reasons.
Reasons for Underemployment % based on part-time workers who want to work full time
*Underemployed who give a noneconomic reason include those who cannot work full time because they have small children and those who provide care for an ailing family member.
DK-ref.
39%
37%
Noneconomic reason*
Employer cut hours
Could not find a full-time job 23%
Nearly Half of All Part-time Workers Would Prefer a Full-time Job
DK-ref.
52%
Prefer full-time
Perfer part-time
47%

67
those with college degrees. Workers younger than 50
also are more likely than older workers to be
underemployed.
Not surprisingly, nearly two-thirds of all part-timers with
family incomes of $30,000 or less are underemployed,
double the proportion of those with family incomes of
$75,000 or more (64% vs. 31%).
While the underemployed are generally satisfied with
their jobs, they are significantly less likely to report being
―very satisfied‖ with their current position, compared
with those who work full time (12% vs. 33%).
Conversely, they are more likely than their colleagues
who work full time to say they are dissatisfied with their
job (29% vs. 11%). These underemployed workers also
are significantly less likely to say their current job gives
them a sense of identity (35% for underemployed vs.
49% for those employed full time.)
Partisanship and Problems on the Job
Republicans and Democrats have fundamentally different
judgments about the country‘s economic health and the
overall direction of the economy. As detailed in other
sections, partisans even disagree about whether the
country is still in a recession or on its way out of bad
times, with Democrats expressing consistently more
optimistic views.
But in terms of experiences on the job, partisan
differences vanish and Republicans are no more or less
likely than Democrats to say they had their pay cut, hours
reduced or been forced to switch from a full-time job to one that is part time. Nor were members of either
party more likely to have gotten a raise, promotion or a better job since the recession began.
According to the survey, about two-in-ten Republicans (21%) and Democrats (22%) had their pay cut. Virtually
identical proportions say they were forced to take unpaid leave (13% of Republicans and 10% of Democrats) or
had their job downsized by their employer (10% among Republicans and 12% among Democrats). Partisans
from both parties also were no more likely to say their employer trimmed their work hours.
Republicans and Democrats also were no more likely to say they got a raise (39% and 40%, respectively) or to
have won a promotion or found a better job during the recession.
Men, Minorities, Less Educated More Likely to Be Underemployed % of part-time workers in each group who would prefer a full-time job
Note: Asked of those currently employed full time or part time. Income levels represent annual family income.
47
60
38
55
56
36
10
35
44
56
31
49
45
64
41
59
All adults
Men
Women
18-29
30-49
50-64
65+
College
Some college
HS grad or less
$75K+
$50K-$74K
$30K-$49K
LT $30K
Non-Hispanic whites
Minorities

68
However, working Democrats were more likely than Republicans to have lost a job during the recession (29%
vs. 20%) or to be currently unemployed—differences that seem hard to reconcile with Democrats‘ overall more
positive assessments of the economy.

69
Chapter 6: Spending, Saving, Borrowing, Retirement Confidence
The Great Recession has fundamentally changed the spending, borrowing, saving and investing habits of the
American public—now and quite possibly for a long time.
According to the Pew Research survey, more than six-in-ten (62%) Americans say that since the recession
began, they have cut back on household spending. Half say they have reduced the amount they owe on
mortgages, credit cards, car loans and other borrowing. And of those who have savings or retirement accounts,
more than four-in-ten (42%) say they‘ve adopted a more conservative approach to saving and investing,
compared with just 8% who say they have taken a
more aggressive approach.
Looking ahead to when the economy recovers,
many say they plan to keep up this new emphasis on
thrift and caution as they manage their personal
finances.
Nearly a third of Americans (31%) say they will
hold down their spending, and only 12% say they
will increase their outlays once the economy
improves. About half (48%) say they plan to
increase the amount of money they save, and nearly
a third (30%) plan to reduce debt levels.
The recession also has forced many Americans to dip into their investments, savings or retirement accounts to
pay their bills. Four-in-ten have taken money from savings or retirement accounts; nearly two-in-ten have sold
stocks, bonds or mutual funds to meet their expenses. Among the vast majority of Americans with savings or
investments, most say they have changed the way they save or invest, generally in a more cautious direction.
The financial turmoil has shaken Americans‘ confidence that they will have enough income and assets to last
through their retirement. Nearly a third (32%) are not confident that their nest egg will carry them through
retirement, an increase from 25% who said so in a Pew Research Center survey last year. Among those ages 62
and older, 35% say they delayed retirement because of the recession; among those in the pre-retirement years
(ages 50-61), fully six-in-ten (60%) say they might have to delay retirement because of the recession.
This chapter examines differences among age, race and other subgroups in responses to questions on spending,
saving, borrowing and retirement confidence in the Pew Research survey. As will be demonstrated, there are
significant differences—especially by age, educational attainment and employment status—in how people have
responded to the recession‘s impact.
Are You Spending More, Less or the Same?
% saying since the recession began, they have…
Note: “Don‟t know/Refused” responses not shown.
62
30
6
Cut back
Spent about the same
Increased spending

70
Spending Patterns
Most Americans say they have tightened their
belts since the recession began: 62% of
Americans say they have cut back household
spending. Only 6% say they are spending more,
and 30% are spending about what they did
before the recession.
Middle-aged adults are the most likely to say
they have reduced spending: 66% of those ages
30-49 and 70% of those ages 50-64 say so. That
compares with 54% of the youngest adults, ages
18-29, and 53% of those ages 65 and older. The
youngest adults are somewhat more likely than
other groups to say their spending has gone up
during the recession—11% say so.
Whites and blacks are more likely than
Hispanics to say they have reduced spending:
63% of whites have, as have 64% of blacks and
54% of Hispanics. This finding could be
explained in part by Hispanics‘ younger age
profile.
By gender, women (65%) are more likely than
men (59%) to say they have reduced spending.
By education level, adults with a high school
diploma or less education (65%) are more likely
than college graduates (57%) to say they have
cut their spending.
Not surprisingly, the groups that have done the
worst in the recession are more likely to say
they have cut spending. Nearly eight-in-ten
(79%) unemployed adults have done so,
compared with about six-in-ten (62%) employed adults.
Most Cut Spending—Some More Than Others
% saying since the recession began, they have…
Note: “Don‟t know/Refused” responses not shown.
62
59
65
54
66
70
53
63
64
54
65
57
30
32
28
34
28
25
40
31
26
30
27
37
6
7
6
11
6
4
5
5
8
13
7
5
All
Male
Female
18-29
30-49
50-64
65+
White
Black
Hispanic
High school or less
College or more
Cut back on spendingSpent about the sameIncreased spending

71
Future Spending Plans
Among all adults, 12% say they will spend
more when the economy improves and 54%
will spend about what they did before the
recession. Nearly one-in-three (31%) say they
plan to hold down their spending.
Among those who reduced their spending
during the recession, nearly half (47%) plan to
resume their pre-recession spending levels
when the economy improves, 41% say they
will continue with spending cutbacks and only
11% plan to spend more than they did before
the recession hit.
Those who pledge to keep tightening their
belts are disproportionately middle-aged:
Adults ages 30-49 (43%) and 50-64 (44%) are
more likely than young adults ages 18-29
(33%) to say they will continue to spend less.
Younger adults and adults ages 65 and older are
more likely to say they will resume spending at
pre-recession levels.
By gender, 43% of women say they plan to maintain reduced spending, compared with 38% of men. More men
plan to loosen their wallets—14%, compared with 8% of women.
Adults with college degrees are more likely than adults with high school diplomas or less education to say they
will continue to hold down their spending when the economy improves—46% vs. 35%. Adults with at most a
high school diploma (13%) are more likely than college graduates (9%) to say they will spend more.
Among those who have upped their spending during the recession, about half (48%) say they will reduce
spending to pre-recession levels when the economy recovers. The rest are split between planning to spend less
(24%) or more (26%).
Among adults who are spending about what they did before the recession, nearly three-quarters (73%) plan to
keep doing so in the future. The rest are split between those who intend to spend less (14%) and more (11%).
In this group, men (16%) are more likely than women (6%) to plan greater spending when the economy comes
back. Adults with at most a high school diploma are twice as likely as college graduates to say they will cut
spending when the economy recovers (20% vs. 10%).
Spending Plans When the Economy Improves
% saying they will … compared with before the recession
Among those who have cut back (n=1,948)
Among those who increased spending (n=158)
Among those who spent about as much (n=837)
Note: “Don‟t know/Refused” responses not shown.
41 47 11
Spend less Spend about as much Spend more
24 48 26
Spend less Spend about as much Spend more
14 73 11
Spend less Spend about as much Spend more

72
Savings Patterns
Nearly half of Americans (47%) say they are saving
less since the recession began; 34% say they are
saving about as much; 14% say they are saving
more.
Adults nearing retirement, ages 50-64, are the most
likely to say they are putting less into savings—54%
do. That compares with only 37% of young adults
(ages 18-29), 49% of Americans ages 30-49 and
46% of those ages 65 and older. Younger people
(26%) are more likely than middle-aged or older
Americans to say they are saving more; adults 65
and older (41%) are more likely than middle-aged
Americans to say they are saving about the same amount as before the recession.
Adults with at most a high school diploma (52%) are more likely than college graduates (41%) to say they are
saving less. College graduates are more likely than adults with at most a high school diploma to say that they
have upped their savings levels (17% vs. 11%) or that they are saving about as much as they used to (40% vs.
31%).
Most unemployed adults (60%) say they are saving less, compared with 45% of employed adults.
The survey finding that a hefty share of adults say they are saving less may appear to be inconsistent with the
finding in Chapter 2 of this report that the national savings rate has more than doubled since the recession began.
There are several possible explanations for this, including differing definitions of what constitutes savings.
The savings rate, as computed by the Bureau of Economic Analysis from the National Income and Product
Accounts (NIPA), uses as its measure of savings the amount of personal income in any one year that remains
after subtracting spending and other relevant expenses, including non-mortgage interest payments and transfer
payments. It may be that the NIPA definition of savings does not match Pew Research survey respondents‘
definition of savings when they assess what has changed for them since the recession began.
For example, if retirees who live on their savings cut back their spending, that is counted as an increase in
savings in the NIPA, even though those retirees did not deposit additional funds into their savings accounts.
Another example could be that survey respondents might say they have reduced savings because their home
equity was diminished or because losses in the stock market caused their retirement funds to shrink. However,
those reductions in their ―stock of savings‖ are not counted as reduced savings in the NIPA definition because
they are not a residual of income minus spending and other relevant expenses.
Are You Saving More, Less or the Same?
% saying since the recession began, they have …
Note: “Don‟t know/Refused” responses not shown.
47
34
14
Saved less
Saved about as much
Saved more

73
Future Savings
When the economy improves, nearly half of all
adults (48%) say they plan to save at higher
levels than they were before the recession,
38% plan to save at their pre-recession levels
and 7% plan to save less than that. Patterns
differ by subgroup, and by whether someone
already has cut back.
Among those who have reduced their savings,
half (50%) plan to save more when the
economy improves, 35% say they will resume
their pre-recession savings level and 10% plan
to save less. Younger adults are more likely to
say they plan to save more when the economy
recovers: 68% say they will, compared with
60% of adults ages 30-49, 43% of those ages
50-64 and 29% of those ages 65 and older.
More than half of college graduates (54%) say
they will ramp up savings again when the
economy improves, compared with 46% of
adults with at most a high school diploma.
Among those saving more, most (62%) plan to
continue doing so after the recession ends. Meanwhile, 32% plan to save the same amount, and 5% plan to save
less. Among those saving about the same amount they were before the recession, 49% will continue to do so,
44% plan to save more and 5% say they will reduce their savings.
Among those who are saving about as much as they did before the recession, the oldest adults (20%) are least
likely to say they plan to save more when the recession ends. By contrast, half (50%) of adults ages18 to 29 say
they will increase their savings, as do more than half (57%) of those ages 30 to 49. Most adults ages 50-64
(51%) and 65 and older (69%) say they will continue to save at the level at which they had been saving. Most
blacks (58%) say they plan to increase their savings when the economy rises, and most whites (53%) say they
will maintain their current savings level.
Borrowing More, or Less?
Half of Americans (50%) say they‘ve taken steps to cut back the amount of money they owe on mortgages,
credit cards, car loans and other types of borrowing. An additional 19% have made no changes, 13% say they
have borrowed more money to pay their monthly bills and 15% say they have no loans or debts.
Most adults ages 50-64 (55%) and 30-49 (53%) say they have taken steps to reduce the amount they owe,
compared with 41% of adults ages 65 and older. Among adults ages 18 to 29, 47% have cut back their
Saving Plans When the Economy Improves
% saying they will … compared with before the recession
Among those saving less (n=1,463)
Among those saving more (n=437)
Among those saving about as much (n=946)
Note: “Don‟t know/Refused” responses not shown.
10 35 50
Save less Save about as much Save more
5 32 62
Save less Save about as much Save more
5 49 44
Save less Save about as much Save more

74
borrowing. These young adults (17%) and those
ages 30-49 (15%) are somewhat more likely than
those ages 50-64 (11%) or 65 and older (8%) to say
they increased their borrowing.
When it comes to cutting back, whites (51%) and
blacks (54%) are more likely than Hispanics (43%)
to say they have done so. When it comes to
increasing borrowing, blacks (17%) and Hispanics
(24%) are more likely than whites (10%) to say
they have done that. Adults ages 65 and older
(26%) are more likely than younger adults to say
they have no debts.
Adults with at most a high school diploma are more
likely than college graduates to have upped their
loan balances during the recession (15% vs. 9%).
They also are more likely than college graduates to
have no debts or loans (18% vs. 13%).
Unemployed adults are more likely than employed
adults to say they have increased their borrowing
during the recession (22% vs. 13%).
Future Borrowing
Most adults (54%) say they do not expect to change
their current level of borrowing when the economy
improves. About one-in-three (30%) say they will
decrease borrowing, and 9% plan to increase
borrowing.
The most notable finding by age on this question is
a split between the oldest age group and other age
groups. Nearly two-thirds (65%) of adults ages 65
and older plan no change in their level of
borrowing, compared with half or slightly more
than half of middle-aged or younger adults.
Unemployed people are more likely than the
employed to say their borrowing will increase
(14% vs. 9%). Employed people are more likely to say their borrowing will remain the same (52% vs. 46%).
Borrowing Plans When the Economy Improves
% saying that when the economy improves, they will …
Note: “Don‟t know/Refused” responses not shown.
9
54
30
Increase borrowing
Borrow about the same
amount
Decrease borrowing
Are You Borrowing More Money or Cutting Back on What You Owe?
% saying during the recession, they …
Note: “Don‟t know/Refused” responses not shown.
Question wording: I‟d like you to think about the money you owe on your credit cards, mortgage, car loans and other kinds of loans. During the recession, did you have to borrow more money to pay your monthly bills, or did you take steps to cut back what you owe?
13
50
19
2
15
Borrowed more
Cut back
Neither borrowed more nor cut back (VOL.)
Did both (VOL.)
No debts or loans (VOL.)
F

75
Sell Investments or Dip into Savings to Pay Bills?
Among those with stock, bond or mutual fund
investments, 19%—nearly one-in-five—say they
have had to sell some of their holdings to pay their
bills during the recession. A higher share of men
(22%) than women (16%) say they sold some
investments to pay bills.
Those who own stocks, bonds or mutual fund
investments total 37% of U.S. adults, according to
the survey. Holders of these investments are
disproportionately likely to be white, ages 50 and
older, college graduates and have high incomes. By
employment status, 40% of employed adults have
such holdings, compared with 20% of the
unemployed. By party affiliation, 47% of
Republicans own stocks, bonds or mutual funds,
compared with 32% of Democrats and 37% of independents.
The share of adults who say they own stocks, bonds or mutual funds has declined since a Pew Research survey in
2008, when 44% of respondents had such holdings. 40
Among Pew Research survey respondents who own stocks, bonds or mutual funds, low-income households are
more likely than high-income households to have sold some holdings to pay their bills. Among people with at
least $100,000 in household income, 16% sold investments to pay their bills. Among people with $20,000 or
less in household income, 36% did. Among those with investments in stocks, bonds or mutual funds, the
unemployed are twice as likely as the employed to say they had to sell some of their assets to pay bills (36% vs.
18%).
Among those with bank accounts or retirement savings (88% of households in the survey), 41% say they have
had to pull money from them to meet expenses or pay bills during the recession. Those who dipped into savings
include about half of blacks (52%) and Hispanics (49%) but only 39% of whites. In keeping with other survey
findings that the elderly have been more sheltered from the recession‘s impacts than younger adults, only 27%
of adults ages 65 and older say they pulled money from bank accounts or retirement savings to meet expenses.
Among younger groups, more than four-in-ten did.
40 Does the Pew Research finding of decline in stocks, bonds or mutual funds match findings of other data sources? A national survey of non-institutional ownership of mutual funds, sponsored by the Investment Company Institute, found a decline in household and individual ownership of such funds between 2008 and 2009, the latest year available. The share of households owning such funds declined to 43% in 2009 from 45% in 2008; the number of individual investors declined to 87.1 million in 2009, compared with 92 million in 2008. The Investment Company Institute survey includes owners of mutual funds both inside and outside employer-sponsored retirement plans. (Pew Research survey respondents were not asked whether their holdings were part of employer-sponsored plans.)
Did You Sell Investments or Raid Savings to Pay Your Bills?
% of those who own stocks, bonds or mutual funds who say … (n=1,181)
% of those who have savings, 401(k) or other retirement accounts who say … (n=2,608)
Note: “Don‟t know/Refused” responses not shown.
19Yes
41Yes

76
Higher-income households are the least likely to dip into savings to pay the bills. Among adults with household
incomes of $100,000 or more, 27% have done so. Among adults with household incomes of $20,000 or less,
47% did.
More than six-in-ten unemployed adults (62%) say they have taken money from their savings or retirement
accounts to pay current bills, compared with 42% of employed adults.
Change in Investing Strategy?
The vast majority of all Americans (88%)
have investment holdings, bank accounts
or retirement accounts, and more than half
(57%) say they have changed the way they
are investing or saving since the recession
began. This is especially true of Hispanics
(67%), compared with whites or blacks
(55% each). At least six-in-ten younger or
middle-aged adults say they have made
changes, compared with only 40% of
adults ages 65 and older. Unemployed
adults (73%) are more likely than the
employed (60%) to have changed the way
they invest.
Asked whether those changes resulted in
more cautiousness or aggression, the
majority of those who altered their
strategy (74%) say they are more cautious. Only 14% say they have become more aggressive, and a few (3%)
say they are both.
Younger adults are more likely than older ones to have become more aggressive, and older adults are somewhat
more likely to say they have dialed back. About a quarter of younger adults ages 18-29 (26%) say they have
become more aggressive, compared with less than 15% of middle-aged or older adults.
There is some difference by education level in whether people changed their investment or savings strategies and
also some difference in the type of change they made: College graduates (18%) are somewhat more likely than
those with no more than a high school diploma (12%) to say they are investing more aggressively. There also are
no significant differences by income group, but people who say they live comfortably (19%) are somewhat more
likely to be investing more aggressively than those who have just enough for basics with a little left over (13%)
or just enough for basics (12%).
Did You Change the Way You Saved or Invested?
% saying yes … since the recession began (n=2,624)
% among those who changed the way they save or invest who say they … (n=1,537)
Note: “Don‟t know/Refused” responses not shown.
57Changed the way they
saved or invested
74
14
3
Invested or savedmore cautiously
Invested or savedmore aggressively
Both
F

77
Confidence in Retirement Savings
Most adults are very (23%) or somewhat
(41%) confident that they—and, if married,
their spouse—will have an adequate nest egg
to carry them through their retirement years.
However, confidence levels have eroded
somewhat in the last year, especially among
younger adults, when they are asked whether
they will have enough money and assets to last
their lifetimes.
The share that is very confident has declined
(to 23% from 30%) since a similar question
was asked in February 2009; the ―somewhat
confident‖ share is unchanged. Nearly a third
(32%) are not confident they will have enough, compared with 25% in 2009. That includes 19% who are not
too confident, up from 16% in 2009, and 13% who are not at all confident, up from 9% in the 2009 survey.
As with other measures of economic insecurity, older adults are more sheltered than other groups. Only 22% of
adults ages 65 and older are not confident about their retirement savings, compared with 31% of adults ages 18-
29, 36% of those ages 30-49 and 37% of those ages 50-64.
Compared with 2009, older adults‘ confidence levels about the adequacy of their retirement savings have not
budged. The levels have fallen most sharply for younger adults. Last year, 19% of the elderly were not confident
about their retirement savings, compared with 22% in 2010.
Among those ages 18 to 29, 23% lacked confidence in 2009, compared with 31% in 2010. Among those ages
30-49, 25% lacked confidence in 2009, compared with 36% in 2010. Among those ages 50-64, 31% lacked
confidence in 2009, compared with 37% in 2010. A year‘s time has served to erode the sharp differences
between baby boomers and younger adults.
Unemployed adults are especially likely to be unsure they will have the resources to support themselves in
retirement. Barely half (49%) of unemployed people are confident of their retirement nest egg, compared with
64% of employed adults. They are twice as likely as the employed to be not at all confident about the adequacy
of their retirement resources (26% vs. 13%).
By education level, college graduates are more confident than those with at most a high school diploma that their
retirement savings will be adequate when the time comes—71% to 61%. More than a third (35%) of those with
a high school diploma or less education are not confident about their retirement savings, compared with 27% of
college graduates.
A similar pattern prevails by income group, with an increase in confidence about retirement savings as family
income rises and a decline as family income falls. For example, 78% of adults with family incomes of $100,000
Confidence in Retirement Funding Declines
% saying they are … that they will have enough income and assets for retirement
Note: In 2010, 1% say they won‟t have anything or were unable to save. “Don‟t know/Refused” responses not shown.
30
23
41
41 19
9
13
162009
2010
Very confident Somewhat confident
Not too confident Not at all confident

78
or more are confident about their retirement savings, compared with 55% among adults with family incomes of
$30,000 or less.
Adults who are unsure about their retirement income and assets are more likely than those who are confident to
have cut back spending or be planning to do so. Among the unsure, 77% have cut spending, compared with 55%
of those who are confident. The unsure also are more likely than those who are confident to have cut savings
(65% to 38%) and borrowing (57% vs. 47%).
In terms of income and assets, people who are unsure about their retirement are less likely to have high family
incomes and to own stocks, bonds or mutual funds than people who are confident about their nest eggs.
The Pew Research survey also asked respondents whether they might have to delay their retirement. Among
those ages 50-61 who are currently employed, 60% say they may have to delay their retirement because of the
recession. Roughly a third (34%) say they will not have to delay retirement, and 5% aren‘t sure. [A fuller
treatment of this question can be found in Chapter 4.]
The share saying they may have to delay retirement is even higher among those who are unsure they will have
enough of a nest egg to carry them through their retirement years. Among those ages 50-61 and not retired,
82% of those who are unsure say they may have to delay retirement, compared with 47% of those who are
confident about their income and assets.

79
Chapter 7: The Housing Bust
About half of all homeowners say their home is worth less
now than it was before the recession began, and of these,
nearly nine-in-ten predict it will be at least three years for
their home to return to its pre-recession value. Yet these
reversals have not substantially diminished the belief of most
Americans that a home is the best way to protect and grow
their money. Despite the battering home prices have taken,
eight-in-ten respondents agree that a home is ―the best long-
term investment‖ they can make.
According to the Pew Research Center survey, fully 48% of
all homeowners say their home has decreased in value during
the recession. For a quarter of all American homeowners,
the decline has been particularly severe: 26% report the
value of their home has declined ―a lot,‖ while somewhat
fewer (22%) report a smaller drop.
A lucky few—only 12% of all homeowners—report their
home increased in value despite hard times. One-third say the value of their home has not changed.
Home Values Plummet in West
While the slumping economy has affected nearly all Americans, some homeowners have been hit harder than
others. The recession has been particularly difficult for homeowners in the West and Midwest. Those ages 30 to
64 are more likely than younger or older respondents to see their housing prices tumble, the survey found.
More affluent homeowners also are more likely than the least affluent to report that their house was worth less.
Nearly two-thirds of all homeowners in the West (65%) report the value of their home declined since the
recession began in December 2007. The drop in housing prices was not as broadly felt in the East or in the
South, where 41% of all homeowners in each region say their home is now worth less than it was before the
recession started. In the Midwest, about half (51%) say the value of their home fell.
This paper loss was particularly large for Westerners—not surprising, given the headlines over the past 2½
years about the dismal housing markets in
states such as California, Arizona and
Nevada. Four-in-ten (40%) say their
home is worth ―a lot less‖ now than it was
at the start of the recession, compared
with 24% of homeowners in the South
and Midwest and 18% of those living in
the East.
Home Values Tumble % of homeowners who say that during the recession their home value has …
Note: Based on 1,937 homeowners.
DK/Ref
33%
Gone down a
Gone down a little
Gone up a lot
22%
Stayed the same
26%
8%
4%
Gone upa little
How Long for Home Value to Recover?
10%
47%
39%
Two years or less
Three to five years
Six years or longer

80
Middle-aged homeowners are more likely than younger or older adults to say their home value has declined.
More than half (52%) of homeowners ages 30 to 64 report a decline in the market price of their home,
compared with 36% of younger adults and 43% of those ages 65 and older. The pattern is not surprising: Adults
in their late 30s, 40s and 50s likely purchased their homes before the housing market fully collapsed, while a
disproportionately large share of young people bought properties since the decline began. If anything, the drop
in housing prices may have benefited this group.
In a reversal from the pattern seen elsewhere in the survey, black homeowners were significantly less likely than
whites to say their home had declined in value during the recession. Overall, about half of all white (49%) and
Hispanic homeowners (52%) report their
house is worth less now than it was at the
start of the recession, compared with only
34% of black homeowners.
More affluent homeowners are somewhat
more likely to report a drop in home value.
Among those with family incomes of $75,000
or more, about half (53%) saw the market
price of their home decline. This compares
with 40% of those whose family incomes
were less than $30,000 a year.
Republicans are significantly more likely than
Democrats to say the value of their home
declined (52% vs. 42%). About half of
independents (51%) also reported a drop.
Recovery in Home Values
Predicted to Be Slow
Few homeowners expect a quick rebound to
housing prices in their area. Most predict it
will be at least three years before their home
returns to its pre-recession value—an
estimate that could increase significantly if the
economic climate does not appreciably
improve in the next few years.
Only 10% of all homeowners expect it will
take two years or less for the price of their
house to bounce back. The plurality (47%)
predict that it will take longer than the
recession has lasted for their home to recover
Nearly Half Say Homes Have Lost Value % in each group who say the value of their home has declined during the recession
Note: Hispanics may be of any race. Whites and Blacks include only non-Hispanics. Displayed income categories are for family incomes.
48
36
52
52
43
49
34
52
53
53
46
40
41
51
41
65
52
42
51
All homeowners
18-29
30-49
50-64
65+
Whites
Blacks
Hispanics*
$75K+
$50K-$74K
$30K-$49K
LT $30K
East
Midwest
South
West
Republicans
Democrats
Independents

81
in value—three to five years, by their estimate. An additional three-in-ten (29%) homeowners say it will take
six to 10 years, while 10% say it will take longer than 10 years.
One in Five Homeowners “Underwater”
For about one-in-five homeowners with a
mortgage, the recession has been particularly
nerve-racking. According to the survey, about
21% of these homeowners currently owe more
on their mortgage or other home loans than they
could sell their house for at current market
prices. In real estate vernacular, they are
―underwater.‖
The demographic groups caught between a big
mortgage and sinking home prices differ in key
ways from the profile of those whose homes
declined in value but do not owe more than their
home is currently worth.
Whites are much less likely to report the amount
they owe is greater than their home‘s current
value (18%) than either blacks (35%) or Hispanics
(41%). At the same time, those with annual
family income under $30,000 are significantly
more likely to be underwater (33%) than those
with family incomes of $75,000 or more (15%)
or whose family incomes were $50,000 to
$75,000 (19%).
Nearly three-in-ten homeowners with mortgages
in the West (28%) report they owe more than
their home‘s current value, double the proportion
in the East (14%). Similarly, nearly a quarter of
all homeowners in the South are underwater
(23%).
Those who have been hit hardest on the work
front also have been hard-hit at home. Among
homeowners who are currently unemployed,
nearly four-in-ten say they owe more on their
home than it is worth—nearly double the
proportion of employed homeowners who are in
a similar situation (38% vs. 20%).
Homeowners “Underwater” % of homeowners with a mortgage who say they owe more on their home than it is currently worth
*Results among Hispanics should be interpreted cautiously. There were only 94 Latino homeowners in the sample. Hispanics may be of any race. Whites and Blacks include only non-Hispanics. Displayed income categories are for family incomes.
21
18
25
20
15
18
35
41
15
19
29
33
14
19
23
28
20
38
All
18-29
30-49
50-64
65+
Whites
Blacks
Hispanics*
$75K+
$50K-$74K
$30K-$49K
LT $30K
East
Midwest
South
West
Employed
Unemployed

82
In contrast, there is no difference in the proportion of
Republicans (23%) and Democrats (23%) who say they are
underwater. Slightly fewer self-described political
independents (18%) say they owe more than their house would
sell for in today‘s housing market.
In Debt and Underwater
Those homeowners who have the most to pay off on their home
loans are also the most likely to be underwater.
Overall, about a third of all homeowners own their homes free
and clear, while about one-in-six (17%) say they have paid off
more than half of their home loans. Slightly more than a third
(35%) say they have paid off less than half of their housing debt,
while the remainder (13%) still owe about half.
Among those who still owe
more than half, about one-in-
four (27%) say they are
underwater. That is more than
double the proportion of those
who say they have paid off more
than half of their home debt
(11%) and substantially more
than those who still owe about
half (19%).
The recent ups and downs of the
housing market likely explain
most of this correlation. Those with the
largest unpaid home debt likely are those
who purchased homes relatively recently
and have just started paying them off. In
contrast, most of those who purchased
homes a decade or more ago have already
paid off a portion of their mortgages and
benefited from sharply rising home prices
before the bottom fell out of the housing
market in the mid-2000s.
A Home as an Investment
Despite declining housing values, eight-
Most Think a Home Is a Good Investment Some people say that buying a home is the best long-term investment in the United States. Do you …
*New York Times/CBS Note: “Don‟t know/Refused” responses not shown
39
49
41
35
10
9
7
4
2010
1991*
Strongly agree Somewhat agree
Somewhat disagree Strongly disagree
The More Homeowners Owe, the More Likely They Are To Be Underwater
11%
19%
27%
More than half
About half
Less than half
Portion of home loan paid off...
% of each group who are "underwater"...
Few Homeowners Have Burned Their Mortgages % of homeowners who say they have paid off each share of their home loans
DK-ref.
33%
Less than half
More than half
All
13%
About half
35%
17%

83
in-ten Americans see a home as the best long-term investment that the average person can make.
But some doubts have emerged in Americans‘ love affair with their homes. The proportion that strongly agrees
that a home is the best investment has declined a full 10 percentage points (from 49% to 39%) since that
question was last asked by CBS News and the New York Times nearly 20 years ago. At the same time, the
proportion that somewhat agrees with that statement has increased from 35% to 41%, while those who disagree
increased modestly from 13% to 17%.
While it is impossible to say whether these changes are related to the recession or the result of long-term trends
or some pre-recession event, the conclusion from the latest survey is clear: For most Americans, their home is
their castle—and still their best investment.
Impact of the Recession on Views of Homeownership
The Pew Research Center survey
suggests that people hit hardest by
the recession view the investment
value of their homes differently than
those who experienced relatively few
adverse effects. But these differences
are surprisingly modest, suggesting
that views of homeownership as an
investment strategy may be relatively
immune to the ups and downs of the
business cycle.
For example, more than seven-in-ten
homeowners (73%) who are
currently underwater still say their
home is the best investment they can
make, compared with 86% of those
who would make money if they sold
their homes today.
The pattern is virtually identical
among those whose home values rose
or fell in the past 30 months. Among
those who say the market price of
their home went down during the
recession, more than three-in-four
(78%) rate homeownership as a good
investment, compared with 88% of
those whose home increased in
value.
Experiences during Recession Shape Attitudes Toward Home as an Investment % who say home is the best investment a person could make
73
86
83
72
88
78
89
84
68
Less
More
Own
Rent
Went up
Went down
Two years or less
Three to five
Six or longer
Could you sell home for more or less than you owe?
Own or rent home?
Did value of home go up or down during recession?
How long until home's market value recovers from recession?

84
Not surprisingly, those who have been hit hardest by the bad real estate market are less likely to view
homeownership as a good investment. According to the survey, about two-thirds (68%) of those who predict it
will take six years or longer for the value of their home to get back to where it was before the recession also say
homeownership is the best long-term investment an American can make. In contrast, about nine-in-ten
homeowners (89%) who say it will take two years or less to recover value homeownership as an investment
consider homeownership the best-long term investment.
Similarly, those who say their home lost ―a lot‖ of market value during the recession are less likely than those
who said it lost only a little to rate homeownership as the best investment for the typical American (71% vs.
85%).

85
Appendices: Survey Methodology
Results for this survey are based on telephone interviews conducted by Princeton Survey Research Associates
International with a nationally representative sample of 2,967 adults living in the continental United States.
Interviews were done in English and Spanish by Princeton Data Source from May 11 to 31, 2010. Statistical
results are weighted to correct known demographic discrepancies. The margin of sampling error for the
complete set of weighted data is ±2.2 percentage points.
Design and Data Collection Procedure
Seven separate sample segments were used for data collection in order to obtain a representative sample that
also oversampled two key demographic groups—those who are unemployed but are able to work and those who
are working part time for economic reasons. The unemployed but able to work group (UEA) is defined as those
who are not currently employed full- or part-time but would like a job and could start one now if it were
offered to them. The working part time for economic reasons group (PTE) is defined as people who are
currently working part time but are doing so only because their hours were cut back or they could not find full-
time work and have to settle for part-time work. Table 1 shows the sample segment definitions along with the
number of interviews in each.
Table 1: Sample Design Segments
Segment Sample Type Population n=
1 Landline RDD All adults 1,001
2 Landline RDD screened Adults 18-64 600
3 Landline RDD screened UEA or PTE 96
4 Landline callback screened UEA or PTE 196
5 Cell RDD All adults 805
6 Cell RDD screened UEA or PTE 119
7 Cell callback screened UEA or PTE 150
Prepared by Princeton Survey Research Associates International for the Social & Demographic Trends Project of the Pew Research Center

86
Sample segments 1-3 were all landline random-digit dialing (RDD) samples drawn using standard list-assisted
methods, where telephone numbers were drawn with equal probabilities from all active blocks in the
continental U.S. Cell sample segments 5 and 6 were not list-assisted but were drawn through a systematic
sampling from dedicated wireless 100-blocks and shared service 100-blocks with no directory-listed landline
numbers. The landline and cell callback samples (segments 4 and 7) were drawn from recent PSRAI surveys.
Callback sample was identified as those who were under age 65 and had completed less than four years of
college.
Questionnaire Development and Testing
The questionnaire was developed by the Pew Social Trends & Demographics Project. To improve the quality of
the data, the questionnaire was pretested twice with a small number of respondents using RDD telephone
numbers. The monitored pretest interviews were conducted using experienced interviewers who could best
judge the quality of the answers given and the degree to which respondents understood the questions. Some final
changes were made to the questionnaire based on the monitored pretest interviews.
Contact Procedures
Interviews were conducted from May 11 to 31, 2010. As many as seven attempts were made to contact every
sampled telephone number. Sample was released for interviewing in replicates, which are representative
subsamples of the larger sample. Using replicates to control the release of sample ensures that complete call
procedures are followed for the entire sample. Calls were staggered over times of day and days of the week to
maximize the chance of making contact with potential respondents. Each phone number received at least one
daytime call.
The introduction and screening procedures differed depending on the sample. For each contacted household in
sample segments 1-3, interviewers asked to speak with either the youngest male or youngest female currently at
home based on a random rotation. If no male/female was available at the time of the call, interviewers asked to
speak with the youngest adult of the opposite sex. This systematic respondent selection technique has been
shown to produce samples that closely mirror the population in terms of age and gender when combined with
cell sample.
In sample segment 2, interviewers then asked if the person was age 18 to 64. If so, they proceeded with the
main interview. If not, the interviewers asked if any other household members were age 18 to 64 and, if there
was, an interview was conducted with that person. If the household had no age-eligible people, that piece of
sample was screened out as ineligible.
Sample assigned to segment 3 was administered the employment status screener, which determined whether the
person who answered the phone qualified as either unemployed and able to work (UEA) or employed part time
for economic reasons (PTE). Respondents who qualified for either of these groups completed the interviews.
Those who did not qualify were screened out as ineligible.

87
For sample segment 4, interviewers started by asking to talk with the person in the household who had
previously completed a telephone interview. The person was identified by age and gender. After the target
respondent was on the phone, they were administered the employment status screener.
Sample segment 5 included interviews with all adults on cell phones. This sample was administered a standard
cell phone screener that simply confirmed that the person was an adult and in a safe place to talk before
continuing with the main interview. Sample segment 6 was administered the employment status screener after
the standard cell phone screener. Sample segment 7 included callback interviews with cell respondents. All
qualified cell phone respondents were offered $5 to complete an interview.
Weighting and analysis
Weighting is generally used in survey analysis to adjust for effects of the sample design and to compensate for
patterns of non-response that might bias results. The weighting was accomplished in multiple stages to account
for the different sample segments as well as the oversampling of certain groups. Weighting also balanced sample
demographic distributions to match known population parameters.
The first stage of weighting corrected for the oversampling in segments 2, 3, 4, 6 and 7. This adjustment was
computed separately for landline sample segments (2, 3 and 4) and cell sample segments (6 and 7). This
adjustment is called SAMPWT in the dataset.
We also made two more adjustments before raking the data to population parameters. The Probability of
Selection Adjustment (PSA) corrects for the fact that respondents in the landline sample have different
probabilities of being sampled depending on how many adults live in the household. Since we sample only one
person per household, adults who live with no other adults have a greater chance of being sampled than adults
who live in multiple-adult households.
The PSA was applied to all respondents in sample segments 1-3 where we were calling a household by landline
and selecting one adult from within the household to complete the interview. To compute the PSA, first define
n1 as the number of respondents in the landline sample who live in single-adult households and n2 as the number
of respondents in the landline sample that live in multi-adult households. The PSA equals:
The final adjustment we made prior to raking the data is the Phone Use Adjustment (PUA), which corrects for
the overlapping landline and cellular sample frames. The PUA was applied to all cases in the dataset. To
compute the PUA, first define p1 as the number of respondents with only one type of phone—landline or cell—
and define p2 as the number of respondents with both types of phones. The PUA equals:

88
At this point, an interim weight was computed that was the product of the three sample adjustments :
SAMPWT, PUA and PSA. This interim weight was used as an input weight for the final stage of weighting—the
demographic raking. The data was raked, by form, to current population parameters for: sex by age; sex by
education; age by education; race/ethnicity; number of adults in the household; employment status; census
region; population density; and household telephone usage.
The telephone usage parameter was derived from an analysis of recently available National Health Interview
Survey data.41 The population density parameter is county-based and was derived from Census 2000 data. All
other weighting parameters were derived from the Census Bureau‘s 2009 Annual Social and Economic
Supplement (ASEC).
This stage of weighting, which incorporated each respondent‘s initial weighting adjustments, was accomplished
using Sample Balancing, a special iterative sample weighting program that simultaneously balances the
distributions of all variables using a statistical technique called the Deming Algorithm. The raking corrects for
differential non-response that is related to particular demographic characteristics of the sample. This weight
ensures that the demographic characteristics of the sample closely approximate the demographic characteristics
of the population. Table 2 compares weighted and unweighted sample demographics to population parameters.
41 Blumberg SJ, Luke JV. Wireless substitution: Early release of estimates from the National Health Interview Survey, July-December, 2008. National Center for Health Statistics. May 2009.

89
Table 2: Sample Demographics
Parameter Unweighted Weighted
Gender
Male 48.5% 44.7% 48.3%
Female 51.5% 55.3% 51.7%
Age
18-24 12.6% 12.3% 12.2%
25-34 17.8% 13.5% 16.9%
35-44 18.2% 14.4% 17.0%
45-54 19.6% 21.6% 19.5%
55-64 15.1% 21.8% 15.5%
65+ 16.6% 14.0% 16.9%
Education
Less than HS graduate 14.1% 9.7% 12.4%
HS graduate 34.7% 32.0% 33.9%
Some college 24.1% 25.5% 24.6%
College graduate 27.1% 31.9% 28.3%
Race/Ethnicity
White/not Hispanic 68.8% 70.7% 68.8%
Black/not Hispanic 11.5% 11.0% 11.3%
Hispanic 13.7% 10.2% 12.5%
Other/not Hispanic 6.0% 6.7% 6.1%
Region
Northeast 18.5% 17.7% 18.2%
Midwest 22.0% 24.0% 22.6%
South 36.8% 38.7% 37.5%
West 22.7% 19.7% 21.7%
County Pop. Density
1 - Lowest 20.1% 23.3% 20.9%
2 20.0% 21.5% 20.2%
3 20.1% 21.3% 20.5%
4 20.2% 18.9% 20.0%
5 - Highest 19.6% 15.0% 18.3%
Phone Use
LLO 11.7% 10.3% 11.6%
Dual - few, some cell 47.3% 54.4% 47.2%
Dual - most cell 17.4% 18.3% 17.3%
CPO 23.6% 15.9% 22.9%
Continued…

90
Table 2: Sample Demographics (continued…)
Parameter Unweighted Weighted
# of adults in HH
One 17.4% 24.1% 18.1%
Two 54.8% 52.8% 55.6%
Three+ 27.8% 23.2% 26.3%
Employment Status
Employed-FT 45.2% 38.3% 44.5%
Employed-PT 15.6% 15.7% 15.5%
Employed-Undes. missing 3.5% 3.2%
Not employed 6.0% 18.4% 6.6%
Not in labor force 33.2% 23.6% 29.7%
Effects of Sample Design on Statistical Inference
Post-data collection statistical adjustments require analysis procedures that reflect departures from simple
random sampling. PSRAI calculates the effects of these design features so that an appropriate adjustment can be
incorporated into tests of statistical significance when using these data. The so-called design effect, or deff,
represents the loss in statistical efficiency that results from a disproportionate sample design and systematic non-
response. The total sample design effect for this survey is 1.46.
PSRAI calculates the composite design effect for a sample of size n, with each case having a weight, wi as:
In a wide range of situations, the adjusted standard error of a statistic should be calculated by multiplying the
usual formula by the square root of the design effect (√deff ). Thus, the formula for computing the 95%
confidence interval around a percentage is:
where p̂ is the sample estimate and n is the unweighted number of sample cases in the group being considered.
The survey‘s margin of error is the largest 95% confidence interval for any estimated proportion based on the
total sample—the one around 50%. For example, the margin of error for the entire sample is ±2.2 percentage
points. This means that in 95 of every 100 samples drawn using the same methodology, estimated proportions
2
1
1
2
n
i
i
n
i
i
w
wn
deff formula 1
n
ppdeffp
)ˆ1(ˆ96.1ˆ
formula 2
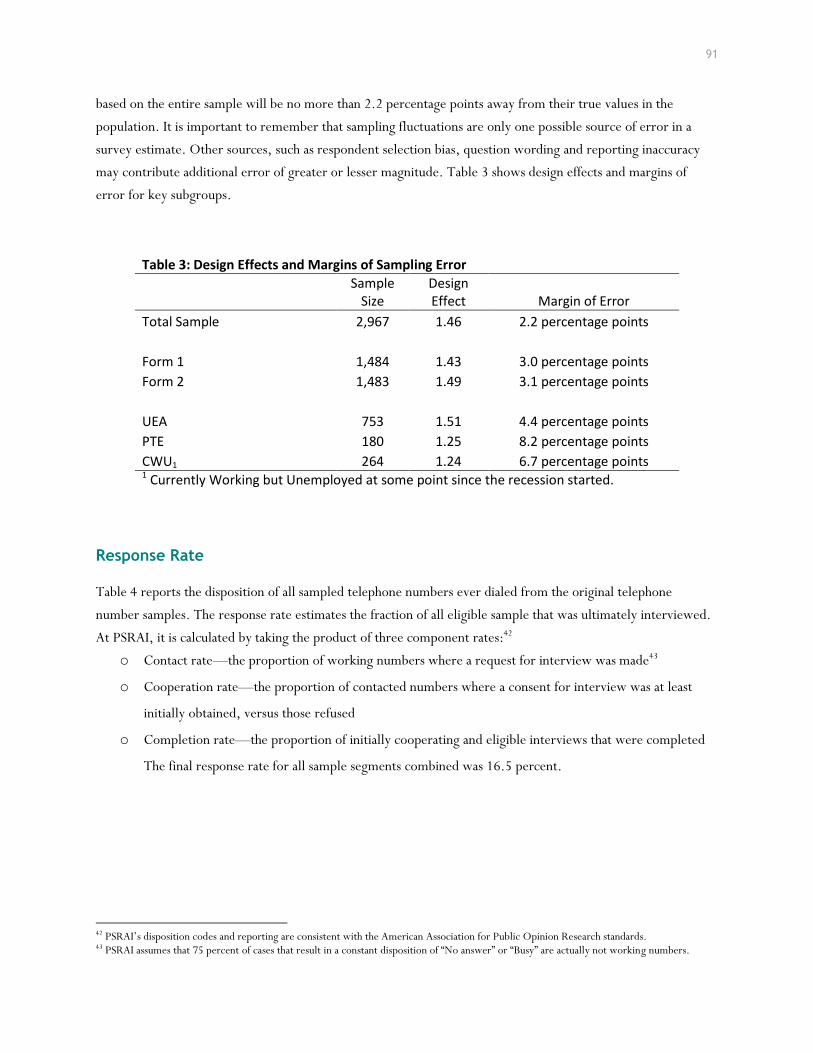
91
based on the entire sample will be no more than 2.2 percentage points away from their true values in the
population. It is important to remember that sampling fluctuations are only one possible source of error in a
survey estimate. Other sources, such as respondent selection bias, question wording and reporting inaccuracy
may contribute additional error of greater or lesser magnitude. Table 3 shows design effects and margins of
error for key subgroups.
Table 3: Design Effects and Margins of Sampling Error
Sample
Size Design Effect Margin of Error
Total Sample 2,967 1.46 2.2 percentage points
Form 1 1,484 1.43 3.0 percentage points
Form 2 1,483 1.49 3.1 percentage points
UEA 753 1.51 4.4 percentage points
PTE 180 1.25 8.2 percentage points
CWU1 264 1.24 6.7 percentage points 1 Currently Working but Unemployed at some point since the recession started.
Response Rate
Table 4 reports the disposition of all sampled telephone numbers ever dialed from the original telephone
number samples. The response rate estimates the fraction of all eligible sample that was ultimately interviewed.
At PSRAI, it is calculated by taking the product of three component rates:42
o Contact rate—the proportion of working numbers where a request for interview was made43
o Cooperation rate—the proportion of contacted numbers where a consent for interview was at least
initially obtained, versus those refused
o Completion rate—the proportion of initially cooperating and eligible interviews that were completed
The final response rate for all sample segments combined was 16.5 percent.
42 PSRAI‘s disposition codes and reporting are consistent with the American Association for Public Opinion Research standards. 43 PSRAI assumes that 75 percent of cases that result in a constant disposition of ―No answer‖ or ―Busy‖ are actually not working numbers.

92
Table 4: Sample Disposition
Combined Landline
fresh
Landline screen
for 18-64
Landline screen for UEA/PTE
LL CB screen for UEA/PTE
Cell Fresh
Cell screen for UEA/PTE
Cell CB screen for UEA/PTE
80864 25251 18093 6951 4541 15695 7338 2995 T Total Numbers Dialed
3754 1559 1126 442 108 320 163 36 OF Non-residential
2026 998 707 265 27 14 15 0 OF Computer/Fax
21 15 2 4 0 0 0 0 OF Cell phone
33635 12280 8699 3318 402 5744 2788 404 OF Other not working
1013 131 302 137 101 227 95 22 UH Additional projected not working
40416 10269 7257 2786 3904 9391 4278 2533 Working numbers
50.0% 40.7% 40.1% 40.1% 86.0% 59.8% 58.3% 84.6% Working Rate
338 44 101 46 34 76 32 7 UH No Answer / Busy
6233 487 577 324 825 2349 985 686 UONC Voice Mail
1466 40 47 11 297 666 293 112 UONC Other Non-Contact
32379 9698 6532 2405 2748 6300 2968 1728 Contacted numbers
80.1% 94.4% 90.0% 86.3% 70.4% 67.1% 69.4% 68.2% Contact Rate
10810 5351 3054 1144 418 554 128 161 UOR Callback
14781 3241 2485 848 1189 4341 1965 712 UOR Refusal
6788 1106 993 413 1141 1405 875 855 Cooperating numbers
21.0% 11.4% 15.2% 17.2% 41.5% 22.3% 29.5% 49.5% Cooperation Rate
208 72 47 25 3 40 16 5 IN1 Language Barrier
3558 0 342 291 941 547 738 699 IN2 Child's phone/Screen out for age/UEA/PTE
3022 1034 604 97 197 818 121 151 Eligible numbers
44.5% 93.5% 60.8% 23.5% 17.3% 58.2% 13.8% 17.7% Eligibility Rate
55 33 4 1 1 13 2 1 R Break-off
2967 1001 600 96 196 805 119 150 I Completes
98.2% 96.8% 99.3% 99.0% 99.5% 98.4% 98.3% 99.3% Completion Rate
16.5% 10.4% 13.6% 14.7% 29.1% 14.7% 20.1% 33.5% Response Rate

93
NOTE: ALL NUMBERS ARE PERCENTAGES. THE PERCENTAGES GREATER THAN ZERO BUT LESS
THAN 0.5 % ARE REPLACED BY AN ASTERISK (*). COLUMNS/ROWS MAY NOT TOTAL 100% DUE
TO ROUNDING. UNLESS OTHERWISE NOTED, ALL TRENDS REFERENCE SURVEYS FROM SOCIAL
& DEMOGRAPHIC TRENDS AND THE PEW RESEARCH CENTER FOR THE PEOPLE & THE PRESS.
ASK FORMS 1A AND 2A [n=1,469]: Q1 All in all, are you satisfied or dissatisfied with the way things are going in this country today?
Satisfied Dissatisfied (VOL.) DK/Ref
May 2010 29 65 6
March 2010 23 71 7
February 2010 23 71 6
January 2010 27 69 4
Late October 2009 25 67 7
Late September 2009 25 67 7
Mid-September 2009 30 64 7
Late August 2009 28 65 7
Mid-August 2009 28 65 7
July 2009 28 66 6
June 2009 30 64 5
Late April 2009 34 58 8
Mid-April 2009 23 70 7
January 2009 20 73 7
December 2008 13 83 4
Early October 2008 11 86 3
Mid-September 2008 25 69 6
August 2008 21 74 5
July 2008 19 74 7
June 2008 19 76 5
Late May 2008 18 76 6
March 2008 22 72 6
February 2008 30 62 8
Early February 2008 24 70 6
Late December 2007 27 66 7
October 2007 28 66 6
February 2007 30 61 9
Mid-January 2007 32 61 7
Early January 2007 30 63 7
December 2006 28 65 7
Mid-November 2006 28 64 8
Early October 2006 30 63 7
July 2006 30 65 5
June 2006 33 60 7
PEW SOCIAL & DEMOGRAPHIC TRENDS MAY 2010 ECONOMIC SURVEY
FINAL TOPLINE FOR SELECTED QUESTIONS MAY 11-MAY 31, 2010
TOTAL N=2,967

94
Q1 CONTINUED… Satisfied Dissatisfied (VOL.) DK/Ref
May 2006 29 65 6
March 2006 32 63 5
January 2006 34 61 5
Late November 2005 34 59 7
Early October 2005 29 65 6
July 2005 35 58 7
Late May 2005 39 57 4
February 2005 38 56 6
January 2005 40 54 6
December 2004 39 54 7
Mid-October 2004 36 58 6
July 2004 38 55 7
May 2004 33 61 6
Late February 2004 39 55 6
Early January 2004 45 48 7
December 2003 44 47 9
October 2003 38 56 6
August 2003 40 53 7
April 200344 50 41 9
January 2003 44 50 6
November 2002 41 48 11
September 2002 41 55 4
Late August 2002 47 44 9
May 2002 44 44 12
March 2002 50 40 10
Late September 2001 57 34 9
Early September 2001 41 53 6
June 2001 43 52 5
March 2001 47 45 8
February 2001 46 43 11
January 2001 55 41 4
October 2000 (RVs) 54 39 7
September 2000 51 41 8
June 2000 47 45 8
April 2000 48 43 9
August 1999 56 39 5
January 1999 53 41 6
November 1998 46 44 10
Early September 1998 54 42 4
Late August 1998 55 41 4
Early August 1998 50 44 6
February 1998 59 37 4
January 1998 46 50 4
September 1997 45 49 6
August 1997 49 46 5
44 Asked April 8, 2003 only; N=395

95
Q1 CONTINUED… Satisfied Dissatisfied
(VOL.) DK/Ref
January 1997 38 58 4
July 1996 29 67 4
March 1996 28 70 2
October 1995 23 73 4
June 1995 25 73 2
April 1995 23 74 3
July 1994 24 73 3
March 1994 24 71 5
October 1993 22 73 5
September 1993 20 75 5
May 1993 22 71 7
January 1993 39 50 11
January 1992 28 68 4
November 1991 34 61 5
Late February 1991 (Gallup) 66 31 3
August 1990 47 48 5
May 1990 41 54 5 Q5 Compared to your parents when they were the age you are now, do you think your own standard of living now is much
better, somewhat better, about the same, somewhat worse, or much worse than theirs was?
May Jan/Feb GSS GSS GSS GSS GSS GSS GSS GSS 2010 2008 2008 2006 2004 2002 2000 1998 1996 1994
31 Much better 38 31 35 39 35 35 33 33 32 26 Somewhat better 27 31 31 31 33 31 32 29 32 23 About the same 19 21 21 18 19 21 21 21 21 11 Somewhat worse 9 11 9 8 10 9 10 12 10 6 Much worse 5 5 3 3 2 3 3 3 3 3 Don‘t know/Refused (VOL.) 2 1 1 1 1 1 1 2 2
Q6 When your children are at the age you are now, do you think their standard of living will be much better, somewhat
better, about the same, somewhat worse, or much worse than yours is now? May Jan/Feb GSS GSS GSS GSS GSS GSS GSS GSS 2010 2008 2008 2006 2004 2002 2000 1998 1996 1994
24 Much better 26 27 28 23 26 28 22 20 16 21 Somewhat better 23 26 29 30 35 31 33 27 29 19 About the same 20 18 18 22 18 16 20 20 22 16 Somewhat worse 14 13 11 11 8 7 9 17 15 10 Much worse 7 5 3 3 2 3 3 5 5 6 No children (VOL.) 5 9 10 9 9 11 9 7 9 4 Don‘t know/Refused (VOL.) 5 3 1 2 2 4 4 4 4

96
Q7 If you were asked to use one of these commonly used names for the social classes, which would you say you belong in? The upper class, upper-middle class, middle class, lower-middle class, or lower class?
May 2010
Jan/Feb 2008
2 Upper class 2 18 Upper-middle class 19 50 Middle class 53 21 Lower-middle class 19 8 Lower class 6 1 Don‘t know/Refused (VOL.)
1
ASK IF GAVE ANSWER IN Q7 (Q7= 1-5) [n=2,929]: Q8 Do you feel you're falling out of the [INSERT Q7 RESPONSE], moving up from the [INSERT Q7 RESPONSE] or
are you pretty firmly in the [INSERT Q7 RESPONSE]?
12 Falling out of current class 16 Moving up from current class 70 Pretty firmly in current
class/Not moving (VOL.) 2 Don‘t know/Refused (VOL.)
ASK ALL: Q9 Do you agree or disagree: Although there may be bad times every now and then, America will always continue to be
prosperous and make economic progress? -----------Cambridge Reports/Research International-----------
May 2010
Jan 1995
Jan 1994
Jan 1993
April 1992
Jan 1992
Oct 1987
63 Agree 67 65 65 58 62 71 31 Disagree 27 29 30 36 32 11 6 Don‘t know/Refused (VOL.)
6 6 5 6 7 18

97
ASK ALL: Thinking now about the nation‘s economy … Q11 How would you rate economic conditions in this country today … as excellent, good, only fair, or poor?
Excellent Good
Only fair
Poor (VOL.) DK/Ref
May 2010 1 14 46 38 1
March 2010 1 6 39 53 1
February 2010 1 7 38 53 1
December 2009 1 7 41 50 1
Late October 2009 * 8 41 50 1
Late September 2009 1 8 43 48 1
Mid-August 2009 * 8 38 52 2
June 2009 1 8 39 52 1
March 2009 * 6 25 68 1
February 2009 * 4 24 71 1
December 2008 * 7 33 59 1
November 2008 1 6 28 64 1
Late October 2008 * 7 25 67 1
Early October 2008 1 8 32 58 1
Late September 2008 * 7 27 65 1
July 2008 1 9 39 50 1
April 2008 1 10 33 56 *
March 2008 1 10 32 56 1
Early February 2008 1 16 36 45 2
January 2008 3 23 45 28 1
November 2007 3 20 44 32 1
September 2007 3 23 43 29 2
June 2007 6 27 40 25 2
February 2007 5 26 45 23 1
December 2006 6 32 41 19 2
Early November 2006 (RVs) 9 35 37 17 2
Late October 2006 6 27 40 25 2
September 2006 5 32 41 20 2
March 2006 4 29 44 22 1
January 2006 4 30 45 19 2
Early October 2005 2 23 45 29 1
Mid-September 2005 3 28 44 24 1
Mid-May 2005 3 29 47 20 1
January 2005 3 36 45 15 1
December 2004 3 33 43 20 1
Early November 2004 (RVs) 5 31 37 26 1
Mid-September 2004 4 34 40 20 2
August 2004 3 30 45 21 1
Late April 2004 4 34 38 22 2
Late February 200445 2 29 42 26 1
45 Earlier trends available from Gallup.

98
Q12 How would you describe your household‘s financial situation? Would you say you (READ) …
May 2010 July 2009 Jan 2008 30 Live comfortably 33 38 30 Meet your basic expenses with a little left over for extras 27 32 27 Just meet your basic expenses, or 26 22 11 Don‘t even have enough to meet basic expenses 11 7 1 Don‘t know/Refused (VOL.) 2 1
Q13 Over the course of the next year, do you think the financial situation of you and your family will improve a lot,
improve some, get a little worse or get a lot worse?
Improve
a lot Improve
some
Get a little
worse
Get a lot
worse
(VOL.)
Stay the same (VOL.) DK/Ref
May 2010 10 52 14 5 16 4
March 2010 9 52 15 8 12 4
December 2009 9 44 19 8 15 4
Late October 2009 6 50 19 8 13 4
Late September 2009 10 49 17 6 13 4
August 2009 8 47 17 8 15 5
June 2009 9 54 17 7 9 4
February 2009 7 47 22 7 13 4
December 2008 7 49 21 6 13 4
Early October 2008 8 51 20 6 9 6
July 2008 7 44 21 7 14 7
March 2008 10 45 20 7 13 5
January 2008 11 49 16 6 14 4
September 2007 10 52 14 4 16 4
February 2007 11 52 12 3 19 3
December 2006 10 57 13 3 14 3
January 2006 10 51 14 5 16 4
Mid-May 2005 10 51 15 5 15 4
January 2005 10 54 14 4 15 3
August 2004 13 57 9 3 12 6
September 2003 11 53 15 4 14 3
Late March 2003 12 51 15 4 11 7
January 2003 9 51 18 5 13 4
Early October 2002 10 54 13 5 12 6
June 2002 11 55 15 4 11 4
January 2002 12 53 15 5 11 4
Late September 2001 9 46 16 4 17 8
June 2001 11 52 15 4 14 4
January 2001 11 46 18 9 12 4
January 1999 17 55 7 3 14 4
May 1997 12 56 10 2 17 3
February 1995 11 53 13 3 17 3
March 1994 10 57 11 3 16 3
October 1992 U.S. News 9 51 14 3 15 8
August 1992 U.S. News 6 50 20 5 14 5
May 1992 U.S. News 8 49 22 4 13 4
January 1992 U.S. News 9 46 19 5 16 5

99
We‘re interested in people‘s experiences during the economic recession, which began about two-and-a-half years ago in December 2007. Q14 Do you think the U.S. economy is still in a recession, starting to come out of a recession, or do you think the recession
is over?
54 Still in a recession 41 Starting to come out of the recession 3 Recession is over 3 Don‘t know/Refused (VOL.)
RANDOMIZE Q15/16 AND Q17/18/19 IN BLOCKS: Q15 Has the recession caused major changes in the U.S. economy, minor changes, or hasn‘t the recession changed the
economy one way or another?
70 Major 21 Minor 6 Hasn‘t changed the economy 3 Don‘t know/Refused (VOL.)
ASK IF MAJOR OR MINOR (Q15 = 1 or 2): [n=2,720] Q16 Do you think most of these changes are permanent, or do you think they are mostly temporary?
24 Permanent 68 Temporary 5 Some permanent, others temporary (VOL.) 4 Don‘t know/Refused (VOL.)
Q15/Q16 COMBINED: Has the recession caused major changes in the U.S. economy, minor changes, or hasn‘t the recession changed the
economy one way or another? Do you think most of these changes are permanent, or do you think they are mostly temporary?
70 Major 18 Permanent 45 Temporary 4 Some permanent, others temporary (VOL.) 3 Don‘t know/Refused (VOL.) 21 Minor 4 Permanent
16 Temporary * Some permanent, others temporary (VOL.) * Don‘t know/Refused (VOL.) 6 Hasn‘t changed the economy 3 Don‘t know/Refused (VOL.)
ASK ALL: Q17 Has the recession caused major changes in the way YOU live, minor changes, or hasn‘t the recession changed the way
you live one way or another?
25 Major 44 Minor 31 Hasn‘t changed the way you live 1 Don‘t know/Refused (VOL.)

100
ASK IF MAJOR OR MINOR (Q17 = 1 OR 2): [n=2,134] Q18 Do you think most of these changes are permanent, or do you think they are mostly temporary?
30 Permanent 67 Temporary 2 Some permanent, others temporary (VOL.) 2 Don‘t know/Refused (VOL.)
Q17/Q18 COMBINED: Has the recession caused major changes in the way YOU live, minor changes, or hasn‘t the recession changed the way
you live one way or another? Do you think most of these changes are permanent, or do you think they are mostly temporary?
25 Major 8 Permanent
15 Temporary 1 Some permanent, others temporary (VOL.) 1 Don‘t know/Refused (VOL.) 44 Minor 12 Permanent 31 Temporary 1 Some permanent, others temporary (VOL.) 1 Don‘t know/Refused (VOL.) 31 Hasn‘t changed the way you live 1 Don't know/Refused (VOL.)
ASK IF MAJOR OR MINOR IN Q17 (Q17 = 1 OR 2): [n=2,134] Q19 What is the biggest change that the recession has made in the way YOU live? (OPEN-END. ACCEPT ONE
RESPONSE. IF ANSWERS ARE VAGUE SUCH AS “FINANCES” OR “THE OVERALL ECONOMY” PROBE FOR A MORE SPECIFIC RESPONSE)
38 NET Spending changes 15 Limiting spending; more careful about spending; budgeting 7 Cut back on luxury items; only buying necessities; learning to do without 5 Less eating out 3 Less travel 3 Lower standard of living/cutting back on everything 2 Cutting back on use of gas and utilities 2 Different shopping habits 1 Postpone major expenditures * Buying less on credit 19 NET Personal finance 5 Finances (general) 4 Can‘t pay bills/hard to pay bills/not enough money 4 Loss of income 2 Saving more 2 No discretionary money; no spending money 1 Will have to work longer before retiring/change in retirement plans 1 Lost savings; lost investments; lost money in stock market * Less able to save/saving less * Taken on more debt

101
Q19 CONTINUED… 18 NET Employment changes 6 Lost job; unemployed; spouse lost job 4 Can‘t find a job/terrible job market 4 Loss of job security/other job mentions 2 Salary reduced; hours reduced 2 Business has slowed/business affected 1 No raise at work * Took lower-paying job 6 Cost of living; higher prices (food, gas, utilities) 3 Fear, anxiety, worry about the future (and children‘s/parent‘s future) 2 Changes in living arrangements 1 Education costs/taking fewer courses 1 Heath care costs; no health insurance 1 Nothing changed * Value of home or real estate has declined/can‘t sell * Personal problems /divorce 4 Other 7 Don‘t know/Refused
ASK ALL: Q20 Thinking about your household‘s current financial situation, are you in better shape or worse shape NOW than you
were BEFORE the recession started?
21 Better 48 Worse 29 No different/stayed the same (VOL.) 2 Don‘t know/Refused (VOL.)
ASK IF BETTER (Q20 =1): [n=545] Q20a Would you say you are in much better shape or just a little better shape now than before the recession?
27 Much better 71 A little better 2 Don‘t know/Refused (VOL.)
ASK IF WORSE (Q20 =2): [n=1,591] Q20b Would you say you are in much worse shape or just a little worse shape now than before the recession?
33 Much worse 67 A little worse 1 Don‘t know/Refused (VOL.)

102
Q20/Q20a/Q20b COMBINED: Thinking about your household‘s current financial situation, are you in better shape or worse shape NOW than you
were BEFORE the recession started? Would you say you are in much better shape or just a little better shape now than before the recession? Would you say you are in much worse shape or just a little worse shape now than before the recession?
21 Better 6 Much better
15 A little better * Don‘t know/Refused (VOL.) 48 Worse 16 Much worse 32 A little worse * Don‘t know/Refused (VOL.) 29 No different/stayed the same (VOL.) 2 Don‘t know/Refused (VOL.)
No Q21
ASK IF WORSE IN Q20 (Q20 = 2): [n=1,591] Q22 Considering everything, how long do you think it will take you and your family to recover financially from the effects
of the recession? Would you say it will take less than a year, one to two years, three to five years, six to 10 years, or longer than 10 years? (DO NOT NEED TO CONTINUE READING CATEGORIES IF R GIVES ANSWER)
32 Two years or less 5 Less than a year
27 One to two years 40 Three to five years 21 Six years or longer 13 Six to 10 years 8 Longer than 10 years 2 Never (VOL.) 2 Recession not over/depends on how long recession continues (VOL.) 4 Don‘t know/Refused (VOL.)
RANDOMIZE Q23/24a-c and Q25/26a-c IN BLOCKS ASK ALL: Q23 Since the recession started, have you cut back on household spending, have you increased spending, or have you been
spending about as much as you did before the recession began?
62 Cut back on spending 6 Increased spending
30 Spent about as much 1 Don‘t know/Refused (VOL.)
ASK IF CUT BACK ON SPENDING (Q23=1): [n=1,948] Q24a When the economy improves, will you continue to spend less than you did before the recession, will you spend more
than you did, or will you spend about as much as you did before the recession began?
41 Spend less 11 Spend more 47 Spend about as much 2 Don‘t know/Refused (VOL.)

103
ASK IF INCREASED SPENDING (Q23 = 2): [n=158] Q24b When the economy improves, will you continue to spend more than you did before the recession, will you spend less
than you did, or will you spend about as much as you did before the recession began?
24 Spend less 26 Spend more 48 Spend about as much 2 Don‘t know/Refused (VOL.)
ASK IF SPENT ABOUT AS MUCH (Q23 = 3): [n=837] Q24c When the economy improves, will you continue to spend about as much as you did before the recession, will you
spend more than you did, or will you spend less than you did before the recession began?
14 Spend less 11 Spend more 73 Spend about as much 2 Don‘t know/Refused (VOL.)
RANDOMIZE Q23/24a-c and Q25/26a-c IN BLOCKS ASK ALL: Q25 Since the recession started, have you had to cut back on the amount you save, are you saving more or are you saving
about as much as you did before the recession began?
47 Cut back on saving/saving less 14 Saving more 34 Saving about as much 4 Don‘t know/Refused (VOL.)
ASK IF SAVING LESS (Q25 = 1): [n=1,463] Q26a When the economy improves, will you continue to save less than you did before the recession, will you save more than
you did or will you save about as much as you did before the recession began?
10 Save less 50 Save more 35 Save about as much 4 Don‘t know/Refused (VOL.)
ASK IF SAVING MORE (Q25 = 2): [n=437] Q26b When the economy improves, will you continue to save more than you did before the recession, will you save less than
you did or will you save about as much as you did before the recession began?
5 Save less 62 Save more 32 Save about as much 1 Don‘t know/Refused (VOL.)
ASK IF SAVING ABOUT AS MUCH (Q25 = 3): [n=946] Q26c When the economy improves, will you continue to save about as much as you did before the recession, will you save
more than you did or will you save less than you did before the recession began?
5 Save less 44 Save more 49 Save about as much 1 Don‘t know/Refused (VOL.)

104
ASK ALL: Q27 Now I‘d like you to think about the money you owe on your credit cards, mortgage, car loans and other kinds of loans.
During the recession, did you have to borrow more money to pay your monthly bills, or did you take steps to cut back what you owe?
13 Borrowed more 50 Cut back 19 Neither borrowed more nor cut back (VOL.) 2 Did both (VOL.)
15 No debts/loans (VOL.) 1 Don‘t know/Refused (VOL.)
Q28 When the economy improves, do you think the amount of money you borrow FOR ANY PURPOSE will increase,
decrease or remain about the same?
9 Increase 30 Decrease 54 Remain about the same 7 Don‘t know/Refused (VOL.)
OWN/RENT Do you own or rent your home?
63 Own 31 Rent 6 Other arrangement (VOL.) * Don‘t know/Refused (VOL.)
ASK IF HOMEOWNER (OWN/RENT=1): [n=1,937] Q29 And have you paid off all, more than half, about half or less than half of the money you owe on your home?
May 2010
Jan/Feb 2008
33 All 30 17 More than half 18 13 About half 10 35 Less than half 38 3 Don‘t know/Refused (VOL.)
4
ASK ALL: Q30 Some people say that buying a home is the best long-term investment in the United States. Do you strongly agree,
somewhat agree, somewhat disagree, or strongly disagree?
May 2010
CBS/New York Times April 1991
39 Strongly agree 49 41 Somewhat agree 35 10 Somewhat disagree 9 7 Strongly disagree 4 3 Don‘t know/Refused (VOL.)
3

105
ASK IF HOMEOWNER (OWN/RENT=1): [n=1,937] Q31 Since the recession began in December 2007, has the value of your home gone up, gone down, or stayed about the
same? [IF GONE UP/DOWN: Has it gone (INSERT RESPONSE: up/down) a lot, or just a little?]
13 Gone up 4 Gone up a lot 8 Gone up a little 48 Gone down 22 Gone down a little 26 Gone down a lot 33 Stayed same 1 Bought home recently/Too soon to tell (VOL.) 5 Don‘t know/Refused (VOL.)
ASK THOSE WHO SAY GONE DOWN (Q31 = 3,4): [n=934] Q32 Considering everything, how long do you think it will take for the value of your home to recover from the effects of the
recession? Would you say it will take less than a year, one to two years, three to five years, six to 10 years, or longer than 10 years? (DO NOT NEED TO CONTINUE READING CATEGORIES IF R GIVES ANSWER)
10 Two years or less 1 Less than a year 8 One to two years 47 Three to five years 39 Six years or longer 29 Six to 10 years 10 Longer than 10 years 1 Never (VOL.) * Recession not over/depends on how long recession continues (VOL.) 3 Don‘t know/Refused (VOL.)
ASK HOMEOWNERS WITH A MORTGAGE (Q29=2-9): [n=1,307] Q33a Now I‘d like you to think about how much you could sell your home for today and how much you still owe on your
home. Do you currently owe more on your home than you could sell it for today, or not?
21 Yes, owe more 73 No 1 No mortgage (VOL.) 5 Don‘t know/Refused (VOL.)

106
ASK ALL: Q34 For each of the following, please tell me whether or not it is something that has happened to you during the recession. ...Have you [INSERT ITEM; RANDOMIZE; OBSERVE FORM SPLITS]?
Yes No
(VOL.) Does not
apply
(VOL.) DK/Ref
a. Had trouble getting or paying for medical care for yourself or your family 27 71 1 *
b. Had problems paying your rent or mortgage 20 76 5 *
c. Borrowed money from a family member or friend to help pay the bills 24 76 * *
d. Cut back or canceled vacation travel 57 39 4 *
e. Bought less expensive brands or shopped more at discount stores 71 26 2 1
No item f.
ASK FORM 1: [n=1,484]
g. Lost your house to foreclosure 2 95 3 *
h. Moved back in with your parents after living on your own 9 87 4 *
i. Had to increase your credit card debt to help pay the bills 15 78 6 *
ASK FORM 2: [n=1,483]
j. Loaned money to someone to help them with expenses or pay their bills 49 50 * 1
k. Postponed getting married or having a baby 11 75 13 1
l. Cut back spending on alcohol or cigarettes 30 37 32 *
ASK ALL: M.1 Are you currently married, living with a partner, divorced, separated, widowed, or have you never been married? (IF
R SAYS “SINGLE,” PROBE TO DETERMINE WHICH CATEGORY IS APPROPRIATE)
54 Married 7 Living with a partner 9 Divorced 2 Separated 6 Widowed
21 Never been married * Don‘t know/Refused (VOL.)

107
ASK ALL: Q35 Overall, how confident are you that YOU (IF M1=1: and your spouse) will have enough income and assets to last
throughout your retirement years? Are you [READ LIST]?
May 2010
Feb 2009
23 Very confident 30 41 Somewhat confident 41 19 Not too confident 16 13 Not at all confident 9
1 Won‘t have anything/haven‘t been able to save (VOL.) n/a
3 Don‘t know/Refused (VOL.) 3 ASK IF MARRIED (M.1 =1): [n=1,532] E5 Is your spouse now employed full-time, part-time or not employed?
54 Full-time 10 Part-time 35 Not employed 1 Don‘t know/Refused (VOL.)
ASK ALL: Q36 Do you (IF M1=1: or your spouse) (READ AND RANDOMIZE – ALWAYS ASK ITEM b LAST) a. Own any stocks, bonds or mutual funds
May 2010
Jan/Feb 2008
37 Yes 44
61 No 55
2 Don‘t know/Refused (VOL.) 1
b. Have a checking or savings account, or some other form of savings
85 Yes
14 No
1 Don‘t know/Refused (VOL.)
c. Have an IRA, 401K or a similar kind of retirement account
May 2010
Jan/Feb 2008
55 Yes 57
43 No 41
1 Don‘t know/Refused (VOL.) 2
ASK IF RESPONDENT OWNS ANY STOCKS, BONDS, MUTUAL FUNDS (Q36a = 1): [n=1,181] Q37 During the recession, did you have to sell some of your stocks, bonds or other investments to meet expenses or pay
your bills, or not?
19 Yes
80 No
* Don‘t know/Refused (VOL.)

108
ASK IF RESPONDENT HAS CHECKING OR SAVINGS ACCOUNT OR RETIREMENT SAVINGS (Q36b or Q36c = 1): [n=2,608] Q37a During the recession, did you have to withdraw money from your savings, 401(k) or other retirement accounts to meet
expenses or pay your bills, or not?
41 Yes
58 No
1 Don‘t know/Refused (VOL.)
ASK IF RESPONDENT HAS ANY INVESTMENTS OR SAVINGS (Q36 a, b or c = 1): [n=2,624] Q38 Since the recession began, have you changed the way you are investing or saving your money?
57 Yes
42 No
1 Don‘t know/Refused (VOL.)
ASK IF RESPONDENT HAS MADE CHANGES IN INVESTMENTS/SAVINGS (Q38 =1): [n=1,537] Q39 As a result of those changes, are you now investing or saving more cautiously or more aggressively?
74 More cautiously
14 More aggressively
3 Doing both (VOL.)
9 Don‘t know/Refused (VOL.)
ASK ALL: AGE What is your age?
22 18-29
33 30-49
26 50-64
17 65+
2 Don‘t know/Refused (VOL.)
E1 Are you currently retired?
23 Yes
4 Yes, semi-retired or ―still do some type of work‖ (VOL.)
70 No
2 Disabled (VOL.)
* Don‘t know/Refused (VOL.)
ASK IF DISABLED (E1=4): [n=99] E1a Are you able to work, or not?
24 Yes, able to work 75 No, not able to work [SKIP TO DEMOGRAPHICS ]46 1 Don‘t know/Refused (VOL.)
46 Q40 through Q67 were not asked of respondents who are fully disabled (E1a=2) [n=80].

109
ASK IF NOT RETIRED (E1=3) AND AGE 62 OR OLDER: [n=110] Q40 Have you delayed your retirement because of the recession, or not?
May 2010
Trend for Comparison July 200947
35 Yes 38
61 No 61
3 Don‘t know/Refused (VOL.) 1
ASK IF NOT RETIRED (E1=3) AND AGE 50-61: [n=600] Q41 Do you think you might have to delay your retirement because of the recession, or not?
May 2010
Trend for Comparison
July 200948
60 Yes 63
34 No 31
5 Don‘t know/Refused (VOL.) 5
ASK ALL: E2 Are you now enrolled in school, either full or part-time, or not?
9 Yes, full-time student
7 Yes, part-time
82 No
2 Don‘t know/Refused (VOL.)
ASK ALL : E3 (IF E1=1,2: Some people who have retired do some type of work for pay…/IF E2=1,2 & E1=3,9: Some students
also do some type of work for pay/IF E1=4: Some people who are disabled do some type of work for pay…) Are you now employed full-time, part-time or not employed?
60 Employed
45 Full-time
15 Part-time
38 Not employed
2 Fully disabled/not able to work
* Don‘t know/Refused (VOL.)
ASK IF NOT EMPLOYED (E3 = 3): [n=1,271] Q42 Would you like to have a job, whether full or part-time, or not?
45 Yes
54 No
1 Don‘t know/Refused (VOL.)
47 In July 2009, the question was worded as follows: ―Have you had to delay your retirement because of current economic conditions, or not?‖ 48 In July 2009, the question was worded as follows: ―Do you think you might have to delay your retirement because of current economic conditions, or not?‖

110
ASK IF NOT EMPLOYED AND WOULD LIKE TO HAVE A JOB (E3 = 3 AND Q42 = 1): [n=830] Q43 Could you start a job now if one were offered to you?
75 Yes
20 No
6 Don‘t know/Refused (VOL.)
ASK IF WORKING PART-TIME (E3=2): [n=467] E3a Would you prefer to be working full-time, or not?
47 Yes, prefer full-time
52 No
1 Don‘t know/Refused (VOL.)
ASK IF WORKING PART-TIME AND PREFER FULL-TIME (E3=2 AND E3a = 1): [n=238] Q44 Are you working part-time because you could not find full-time work, your employer cut back your hours, or is there some other reason?
37 Could not find full-time work
23 Employer cut back hours
39 Other reason
1 Don‘t know/Refused (VOL.)
ASK ALL WORKING (E3=1,2): [n=1,604] E3c. Are you self-employed, or not? [INTERVIEWER INSTRUCTION: IF R MENTIONS MORE THAN ONE
JOB/EMPLOYER ASK ABOUT THEIR “main job”]
22 Yes, self-employed (includes independent contractor, freelance worker)
78 No, not self-employed
* Don‘t know/Refused (VOL.)
ASK ALL WORKING (E3=1,2): [n=1,604] Q45 Overall, how satisfied are you with your job? Are you (READ) May 2010
July 2009
Jan 2008
June 2006
PSRA49 July 1997
Gallup July 1989
86 Satisfied (NET) 90 87 89 86 89 32 Completely satisfied 30 31 28 24 28 54 Mostly satisfied 60 56 61 62 61 12 Dissatisfied (NET) 9 12 10 13 11 7 Mostly dissatisfied 7 10 8 10 8 4 Completely dissatisfied 2 3 2 3 3 2 Don‘t know/Refused (VOL.) 1 * 1 1 *
49 The July 1997 PSRA question was worded ―Overall, how satisfied or dissatisfied are you with your current job? Are you…[READ
RESPONSES]‖

111
ASK IF NOT EMPLOYED (E3=3): [n=1,271] Q46 You said you are not employed. Just to be sure, in the last week did you do any work for pay?
9 Yes
83 No
8 Retired (VOL.)
* Don‘t know/Refused (VOL.)
ASK IF EMPLOYED (E3=1,2): [n=1,604] Q49 Here are two different ways of looking at your job. Some people get a sense of identity from their job. For other
people, their job is JUST what they do for a living. Which of these best describes the way you usually feel about your job?
May
2010 June
2006 Gallup
Aug 2003 Gallup
Aug 1999 Gallup
May 1993 Gallup
July 1989 49 Sense of identity 51 56 51 58 57 49 Just what do for a living 45 43 47 41 40 2 Don‘t know/Refused (VOL.) 4 1 2 1 3
ASK IF EMPLOYED (E3=1,2): [n=1,604] Q50 For each of the following, please tell me whether or not it is something that happened to you during the recession....
Have you [INSERT ITEM; RANDOMIZE]?
Yes No (VOL.) DK/Ref
a. Gotten a pay raise at your current job 38 61 1
b. Gotten a better job or a promotion at your current job 20 79 1
c. Been ordered by your employer to take time off without pay or take unpaid leave 12 87 1
d. Taken a cut in pay 23 77 *
e. Had your work hours reduced 28 72 1
f. Been forced to switch from a full-time to a part-time job 11 89 *
g. Had to work more overtime or longer hours 33 66 *
ASK IF EMPLOYED (E3=1,2): [n=1,604] Q51 Would you say you have more qualifications than the job requires, the right amount of qualifications that the job
requires or only some of the qualifications the job requires?
41 More
51 Right amount
7 Only some
2 Don‘t know/Refused (VOL.)

112
ASK IF EMPLOYED (E3 = 1,2): [n=1,604] Q52 Since the recession started in December 2007, was there a time when you were out of work AND LOOKING FOR A
JOB?
26 Yes
73 No [SKIP TO Q67]
1 Retired/Does not apply (student, homemaker, disabled) (VOL.) [SKIP TO Q67]
* Laid off/break in work, resumed same job (VOL.) [SKIP TO Q61]
* Don‘t know/Refused (VOL.) [SKIP TO Q67]
ASK IF UNEMPLOYED NOW OR UNEMPLOYED SOMETIME DURING RECESSION/DK (E3=3 OR Q52=1): [n=1,647] Q53 IF UNEMPLOYED (E3=3): Since the recession started, how many times, INCLUDING THIS TIME, have you been
unemployed? IF EMPLOYED (E3=1,2): Since the recession started, how many times have you been unemployed?
60 One time
9 Two times
11 Three or more times
20 Don‘t know/Refused (VOL.)
ASK IF UNEMPLOYED AND OUT OF WORK MORE THAN ONE TIME DURING RECESSION (E3=3 AND Q53=2-8): [n=207] Q54a-c And what was the LONGEST period of time you were out of work? [INTERVIEWER: PROBE IF NECESSARY;
RECORD AS MONTHS IF LESS THAN ONE YEAR. 12 MONTHS SHOULD BE RECORDED AS 1 YEAR. IF MORE THAN ONE YEAR RECORD AS YEARS AND MONTHS]
ASK IF NOT SURE/DON’T KNOW (CODE 99 TO Q54a, b, c): Q54d Was it less than three months, or was it three months or longer?
5 Less than three months
91 Three months or longer
5 Three to five months
16 Six to 11 months
27 One year
33 Two years or longer
8 Unspecified
1 Never worked/Homemaker (VOL.)
3 Don‘t know/Refused (VOL.)
Q55/56 COMBINED: BASED ON THOSE WHO ARE EMPLOYED BUT WERE UNEMPLOYED AT LEAST ONCE DURING THE RECESSION: [n=360] ASK IF EMPLOYED AND OUT OF WORK ONCE DURING RECESSION (E3=1,2 & Q53=1): Q55a-c How long were you out of work and looking for a job? [INTERVIEWER: PROBE IF NECESSARY; RECORD AS
MONTHS IF LESS THAN ONE YEAR. 12 MONTHS SHOULD BE RECORDED AS 1 YEAR. IF MORE THAN ONE YEAR RECORD AS YEARS AND MONTHS]
ASK IF NOT SURE/DON’T KNOW (CODE 99 TO Q55a, b, c): Q55d Was it less than three months, or was it three months or longer? ASK IF EMPLOYED AND OUT OF WORK MORE THAN ONCE DURING RECESSION (E3=1,2 AND Q53=2-8): Q56a-c And what was the LONGEST period of time you were out of work? [INTERVIEWER: PROBE IF NECESSARY;
RECORD AS MONTHS IF LESS THAN ONE YEAR. 12 MONTHS SHOULD BE RECORDED AS 1 YEAR. IF MORE THAN ONE YEAR RECORD AS YEARS AND MONTHS]

113
ASK IF NOT SURE/DON’T KNOW (CODE 99 TO Q56a, b, c): Q56d Was it less than three months, or was it three months or longer?
20 Less than three months
80 Three months or longer
27 Three to five months
26 Six to 11 months
16 One year
9 Two years or longer
1 Unspecified
* Never worked/Homemaker (VOL.)
* Don‘t know/Refused (VOL.)
ASK IF UNEMPLOYED NOW OR UNEMPLOYED SOMETIME DURING RECESSION (E3=3 OR Q52 = 1): [n=1,647] Now I would like you to think of the job you had BEFORE you were last out of work. Q57 Were you employed full-time or part-time?
72 Full-time
24 Part-time
4 Not employed/student/never employed (VOL.) [SKIP TO Q61]
1 Don‘t know/Refused (VOL.)
ASK IF EMPLOYED NOW BUT UNEMPLOYED SOMETIME DURING RECESSION (E3=1,2 AND Q52=1): [n=376] Q58 Does your new job pay more, less or about the same as your last job?
38 More
39 Less
22 Same
* Don‘t know/Refused (VOL.)
ASK IF EMPLOYED NOW BUT UNEMPLOYED SOMETIME DURING RECESSION (E3=1,2 AND Q52=1): [n=376] Q59 Does your new job have better benefits, worse benefits or about the same benefits as your last job?
26 Better
28 Worse
39 Same
5 Don‘t know/Refused (VOL.)
ASK IF EMPLOYED NOW BUT UNEMPLOYED SOMETIME DURING RECESSION (E3=1,2 AND Q52=1): [n=376] Q60 Considering everything, is your new job better, worse or about the same as your last job?
43 Better
24 Worse
30 Same
2 Don‘t know/Refused (VOL.)

114
ASK IF UNEMPLOYED NOW OR UNEMPLOYED SOMETIME DURING RECESSION (E3=3 OR Q52=1). RESULTS SHOWN BASED ONLY ON THOSE EMPLOYED NOW BUT UNEMPLOYED SOMETIME DURING RECESSION [n=376] Q61 IF EMPLOYED NOW BUT UNEMPLOYED SOMETIME DURING RECESSION (E3=1,2 AND Q52=1):
When you were unemployed and looking for work, did you … (INSERT AND RANDOMIZE)?
Yes No (VOL.) DK/Ref
a. Move(d) or consider(ed) moving to another part of the state or country where there might be more jobs, or not 39 60 1
b. Change(d) your career or field, or seriously consider(ed) changing your career or
field, or not 60 39 1
c. Pursue(d) any job retraining programs or educational opportunities, or not 36 63 1
No Q62 ASK ALL: Q70 Compared to what it was before the recession, has your family income increased, decreased or stayed about the same?
14 Increased
34 Decreased
49 Stayed about the same
3 Don‘t know/Refused (VOL.)