Embed Size (px)
Citation preview
TP53
-mut
ated
sam
ples
(%)
M-class C-class
MissenseTruncating
1:2.45
1:3.85
0
10
20
30
40
50
60
TP53 Mutation Type
70
Copy Number Alterations in M-class
TP53 WT TP53 mut
0
2
4
6
8
Rec
urre
nt C
opy
Num
ber A
ltera
tions
a b
Supplementary Figure 1
Supplementary Figure 1: TP53-mutated tumors a, TP53-mutated tumors within the M-class have a higher number of recurrent copy number alterations (for all SFEs) than TP53 wild type samples. b, While both missense (residue-changing) and truncating TP53 mutations are more frequent in the C-class than in the M-class, this enrichment is significantly stronger for truncating mutations.
Nature Genetics: doi:10.1038/ng.2762
No. of recurrent CNAs
No.
of r
ecur
rent
mut
atio
ns
OnlyTumor fromMutated class
Only tumors fromCN-Altered class
Both are present
Ratio of tumors fromthe two classes
Supplementary Figure 2
0 10 20 30 40
010
2030
40
No. of CNA
No.
of m
utat
ions
0 10 20 30 40
010
2030
40
0 10 20 30 40
010
2030
40
0 10 20 30 40
010
2030
40
0 10 20 30 40
010
2030
40
0 10 20 30 40
010
2030
40
0 10 20 30 40
010
2030
40
0 10 20 30 40
010
2030
40
0 10 20 30 40
010
2030
40
0 10 20 30 40
010
2030
40
0 10 20 30 40
010
2030
40
0 10 20 30 40
010
2030
40No. of CNA No. of CNA No. of CNA
No.
of m
utat
ions
No.
of m
utat
ions
No.
of m
utat
ions
No. of CNA
No.
of m
utat
ions
No. of CNA No. of CNA No. of CNA
No.
of m
utat
ions
No.
of m
utat
ions
No.
of m
utat
ions
No. of CNA
No.
of m
utat
ions
No. of CNA No. of CNA No. of CNA
No.
of m
utat
ions
No.
of m
utat
ions
No.
of m
utat
ions
ALL TUMORS BLCA BRCA COADREAD
GBM HNSC KIRC LAML
LUAD LUSC OV UCEC
Supplementary Figure 3
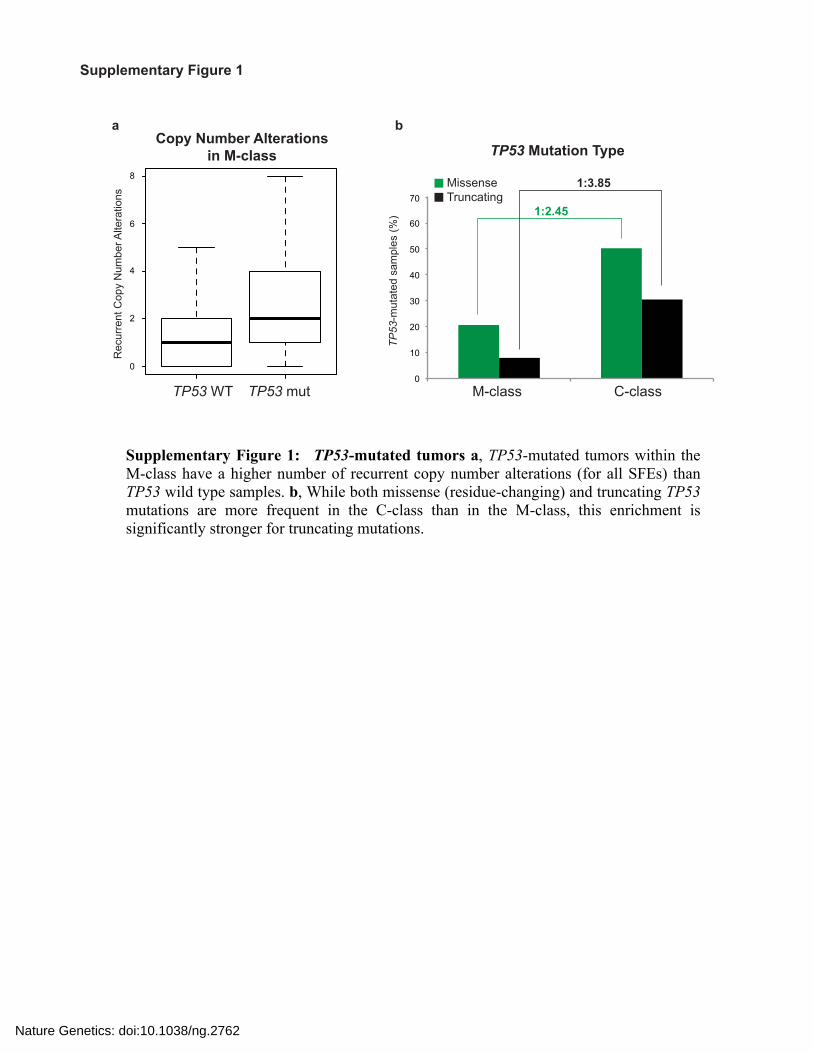
Supplementary Figure 2: Mutations versus copy number alterations. Tumors with more recurrent mutations than copy number alterations predominantly are in the M-class (increasing intensity of green), while tumors with more recurrent copy number alterations mostly are in the C-class (increasing intensity of red). Similar levels of both type of alterations are in tumors at the border between the two classes (grey).
Supplementary Figure 3: Distribution of mutations and copy number changes across different tumor types. Samples from different tumor types and subtypes vary in the number of recurrent copy number alterations (X-axis) and number of recurrent mutations (Y-axis).
Nature Genetics: doi:10.1038/ng.2762
ProstateAdenocarcinoma(170)
PancreasAdenocarcinoma
(27)
Cervical Squamous Cell Carcinoma and Endocervical Adenocarcinoma(35)
Thyroid PapillaryCarcinoma
(400)
StomachAdenocarcinoma(219)
Skin CutaneousMelanoma (58)
Independent TCGA Dataset (ITD) PANCAN18 Hyperbola
40
30
20
10
0
0 10 20 30 40
PANCAN12ITD
BRAF-mutantThyroid-enriched
class
PANCAN18
C-class
M-class
(378) (1734)
(2069)
150
100
500
5010
0
High Amp.Hom. Del.Mutations
# of
Rec
urre
nt M
utat
ions
# of Recurrent Copy Number Alterations
Enric
hmen
t [-lo
g(q)
]
M-class vs C-class (PANCAN18)
KRAS
PIK3CA
APC
ARID1A
TP53 (q = 8E-219)
8q24 (MYC)
3q26
Alterations Enriched in M-class
Alterations Enriched in C-class
τ = 0.9*
a b
c d
Characterized by somatic mutations
Characterized by CNAs
Supplementary Figure 4
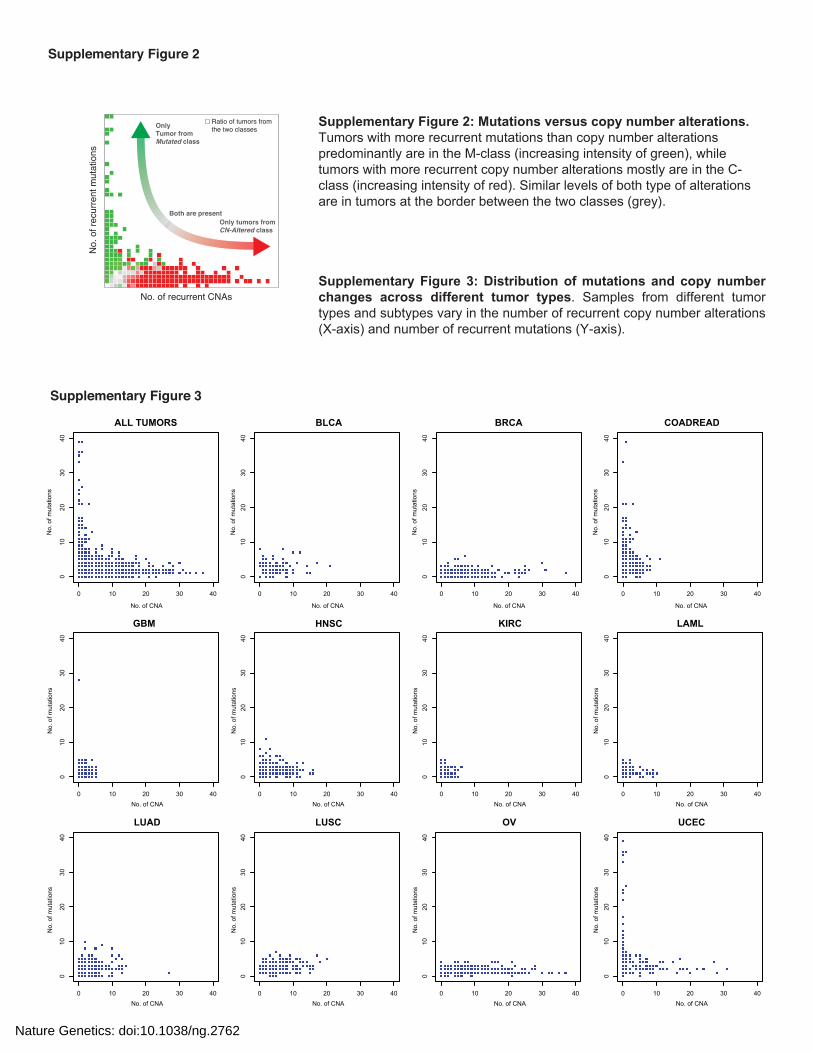
Supplementary Figure 4: Robustness of classes and features - validation in enlarged dataset. a, An independent dataset consisting of 909 samples from 6 tumor types was integrated with our original dataset (PANCAN12). b, Samples from the resulting set of 18 tumor types (PANCAN18) confirmed the inverse relationships between copy number alterations and mutations, with the newly added samples following the same inverse trend (red squares) we originally observed (gray squares). c, A stratification of the PANCAN18 dataset identifies two main modules of similar size and a small subgroups enriched in BRAF-mutant thyroid samples. These thyroid tumors emerged separately as strongly characterized by BRAF V600E mutations and otherwise depleted of any other SFE. Nonetheless, these tumors do not violate the distinction between tumors primarily characterized by copy number alterations (C-class) and tumors characterized by mutations (M-class), of which thyroid samples are a subset. d, The ranked list of SFEs, with the first of the list being the most enriched in the M-class and the last the most enriched in C-class, is almost perfectly concordant with the same ranked list obtained in the PANCAN12 dataset (Kendall correlation coefficient tau = 0.9).
Nature Genetics: doi:10.1038/ng.2762
ALLTUMORS
M1M2M3M4M5M6M7M8
M9M10M11M12M13M14
M15
M16
M17
C7
C8C9
C10C11C12
C13
C14
C1C2C3C4C5C6
M
Mutations on APC (50%), PTEN (47%), POLE (46%), ATM (43%) MLH1-methylation (71%), BRAF mutations (57%), 16p deletion (46%)ARID1A (91%) and CTNNB1 (32%) mutationsPTEN (94%) and PIK3R1 (31%) mutationsPTEN (79%), PIK3CA (64%), ARID1A (61%), CTCF (40%), CTNNB1 (31%) mutations and MLH1 methylation (46%) PIK3CA (99%) mutationsPIK3CA (96%), KRAS (72%), APC (53%) mutations and MGMT (46%) methylationPIK3CA (97%) and TP53 (75%) mutations
APC (76%), TP53 (57%) mutations and 20q amplification (84%)APC (88%) and NRAS (19%) mutationsTP53 (93%), APC (83%) mutations and MGMT (34%) methylationAPC (86%), KRAS (86%), and TP53 (52%) mutationsKRAS (99%), TP53 (45%), APC (40%) mutations and MGMT (48%) methylationMGMT methylation (84%), TP53 mutations (56%), and 9q21 (CDKN2A) deletion (35%)
9q21 (CDKN2A) deletion (76%) and 7p11 (EGFR) amplification (48%)
FLT3 (38%), NPM1 (29%), and DNMT3A (27%) mutations
VHL (63%), PBRM1 (41%) mutations and GSTP1 methylation (36%)
TP53 mutations (76%), 8p21 (PPP2R2A* - 56%), 8p23 (FBXO25* - 48%) deletion, and 1q21 (SETDB1* - 40%), 8q24 (MYC - 36%) and 3q26 (ZNF639*, PIK3CA - 35%) amplification
TP53 mutations (72%) and 8p23 (FBXO25* - 81%), 8p23 (PPP2R2A* - 64%) deletion8q24 (MYC - 93%), 8q22 (YWHAZ* - 91%), 8p11 (IKBKB - 55%), 8p12 (WHSC1L1, FGFR1 - 45%) amplification and TP53 mutations (36%)TP53 mutations (100%) and 8q24 (MYC - 95%), 8q22 (YWHAZ* - 100%) amplification8q24 (MYC) amplification (99%), TP53 (89%) and BRCA2 (25%) mutations17q23-25 (RPS6KB1, mir-21 - 67%), 17q21 (ERBB2 - 28%), 8q24 (MYC - 56%), 8q22 (YWHAZ* - 42%), 1q21 (SETDB1* - 35%), 1q34 (PPP1R15B*, MDM4 - 33%) amplification and TP53 mutations (36%)6p22-23 (E2F3 - 88%), 8q24 (MYC - 71%), 3q26 (ZNF639*, PIK3CA - 50%), 8q22 (YWHAZ* - 38%), 7q36 (UBE3C* 33%) amplification and TP53 (75%), BRCA2 (31%), BRCA1 (29%) mutations8q24 (MYC - 88%), 3q26 (ZNF639* - 78%), 20q13 (AURKA - 52%), 8q22 (YWHAZ* - 50%), 1q21 (SETDB1* - 44%), 5p15 (CLPTM1L* - 33%), 19p13 (BRD4* - 27%) amplification and TP53 mutations (78%)
TP53 mutations (99%)TP53 mutations (96%) and 19q12 (CCNE1 - 40%), 19p13 (BRD4* - 32%), 3q26 (ZNF639*, PIK3CA - 31%) amplificationTP53 mutations (92%), 3q26 (ZNF639*, PIK3CA) amplification (64%) and 9q21 (CDKN2A) deletion (32%) TP53 (84%), CDKN2A (34%) mutations, 11q13 (CCND1) amplification (82%), 9q21 (CDKN2A) deletion (25%)TP53 mutations (53%), 11q13 (CCND1 - 79%), 11q14 (PAK1 - 38%), 8p11 (WHSC1L1, FGFR1 - 30%) amplification1q21 (SETDB1* - 81%), 1q34 (PPP1R15B*, MDM4 - 56%) amplification and TP53 mutations (54%)
Ultra mutators UCEC and COADREAD (57-61%)Micro-satellite instable COADREAD (56-79%) and UCEC (13-16%)Mixed (BLCA - 20%, LUAD - 15%, UCEC low CNA - 15%)Mixed (GBM - 30%, UCEC Low CNA - 24%)UCEC MSI (43%), UCEC Low CNA (33%), BRCA Lum A (11%)BRCA Lum A (48%), HNSC (14%), KIRC (10%)COADREAD MSS (40%) and MSI (12%), UCEC Low CNA (10%)Mixed (HNSC - 25%, COADREAD MSS - 13%, GBM - 13%, BLCA -12%)
COADREAD MSS (56-79%), LUAD (10%)COADREAD MSS (53-78%)COADREAD MSS (48-80%)COADREAD MSS (48-85%)COADREAD MSS (37-56%), LUAD (34%)GBM (41%), AML (16%), HNSC (13%)
GBM (61%), LUAD (12%), HNSC (11%)
AML (90%)
KIRC (92%)
OV (56%), BRCA Basal (15%)
Mixed (HNSC - 20%, OV - 16%, BRCA Lum A - 15%, LUSC - 13%)BRCA Lum A (33%) and Lum B (15%), BLCA (7%)OV (40%), HNSC (21%), BRCA Basal (10%)OV (50%), UCEC Serous (8%), BRCA Basal (8%), LUAD (8%)BRCA Lum A (21%), LumB (19%), Her2+ (10%), Basal (9%),OV (18%)OV (75%), BRCA Basal (8%)
OV (68%), BRCA Basal (9%)
Mixed (HNSC -20%, OV - 20%, LUAD - 15%)OV (66%), LUSC (11%), UCEC Serous (6%)LUSC (40%), HNSC (25%)HNSC (50%), LUSC (16%)HNSC (30%), BRCA Lum A (25%) and Lum B (16%)Mixed (BRCA Lum A - 19%, OV - 16%, LUAD - 15%, UCEC Serous - 11%)
CLUSTERSIZE
46
56
34
135
61
99
57
101
62
32
145
65
147
108
126
115
350
191
128
163
44
122
138
75
100
55
58
75
78
48
110
C
TUMOUR HIERARCHICALCLASSIFICATION MOST FREQUENT SFEs MOST REPRESENTED TUMOR TYPES
Supplementary Figure 5
* Most differentially expressed gene in the region when compared to diploid samples
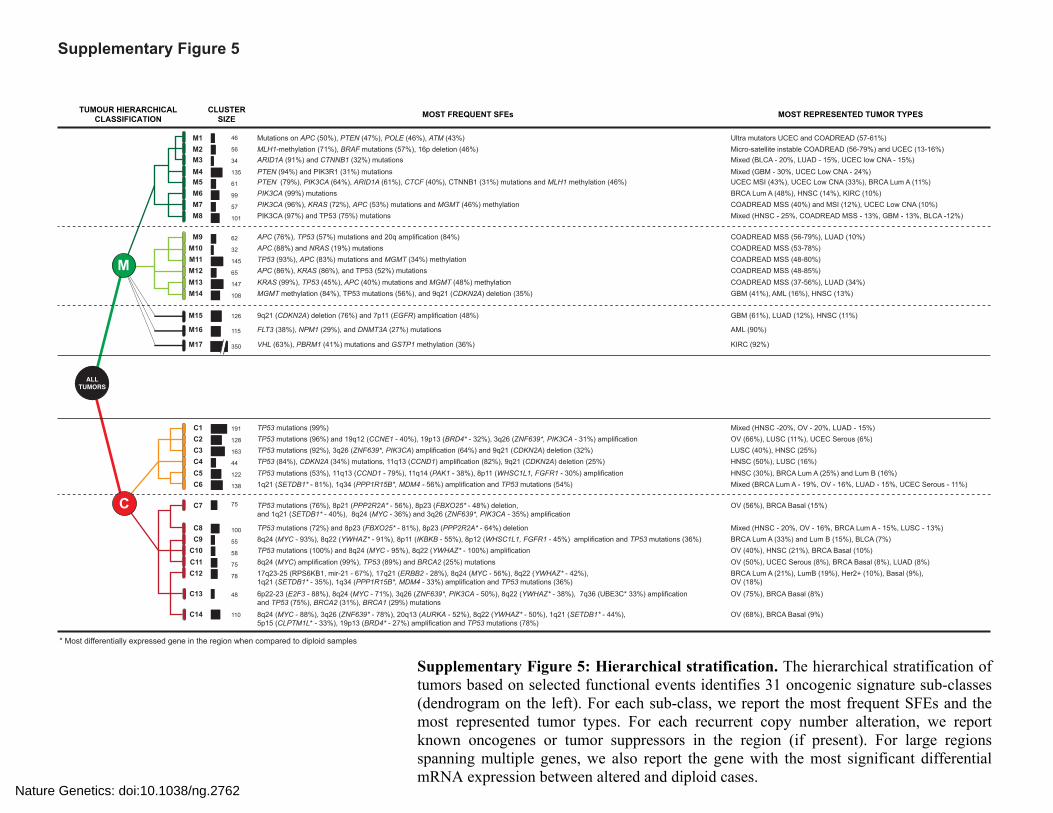
Supplementary Figure 5: Hierarchical stratification. The hierarchical stratification of tumors based on selected functional events identifies 31 oncogenic signature sub-classes (dendrogram on the left). For each sub-class, we report the most frequent SFEs and the most represented tumor types. For each recurrent copy number alteration, we report known oncogenes or tumor suppressors in the region (if present). For large regions spanning multiple genes, we also report the gene with the most significant differential mRNA expression between altered and diploid cases.
Nature Genetics: doi:10.1038/ng.2762
Jacc
ard
Coe
ffici
ent
Jacc
ard
Coe
ffici
ent
1st-l
evel
m
odul
es (5
%)
1st-l
evel
m
odul
es (2
0%)
2nd-
leve
l m
odul
es (5
%)
2nd-
leve
l m
odul
es (2
0%)
M1-
M17
(5%
)
M1-
M17
(20%
)
2nd-
leve
l m
odul
es (5
%)
2nd-
leve
l m
odul
es (2
0%)
C1-
C14
(5%
)
C1-
C14
(20%
)
M subclasses C subclasses Random Classification
ALLTUMORS
M C M/C classes
1st-level modules
2nd-level modules
1st-l
evel
m
odul
es (5
%)
1st-l
evel
m
odul
es (2
0%)
M1 M2 M3 M4 M5 M6 M7 M8 M9M10M11M12M13M14 M15 M16 M17 C1 C2 C3 C4 C5 C6 C7C8C9C10C11C12C13C14
1795 samples 1445 samples
0
0.2
0.4
0.6
0.8
1
0
0.2
0.4
0.6
0.8
1
0
0.2
0.4
0.6
0.8
1
Top
Cla
sses
(5
%)
Top
Cla
sses
(2
0%)
Top
Cla
sses
(5
0%)
Jacc
ard
Coe
ffici
ent
M/C-classed
Supplementary Figure 6
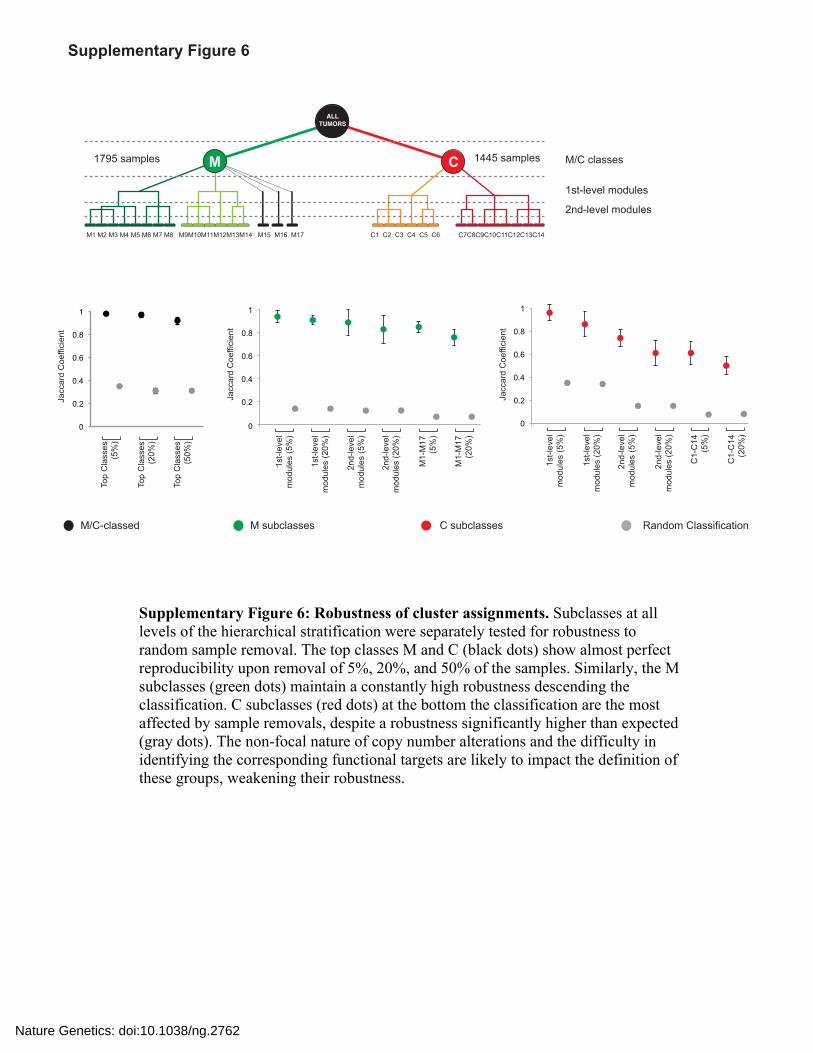
Supplementary Figure 6: Robustness of cluster assignments. Subclasses at all levels of the hierarchical stratification were separately tested for robustness to random sample removal. The top classes M and C (black dots) show almost perfect reproducibility upon removal of 5%, 20%, and 50% of the samples. Similarly, the M subclasses (green dots) maintain a constantly high robustness descending the classification. C subclasses (red dots) at the bottom the classification are the most affected by sample removals, despite a robustness significantly higher than expected (gray dots). The non-focal nature of copy number alterations and the difficulty in identifying the corresponding functional targets are likely to impact the definition of these groups, weakening their robustness.
Nature Genetics: doi:10.1038/ng.2762
ARID1A Mutated Samples (%)
100%
50%
0
ARID1A Hotspot Mutations
R1989* (x14)
R1721* (x2)R1722* (x5)
Q1334 IF-Del (x4)Q1334 IF-Ins (x2)R1335* (x5)
R693* (x5)
0 2285POLE / ultra-mutators
Supplementary Figure 7
M5M3M1
a b
R283CH284N/Y/P
G261-splice (x3)
H312RN314fs (x3)
R377C (x2)R377H (x2)P378L (x2)P378A R448* (x7)
CTCF Hotspot Mutations
0 727
EX 3 EX 5EX 4
EX 3 EX 5
Wild-type
G261-splice (TCGA-A2-AY0F)
EX 4
Exon Skipping
ZF1 ZF2
CTCF Splice-site Mutation
His-1(H284/H312)
His-2Cys-2
Cys-1
Zn
CTCF C2-H2 Zinc Finger
50%
0
25%
c d
e f
Zinc-Finger domains (ZF1-ZF11)
M5
BR
CA
UC
EC
KIRCHNSC
CTCF Mutated Samples (%)
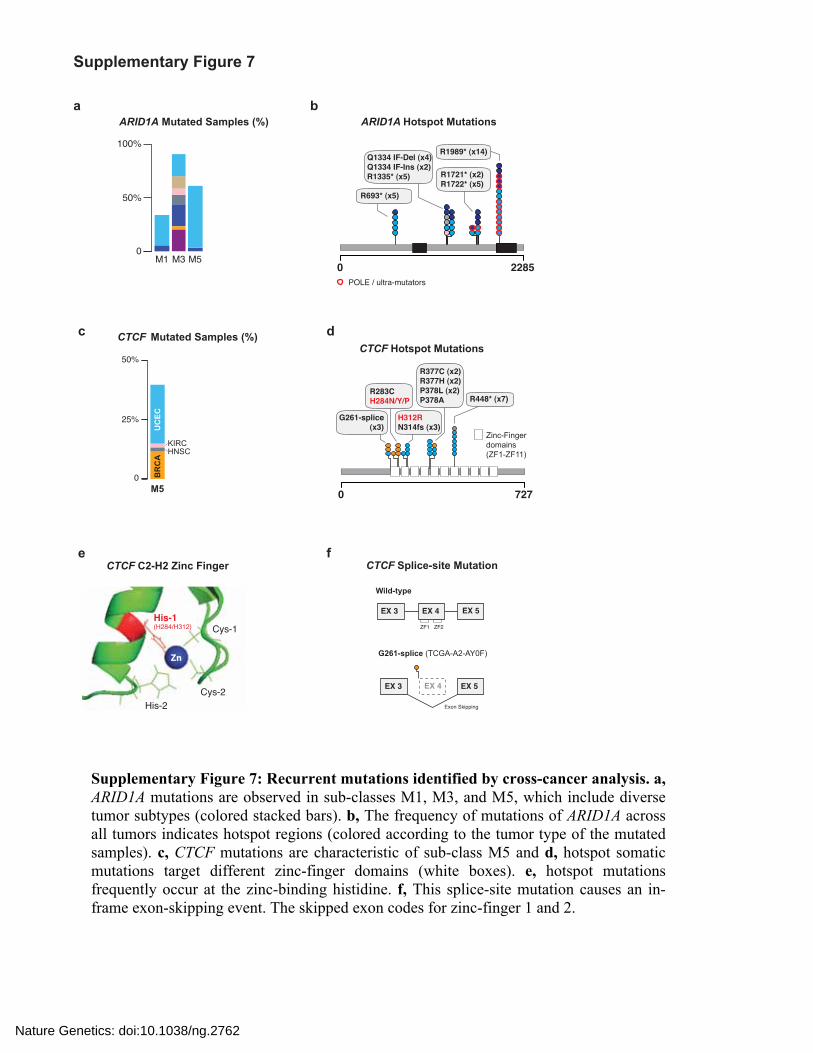
Supplementary Figure 7: Recurrent mutations identified by cross-cancer analysis. a, ARID1A mutations are observed in sub-classes M1, M3, and M5, which include diverse tumor subtypes (colored stacked bars). b, The frequency of mutations of ARID1A across all tumors indicates hotspot regions (colored according to the tumor type of the mutated samples). c, CTCF mutations are characteristic of sub-class M5 and d, hotspot somatic mutations target different zinc-finger domains (white boxes). e, hotspot mutations frequently occur at the zinc-binding histidine. f, This splice-site mutation causes an in-frame exon-skipping event. The skipped exon codes for zinc-finger 1 and 2.
Nature Genetics: doi:10.1038/ng.2762
67,650 kb
26 kb
p12.3 p12.2 p12.1 p11.2 p11.1 q11.2 q12.1 q12.2 q13 q21 q22.1 q22.2
Chr. 16
p13.3 p13.2p13.13 p13.11 p12.3 p12.2 p12.1 p11.2 p11.1 q11.2 q12.1 q12.2 q13 q21 q22.1 q22.2 q23.1 q23.2 q23.3 q24.1q24.2
CTCF
CTCF
Exon 3Exon 4
Exon 5
Exon4 Skipping
TCGA-A2-AY0F
Supplementary Figure 8
Exon 6 Exon 7
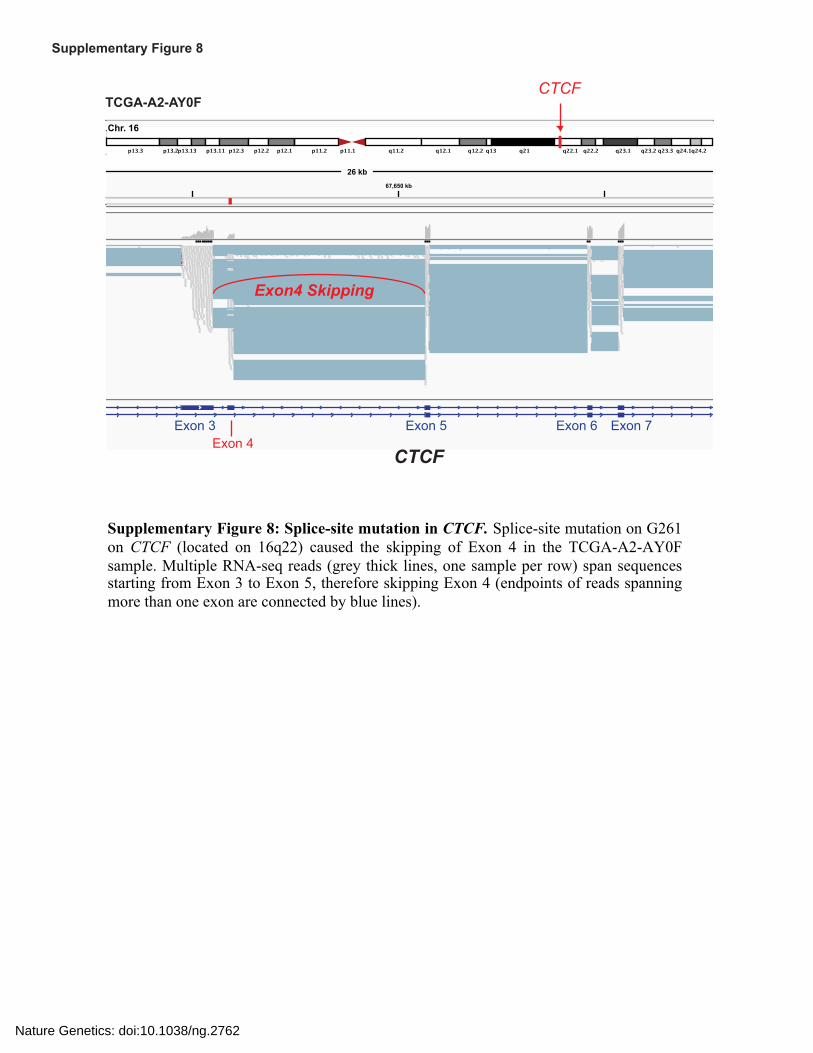
Supplementary Figure 8: Splice-site mutation in CTCF. Splice-site mutation on G261 on CTCF (located on 16q22) caused the skipping of Exon 4 in the TCGA-A2-AY0F sample. Multiple RNA-seq reads (grey thick lines, one sample per row) span sequences starting from Exon 3 to Exon 5, therefore skipping Exon 4 (endpoints of reads spanning more than one exon are connected by blue lines).
Nature Genetics: doi:10.1038/ng.2762
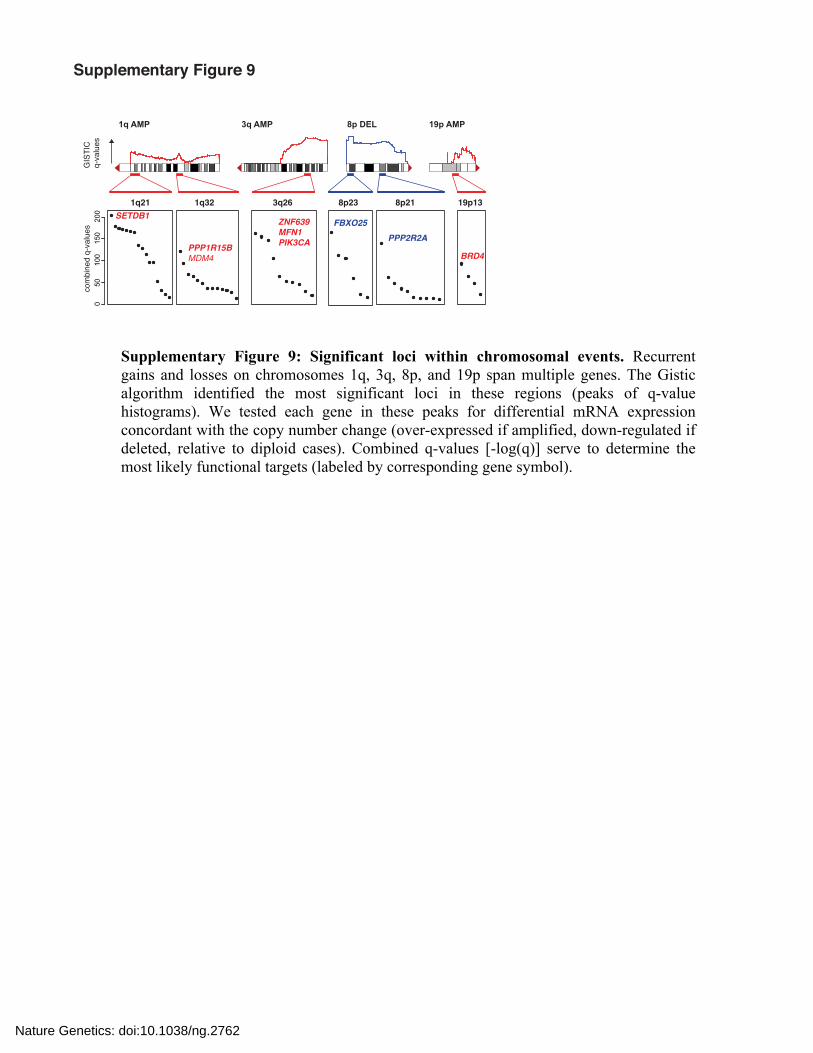
1q21 1q32 3q26 8p23 8p21 19p13
050
100
150
200
com
bine
d q-
valu
es
PPP1R15BMDM4
ZNF639MFN1PIK3CA
FBXO25PPP2R2A
BRD4
1q AMP 3q AMP 8p DEL 19p AMP
SETDB1
Supplementary Figure 9G
ISTI
Cq-
valu
es
Supplementary Figure 9: Significant loci within chromosomal events. Recurrent gains and losses on chromosomes 1q, 3q, 8p, and 19p span multiple genes. The Gistic algorithm identified the most significant loci in these regions (peaks of q-value histograms). We tested each gene in these peaks for differential mRNA expression concordant with the copy number change (over-expressed if amplified, down-regulated if deleted, relative to diploid cases). Combined q-values [-log(q)] serve to determine the most likely functional targets (labeled by corresponding gene symbol).
Nature Genetics: doi:10.1038/ng.2762
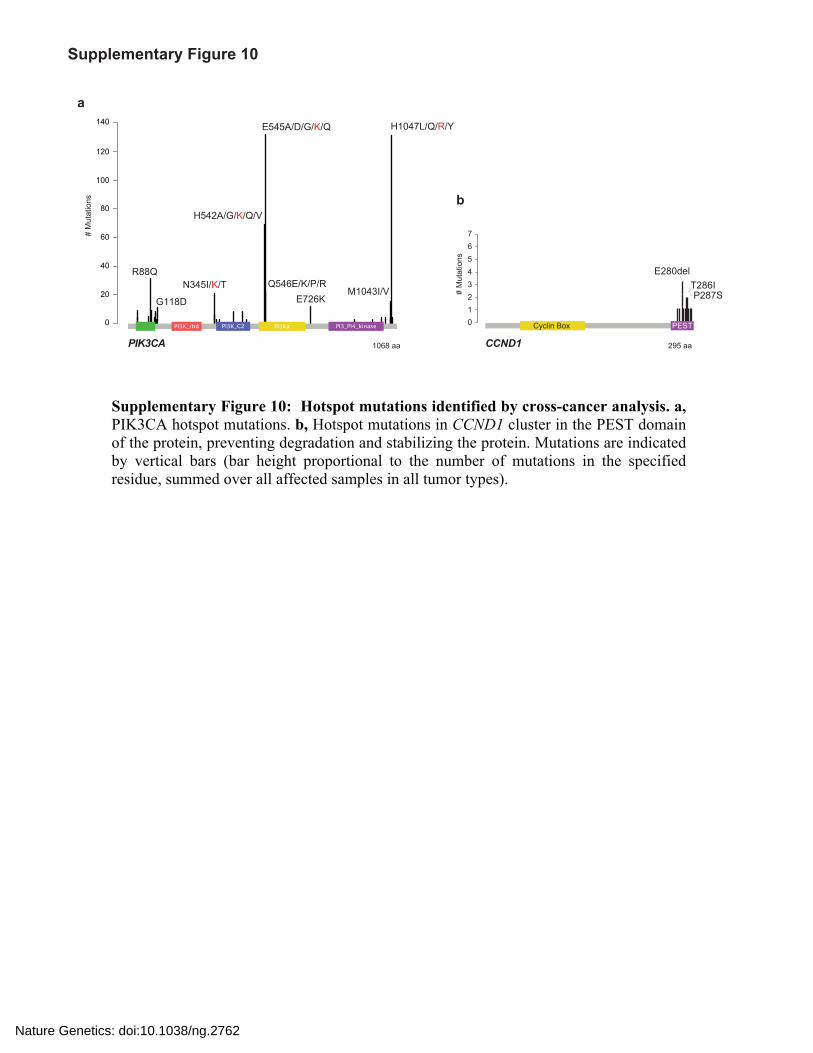
CCND1
E280delT286IP287S
1234567
295 aa
# M
utat
ions
00
20
40
60
80
100
120
140
# M
utat
ions
PIK3CA 1068 aa
PESTCyclin Box
H1047L/Q/R/YE545A/D/G/K/Q
H542A/G/K/Q/V
R88QQ546E/K/P/RN345I/K/T
M1043I/VE726KG118D
a
b
Supplementary Figure 10
Supplementary Figure 10: Hotspot mutations identified by cross-cancer analysis. a, PIK3CA hotspot mutations. b, Hotspot mutations in CCND1 cluster in the PEST domain of the protein, preventing degradation and stabilizing the protein. Mutations are indicated by vertical bars (bar height proportional to the number of mutations in the specified residue, summed over all affected samples in all tumor types).
Nature Genetics: doi:10.1038/ng.2762
99 96 94 84 59 89 89 86 52 100 91 72 85 85 59 26 28 5 5 4 77 54 7 94 52 52 60 10 3 60
99 96 92 84 53 54 76 72 36 100 89 36 75 78 22 11 12 21 2 75 60 3 93 52 44 56 501 2 6 54 20 2 2 1 29 6 17 3 3 1 2 2 1 2 3 5 53 3 7 5 2 5 5 18 10 5 8 10 2 6 3 3 2 2 2 4 2 2 6 4
1 1 2 2 1 1 8 4 43 17 9 3 2 2 3 4 2 5 7 2 1 2 44 17 4 2 1 1 15 4 8 5 16 14 27 22 34 8 2 2 1 1 62 11 2 1 2 16 7 2 9 11 7 25 13 9 2 2 1 2 41 4 2 1 1 16 3 5 7 8 25 18 3
30 62 68 84 86 51 68 63 44 40 49 53 75 73 30 6 29 46 12 17 4 63 54 12 18 2 13 53 82 8 42
3 13 7 2 8 11 19 16 10 12 4 22 17 51 3 2 4 2 4 54 5 1 91 4 1 1 2 27 4 3 18 69 14 1 2 2 4 4 58 5 7 3 4 3 1 3 2 2 16 2 4 2 2 5 1 2 7 3 33 3 5 3 4 9 4 2 4 5 3 10 6 2 2 3 2 1 4 1 3 2 3
40 1 2 5 17 26 5 6 2 23 5 8 21 3 2 53 1 2 2 3 6 6 1 4 2 4 8 3 2 4 2 2 6 6 21 1 7 5 7 1 1 2 4 1 1 3 1 1 1 2 1 1
1 2 2 1 3 1 11 1 81 79 10 9 20 21 19 4 19 4 11 6 3 2 8 2 6 2 6 2 10
1 1 1 7 6 2 1 1 4 2 1 1 11 2 1 1 3 1 1 4 1
12 1 8 28 7 1 1 6 4 4 2 3 2 12 5 2 4 1 32 3 12 2 3 2 1 1 4 2 1 1
6 32 23 17 12 4 28 10 7 5 10 3 15 26 31 2 4 1 6 35 75 6 12
10 44 71 23 39 51 57 20 31 21 36 32 50 69 68 35 35 98 83 99 96 98 4 9 5 20 18 14 2 6 40
1 1 25 4 3 2 2 1 2 1 1 1 1 11 1 2 1 1 1 1 1 2 2 3 1 2 2 2 1 2 1 2 1 1
2 1 1 11 1 2 1 2 3 1 1 3 1 1 2 10 1 1 11 9 1 3 1 23 1 2 2 1 2 3 2 2 2 1 1 2
1 1 4 2 1 1 2 2 12 2 4 3 4 1 3 3 4 1 48 8 9 94 78 6 8 5 94 3 6 3 9 4 2 5 4 8 2 6 4 3 7 1 2 2 5 8 1 32 1 2 3 3 2 2 1 1 36 10 9 30 17 2 2 1 2 6 2 1 42 5 10 2 12 13 3 4 23 5 9 5 3 32 10 12 2 63 99 96 97 2 1 3 17
31 64 16 24 30 35 14 4 9 16 16 50 57 2 6 2 4 5 1 2 1 6 1 2 13
29 38 52 9 50 51 43 56 63 28 36 53 35 54 50 69 29 33 44 8 86 38 48 31 33 82 100 44 66 10 6 44
3 1 1 3 4 1 1 9 60 2 3 6 1 2 9 3 2 1 42 1 2 2 1 5 6 2 5 4 2 15 8 2 6 2 10 2
2 2 4 3 2 1 2 4 2 3 1 11 4 3 2 2 1 1 16 12 6 27 76 12 17 3 82 99 1 1 12
1 17 3 2 4 9 16 9 5 7 8 15 11 2 1 4 4 3 1 44 2 4 1 3 4 4 4 1 6 5 30 4 6 2 4 2 3 1 4 2 1 32 4 1 3 12 2 2 2 3 1 2 6 2 11 1 5 2 1 3 6 3 4 4 4 1 2 13 3 2
7 1 2 1 3 2 3 1 13 13 1 2 1 2 3 1 21 1 1 2 1 3 1 11 2 1 4 7 3 4 4 8 8 13 1 2 2 2 21 1 1 3 1 2 2 11 6 3 5 7 1 1
6 26 29 6 3 24 46 7 6 3 2 10 8 3 2 1 1 61 1 2 2 2 6 1 3 1 4 2 5 2 1 1 1
1 6 1 1 7 4 1 4 9 4 1 11 1 1 1 3 2 1 1 4 2 2 3 1 2 15 4 7 9 13 4 5 15 5 8 30 4 9 2 3 1 2 2 4 10 2 2 55 4 1 2 5 2 1 1 2 2 2 3 7 18 1 28
C1 C2
10
C3
7
C4
8
C5
7
C6
1
C7
9
C8
4
C9
4
C10
7
C11
4
C12
2
C13
2
C14 M1 M2 M3
13
M4 M5 M6
2
M7
8
M8 M9 M10
3
M11 M12
1
M13
14
M14
48
M15 M16
1
M17
5
Averag
e
p53/DNA-repairTP53
MDM4MDM2
ATMBRCA2BRCA1BRCA1
Cell−Cycle
AURKAE2F3RB1RB1
CCNE1CDK4CDK6
CCND1CCND1
CDKN1BCDKN1ACDKN2ACDKN2ACDKN2A
PI(3)K/AKT/MTOR
MTORTSC1/2
TSC1STK11STK11
AKT1PTENPTEN
PIK3R1PIK3CAPIK3CA
RTK/Ras/RafBRAFNRASHRASKRASKRAS
NF1NF1
PDGFRA/KIT/KDRMET
FGFR3FGFR3FGFR2FGFR1ERBB3ERBB3ERBB2ERBB2EGFREGFR
Drug fa
mily
Pathway
RTK
inhi
bitio
nB
RA
F/M
AP
Ki
RTKs
Ras
Raf
PI(3)K
AktSTK11
TSC-complex
p21/p27
Rb
E2F-3AURK
Mdm2/4
p53
Cyclin D -CDK4/6
ATM
p16-INK4a
PTEN
NF1
PI(3
)Ki
AK
TiC
DK
4/6i
AU
RK
iM
DM
i
Cyclin E
mTOR
mTO
Ri
CD
K2i
BRCA1/2
PA
RP
i
ActivatingInactivating # pathways altered
0 1 2 3% altered
8 4DNA hyper-methylationHigh-level amplification
Somatic mutationHomozygous deletion
Currently targetable
DirectNo Indirect
100
50
0Sam
ples
(%)
33
Supplementary Figure 11
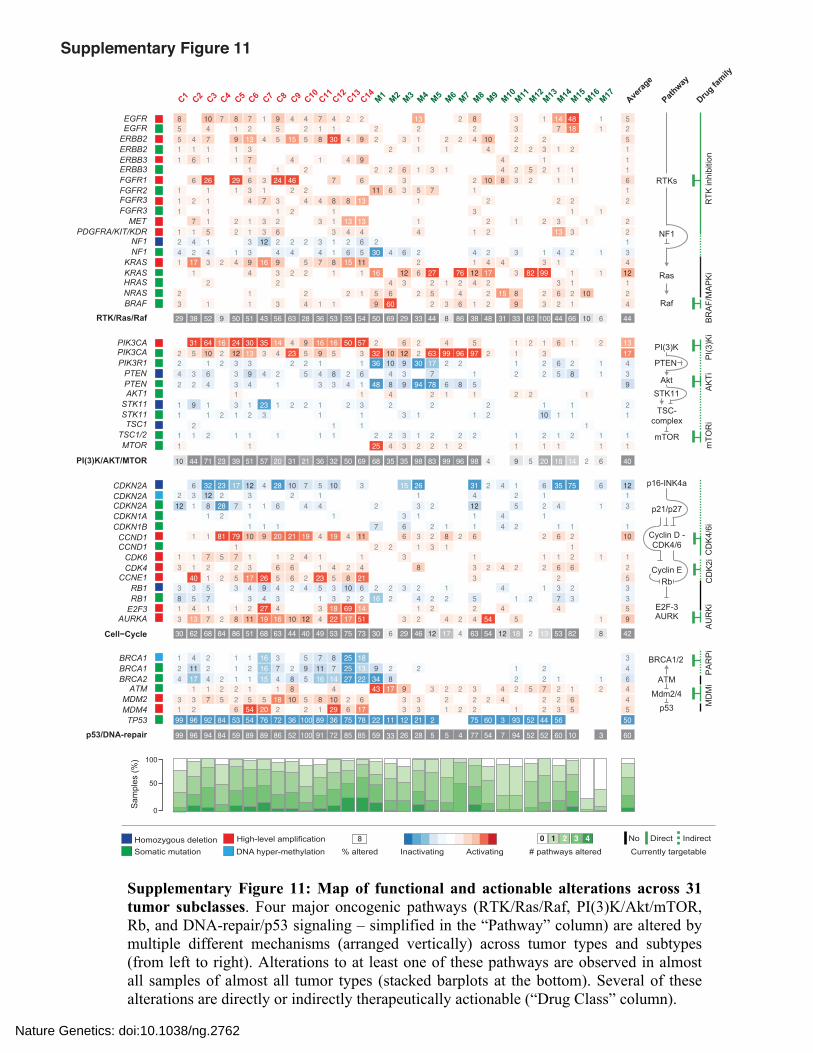
Supplementary Figure 11: Map of functional and actionable alterations across 31 tumor subclasses. Four major oncogenic pathways (RTK/Ras/Raf, PI(3)K/Akt/mTOR, Rb, and DNA-repair/p53 signaling – simplified in the “Pathway” column) are altered by multiple different mechanisms (arranged vertically) across tumor types and subtypes (from left to right). Alterations to at least one of these pathways are observed in almost all samples of almost all tumor types (stacked barplots at the bottom). Several of these alterations are directly or indirectly therapeutically actionable (“Drug Class” column).
Nature Genetics: doi:10.1038/ng.2762
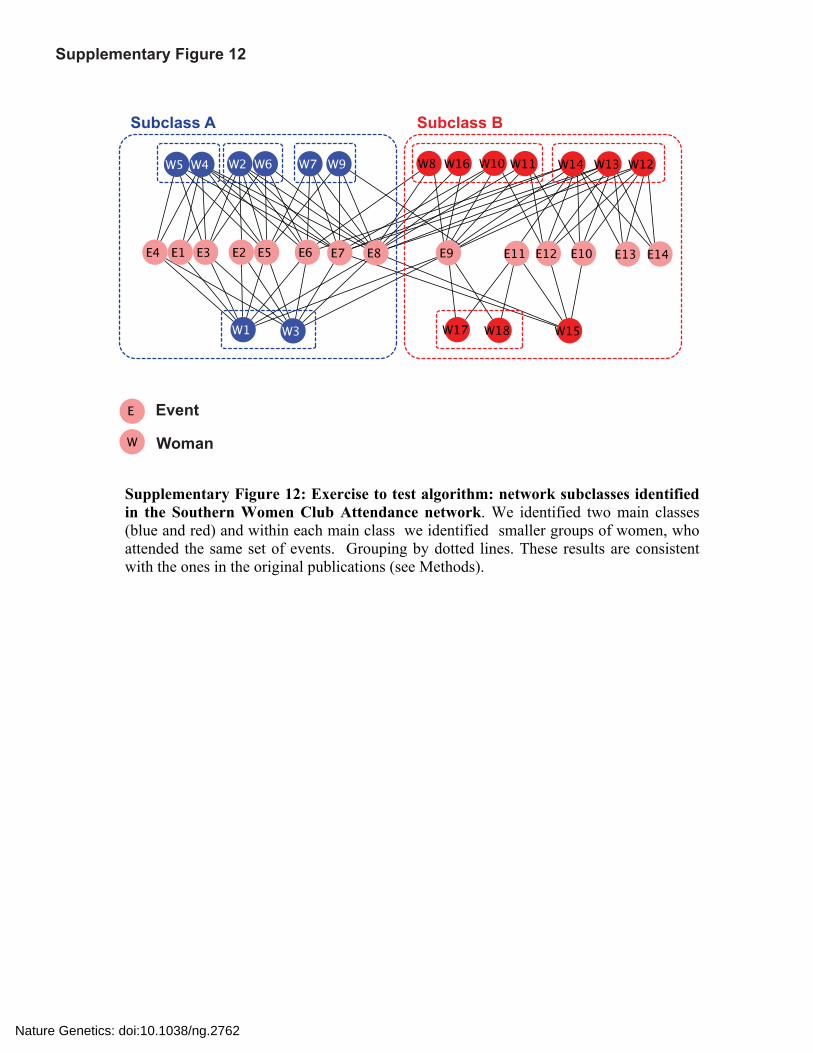
Supplementary Figure 12
Event
Woman
Subclass A Subclass B
Supplementary Figure 12: Exercise to test algorithm: network subclasses identified in the Southern Women Club Attendance network. We identified two main classes (blue and red) and within each main class we identified smaller groups of women, who attended the same set of events. Grouping by dotted lines. These results are consistent with the ones in the original publications (see Methods).
Nature Genetics: doi:10.1038/ng.2762

![Article - White Rose Research Onlineeprints.whiterose.ac.uk/113339/2/[Bladder_cancer]_Figures...TERT mutation and 9q LOH Flat dysplasia TP53 mutation, 9p LOH and 9q LOH T1 Invasive](https://img.pdfslide.us/doc/110x75/5f24abd2d3ccb012d859c51c/article-white-rose-research-bladdercancerfigures-tert-mutation-and-9q-loh.jpg)