Embed Size (px)
Citation preview

Semi-Annual ReportFebruary 28, 2021
(Unaudited)
MAI Managed Volatility Fund
Managed By MAI Capital Management, LLC

TABLE OF CONTENTS
IMPORTANT INFORMATION
The views expressed in this report are those of the MAI Managed Volatility Fund (the “Fund”) managers as of February 28, 2021, and may not reflect their views on the date this report is first published or anytime thereafter. These views are intended to assist shareholders of the Fund in understanding their investments in the Fund and do not constitute investment advice.
An investment in the Fund is subject to risk, including the possible loss of principal amount invested. The Fund may invest in securities issued by smaller and medium-sized companies, which typically involves greater risk than investing in larger, more established companies. Selling call options risk occurs if the Fund is required to sell an underlying security and forego gains if the market price exceeds the exercise price before the expiration date. Selling put options risk occurs if the Fund is required to buy an underlying security and forego gains if the market price is below the exercise price before the expiration date. Option risks include, but are not limited to, the possibility of an imperfect correlation between the movement in the options’ prices and that of the securities/indices hedged (or used for cover), which may render a given hedge unable to achieve its objective; possible loss of the premium paid for options; and potential inability to benefit from the appreciation of an underlying security above the exercise price. ADRs (American Depositary Receipt) may be subject to international trade, currency, political, regulatory and diplomatic risks. The Fund is also subject to other risks, such as fixed-income securities risk, which are detailed in the Fund’s prospectus. Diversification does not assure a profit or protect against a loss in a declining market.
A put is an option contract giving the owner the right, but not the obligation, to sell a specified amount of an underlying asset at a set price within a specified time. A cash-secured put is a put for which the writer deposits an amount of cash equal to the option’s exercise price. A call is an option contract giving the owner the right (but not the obligation) to buy a specified amount of an underlying security at a specified price within a specified time. A covered call is an options strategy whereby an investor holds a (long) position in an asset and writes (sells) call options on that same asset in an effort to, potentially, generate increased income from the asset. A call option is out-of-the-money if the stock price is below its strike price and a put option is out-of-the-money if the stock price is above its strike price. The spread to strike price is the difference between the current price of the security and the strike price. Strike price is the price at which a specific options contract can be exercised. Beta is a measure of a fund’s sensitivity to market movements. A portfolio with a beta greater than 1 is more volatile than the market, and a portfolio with a beta less than 1 is less volatile than the market. Premium realized through the sale of options is not distributable as quarterly income. Sharpe ratio measures risk-adjusted performance. The greater a portfolio’s sharpe ratio, the better its risk-adjusted performance has been. Standard deviation is a statistical measure of the volatility of the fund’s returns. In general, the higher the standard deviation, the greater the volatility of the return. The CBOE S&P 500 BuyWrite Index (BXM) tracks the performance of a hypothetical at-the-money buy-write strategy on the S&P 500. Data is available on the index going back to June 30, 1986. One cannot invest directly in an index.
Schedule of Investments 1
Schedule of Call and Put Options Written 3
Notes to Schedules of Investments and Call and Put Options Written 4
Statement of Assets and Liabilities 6
Statement of Operations 7
Statements of Changes in Net Assets 8
Financial Highlights 9
Notes to Financial Statements 11
Additional Information 17
MAI MANAGED VOLATILITY FUNDSCHEDULE OF INVESTMENTS FEBRUARY 28, 2021
1See Notes to Financial Statements.
Shares Security Description ValueCommon Stock - 54.0%Communication Services - 6.9% 1,433 Alphabet, Inc., Class A (a) $ 2,897,397 54,293 AT&T, Inc. (b) 1,514,232 32,172 Comcast Corp., Class A 1,696,108 7,289 Facebook, Inc., Class A (a) 1,877,792 10,041 The Walt Disney Co. (a) 1,898,151 17,941 Verizon Communications, Inc. 992,137
10,875,817 Consumer Discretionary - 5.1% 1,118 Amazon.com, Inc. (a)(b) 3,457,896 2,814 McDonald's Corp. 580,078 10,544 NIKE, Inc., Class B 1,421,120 10,011 The Home Depot, Inc. 2,586,242
8,045,336 Consumer Staples - 3.4% 11,233 Altria Group, Inc. 489,759 5,660 Anheuser-Busch InBev SA/NV, ADR 326,752 1,270 Costco Wholesale Corp. 420,370 5,376 Diageo PLC, ADR 848,010 15,152 Mondelez International, Inc., Class A 805,480 9,224 PepsiCo., Inc. 1,191,649 4,882 The Procter & Gamble Co. 603,073 5,755 Walmart, Inc. 747,690
5,432,783 Energy - 1.6% 4,159 Chevron Corp. 415,900 4,761 EOG Resources, Inc. 307,370 7,329 Exxon Mobil Corp. 398,478 48,133 Kinder Morgan, Inc. 707,555 5,807 Marathon Petroleum Corp. 317,178 3,323 Occidental Petroleum Corp. 88,425 8,894 Schlumberger NV 248,232
2,483,138 Financials - 6.1% 52,675 Bank of America Corp. 1,828,349 4,184 Berkshire Hathaway, Inc., Class B (a) 1,006,294 7,060 Chubb, Ltd. 1,147,815 11,965 Citigroup, Inc. 788,254 12,857 JPMorgan Chase & Co. 1,892,165 14,790 MetLife, Inc. 851,904 12,732 The Charles Schwab Corp. 785,819 13,795 U.S. Bancorp 689,750 19,495 Wells Fargo & Co. 705,134
9,695,484 Health Care - 7.7% 15,837 Abbott Laboratories 1,896,956 9,442 AbbVie, Inc. 1,017,281 7,031 Amgen, Inc. 1,581,413 11,136 Bristol-Myers Squibb Co. 682,971 9,531 CVS Health Corp. 649,347 9,690 Johnson & Johnson 1,535,477 10,745 Medtronic PLC 1,256,843 6,765 Merck & Co., Inc. 491,274 20,839 Pfizer, Inc. 697,898 6,703 UnitedHealth Group, Inc. 2,226,871 2,585 Viatris, Inc. (a) 38,387
12,074,718

MAI MANAGED VOLATILITY FUNDSCHEDULE OF INVESTMENTS FEBRUARY 28, 2021
2See Notes to Financial Statements.
Shares Security Description ValueIndustrials - 3.9% 5,392 Carrier Global Corp. $ 196,970 9,007 Honeywell International, Inc. 1,822,566 2,696 Otis Worldwide Corp. 171,762 14,637 Raytheon Technologies Corp. 1,053,718 3,529 The Boeing Co. (a) 748,183 4,919 Union Pacific Corp. 1,013,117 7,679 United Parcel Service, Inc., Class B 1,211,977
6,218,293 Information Technology - 16.0% 6,178 Advanced Micro Devices, Inc. (a)(b) 522,103 40,860 Apple, Inc. 4,954,683 2,387 Broadcom, Inc. 1,121,580 27,517 Cisco Systems, Inc./Delaware 1,234,688 4,461 Fortinet, Inc. (a)(b) 753,240 15,389 Intel Corp. 935,343 2,669 Intuit, Inc. 1,041,284 19,736 Microsoft Corp. 4,586,252 1,681 NVIDIA Corp. (b) 922,163 24,562 Oracle Corp. 1,584,494 12,656 QUALCOMM, Inc. 1,723,621 2,444 ServiceNow, Inc. (a)(b) 1,303,776 14,260 Visa, Inc., Class A 3,028,681 11,649 Xilinx, Inc. (b) 1,517,865
25,229,773 Materials - 0.4% 2,318 Air Products and Chemicals, Inc. 592,527
Real Estate - 1.2% 4,439 American Tower Corp. REIT 959,401 25,155 Weyerhaeuser Co. REIT 852,000
1,811,401 Utilities - 1.7% 37,380 NextEra Energy, Inc. 2,746,682
Total Common Stock (Cost $55,328,185) 85,205,952 Principal Security Description Rate Maturity Value
U.S. Government & Agency Obligations - 4.8%U.S. Treasury Securities - 4.8% $ 7,500,000 U.S. Treasury Note
(Cost $7,478,907) 1.50 % 11/30/21 7,581,134
Shares Security DescriptionExercise
Price Exp. Date ValueWarrants - 0.0% 415 Occidental Petroleum Corp. (a)
(Cost $0) $ 22.00 08/03/27 4,980
Shares Security Description ValueMoney Market Fund - 42.3% 66,743,368 Fidelity Investments Money Market Government Portfolio, Class I, 0.01% (c)(d)
(Cost $66,743,368) 66,743,368
Investments, at value - 101.1% (Cost $129,550,460) $ 159,535,434 Total Written Options - (1.7)% (Premiums Received $(3,719,628)) (2,607,260 )Other Assets & Liabilities, Net - 0.6% 890,954 Net Assets - 100.0% $ 157,819,128

MAI MANAGED VOLATILITY FUNDSCHEDULE OF CALL AND PUT OPTIONS WRITTEN FEBRUARY 28, 2021
3See Notes to Financial Statements.
Contracts Security Description Strike Price Exp. DateNotional Contract
Value ValueWritten Options - (1.7)%Call Options Written - (1.1)% (45 ) Advanced Micro Devices, Inc. $ 100.00 04/21 $ 380,295 $ (6,525 ) (4 ) Amazon.com, Inc. 3,500.00 04/21 1,237,172 (10,000 ) (200 ) AT&T, Inc. 25.00 01/22 557,800 (75,000 ) (28 ) CBOE S&P 500 Index 3,800.00 03/21 (10,671,220 ) (211,120 ) (46 ) CBOE S&P 500 Index 3,820.00 04/21 (17,531,290 ) (415,380 ) (41 ) CBOE S&P 500 Index 3,840.00 03/21 (15,625,715 ) (224,475 ) (53 ) CBOE S&P 500 Index 3,900.00 04/21 (20,199,095 ) (247,245 ) (37 ) CBOE S&P 500 Index 3,850.00 04/21 (14,101,255 ) (268,250 ) (9 ) CBOE S&P 500 Index 3,800.00 04/21 (3,430,035 ) (92,880 ) (35 ) Fortinet, Inc. 170.00 03/21 590,975 (21,000 ) (12 ) NVIDIA Corp. 620.00 04/21 658,296 (16,080 ) (15 ) ServiceNow, Inc. 560.00 03/21 800,190 (14,235 ) (80 ) Xilinx, Inc. 130.00 06/21 1,042,400 (110,000 )Total Call Options Written (Premiums Received $(2,855,715)) (1,712,190 )Put Options Written - (0.6)% (20 ) CBOE S&P 500 Index 3,450.00 03/21 6,900,000 (39,700 ) (10 ) CBOE S&P 500 Index 3,300.00 04/21 3,300,000 (18,550 ) (15 ) CBOE S&P 500 Index 3,700.00 04/21 5,550,000 (107,700 ) (20 ) CBOE S&P 500 Index 3,650.00 04/21 7,300,000 (121,500 ) (25 ) CBOE S&P 500 Index 3,600.00 04/21 9,000,000 (128,250 ) (15 ) CBOE S&P 500 Index 3,550.00 04/21 5,325,000 (65,100 ) (20 ) CBOE S&P 500 Index 3,475.00 04/21 6,950,000 (67,200 ) (53 ) CBOE S&P 500 Index 3,550.00 04/21 18,815,000 (237,970 ) (10 ) CBOE S&P 500 Index 3,600.00 04/21 3,600,000 (61,450 ) (10 ) CBOE S&P 500 Index 3,450.00 04/21 3,450,000 (45,900 ) (70 ) NETLease Corporate Real Estate ETF 23.00 04/21 161,000 (1,750 )Total Put Options Written (Premiums Received $(863,913)) (895,070 )Total Written Options - (1.7)% (Premiums Received $(3,719,628)) $ (2,607,260 )

MAI MANAGED VOLATILITY FUNDNOTES TO SCHEDULES OF INVESTMENTS AND CALL AND PUT OPTIONS WRITTEN FEBRUARY 28, 2021
4See Notes to Financial Statements.
ADR American Depositary ReceiptETF Exchange Traded FundPLC Public Limited CompanyREIT Real Estate Investment Trust
(a) Non-income producing security.(b) Subject to call option written by the Fund.(c) Dividend yield changes daily to reflect current market conditions. Rate was the quoted yield as of February 28, 2021.(d) All or a portion of this security is held as collateral for written options.
The following is a summary of the inputs used to value the Fund's investments and other financial instruments and liabilities as of February 28, 2021.
The inputs or methodology used for valuing securities are not necessarily an indication of the risks associated with investing in those securities. For more information on valuation inputs, and their aggregation into the levels used in the table below, please refer to the Security Valuation section in Note 2 of the accompanying Notes to Financial Statements.
Level 1 Level 2 Level 3 TotalAssetsInvestments at ValueCommon Stock
Communication Services $ 10,875,817 $ – $ – $ 10,875,817 Consumer Discretionary 8,045,336 – – 8,045,336 Consumer Staples 5,432,783 – – 5,432,783 Energy 2,483,138 – – 2,483,138 Financials 9,695,484 – – 9,695,484 Health Care 12,074,718 – – 12,074,718 Industrials 6,218,293 – – 6,218,293 Information Technology 25,229,773 – – 25,229,773 Materials 592,527 – – 592,527 Real Estate 1,811,401 – – 1,811,401 Utilities 2,746,682 – – 2,746,682
U.S. Government & Agency Obligations – 7,581,134 – 7,581,134 Warrants 4,980 – – 4,980 Money Market Fund – 66,743,368 – 66,743,368 Investments at Value $ 85,210,932 $ 74,324,502 $ – $ 159,535,434 Total Assets $ 85,210,932 $ 74,324,502 $ – $ 159,535,434
LiabilitiesOther Financial Instruments*Written Options (235,720 ) (2,371,540 ) – (2,607,260 )Total Liabilities $ (235,720 ) $ (2,371,540 ) $ – $ (2,607,260 )
* Other Financial Instruments are derivative instruments reflected in separate schedules such as written options, which appear in the Schedule of Call and Put Options Written and are valued at their market value at period end.
PORTFOLIO HOLDINGS % of Total Net AssetsCommon Stock 54.0 %U.S. Government & Agency Obligations 4.8 %Warrants 0.0 %Money Market Fund** 42.3 %WrittenOptions (1.7 )%Other Assets & Liabilities, Net 0.6 %
100.0%
** Used to meet the collateral requirements of a tri-party agreement between the prime broker, custodian and the Fund.

MAI MANAGED VOLATILITY FUNDNOTES TO SCHEDULES OF INVESTMENTS AND CALL AND PUT OPTIONS WRITTEN FEBRUARY 28, 2021
5See Notes to Financial Statements.
PORTFOLIO HOLDINGS % of Common StockCommunication Services 12.8 %Consumer Discretionary 9.4 %Consumer Staples 6.4 %Energy 2.9 %Financials 11.4 %Health Care 14.2 %Industrials 7.3 %Information Technology 29.6 %Materials 0.7 %Real Estate 2.1 %Utilities 3.2 %
100.0 %

MAI MANAGED VOLATILITY FUNDSTATEMENT OF ASSETS AND LIABILITIES FEBRUARY 28, 2021
6See Notes to Financial Statements.
ASSETSInvestments, at value (Cost $129,550,460) $ 159,535,434 Deposits with broker 746,355 Receivables:Fund shares sold 254,181 Investment securities sold 16,076 Dividends and interest 163,239
Prepaid expenses 19,831 Total Assets 160,735,116
LIABILITIESCall options written, at value (Premiums received $2,855,715) 1,712,190 Put options written, at value (Premiums received $863,913) 895,070 Payables:Fund shares redeemed 176,731
Accrued Liabilities:Investment adviser fees 79,068 Trustees’ fees and expenses 121 Fund services fees 20,052 Other expenses 32,756
Total Liabilities 2,915,988
NET ASSETS $ 157,819,128
COMPONENTS OF NET ASSETSPaid-in capital $ 134,217,679 Distributable earnings 23,601,449
NET ASSETS $ 157,819,128
SHARES OF BENEFICIAL INTEREST AT NO PAR VALUE (UNLIMITED SHARES AUTHORIZED)Institutional Shares 12,281,532 Investor Shares 20,605
NET ASSET VALUE, OFFERING AND REDEMPTION PRICE PER SHARE Institutional Shares (based on net assets of $157,545,671) $ 12.83 Investor Shares (based on net assets of $273,457) $ 13.27

MAI MANAGED VOLATILITY FUNDSTATEMENT OF OPERATIONS SIX MONTHS ENDED FEBRUARY 28, 2021
7See Notes to Financial Statements.
INVESTMENT INCOMEDividend income $ 776,967 Interest income 74,055
Total Investment Income 851,022
EXPENSESInvestment adviser fees 591,588 Fund services fees 118,053 Transfer agent fees:Institutional Shares 4,895 Investor Shares 1,301
Non 12b-1 shareholder servicing fees: Institutional Shares 69,683 Investor Shares 223
Distribution fees:Investor Shares 376
Custodian fees 8,649 Registration fees:Institutional Shares 9,193 Investor Shares 8,976
Professional fees 23,386 Trustees' fees and expenses 3,459 Other expenses 31,383
Total Expenses 871,165 Fees waived (89,893 )
Net Expenses 781,272
NET INVESTMENT INCOME 69,750
NET REALIZED AND UNREALIZED GAIN (LOSS)Net realized gain on:
Investments 15,294 Written options 2,092,624
Net realized gain 2,107,918 Net change in unrealized appreciation (depreciation) on:
Investments 5,810,124 Written options 2,563,823
Net change in unrealized appreciation (depreciation) 8,373,947 NET REALIZED AND UNREALIZED GAIN 10,481,865 INCREASE IN NET ASSETS RESULTING FROM OPERATIONS $ 10,551,615

MAI MANAGED VOLATILITY FUNDSTATEMENTS OF CHANGES IN NET ASSETS
8See Notes to Financial Statements.
For the Six Months Ended
February 28, 2021
For the Year Ended
August 31, 2020
OPERATIONSNet investment income $ 69,750 $ 1,119,032 Net realized gain (loss) 2,107,918 (7,158,569 )Net change in unrealized appreciation (depreciation) 8,373,947 8,470,879
Increase in Net Assets Resulting from Operations 10,551,615 2,431,342 DISTRIBUTIONS TO SHAREHOLDERS
Institutional Shares (68,916 ) (2,193,901 )Investor Shares – (2,480 )
Total Distributions Paid (68,916 ) (2,196,381 ) CAPITAL SHARE TRANSACTIONS
Sale of shares:Institutional Shares 7,312,499 41,903,360 Investor Shares 6,600 16,383
Reinvestment of distributions:Institutional Shares 68,529 2,161,228 Investor Shares – 2,480
Redemption of shares:Institutional Shares (16,462,827 ) (32,831,280 )Investor Shares (67,693 ) (167,556 )
Increase (Decrease) in Net Assets from Capital Share Transactions (9,142,892 ) 11,084,615 Increase in Net Assets 1,339,807 11,319,576 NET ASSETS
Beginning of Period 156,479,321 145,159,745 End of Period $ 157,819,128 $ 156,479,321
SHARE TRANSACTIONSSale of shares:Institutional Shares 583,309 3,542,807 Investor Shares 501 1,523
Reinvestment of distributions:Institutional Shares 5,507 183,359 Investor Shares – 197
Redemption of shares:Institutional Shares (1,308,563 ) (2,889,476 )Investor Shares (5,193 ) (13,543 )
Increase (Decrease) in Shares (724,439 ) 824,867

MAI MANAGED VOLATILITY FUNDFINANCIAL HIGHLIGHTS
9See Notes to Financial Statements.
These financial highlights reflect selected data for a share outstanding throughout each period.
For the Six Months Ended
February 28, 2021
For the Years Ended August 31,
2020 2019 2018 2017 2016
INSTITUTIONAL CLASSNET ASSET VALUE, Beginning of Period $ 12.01 $ 11.90 $ 11.87 $ 11.15 $ 10.57 $ 10.40 INVESTMENT OPERATIONS
Net investment income (a) 0.01 0.09 0.16 0.10 0.06 0.06 Net realized and unrealized gain 0.82 0.19 0.21 0.89 0.59 0.51
Total from Investment Operations 0.83 0.28 0.37 0.99 0.65 0.57
DISTRIBUTIONS TO SHAREHOLDERS FROMNet investment income (0.01 ) (0.11 ) (0.14 ) (0.08 ) (0.04 ) (0.04 )Net realized gain – (0.06 ) (0.20 ) (0.19 ) (0.03 ) (0.36 )
Total Distributions to Shareholders (0.01 ) (0.17 ) (0.34 ) (0.27 ) (0.07 ) (0.40 )
NET ASSET VALUE, End of Period $ 12.83 $ 12.01 $ 11.90 $ 11.87 $ 11.15 $ 10.57 TOTAL RETURN 6.87 %(b) 2.42 % 3.33 % 9.02 % 6.20 % 5.65 % RATIOS/SUPPLEMENTARY DATANet Assets at End of Period (000s omitted) $ 157,546 $ 156,165 $ 144,705 $ 127,214 $ 117,287 $ 103,436
Ratios to Average Net Assets:
Net investment income 0.09 %(c) 0.73 % 1.38 % 0.85 % 0.59 % 0.55 %Net expenses 0.99 %(c) 1.00 % 0.99 % 0.99 % 0.99 % 0.99 %Interest expenses – %(c) 0.01 % – % – % – % – %Net expenses without interest expenses 0.99 %(c) 0.99 % 0.99 % 0.99 % 0.99 % 0.99 %Gross expenses (d) 1.09 %(c) 1.12 % 1.10 % 1.13 % 1.14 % 1.17 %
PORTFOLIO TURNOVER RATE 1 %(b) 22 % 1 % 21 % 60 % 85 %
(d) Reflects the expense ratio excluding any waivers and/or reimbursements.(c) Annualized.(b) Not annualized.(a) Calculated based on average shares outstanding during each period.

MAI MANAGED VOLATILITY FUNDFINANCIAL HIGHLIGHTS
10See Notes to Financial Statements.
These financial highlights reflect selected data for a share outstanding throughout each period.
For the Six Months Ended
February 28, 2021
For the Years Ended August 31,
2020 2019 2018 2017 2016
INVESTOR CLASSNET ASSET VALUE, Beginning of Period $ 12.44 $ 12.24 $ 12.11 $ 11.31 $ 10.71 $ 10.51 INVESTMENT OPERATIONS
Net investment income (loss) (a) 0.06 0.13 0.07 0.04 0.03 Net realized and unrealized gain 0.84 0.21 0.22 0.92 0.59 0.53
Total from Investment Operations 0.83 0.27 0.35 0.99 0.63 0.56
DISTRIBUTIONS TO SHAREHOLDERS FROMNet investment income – (0.01 ) (0.02 ) – – – Net realized gain – (0.06 ) (0.20 ) (0.19 ) (0.03 ) (0.36 )
Total Distributions to Shareholders – (0.07 ) (0.22 ) (0.19 ) (0.03 ) (0.36 )
NET ASSET VALUE, End of Period $ 13.27 $ 12.44 $ 12.24 $ 12.11 $ 11.31 $ 10.71 TOTAL RETURN 6.67 %(c) 2.22 % 2.98 % 8.81 % 5.89 % 5.46 % RATIOS/SUPPLEMENTARY DATANet Assets at End of Period (000s omitted) $ 273 $ 315 $ 454 $ 486 $ 635 $ 596
Ratios to Average Net Assets:
Net investment income (loss) (0.16 )%(d) 0.48 % 1.12 % 0.57 % 0.33 % 0.29 %Net expenses 1.24 %(d) 1.25 % 1.24 % 1.24 % 1.24 % 1.24 %Interest expenses – %(d) 0.01 % – % – % – % – %Net expenses without interest expenses 1.24 %(d) 1.24 % 1.24 % 1.24 % 1.24 % 1.24 %Gross expenses (e) 8.82 %(d) 6.78 % 5.56 % 5.53 % 4.62 % 4.33 %
PORTFOLIO TURNOVER RATE 1 %(c) 22 % 1 % 21 % 60 % 85 %
(a) Calculated based on average shares outstanding during each period.(b) The per share income (loss) does not reconcile with the Statement of Operations due to share transactions for the
period.(c) Not annualized.(d) Annualized.(e) Reflects the expense ratio excluding any waivers and/or reimbursements.
(0.01)(b)

11
MAI MANAGED VOLATILITY FUNDNOTES TO FINANCIAL STATEMENTS FEBRUARY 28, 2021
Note 1. Organization
The MAI Managed Volatility Fund (the “Fund”) is a diversified portfolio of Forum Funds (the “Trust”). The Trust is a Delaware statutory trust that is registered as an open-end, management investment company under the Investment Company Act of 1940, as amended (the “Act”). Under its Trust Instrument, the Trust is authorized to issue an unlimited number of the Fund’s shares of beneficial interest without par value. The Fund currently offers two classes of shares: Institutional Class and Investor Class. Institutional Class and Investor Class commenced operations on September 23, 2010, and December 2, 2010, respectively. The Fund’s investment objective is income and long-term capital appreciation.
Note 2. Summary of Significant Accounting Policies
The Fund is an investment company and follows accounting and reporting guidance under Financial Accounting Standards Board (“FASB”) Accounting Standards Codification (“ASC”) Topic 946, “Financial Services – Investment Companies.” These financial statements are prepared in accordance with accounting principles generally accepted in the United States of America (“GAAP”), which require management to make estimates and assumptions that affect the reported amounts of assets and liabilities, the disclosure of contingent liabilities at the date of the financial statements, and the reported amounts of increases and decreases in net assets from operations during the fiscal period. Actual amounts could differ from those estimates. The following summarizes the significant accounting policies of the Fund:
Security Valuation – Securities are valued at market prices using the last quoted trade or official closing price from the principal exchange where the security is traded, as provided by independent pricing services on each Fund business day. In the absence of a last trade, securities are valued at the mean of the last bid and ask price provided by the pricing service. Debt securities may be valued at prices supplied by a fund’s pricing agent based on broker or dealer supplied valuations or matrix pricing, a method of valuing securities by reference to the value of other securities with similar characteristics such as rating, interest rate and maturity. Exchange-traded options for which the last quoted sale price is outside the closing bid and ask price will be valued at the mean of the closing bid and ask price. Short-term investments that mature in sixty days or less may be valued at amortized cost.
The Fund values its investments at fair value pursuant to procedures adopted by the Trust’s Board of Trustees (the “Board”) if (1) market quotations are not readily available or (2) the Adviser, as defined in Note 3, believes that the values available are unreliable. The Trust’s Valuation Committee, as defined in the Fund’s registration statement, performs certain functions as they relate to the administration and oversight of the Fund’s valuation procedures. Under these procedures, the Valuation Committee convenes on a regular and ad hoc basis to review such investments and considers a number of factors, including valuation methodologies and significant unobservable inputs, when arriving at fair value.
The Valuation Committee may work with the Adviser to provide valuation inputs. In determining fair valuations, inputs may include market-based analytics that may consider related or comparable assets or liabilities, recent transactions, market multiples, book values and other relevant investment information. Adviser inputs may include an income-based approach in which the anticipated future cash flows of the investment are discounted in determining fair value. Discounts may also be applied based on the nature or duration of any restrictions on the disposition of the investments. The Valuation Committee performs regular reviews of valuation methodologies, key inputs and assumptions, disposition analysis and market activity.
Fair valuation is based on subjective factors and, as a result, the fair value price of an investment may differ from the security’s market price and may not be the price at which the asset may be sold. Fair

12
MAI MANAGED VOLATILITY FUNDNOTES TO FINANCIAL STATEMENTS FEBRUARY 28, 2021
valuation could result in a different Net Asset Value (“NAV”) than a NAV determined by using market quotes.
GAAP has a three-tier fair value hierarchy. The basis of the tiers is dependent upon the various “inputs” used to determine the value of the Fund’s investments. These inputs are summarized in the three broad levels listed below:
Level 1 - Quoted prices in active markets for identical assets and liabilities.
Level 2 - Prices determined using significant other observable inputs (including quoted prices for similar securities, interest rates, prepayment speeds, credit risk, etc.). Short-term securities with maturities of sixty days or less are valued at amortized cost, which approximates market value, and are categorized as Level 2 in the hierarchy. Municipal securities, long-term U.S. government obligations and corporate debt securities are valued in accordance with the evaluated price supplied by a pricing service and generally categorized as Level 2 in the hierarchy. Other securities that are categorized as Level 2 in the hierarchy include, but are not limited to, warrants that do not trade on an exchange, securities valued at the mean between the last reported bid and ask quotation and international equity securities valued by an independent third party with adjustments for changes in value between the time of the securities’ respective local market closes and the close of the U.S. market.
Level 3 - Significant unobservable inputs (including the Fund’s own assumptions in determining the fair value of investments).
The aggregate value by input level, as of February 28, 2021, for the Fund’s investments is included in the Fund’s Notes to Schedules of Investments and Call and Put Options Written.
Security Transactions, Investment Income and Realized Gain and Loss – Investment transactions are accounted for on the trade date. Dividend income is recorded on the ex-dividend date. Foreign dividend income is recorded on the ex-dividend date or as soon as possible after determining the existence of a dividend declaration after exercising reasonable due diligence. Income and capital gains on some foreign securities may be subject to foreign withholding taxes, which are accrued as applicable. Interest income is recorded on an accrual basis. Premium is amortized to the next call date above par and discount is accreted to maturity using the effective interest method. Identified cost of investments sold is used to determine the gain and loss for both financial statement and federal income tax purposes.
Written Options – When a fund writes an option, an amount equal to the premium received by the fund is recorded as a liability and is subsequently adjusted to the current value of the option written. Premiums received from writing options that expire unexercised are treated by the fund on the expiration date as realized gain from written options. The difference between the premium and the amount paid on effecting a closing purchase transaction, including brokerage commissions, is also treated as a realized gain, or if the premium is less than the amount paid for the closing purchase transaction, as a realized loss. If a call option is exercised, the premium is added to the proceeds from the sale of the underlying security in determining whether the fund has realized a gain or loss. If a put option is exercised, the premium reduces the cost basis of the securities purchased by the fund. The fund, as writer of an option, bears the market risk of an unfavorable change in the price of the security underlying the written option. Written options are non-income producing securities.
The values of each individual written option outstanding as of February 28, 2021, are disclosed in the Fund’s Schedule of Call and Put Options Written.
Distributions to Shareholders – Distributions to shareholders of net investment income, if any, are declared and paid at least quarterly. Distributions to shareholders of net capital gains, if any, are

13
MAI MANAGED VOLATILITY FUNDNOTES TO FINANCIAL STATEMENTS FEBRUARY 28, 2021
declared and paid at least annually. Distributions to shareholders are recorded on the ex-dividend date. Distributions are based on amounts calculated in accordance with applicable federal income tax regulations, which may differ from GAAP. These differences are due primarily to differing treatments of income and gain on various investment securities held by the Fund, timing differences and differing characterizations of distributions made by the Fund.
Federal Taxes – The Fund intends to continue to qualify each year as a regulated investment company under Subchapter M of Chapter 1, Subtitle A, of the Internal Revenue Code of 1986, as amended (“Code”), and to distribute all of its taxable income to shareholders. In addition, by distributing in each calendar year substantially all of its net investment income and capital gains, if any, the Fund will not be subject to a federal excise tax. Therefore, no federal income or excise tax provision is required. The Fund files a U.S. federal income and excise tax return as required. The Fund’s federal income tax returns are subject to examination by the Internal Revenue Service for a period of three fiscal years after they are filed. As of February 28, 2021, there are no uncertain tax positions that would require financial statement recognition, de-recognition or disclosure.
Income and Expense Allocation – The Trust accounts separately for the assets, liabilities and operations of each of its investment portfolios. Expenses that are directly attributable to more than one investment portfolio are allocated among the respective investment portfolios in an equitable manner.
The Fund's class-specific expenses are charged to the operations of that class of shares. Income and expenses (other than expenses attributable to a specific class) and realized and unrealized gains or losses on investments are allocated to each class of shares based on the class’ respective net assets to the total net assets of the Fund.
Commitments and Contingencies – In the normal course of business, the Fund enters into contracts that provide general indemnifications by the Fund to the counterparty to the contract. The Fund’s maximum exposure under these arrangements is dependent on future claims that may be made against the Fund and, therefore, cannot be estimated; however, based on experience, the risk of loss from such claims is considered remote. The Fund has determined that none of these arrangements requires disclosure on the Fund’s balance sheet.
Note 3. Fees and Expenses
Investment Adviser – MAI Capital Management, LLC (the “Adviser”) is the investment adviser to the Fund. Pursuant to an investment advisory agreement, the Adviser receives an advisory fee, payable monthly, from the Fund at an annual rate of 0.75% of the Fund’s average daily net assets.
Distribution – Foreside Fund Services, LLC serves as the Fund’s distributor (the “Distributor”). The Distributor is not affiliated with the Adviser or Atlantic Fund Administration, LLC, a wholly owned subsidiary of Apex US Holdings, LLC (d/b/a Apex Fund Services) (“Apex”) or their affiliates. The Trust has adopted a Rule 12b-1 plan under which the Fund pays the Distributor a fee up to 0.25% of the average daily net assets of the Investor Class for distribution services and/or the servicing of shareholder accounts. Because the Investor Class pays distribution fees on an ongoing basis, over time these fees will increase the cost of your investment and may cost you more than paying other types of sales charges. The Distributor may pay any fee received under the Rule 12b-1 plan to the Adviser or other financial intermediaries that provide distribution and shareholder services with respect to Investor Class shares. In addition to paying fees under the Rule 12b-1 plan, the Fund may pay service fees to financial intermediaries for administration, recordkeeping and other shareholder services associated with shareholders whose shares are held of record in omnibus accounts, other group accounts or accounts traded through registered securities clearing agents. If the Fund pays
14
MAI MANAGED VOLATILITY FUNDNOTES TO FINANCIAL STATEMENTS FEBRUARY 28, 2021
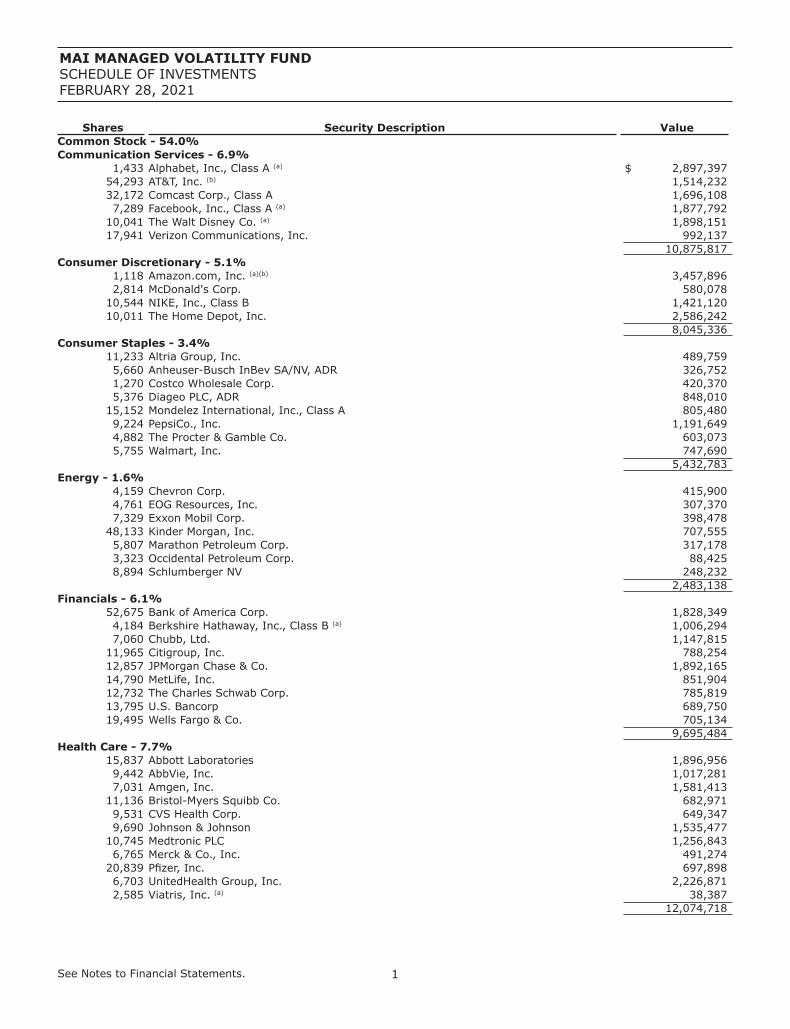
shareholder service fees on an ongoing basis, over time these fees will increase the cost of your investment.
Other Service Providers – Apex provides fund accounting, fund administration, compliance and transfer agency services to the Fund. The fees related to these services are included in Fund services fees within the Statement of Operations. Apex also provides certain shareholder report production and EDGAR conversion and filing services. Pursuant to an Apex Services Agreement, the Fund pays Apex customary fees for its services. Apex provides a Principal Executive Officer, a Principal Financial Officer, a Chief Compliance Officer and an Anti-Money Laundering Officer to the Fund, as well as certain additional compliance support functions.
Trustees and Officers – Each Independent Trustee’s annual retainer is $31,000 ($41,000 for the Chairman), and the Audit Committee Chairman receives an additional $2,000 annually. The Trustees and Chairman may receive additional fees for special Board meetings. Each Trustee is also reimbursed for all reasonable out-of-pocket expenses incurred in connection with his or her duties as a Trustee, including travel and related expenses incurred in attending Board meetings. The amount of Trustees’ fees attributable to the Fund is disclosed in the Statement of Operations. Certain officers of the Trust are also officers or employees of the above named service providers, and during their terms of office received no compensation from the Fund.
Note 4. Expense Reimbursements and Fees Waived
The Adviser has contractually agreed to waive its fee and/or reimburse Fund expenses to limit Total Annual Fund Operating Expenses After Fee Waiver and/or Expense Reimbursement (excluding all taxes, interest, acquired fund fees and expenses, dividends on short sales, brokerage costs, and extraordinary expenses) to 0.99% and 1.24%, of the Institutional Class and Investor Class, respectively, through at least January 1, 2022. The contractual waivers may be changed or eliminated at any time with consent of the Board. During the period ended February 28, 2021, fees waived were $89,893.
The Adviser may be reimbursed by the Fund for fees waived and expenses reimbursed by the Adviser pursuant to the Expense Cap if such payment is made within three years of the fee waiver or expense reimbursement, and does not cause the Total Annual Fund Operating Expenses After Fee Waiver and/or Expense Reimbursement of a class (after the recoupment has been taken into account) to exceed the lesser of (i) the then-current expense cap, and (ii) the expense cap in place at the time the fees/expenses were waived/reimbursed. As of February 28, 2021, $566,643 is subject to recapture by the Adviser.
Note 5. Security Transactions
Investment transactions for the period ended February 28, 2021, excluding U.S. Government and Agency securities and short-term investments, were as follows:
Non-U.S. Government Obligations
Purchases Sales $ 468,712 $ 502,682
Note 6. Summary of Derivative Activity
The volume of open derivative positions may vary on a daily basis as the Fund transacts derivative contracts in order to achieve the exposure desired by the Adviser. Premiums received on written

15
MAI MANAGED VOLATILITY FUNDNOTES TO FINANCIAL STATEMENTS FEBRUARY 28, 2021
options for the period ended February 28, 2021, for any derivative type that was held during the period is as follows:
Written Options $ (16,555,033 )
The Fund’s use of derivatives during the period ended February 28, 2021, was limited to written options.
Following is a summary of the effect of derivatives on the Statement of Assets and Liabilities as of February 28, 2021:
Location: Equity RiskLiability derivatives:Call options written $ (1,712,190 )Put options written (895,070 )Total liability derivatives $ (2,607,260 )
Realized and unrealized gains and losses on derivatives contracts during the period ended February 28, 2021 by the Fund are recorded in the following locations on the Statement of Operations:
Location:Equity
ContractsNet realized gain (loss) on:Written options $ 2,092,624
Net change in unrealized appreciation (depreciation) on:Written options $ 2,563,823
Asset (Liability) amounts shown in the table below represent amounts for derivative related investments at February 28, 2021. These amounts may be collateralized by cash or financial instruments.
Gross Asset (Liability) as Presented in
the Statement of Assets and
Liabilities
Financial Instruments (Received) Pledged*
Cash Collateral (Received) Pledged* Net Amount
Liabilities:Over-the-counter derivatives** $ (2,607,260) $ 2,607,260 $ – $ –
* The actual financial instruments and cash collateral (received) pledged may be in excess of the amounts shown in the table. The table only reflects collateral amounts up to the amount of the financial instrument disclosed on the Statement of Assets and Liabilities
** Over-the-counter derivatives may consist of written options contracts. The amounts disclosed above represent the exposure to one or more counterparties. For further detail on individual derivative contracts and the corresponding unrealized appreciation (depreciation), see the Schedule of Call and Put Options Written.
Note 7. Federal Income Tax
As of February 28, 2021, the cost of investments for federal income tax purposes is substantially the same as for financial statement purposes and the components of net unrealized appreciation were as follows:
16
MAI MANAGED VOLATILITY FUNDNOTES TO FINANCIAL STATEMENTS FEBRUARY 28, 2021
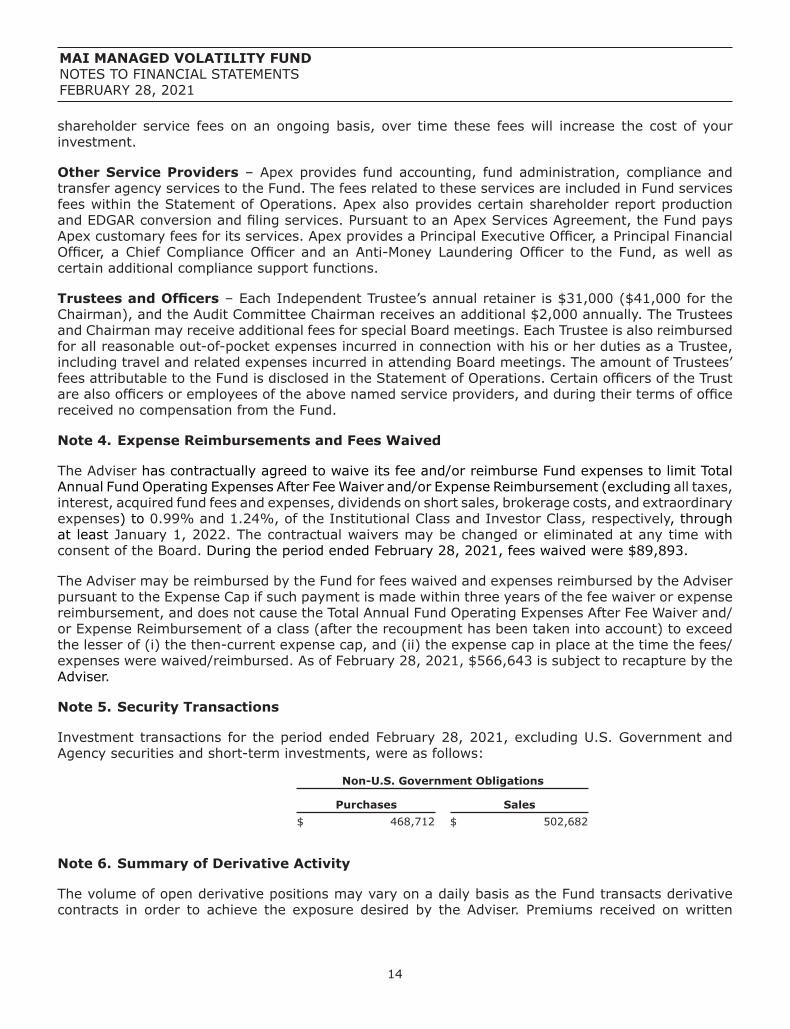
Gross Unrealized Appreciation $ 34,289,800 Gross Unrealized Depreciation (3,192,458 )Net Unrealized Appreciation $ 31,097,342
As of August 31, 2020, distributable earnings (accumulated loss) on a tax basis were as follows:
Undistributed Ordinary Income $ 35,482 Capital and Other Losses (9,318,220 )Unrealized Appreciation 22,401,488 Total $ 13,118,750
The difference between components of distributable earnings on a tax basis and the amounts reflected in the Statement of Assets and Liabilities are primarily due to temporary book/tax differences related to wash sales, constructive sales, straddles, index options and equity return of capital.
For tax purposes, the prior year post October loss was $9,318,220 (realized during the period November 1, 2019 through August 31, 2020). This loss was recognized for tax purposes on the first business day of the Fund’s current fiscal year, September 1, 2020.
Note 8. Underlying Investments in Other Pooled Investment Vehicles
The Fund currently meets the collateral requirements of a tri-party agreement between the prime broker, custodian and the Fund by investing a portion of its assets in the Fidelity Investments Money Market Government Portfolio – Class I and holding the shares in a segregated account pledged to the prime broker. The performance of the Fund may be directly affected by the performance of the Fidelity Investments Money Market Government Portfolio – Class I. As of February 28, 2021, the percentage of net assets invested in the Fidelity Investments Money Market Government Portfolio – Class I was 42.3%%. The latest financial statements for the Fidelity Investments Money Market Government Portfolio – Class I can be found at www.sec.gov.
Note 9. Subsequent Events
The global outbreak of the COVID-19 virus has caused negative effects on many companies, sectors, countries, regions, and financial markets in general, and uncertainty exists as to its long-term implications. The effects of the pandemic may adversely impact the Fund's assets and performance. The financial statements do not include any adjustments that might result from the outcome of this uncertainty.
Management has evaluated the need for additional disclosures and/or adjustments resulting from subsequent events. Based on this evaluation, no additional disclosures or adjustments were required to the financial statements as of the date the financial statements were issued.

17
MAI MANAGED VOLATILITY FUNDADDITIONAL INFORMATION FEBRUARY 28, 2021
Investment Advisory Agreement Approval
At the September 11, 2020 Board meeting, the Board, including the Independent Trustees, considered the approval of the continuance of the investment advisory agreement between the Adviser and the Trust pertaining to the MAI Managed Volatility Fund (the “Advisory Agreement”). In preparation for its deliberations, the Board requested and reviewed written responses from the Adviser to a due diligence questionnaire circulated on the Board's behalf concerning the services provided by the Adviser. The Board also discussed the materials with Fund counsel and, as necessary, with the Trust's administrator. During its deliberations, the Board received an oral presentation from the Adviser, and was assisted by the advice of Trustee counsel.
At the meeting, the Board reviewed, among other matters: (1) the nature, extent and quality of the services provided to the Fund by the Adviser, including information on the investment performance of the Fund; (2) the costs of the services provided and profitability to the Adviser with respect to its relationship with the Fund; (3) information concerning the advisory fee and total expense ratio of the Fund compared to a relevant peer group of funds; (4) the extent to which economies of scale may be realized as the Fund grows and whether the advisory fee enables the Fund's investors to share in the benefits of economies of scale; and (5) other benefits received by the Adviser from its relationship with the Fund. In addition, the Board recognized that the evaluation process with respect to the Adviser was an ongoing one and, in this regard, the Board considered information provided by the Adviser at regularly scheduled meetings during the past year.
Nature, Extent and Quality of Services
Based on written materials received, a presentation from senior representatives of the Adviser and a discussion with the Adviser about the Adviser’s personnel, operations and financial condition, the Board considered the quality of services provided by the Adviser under the Advisory Agreement. In this regard, the Board considered information regarding the experience, qualifications and professional background of the portfolio managers and other personnel at the Adviser providing services to the Fund, as well as the investment philosophy and decision-making process of the Adviser and the capability and integrity of the Adviser’s senior management and staff.
The Board considered also the adequacy of the Adviser’s resources. The Board noted the Adviser’s representation that the firm is financially stable, and that the Adviser’s financial condition will not impair its ability to provide high-quality advisory services to the Fund. Based on the presentation and the materials provided by the Adviser in connection with the Board’s consideration of the renewal of the Advisory Agreement, the Board concluded that, overall, it was satisfied with the nature, extent and quality of services to be provided to the Fund under the Advisory Agreement.
Performance
In connection with a presentation by the Adviser regarding its approach to managing the Fund, the Board reviewed the performance of the Fund compared to its benchmark. The Board observed that the Fund underperformed the S&P 500 Index, the primary benchmark index for the Fund, for the one-, three-, and five-year periods ended June 30, 2020, and for the period since the Fund’s inception on September 23, 2010. The Board noted the Adviser’s representation that there were limitations inherent in a direct comparison of the Fund’s performance to that of a broad-based securities market index, and that, in contrast to the index, the Fund’s unique investment strategy resulted in less net equity exposure, a more concentrated portfolio of investments, and a divergence in sector weightings. The Board noted the Adviser’s representation that the Fund focused on large capitalization, total return-oriented stocks and a target equity weighting of only 45-55% of the Fund’s total assets, which would limit the Fund’s ability to fully participate in rising stock markets, such as the market environment experienced over the past several years. At the request of the Adviser, the Board also
18
MAI MANAGED VOLATILITY FUNDADDITIONAL INFORMATION FEBRUARY 28, 2021
considered the Fund’s performance relative to the Lipper Alternative Long/Short Equity Funds universe (“Lipper Universe”), which the Adviser believed to be a more suitable comparison to the Fund’s investment strategy than the S&P 500 Index, noting that the Fund outperformed the median of the Lipper Universe for the one-, three-, and five-year periods ended June 30, 2020.
The Board also considered the Fund’s performance relative to an independent peer group of funds identified by Broadridge Financial Solutions, Inc. (“Broadridge”) as having characteristics similar to the Fund, noting that, based on the information provided by Broadridge, the Fund underperformed the median of its Broadridge peer group (“Broadridge Peers”) for one-year period ended June 30, 2020 and outperformed the median of the Broadridge Peers for the three-, and five-year periods ended June 30, 2020. Noting the Adviser’s representation that its unique approach to managing the Fund made it difficult to identify appropriate Broadridge Peers, the Board also considered, at the Adviser’s request, a group of funds selected by MAI from the Morningstar Options-based category (the “Morningstar Peers”) believed to have investment strategies more closely aligned with that of the Fund than the Broadridge Peers. The Board observed that the Fund outperformed the median of the Morningstar Peers for the three- and five-year periods ended June 30, 2020 and that, although the Fund underperformed the median of the Morningstar Peers over the one-year period ended June 30, 2020, the Fund’s performance was more closely aligned to that of the Morningstar Peers than the Broadridge Peers. The Board noted the Adviser’s representation that the objective of the Fund is income and long-term capital appreciation achieved through down market performance and writing options, which may result in performance deviations relating to the S&P 500 and Broadridge Peers.
Based on the foregoing and other applicable considerations, the Board determined that the Fund and its shareholders could benefit from the Adviser’s continued management of the Fund.
Compensation
The Board evaluated the Adviser’s compensation for providing advisory services to the Fund and analyzed comparative information on actual advisory fee rates and actual total expense ratios of the Fund compared to its Broadridge Peers. The Board noted that each of the actual advisory fee rate and actual total expenses for the Fund were lower than the median of the Broadridge Peers. The Board noted that the Adviser had contractually agreed to waive its advisory fee and/or reimburse Fund expenses as necessary to keep the overall expense ratio for the Fund at a level that the Adviser believes is advantageous to asset accumulation. Based on the foregoing and other applicable considerations, the Board concluded that the Adviser’s advisory fee rate charged to the Fund was reasonable.
Cost of Services and Profitability
The Board considered information provided by the Adviser regarding the costs of services and its profitability with respect to the Fund. In this regard, the Board considered the Adviser’s resources devoted to the Fund, as well as the Adviser’s discussion of costs and profitability. The Board noted the Adviser’s representation that it did not maintain separately identifiable profit and loss information for the Fund. Based on other applicable considerations, however, including financial statements from the Adviser indicating its profitability and expenses from overall operations and the Adviser’s representation that the Fund required significantly more attention and resources than the other accounts managed by the Adviser, the Board concluded that the Adviser’s costs of services and profits attributable to management of the Fund were reasonable.
Economies of Scale
The Board evaluated whether the Fund would benefit from any economies of scale. In this regard, the Board considered the Fund’s fee structure, asset size, and net expense ratio. The Board noted the Adviser’s representation that the Fund could potentially benefit from economies of scale if its assets were to increase but that, in light of the Fund’s relatively low asset level, the Adviser was not

19
MAI MANAGED VOLATILITY FUNDADDITIONAL INFORMATION FEBRUARY 28, 2021
proposing breakpoints in the advisory fee at this time. Based on the foregoing and other applicable considerations, and considering the size of the Fund, the Board determined that the asset level of the Fund was not consistent with the existence of economies of scale and that economies of scale were not a material factor to consider in approving the continuation of the Advisory Agreement.
Other Benefits
The Board noted the Adviser’s representation that, aside from its contractual advisory fees, it does not benefit in a material way from its relationship with the Fund. Based on the foregoing representation, the Board concluded that other benefits received by the Adviser from its relationship with the Fund were not a material factor to consider in approving the continuation of the Advisory Agreement.
Conclusion
The Board did not identify any single factor as being of paramount importance, and different Trustees may have given different weight to different factors. The Board reviewed a memorandum from Fund counsel discussing the legal standards applicable to its consideration of the Advisory Agreement. Based on its review, including consideration of each of the factors referenced above, the Board determined, in the exercise of its reasonable business judgment, that the advisory arrangement, as outlined in the Advisory Agreement, was fair and reasonable in light of the services performed or to be performed, expenses incurred or to be incurred and such other matters as the Board considered relevant.
Liquidity Risk Management Program
The Fund have adopted and implemented a written liquidity risk management program, as required by Rule 22e-4 (the “Liquidity Rule”) under the Investment Company Act of 1940, as amended. The liquidity risk management program is reasonably designed to assess and manage the Fund’s liquidity risk, taking into consideration, among other factors, the Fund's investment strategy and the liquidity of the portfolio investments during normal and reasonably foreseeable stressed conditions; its short and long-term cash flow projections and its cash holdings and access to other funding sources.
The Board approved the designation of the Trust’s Valuation Committee as the administrator of the liquidity risk management program (the “Program Administrator”). The Program Administrator is responsible for the administration and oversight of the program and for reporting to the Board on at least an annual basis regarding, among other things, the program’s operation, adequacy, and effectiveness. The Program Administrator assessed the Fund’s liquidity risk profile based on information gathered for the period June 1, 2019 through June 30, 2020 in order to prepare a written report to the Board for review at its meeting held on September 11, 2020.
The Program Administrator’s written report stated that: (i) the Fund is able to meet redemptions in normal and reasonably foreseeable stressed conditions and without significant dilution of remaining shareholders’ interests in the Fund; (ii) the Fund's strategy is appropriate for an open-end mutual fund; (iii) the liquidity classification determinations regarding the Fund's portfolio investments, which take into account a variety of factors and may incorporate analysis from one or more third-party data vendors, remained appropriate; (iv) the Fund did not approach the internal triggers set forth in the liquidity risk management program or the regulatory percentage limitation (15%) on holdings in illiquid investments; (v) it continues to be appropriate to not set a “highly liquid investment minimum” for the Fund because the Fund primarily holds “highly liquid investments”; and (vi) the liquidity risk management program remains reasonably designed and adequately implemented to prevent violations of the Liquidity Rule. The report also reviewed the changes to the Program since its inception. No significant liquidity events impacting the Fund or proposed changes to the Program were noted in the report.

20
MAI MANAGED VOLATILITY FUNDADDITIONAL INFORMATION FEBRUARY 28, 2021
Proxy Voting Information
A description of the policies and procedures that the Fund uses to determine how to vote proxies relating to securities held in the Fund’s portfolio is available, without charge and upon request, by calling (877) 414-7884 and on the U.S. Securities and Exchange Commission’s (the “SEC”) website at www.sec.gov. The Fund’s proxy voting record for the most recent twelve-month period ended June 30 is available, without charge and upon request, by calling (877) 414-7884 and on the SEC’s website at www.sec.gov.
Availability of Quarterly Portfolio Schedules
The Fund files its complete schedule of portfolio holdings with the SEC for the first and third quarters of each fiscal year on Form N-PORT. Forms N-PORT are available free of charge on the SEC’s website at www.sec.gov.
Shareholder Expense Example
As a shareholder of the Fund, you incur ongoing costs, including management fees, distribution (12b-1) fees and other Fund expenses. This example is intended to help you understand your ongoing costs (in dollars) of investing in the Fund and to compare these costs with the ongoing costs of investing in other mutual funds.
The example is based on an investment of $1,000 invested at the beginning of the period and held for the entire period from September 1, 2020 through February 28, 2021.
Actual Expenses – The first line under each share class of the table below provides information about actual account values and actual expenses. You may use the information in this line, together with the amount you invested, to estimate the expenses that you paid over the period. Simply divide your account value by $1,000 (for example, an $8,600 account value divided by $1,000 = 8.6), then multiply the result by the number in the first line under the heading entitled “Expenses Paid During Period” to estimate the expenses you paid on your account during the period.
Hypothetical Example for Comparison Purposes – The second line under each share class of the table below provides information about hypothetical account values and hypothetical expenses based on the Fund’s actual expense ratio and an assumed rate of return of 5% per year before expenses, which is not the Fund’s actual return. The hypothetical account values and expenses may not be used to estimate the actual ending account balance or expenses you paid for the period. You may use this information to compare the ongoing costs of investing in the Fund and other funds. To do so, compare this 5% hypothetical example with the 5% hypothetical examples that appear in the shareholder reports of other funds.
Please note that the expenses shown in the table are meant to highlight your ongoing costs only. Therefore, the second line of the table is useful in comparing ongoing costs only and will not help you determine the relative total costs of owning different funds.

21
MAI MANAGED VOLATILITY FUNDADDITIONAL INFORMATION FEBRUARY 28, 2021
Beginning Account Value September 1,
2020
Ending Account Value
February 28, 2021
Expenses Paid During
Period*
Annualized Expense Ratio*
Institutional SharesActual $ 1,000.00 $ 1,068.74 $ 5.08 0.99%Hypothetical (5% return before expenses) $ 1,000.00 $ 1,019.89 $ 4.96 0.99%Investor SharesActual $ 1,000.00 $ 1,066.72 $ 6.35 1.24%Hypothetical (5% return before expenses) $ 1,000.00 $ 1,018.65 $ 6.21 1.24%
* Expenses are equal to the Fund’s annualized expense ratio multiplied by the average account value over the period, multiplied by the number of days in the most recent fiscal half-year (181) divided by 365 to reflect the half-year period.
MAI Managed Volatility FundInvestor Class(DIVPX)Institutional Class(MAIPX)
INVESTMENT ADVISER
MAI Capital Management, LLC1360 E. Ninth Street, Suite 1100 Cleveland, OH 44114
TRANSFER AGENT
Apex Fund Services P.O. Box 588 Portland, ME 04112www.theapexgroup.com
DISTRIBUTOR
Foreside Fund Services, LLCThree Canal Plaza, Suite 100Portland, ME 04101www.foreside.com
This report is submitted for the general information of the shareholders of the Fund. It is not authorized for distribution to prospective investors unless preceded or accompanied by an effective prospectus, which includes information regarding the Fund’s risks, objectives, fees and expenses, experience of its management and other information.
244-SAR-0221