Embed Size (px)
Citation preview
sensors
Article
A 3D-Printed Soft Fingertip Sensor for Providing Informationabout Normal and Shear Components of Interaction Forces
Gerjan Wolterink 1,2,* , Remco Sanders 1, Bert-Jan van Beijnum 2 , Peter Veltink 2 and Gijs Krijnen 1
Citation: Wolterink, G.; Sanders, R.;
van Beijnum, B.-J.; Veltink, P.; Krijnen,
G. A 3D-Printed Soft Fingertip Sensor
for Providing Information about
Normal and Shear Components of
Interaction Forces. Sensors 2021, 21,
4271. https://doi.org/10.3390/
s21134271
Academic Editors: Akif Kaynak and
Carlos Sánchez-Somolinos
Received: 12 April 2021
Accepted: 18 June 2021
Published: 22 June 2021
Publisher’s Note: MDPI stays neutral
with regard to jurisdictional claims in
published maps and institutional affil-
iations.
Copyright: © 2021 by the authors.
Licensee MDPI, Basel, Switzerland.
This article is an open access article
distributed under the terms and
conditions of the Creative Commons
Attribution (CC BY) license (https://
creativecommons.org/licenses/by/
4.0/).
1 Robotics and Mechatronics Group (RAM), University of Twente, 7500 AE Enschede, The Netherlands;[email protected] (R.S.); [email protected] (G.K.)
2 Biomedical Signals and Systems (BSS), University of Twente, 7500 AE Enschede, The Netherlands;[email protected] (B.-J.v.B.); [email protected] (P.V.)
* Correspondence: [email protected]
Abstract: Sensing of the interaction forces at fingertips is of great value in assessment and rehabili-tation therapy. Current force sensors are not compliant to the fingertip tissue and result in loss oftouch sensation of the user. This work shows the development and characterization of a flexiblefully-3D-printed piezoresistive shear and normal force sensor that uses the mechanical deformationof the finger tissue. Two prototypes of the sensing structure are evaluated using a finite elementmodel and a measurement setup that applies normal and shear forces up to 10 N on a fingertipphantom placed inside the sensing structure, which is fixed to prevent slippage. Furthermore, therelation between strain (rate) and resistance of the conductive TPU, used for the strain gauges, ischaracterized. The applied normal and shear force components of the 3D-printed sensing structurecan be partly separated. FEM analysis showed that the output of the sensor is largely related tothe sensor geometry and location of the strain gauges. Furthermore, the conductive TPU that wasused has a negative gauge factor for the strain range used in this study and might cause non-linearbehaviors in the sensor output.
Keywords: 3D-printing; conductive; TPU; flexible, soft, shear force; fingertip sensor
1. Introduction
Measurement of the interaction forces between the fingertips and the external environ-ment is of great value in upper extremity assessment and for interaction in rehabilitationtherapy where patients need to relearn motor tasks [1]. While handling objects, theseinteraction forces can reach up to 50 N for normal and up to 10 N for shear forces, wherethe high dynamic range for resolving both forces is below 10 N [2,3]. Current availableforce sensors, capable of measuring shear and/or normal forces, show two main difficulties.Most sensors are mainly made of stiff materials leading to the loss of touch sensation ofthe user. Secondly, these sensors are not ideally adapted to the shape and stiffness of thefingertip, leading to poor sensor-to-skin attachment. Due to this poor contact the sensorstend to shift easily by external forces [4]. In practice this issue has presented itself in theform of limited usefulness and reliability of current force sensors [5].
In recent years the interest in and development of 3D-printed sensors have increaseddue to the advent of multi-material printers and increasing availability of conductivethermoplastic materials [6–8]. The introduction of soft and flexible materials with electricalproperties creates the opportunity for applications in soft robotics [9]. Furthermore, the highcustomizability of 3D-printing makes these sensors an ultimate candidate for biomedicalapplications such as biopotential electrodes [10,11], tactile and bending sensors [12,13], andsoft finger shear- and normal-force sensors [14]. Ideally, the sensor on the fingers shouldbe soft and not affect the touch sensation of the user. These 3D-printed sensor structureshave potential advantages for development of complex sensing structures that cannot beproduced using traditional production methods, while still being highly customizable to fit
Sensors 2021, 21, 4271. https://doi.org/10.3390/s21134271 https://www.mdpi.com/journal/sensors
Sensors 2021, 21, 4271 2 of 13
to an individual user. Furthermore, these sensing structures may in the future be integratedinto larger, multi-functional structures [7].
The goal of this work is to create and characterize a 2 degrees of freedom (DoF) forcesensor, which measures the normal and interaction shear forces between the environmentand the fingertips. To minimize the loss of touch sensation of the user, the sensor structureshould be compliant with the soft finger tissue and ensure direct interaction betweenfingertip skin and the object.
2. Design
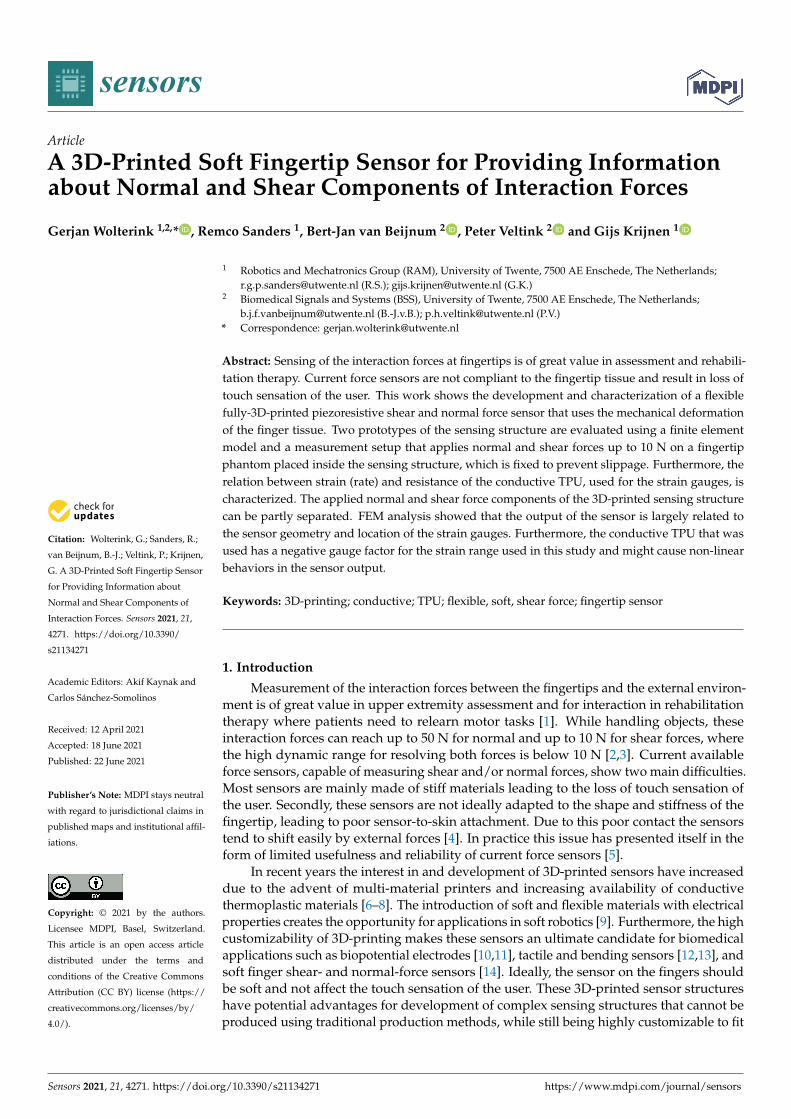
The sensing principle of the sensor is based on the mechanical deformation of softtissue around the bone (distal phalanx) in the fingertip [14]. A normal or shear forceapplied by the fingertips results in a movement and compression of the soft tissue relativeto the distal phalanx and nail-bed. This movement can be sensorized by placing a flexiblestrap, with embedded strain gauges, on top of the nail and around the fingertip. Since anormal force exerted on the fingertip results in a symmetric deformation on both sides ofthe straps and a shear force induces a non-symmetric deformation (see Figure 1), the strapcontains two strain gauges, one on each side, to separate normal from shear force.
No Load Normal Force Shear Force
Figure 1. Deformation of the sensing structure under normal and shear force, colors representamount of deformation.
Yin et al. [3] demonstrated a comparable setup using traditional fabrication methodsusing microfluidic channels filled with liquid metal. Their design focuses on robotic tactilesensing and therefore does not focus on facilitating the touch sensation of human fingertips,and the design and characterization lack the presence of the distal phalanx and nail-bed.Nevertheless, the work by Yin et al. supports the interest in these types of sensors in (soft)robotic tactile sensing or use in prosthesis for haptic feedback applications.
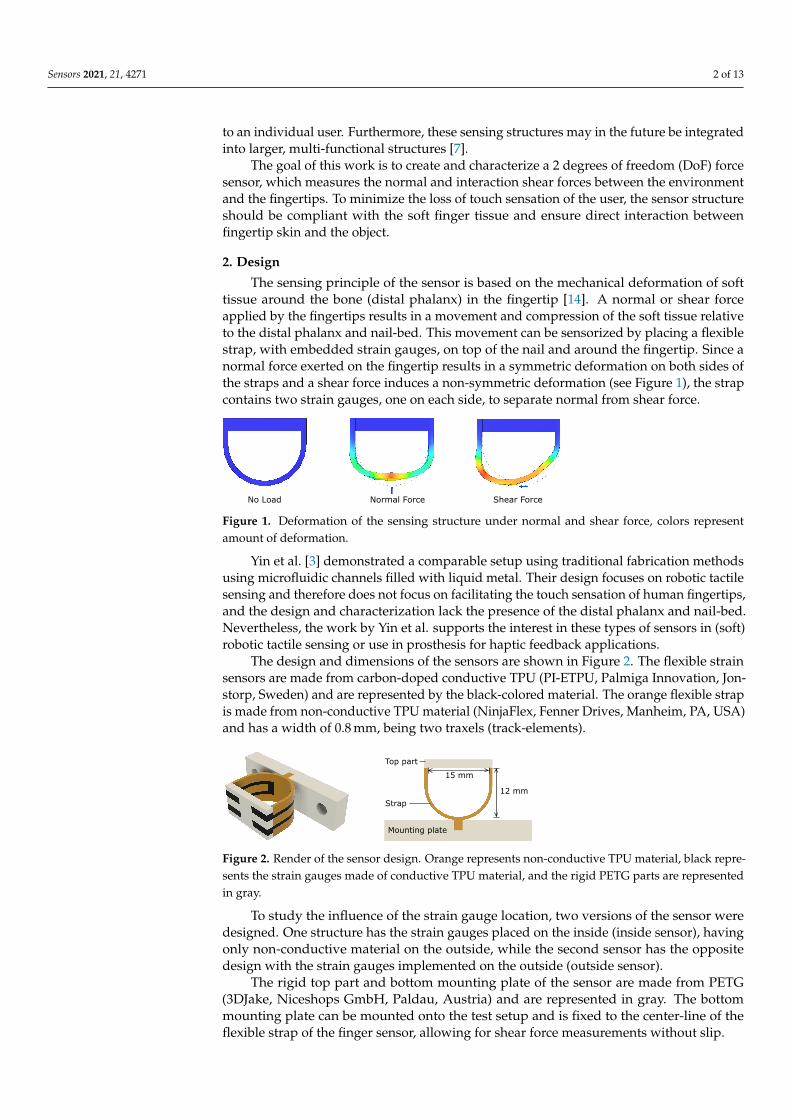
The design and dimensions of the sensors are shown in Figure 2. The flexible strainsensors are made from carbon-doped conductive TPU (PI-ETPU, Palmiga Innovation, Jon-storp, Sweden) and are represented by the black-colored material. The orange flexible strapis made from non-conductive TPU material (NinjaFlex, Fenner Drives, Manheim, PA, USA)and has a width of 0.8 mm, being two traxels (track-elements).
15 mm
12 mm
Mounting plate
Strap
Top part
Figure 2. Render of the sensor design. Orange represents non-conductive TPU material, black repre-sents the strain gauges made of conductive TPU material, and the rigid PETG parts are representedin gray.
To study the influence of the strain gauge location, two versions of the sensor weredesigned. One structure has the strain gauges placed on the inside (inside sensor), havingonly non-conductive material on the outside, while the second sensor has the oppositedesign with the strain gauges implemented on the outside (outside sensor).
The rigid top part and bottom mounting plate of the sensor are made from PETG(3DJake, Niceshops GmbH, Paldau, Austria) and are represented in gray. The bottommounting plate can be mounted onto the test setup and is fixed to the center-line of theflexible strap of the finger sensor, allowing for shear force measurements without slip.
Sensors 2021, 21, 4271 3 of 13
3. Numerical Simulation
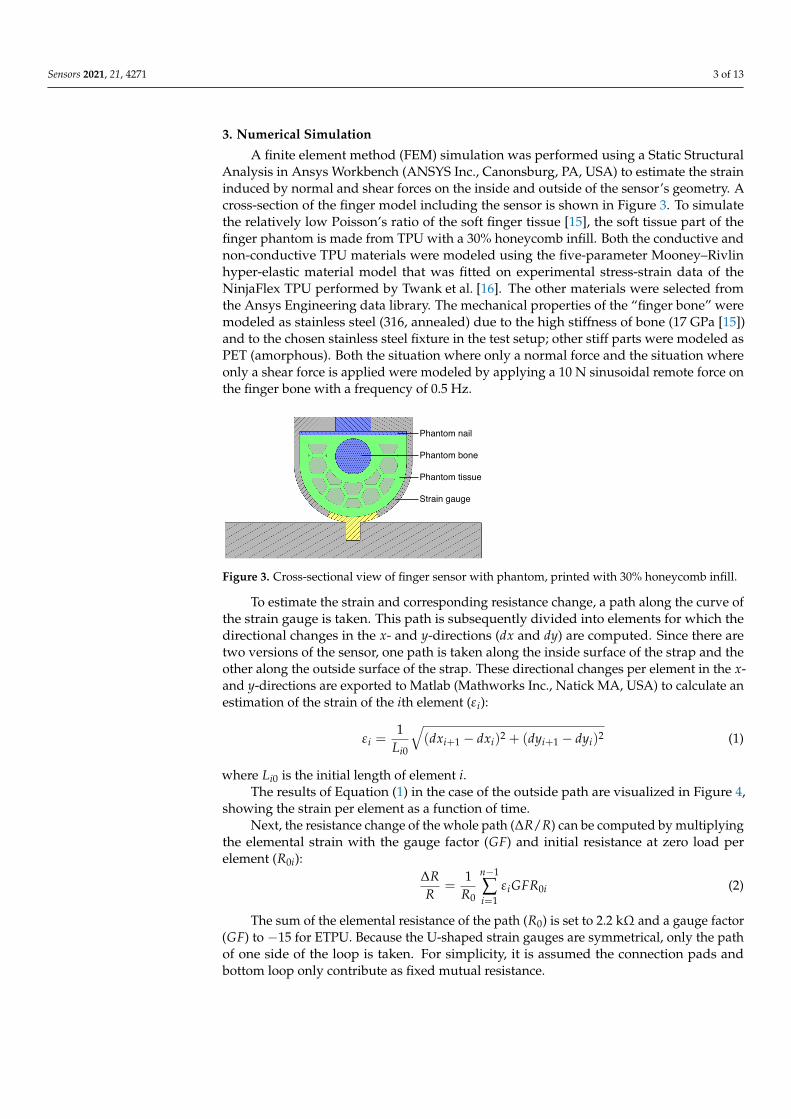
A finite element method (FEM) simulation was performed using a Static StructuralAnalysis in Ansys Workbench (ANSYS Inc., Canonsburg, PA, USA) to estimate the straininduced by normal and shear forces on the inside and outside of the sensor’s geometry. Across-section of the finger model including the sensor is shown in Figure 3. To simulatethe relatively low Poisson’s ratio of the soft finger tissue [15], the soft tissue part of thefinger phantom is made from TPU with a 30% honeycomb infill. Both the conductive andnon-conductive TPU materials were modeled using the five-parameter Mooney–Rivlinhyper-elastic material model that was fitted on experimental stress-strain data of theNinjaFlex TPU performed by Twank et al. [16]. The other materials were selected fromthe Ansys Engineering data library. The mechanical properties of the “finger bone” weremodeled as stainless steel (316, annealed) due to the high stiffness of bone (17 GPa [15])and to the chosen stainless steel fixture in the test setup; other stiff parts were modeled asPET (amorphous). Both the situation where only a normal force and the situation whereonly a shear force is applied were modeled by applying a 10 N sinusoidal remote force onthe finger bone with a frequency of 0.5 Hz.
Phantom nail
Phantom bone
Phantom tissue
Strain gauge
Figure 3. Cross-sectional view of finger sensor with phantom, printed with 30% honeycomb infill.
To estimate the strain and corresponding resistance change, a path along the curve ofthe strain gauge is taken. This path is subsequently divided into elements for which thedirectional changes in the x- and y-directions (dx and dy) are computed. Since there aretwo versions of the sensor, one path is taken along the inside surface of the strap and theother along the outside surface of the strap. These directional changes per element in the x-and y-directions are exported to Matlab (Mathworks Inc., Natick MA, USA) to calculate anestimation of the strain of the ith element (εi):
εi =1
Li0
√(dxi+1 − dxi)2 + (dyi+1 − dyi)2 (1)
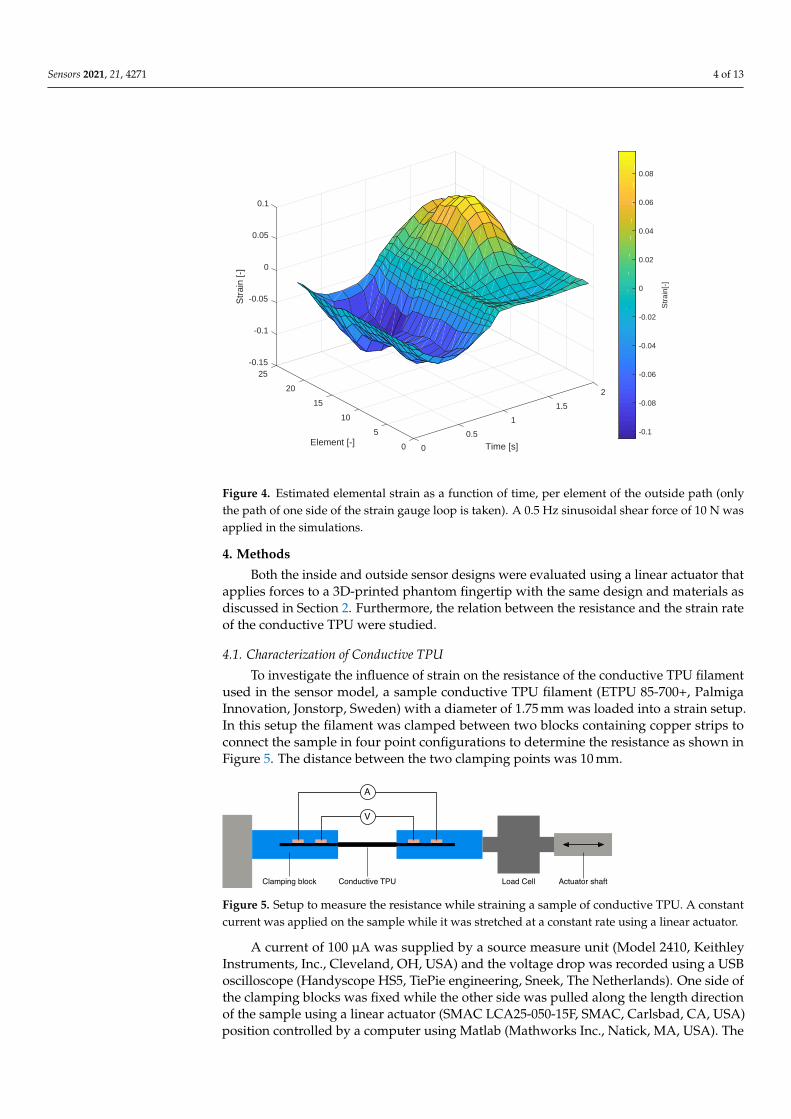
where Li0 is the initial length of element i.The results of Equation (1) in the case of the outside path are visualized in Figure 4,
showing the strain per element as a function of time.Next, the resistance change of the whole path (∆R/R) can be computed by multiplying
the elemental strain with the gauge factor (GF) and initial resistance at zero load perelement (R0i):
∆RR
=1
R0
n−1
∑i=1
εiGFR0i (2)
The sum of the elemental resistance of the path (R0) is set to 2.2 kΩ and a gauge factor(GF) to −15 for ETPU. Because the U-shaped strain gauges are symmetrical, only the pathof one side of the loop is taken. For simplicity, it is assumed the connection pads andbottom loop only contribute as fixed mutual resistance.
Sensors 2021, 21, 4271 4 of 13
-0.1525
-0.1
20
-0.05
2
Str
ain
[-] 0
15 1.5
Element [-]
0.05
Time [s]
10 1
0.1
5 0.5
0 0
-0.1
-0.08
-0.06
-0.04
-0.02
0
0.02
0.04
0.06
0.08
Str
ain[
-]
Figure 4. Estimated elemental strain as a function of time, per element of the outside path (onlythe path of one side of the strain gauge loop is taken). A 0.5 Hz sinusoidal shear force of 10 N wasapplied in the simulations.
4. Methods
Both the inside and outside sensor designs were evaluated using a linear actuator thatapplies forces to a 3D-printed phantom fingertip with the same design and materials asdiscussed in Section 2. Furthermore, the relation between the resistance and the strain rateof the conductive TPU were studied.
4.1. Characterization of Conductive TPU
To investigate the influence of strain on the resistance of the conductive TPU filamentused in the sensor model, a sample conductive TPU filament (ETPU 85-700+, PalmigaInnovation, Jonstorp, Sweden) with a diameter of 1.75 mm was loaded into a strain setup.In this setup the filament was clamped between two blocks containing copper strips toconnect the sample in four point configurations to determine the resistance as shown inFigure 5. The distance between the two clamping points was 10 mm.
V
A
Load Cell Actuator shaftConductive TPUClamping block
Figure 5. Setup to measure the resistance while straining a sample of conductive TPU. A constantcurrent was applied on the sample while it was stretched at a constant rate using a linear actuator.
A current of 100 µA was supplied by a source measure unit (Model 2410, KeithleyInstruments, Inc., Cleveland, OH, USA) and the voltage drop was recorded using a USBoscilloscope (Handyscope HS5, TiePie engineering, Sneek, The Netherlands). One side ofthe clamping blocks was fixed while the other side was pulled along the length directionof the sample using a linear actuator (SMAC LCA25-050-15F, SMAC, Carlsbad, CA, USA)position controlled by a computer using Matlab (Mathworks Inc., Natick, MA, USA). The
Sensors 2021, 21, 4271 5 of 13
force was measured by a load cell (LCMFD-50N, Omega Engineering, Norwalk, CT, USA)placed between the actuator and the clamping block. The output of the load cell wasamplified (IAA100, Futek, Irvine, CA, USA) and connected to the USB oscilloscope togetherwith the encoder output of the linear actuator to synchronize with the resistance change.
The samples were strained at a strain rate of 1 ε/min until a length of about 140%, afterwhich the sample was unloaded at the same rate. After 10 cycles the sample of conductiveTPU filament was replaced with a fresh sample and the experiment was repeated at strainrates of 5, 10, and 20 ε/min.
4.2. Sensor Fabrication
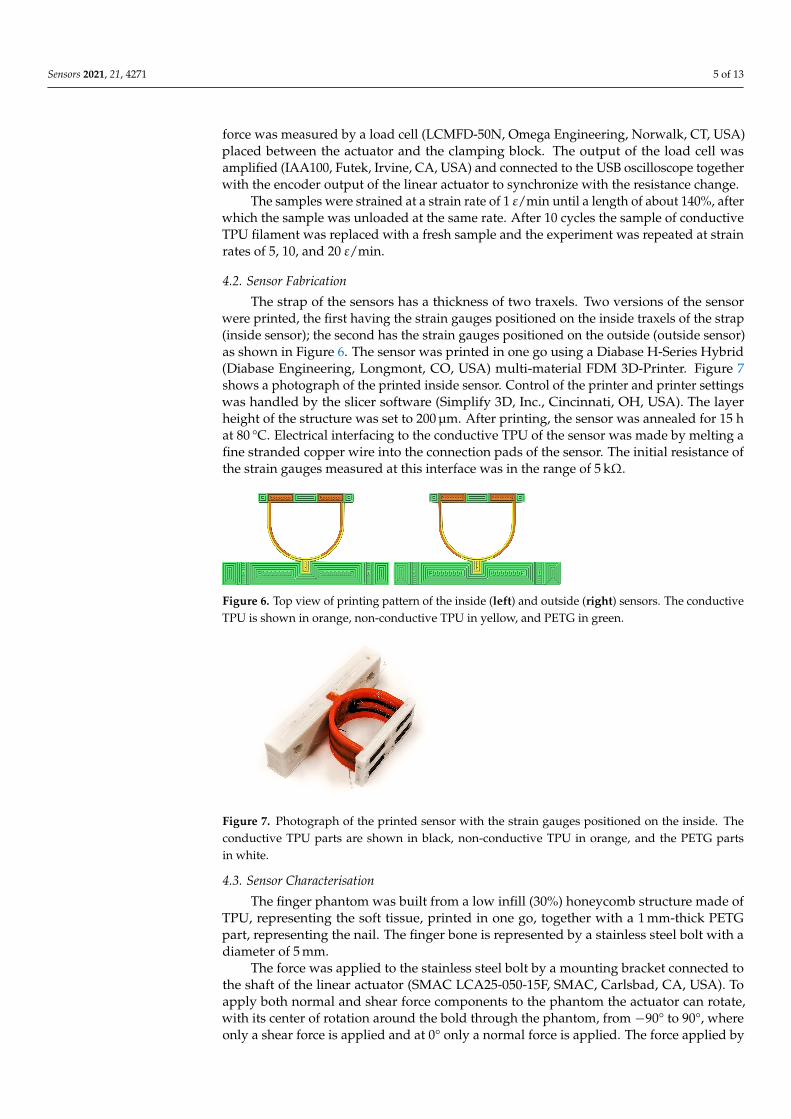
The strap of the sensors has a thickness of two traxels. Two versions of the sensorwere printed, the first having the strain gauges positioned on the inside traxels of the strap(inside sensor); the second has the strain gauges positioned on the outside (outside sensor)as shown in Figure 6. The sensor was printed in one go using a Diabase H-Series Hybrid(Diabase Engineering, Longmont, CO, USA) multi-material FDM 3D-Printer. Figure 7shows a photograph of the printed inside sensor. Control of the printer and printer settingswas handled by the slicer software (Simplify 3D, Inc., Cincinnati, OH, USA). The layerheight of the structure was set to 200 µm. After printing, the sensor was annealed for 15 hat 80 °C. Electrical interfacing to the conductive TPU of the sensor was made by melting afine stranded copper wire into the connection pads of the sensor. The initial resistance ofthe strain gauges measured at this interface was in the range of 5 kΩ.
Figure 6. Top view of printing pattern of the inside (left) and outside (right) sensors. The conductiveTPU is shown in orange, non-conductive TPU in yellow, and PETG in green.
Figure 7. Photograph of the printed sensor with the strain gauges positioned on the inside. Theconductive TPU parts are shown in black, non-conductive TPU in orange, and the PETG partsin white.
4.3. Sensor Characterisation
The finger phantom was built from a low infill (30%) honeycomb structure made ofTPU, representing the soft tissue, printed in one go, together with a 1 mm-thick PETGpart, representing the nail. The finger bone is represented by a stainless steel bolt with adiameter of 5 mm.
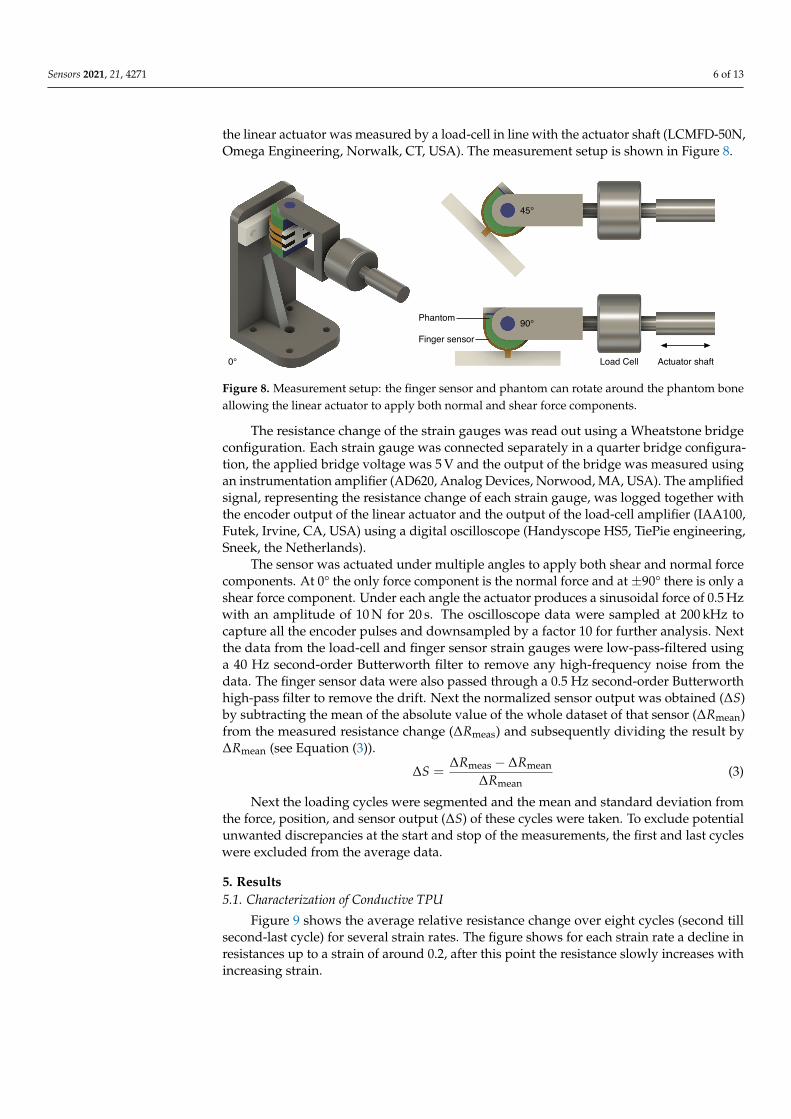
The force was applied to the stainless steel bolt by a mounting bracket connected tothe shaft of the linear actuator (SMAC LCA25-050-15F, SMAC, Carlsbad, CA, USA). Toapply both normal and shear force components to the phantom the actuator can rotate,with its center of rotation around the bold through the phantom, from −90° to 90°, whereonly a shear force is applied and at 0° only a normal force is applied. The force applied by
Sensors 2021, 21, 4271 6 of 13
the linear actuator was measured by a load-cell in line with the actuator shaft (LCMFD-50N,Omega Engineering, Norwalk, CT, USA). The measurement setup is shown in Figure 8.
Load Cell Actuator shaft
Finger sensor
Phantom
0°
45°
90°
Figure 8. Measurement setup: the finger sensor and phantom can rotate around the phantom boneallowing the linear actuator to apply both normal and shear force components.
The resistance change of the strain gauges was read out using a Wheatstone bridgeconfiguration. Each strain gauge was connected separately in a quarter bridge configura-tion, the applied bridge voltage was 5 V and the output of the bridge was measured usingan instrumentation amplifier (AD620, Analog Devices, Norwood, MA, USA). The amplifiedsignal, representing the resistance change of each strain gauge, was logged together withthe encoder output of the linear actuator and the output of the load-cell amplifier (IAA100,Futek, Irvine, CA, USA) using a digital oscilloscope (Handyscope HS5, TiePie engineering,Sneek, the Netherlands).
The sensor was actuated under multiple angles to apply both shear and normal forcecomponents. At 0° the only force component is the normal force and at ±90° there is only ashear force component. Under each angle the actuator produces a sinusoidal force of 0.5 Hzwith an amplitude of 10 N for 20 s. The oscilloscope data were sampled at 200 kHz tocapture all the encoder pulses and downsampled by a factor 10 for further analysis. Nextthe data from the load-cell and finger sensor strain gauges were low-pass-filtered usinga 40 Hz second-order Butterworth filter to remove any high-frequency noise from thedata. The finger sensor data were also passed through a 0.5 Hz second-order Butterworthhigh-pass filter to remove the drift. Next the normalized sensor output was obtained (∆S)by subtracting the mean of the absolute value of the whole dataset of that sensor (∆Rmean)from the measured resistance change (∆Rmeas) and subsequently dividing the result by∆Rmean (see Equation (3)).
∆S =∆Rmeas − ∆Rmean
∆Rmean(3)
Next the loading cycles were segmented and the mean and standard deviation fromthe force, position, and sensor output (∆S) of these cycles were taken. To exclude potentialunwanted discrepancies at the start and stop of the measurements, the first and last cycleswere excluded from the average data.
5. Results5.1. Characterization of Conductive TPU
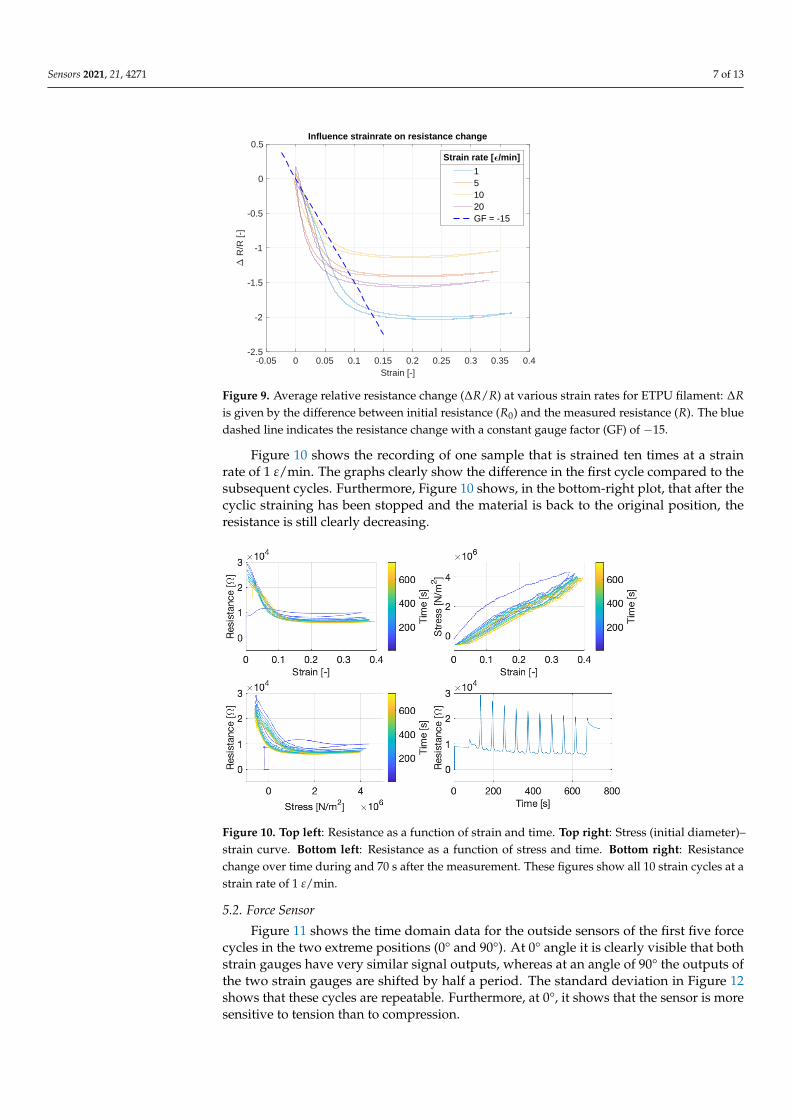
Figure 9 shows the average relative resistance change over eight cycles (second tillsecond-last cycle) for several strain rates. The figure shows for each strain rate a decline inresistances up to a strain of around 0.2, after this point the resistance slowly increases withincreasing strain.
Sensors 2021, 21, 4271 7 of 13
-0.05 0 0.05 0.1 0.15 0.2 0.25 0.3 0.35 0.4Strain [-]
-2.5
-2
-1.5
-1
-0.5
0
0.5
R/R
[-]
Influence strainrate on resistance change
151020GF = -15
Strain rate [ /min]
Figure 9. Average relative resistance change (∆R/R) at various strain rates for ETPU filament: ∆Ris given by the difference between initial resistance (R0) and the measured resistance (R). The bluedashed line indicates the resistance change with a constant gauge factor (GF) of −15.
Figure 10 shows the recording of one sample that is strained ten times at a strainrate of 1 ε/min. The graphs clearly show the difference in the first cycle compared to thesubsequent cycles. Furthermore, Figure 10 shows, in the bottom-right plot, that after thecyclic straining has been stopped and the material is back to the original position, theresistance is still clearly decreasing.
Figure 10. Top left: Resistance as a function of strain and time. Top right: Stress (initial diameter)–strain curve. Bottom left: Resistance as a function of stress and time. Bottom right: Resistancechange over time during and 70 s after the measurement. These figures show all 10 strain cycles at astrain rate of 1 ε/min.
5.2. Force Sensor
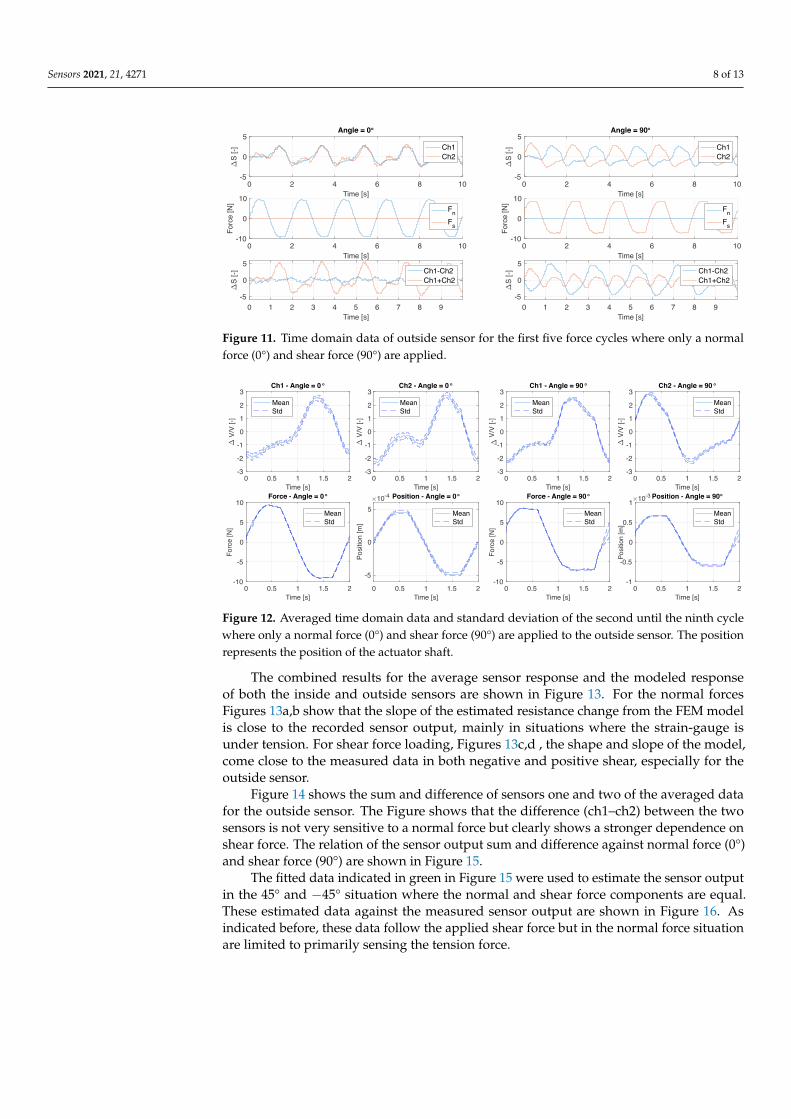
Figure 11 shows the time domain data for the outside sensors of the first five forcecycles in the two extreme positions (0° and 90°). At 0° angle it is clearly visible that bothstrain gauges have very similar signal outputs, whereas at an angle of 90° the outputs ofthe two strain gauges are shifted by half a period. The standard deviation in Figure 12shows that these cycles are repeatable. Furthermore, at 0°, it shows that the sensor is moresensitive to tension than to compression.
Sensors 2021, 21, 4271 8 of 13
0 2 4 6 8 10Time [s]
-5
0
5
S [-]
Angle = 90°
Ch1Ch2
0 1 2 3 4 5 6 7 8 9Time [s]
-5
0
5
S [-] Ch1-Ch2
Ch1+Ch2
0 2 4 6 8 10Time [s]
-10
0
10
Forc
e [N
]
FnFs
0 2 4 6 8 10Time [s]
-5
0
5
S [-]
Angle = 0°
Ch1Ch2
0 1 2 3 4 5 6 7 8 9Time [s]
-5
0
5
S [-] Ch1-Ch2
Ch1+Ch2
0 2 4 6 8 10Time [s]
-10
0
10
Forc
e [N
]
FnFs
Figure 11. Time domain data of outside sensor for the first five force cycles where only a normalforce (0°) and shear force (90°) are applied.
0 0.5 1 1.5 2Time [s]
-3
-2
-1
0
1
2
3
V/V
[-]
Ch1 - Angle = 90 °
MeanStd
0 0.5 1 1.5 2Time [s]
-3
-2
-1
0
1
2
3
V/V
[-]
Ch2 - Angle = 90 °
MeanStd
0 0.5 1 1.5 2Time [s]
-10
-5
0
5
10
Forc
e [N
]Force - Angle = 90°
MeanStd
0 0.5 1 1.5 2Time [s]
-1
-0.5
0
0.5
1
Posit
ion
[m]
10-3 Position - Angle = 90°
MeanStd
0 0.5 1 1.5 2Time [s]
-3
-2
-1
0
1
2
3
V/V
[-]
Ch1 - Angle = 0 °
MeanStd
0 0.5 1 1.5 2Time [s]
-3
-2
-1
0
1
2
3
V/V
[-]
Ch2 - Angle = 0 °
MeanStd
0 0.5 1 1.5 2Time [s]
-10
-5
0
5
10
Forc
e [N
]
Force - Angle = 0°
MeanStd
0 0.5 1 1.5 2Time [s]
-5
0
5
Posi
tion
[m]
10-4 Position - Angle = 0°
MeanStd
Figure 12. Averaged time domain data and standard deviation of the second until the ninth cyclewhere only a normal force (0°) and shear force (90°) are applied to the outside sensor. The positionrepresents the position of the actuator shaft.
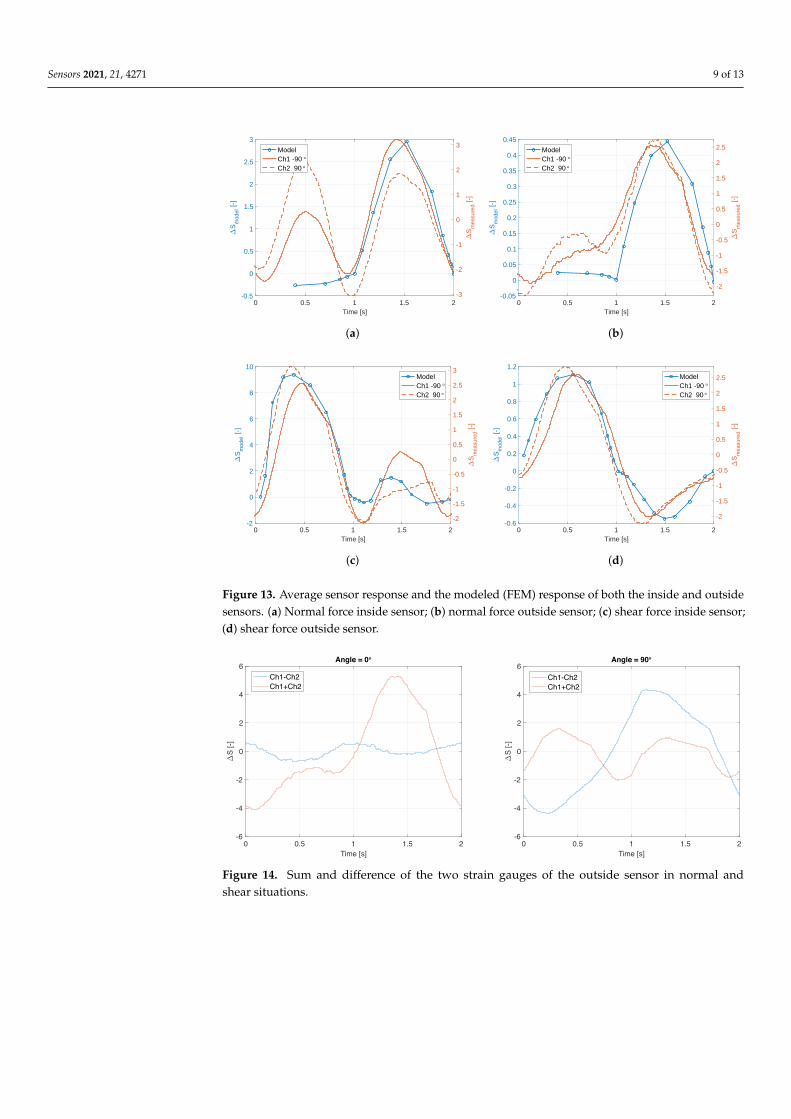
The combined results for the average sensor response and the modeled responseof both the inside and outside sensors are shown in Figure 13. For the normal forcesFigures 13a,b show that the slope of the estimated resistance change from the FEM modelis close to the recorded sensor output, mainly in situations where the strain-gauge isunder tension. For shear force loading, Figures 13c,d , the shape and slope of the model,come close to the measured data in both negative and positive shear, especially for theoutside sensor.
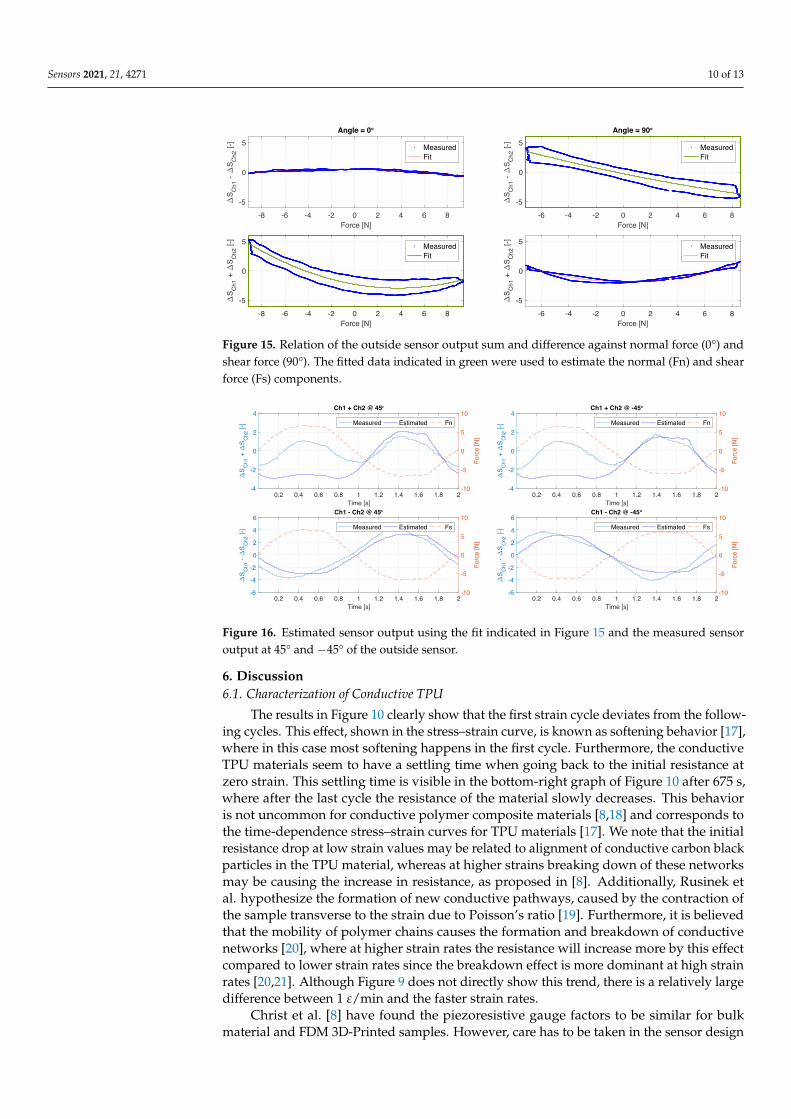
Figure 14 shows the sum and difference of sensors one and two of the averaged datafor the outside sensor. The Figure shows that the difference (ch1–ch2) between the twosensors is not very sensitive to a normal force but clearly shows a stronger dependence onshear force. The relation of the sensor output sum and difference against normal force (0°)and shear force (90°) are shown in Figure 15.
The fitted data indicated in green in Figure 15 were used to estimate the sensor outputin the 45° and −45° situation where the normal and shear force components are equal.These estimated data against the measured sensor output are shown in Figure 16. Asindicated before, these data follow the applied shear force but in the normal force situationare limited to primarily sensing the tension force.
Sensors 2021, 21, 4271 9 of 13
0 0.5 1 1.5 2Time [s]
-0.5
0
0.5
1
1.5
2
2.5
3
Sm
odel
[-]
-3
-2
-1
0
1
2
3
Sm
easu
red [-
]
ModelCh1 -90°Ch2 90°
(a)
0 0.5 1 1.5 2Time [s]
-0.05
0
0.05
0.1
0.15
0.2
0.25
0.3
0.35
0.4
0.45
Sm
odel
[-]
-2
-1.5
-1
-0.5
0
0.5
1
1.5
2
2.5
Sm
easu
red [-
]
ModelCh1 -90°Ch2 90°
(b)
0 0.5 1 1.5 2Time [s]
-2
0
2
4
6
8
10
Sm
odel
[-]
-2
-1.5
-1
-0.5
0
0.5
1
1.5
2
2.5
3
Sm
easu
red [-
]
ModelCh1 -90°Ch2 90°
(c)
0 0.5 1 1.5 2Time [s]
-0.6
-0.4
-0.2
0
0.2
0.4
0.6
0.8
1
1.2
Sm
odel
[-]
-2
-1.5
-1
-0.5
0
0.5
1
1.5
2
2.5
Sm
easu
red [-
]
ModelCh1 -90°Ch2 90°
(d)
Figure 13. Average sensor response and the modeled (FEM) response of both the inside and outsidesensors. (a) Normal force inside sensor; (b) normal force outside sensor; (c) shear force inside sensor;(d) shear force outside sensor.
0 0.5 1 1.5 2Time [s]
-6
-4
-2
0
2
4
6
S [-]
Angle = 90°
Ch1-Ch2Ch1+Ch2
0 0.5 1 1.5 2Time [s]
-6
-4
-2
0
2
4
6
S [-]
Angle = 0°
Ch1-Ch2Ch1+Ch2
Figure 14. Sum and difference of the two strain gauges of the outside sensor in normal andshear situations.
Sensors 2021, 21, 4271 10 of 13
-6 -4 -2 0 2 4 6 8Force [N]
-5
0
5
S Ch1
- S C
h2 [-
]
Angle = 90°
MeasuredFit
-6 -4 -2 0 2 4 6 8Force [N]
-5
0
5
S Ch1
+
S Ch2
[-]
MeasuredFit
-8 -6 -4 -2 0 2 4 6 8Force [N]
-5
0
5
S Ch1
- S C
h2 [-
]
Angle = 0°
MeasuredFit
-8 -6 -4 -2 0 2 4 6 8Force [N]
-5
0
5
S Ch1
+
S Ch2
[-]
MeasuredFit
Figure 15. Relation of the outside sensor output sum and difference against normal force (0°) andshear force (90°). The fitted data indicated in green were used to estimate the normal (Fn) and shearforce (Fs) components.
0.2 0.4 0.6 0.8 1 1.2 1.4 1.6 1.8 2Time [s]
-4
-2
0
2
4
S Ch1
+
S Ch2
[-]
-10
-5
0
5
10
Forc
e [N
]
Ch1 + Ch2 @ 45°
Measured Estimated Fn
0.2 0.4 0.6 0.8 1 1.2 1.4 1.6 1.8 2Time [s]
-6
-4
-2
0
2
4
6
S Ch1
- S C
h2 [-
]
-10
-5
0
5
10
Forc
e [N
]
Ch1 - Ch2 @ 45°
Measured Estimated Fs
0.2 0.4 0.6 0.8 1 1.2 1.4 1.6 1.8 2Time [s]
-4
-2
0
2
4
S Ch1
+
S Ch2
[-]
-10
-5
0
5
10
Forc
e [N
]
Ch1 + Ch2 @ -45°
Measured Estimated Fn
0.2 0.4 0.6 0.8 1 1.2 1.4 1.6 1.8 2Time [s]
-6
-4
-2
0
2
4
6
S Ch1
- S C
h2 [-
]
-10
-5
0
5
10
Forc
e [N
]
Ch1 - Ch2 @ -45°
Measured Estimated Fs
Figure 16. Estimated sensor output using the fit indicated in Figure 15 and the measured sensoroutput at 45° and −45° of the outside sensor.
6. Discussion6.1. Characterization of Conductive TPU
The results in Figure 10 clearly show that the first strain cycle deviates from the follow-ing cycles. This effect, shown in the stress–strain curve, is known as softening behavior [17],where in this case most softening happens in the first cycle. Furthermore, the conductiveTPU materials seem to have a settling time when going back to the initial resistance atzero strain. This settling time is visible in the bottom-right graph of Figure 10 after 675 s,where after the last cycle the resistance of the material slowly decreases. This behavioris not uncommon for conductive polymer composite materials [8,18] and corresponds tothe time-dependence stress–strain curves for TPU materials [17]. We note that the initialresistance drop at low strain values may be related to alignment of conductive carbon blackparticles in the TPU material, whereas at higher strains breaking down of these networksmay be causing the increase in resistance, as proposed in [8]. Additionally, Rusinek etal. hypothesize the formation of new conductive pathways, caused by the contraction ofthe sample transverse to the strain due to Poisson’s ratio [19]. Furthermore, it is believedthat the mobility of polymer chains causes the formation and breakdown of conductivenetworks [20], where at higher strain rates the resistance will increase more by this effectcompared to lower strain rates since the breakdown effect is more dominant at high strainrates [20,21]. Although Figure 9 does not directly show this trend, there is a relatively largedifference between 1 ε/min and the faster strain rates.
Christ et al. [8] have found the piezoresistive gauge factors to be similar for bulkmaterial and FDM 3D-Printed samples. However, care has to be taken in the sensor design
Sensors 2021, 21, 4271 11 of 13
since the bulk material resistivity does not directly relate to the resistivity of a printedvolume. Due to the nature of the FDM 3D-printing process the structures are built of trackelements (traxels) that are stacked in layers. The contact interfaces between these traxelsand layers result in anisotropic structures with the largest resistance in the direction of thestacked layers (z-direction) [22,23]. These effects should be taken into consideration whiledesigning the printing pattern of conductive structures.
6.2. Force Sensor
Under loading of the normal force the strain gauges are bent at the edge and arenot ideally compressed, making them less sensitive for compressive loading compared totension forces where the sensors are strained. This is also expected on the basis of the FEMsimulations. However, the actual sensors show higher sensitivity, especially in the insideconfiguration, than the simulated ones. The estimated output shown in Figure 16 alsoshows the lack of proper positive normal force estimation. Furthermore, the “parabolic”shape of the normal force (Fn) as a function of the sum of the sensor output shown inFigure 15 limits the possibility in an inverse model to distinguish between compressionand tension forces. In a practical situation, where the sensor is placed on the fingertips tocapture interaction forces, this might not be an issue since there are no tension force in thenormal direction of the fingertips.
The output of the left and right sides of the strain gauges (Ch1 and Ch2 in Figure 11)should in theory be exactly similar due to the symmetry in the sensor design and measure-ment setup. However, experimental characterization shows some discrepancies betweenthe two sensors. Besides possible inaccuracies in the measurement setup, we believe thatthe main cause is in the fabrication of the sensor due to inaccuracies in material extrusionduring the printing process, material inhomogeneities, fluctuations in filament diameter,and variations in the bonding between traxels and layers.
The estimated resistance change by the FEM model is currently based on a constantnegative gauge factor. However, the gauge factor of the ETPU material varies with theapplied strain and strain rate as indicated by Figure 9. The FEM models of the straingauge structures show the minimal and maximal strain per element to be −0.64 and 2.11at the inside and −0.07 and 0.09 at the outside for the normal force situation. In the shearforce situations the minimal and maximal observed strain per element were −0.86 and2.88 for the inside and −0.11 and 0.10 for the outside sensor. However, these numbers areextreme situations for a single element. Furthermore, the inside sensor has higher valuescompared to the outside sensor in this FEM analysis due to friction between the strapand the phantom finger. The minimum and maximum observed strain of the completepaths of the strain gauge are −0.07 and 0.63 over all situations. As also visualized inFigure 4, a considerable contribution of the resistance change is caused by a negative strain(i.e., compression). The presented model assumes this compression will contribute to anincrease in the strain gauge resistance as indicated in Figure 9. Although the comparisonof the model outcomes to the experimental characterization show large similarities, thiseffect is not proven in a systematic experiment, dedicated to the behavior of the conductiveTPU material under compression. Furthermore, in the performed strain test only an axialtensile strain was applied whereas in the sensor structure both compressive and tensilestrain are present in multiple directions making the situation even more complex.
Another approach would be to measure the bending of the strap by measuring thedifference between the strain on the inside and on the outside of the strap. This approachhas been demonstrated by Tognetti et al. [24] using piezoresistive fabric to measure jointangles. These structures are not sensitive to elongation [24] and for example allow thefinger sensor to be fitted pre-strained around the fingertip. Additionally, differentialmeasurements have been shown to decrease non-linearities in the sensor response of 3D-printed piezoresistive sensors [25]. However, this differential strain gauge approach resultsin an at least 50% thicker strap due to the additional strain gauges and insulation, reducingthe flexibility and thus reducing the touch sensation of the user.
Sensors 2021, 21, 4271 12 of 13
In the FEM model the extreme inside and outside edges were selected, whereas theactual inside or outside sensor covers the complete area ranging from outer edge to thecenter line. Therefore, the physical sensors experience a slightly different, less extreme,strain profile compared to the results of the FEM model. Nevertheless, the FEM model,especially in the shear force cases, clearly shows that the curved shape of the sensingstructure strain gauges contributes to the relation between sensor output and applied(shear) force.
The applied force in this experimental setup was limited to 10 N interaction forceswhile handling objects could reach up to 10 N for shear forces and up to 50 N for normalforces [26]. The high sensitivity range in the human touch sensation for both normal andshear forces goes up to 10 N [2,3]. Due to the non-linear effects on the resistance of the TPUmaterial, the accuracy of the sensor is limited. Current research on compensation methodswill help to improve the accuracy of these strain-sensitive TPU sensors [7]. These methodsare, for example, based on analogous electrical models fitted to experimental data. In thefuture these sensor systems might be paired with smart algorithms or neural networksto exploit the full potential of the measured data. Nevertheless, without the use of thesecompensation methods and the limited sensitivity for positive normal forces, printed force-sensing structures already have the potential to be used in practical applications. Liftingan object like, e.g., a cup, will induce a shear force at the fingertips in the direction of thegravitational force of the object. This signal can be used for grasp detection in movementsensing systems [5]. Furthermore, the high level of customizability of 3D-printing allowsfor improved sensor geometries that, for example, will minimally cover the skin of thefingertip, allowing for direct skin contact with the object. Both the customizability and thecompliance of the soft TPU materials that allow the tactile experience contribute to the highpotential of 3D-printed wearable force sensors in a growing market for wearable flexiblesensors [27].
7. Conclusions
This work demonstrates a working concept of a 3D-printed flexible sensor capable ofmeasuring shear forces. The sensitivity of the current design for normal forces is limitedwhen used as a finger sensor. The normal and shear force components can be separated.However, creating an inverse model is limited since this relation is non-invertible. A finiteelement model of the sensing structure and sensing setup shows that the output of thesensor is largely related to the chosen sensor design and strain gauge location. Furtherdeviations probably originate from hysteresis and other non-linearities of the carbon-infused thermoplastic polyurethane that was used. Characterization of this material showsthat the gauge factor of the material depends on the amount of strain and shows strongevidence of being time- and strain-rate-dependent. Within the range of strain estimated bythe FEM model, the conductive material shows a negative gauge factor.
Future improvements of the sensor are to be made by using advanced algorithmsfor signal analysis, or neural networks, to use the full potential of the sensor output. 3D-printing offers low-cost and easy customization of sensing structures, which in combinationwith the soft materials makes these sensors a promising candidate for soft robotics andbiomedical applications such as finger interaction sensing.
Author Contributions: Conceptualization, G.W.; methodology, G.W.; software, G.W.; validation, G.W.and G.K.; formal analysis, G.W.; investigation, G.W.; resources, R.S.; data curation, G.W.; writing—original draft preparation, G.W.; writing—review and editing, G.W., P.V. and G.K.; visualization,G.W.; supervision, B.-J.v.B., P.V. and G.K.; project administration, G.W.; funding acquisition, B.-J.v.B.,P.V. and G.K. All authors have read and agreed to the published version of the manuscript
Funding: This works was developed within the SoftPro project, funded by the European Union’sHorizon 2020 Research and Innovation Programme under Grant Agreement No. 68885.

Sensors 2021, 21, 4271 13 of 13
Conflicts of Interest: The authors declare no conflicts of interest. The funders had no role in thedesign of the study and the decision to publish the results.
References1. Veltink, P.H.; Kortier, H.; Schepers, H.M. Sensing power transfer between the human body and the environment. IEEE Trans.
Biomed. Eng. 2009, 56, 1711–1718. [CrossRef]2. Battaglia, E.; Bianchi, M.; Altobelli, A.; Grioli, G.; Catalano, M.G.; Serio, A.; Santello, M.; Bicchi, A. ThimbleSense: A Fingertip-
Wearable Tactile Sensor for Grasp Analysis. IEEE Trans. Haptics 2016, 9, 121–133. [CrossRef]3. Yin, J.; Santos, V.J.; Posner, J.D. Bioinspired flexible microfluidic shear force sensor skin. Sens. Actuators A Phys. 2017, 264, 289–297.
[CrossRef]4. Kortier, H.G.; Schepers, H.M.; Veltink, P.H. Identification of Object Dynamics Using Hand Worn Motion and Force Sensors.
Sensors 2016, 16, 2005. [CrossRef]5. Schwarz, A.; Bhagubai, M.; Wolterink, G.; Held, J.P.O.; Luft, A.R.; Veltink, P.H. Assessment of Upper Limb Movement Impairments
after Stroke Using Wearable Inertial Sensing. Sensors 2020, 20, 4770. [CrossRef]6. Xu, Y.; Wu, X.; Guo, X.; Kong, B.; Zhang, M.; Qian, X.; Mi, S.; Sun, W. The Boom in 3D-Printed Sensor Technology. Sensors 2017,
17, 1166. [CrossRef]7. Schouten, M.; Wolterink, G.; Dijkshoorn, A.; Kosmas, D.; Stramigioli, S.; Krijnen, G. A Review of Extrusion-Based 3D Printing for
the Fabrication of Electro-and Biomechanical Sensors. IEEE Sensors J. 2021, 21, 12900–12912. [CrossRef]8. Christ, J.F.; Aliheidari, N.; Ameli, A.; Pötschke, P. 3D printed highly elastic strain sensors of multiwalled carbon nan-
otube/thermoplastic polyurethane nanocomposites. Mater. Des. 2017, 131, 394–401. [CrossRef]9. Zolfagharian, A.; Kaynak, A.; Kouzani, A. Closed-loop 4D-printed soft robots. Mater. Des. 2020, 188, 108411. [CrossRef]10. Krachunov, S.; Casson, A.J. 3D Printed Dry EEG Electrodes. Sensors 2016, 16, 1635. [CrossRef]11. Wolterink, G.; Dias, P.; Sanders, R.G.; Muijzer, F.; van Beijnum, B.J.; Veltink, P.; Krijnen, G. Development of soft semg sensing
structures using 3d-printing technologies. Sensors 2020, 20, 4292. [CrossRef] [PubMed]12. Guo, S.Z.; Qiu, K.; Meng, F.; Park, S.H.; McAlpine, M.C. 3D Printed Stretchable Tactile Sensors. Adv. Mater. 2017, 29, 1–8.
[CrossRef]13. Christ, J.F.; Aliheidari, N.; Pötschke, P.; Ameli, A. Bidirectional and stretchable piezoresistive sensors enabled by multimaterial
3D printing of carbon nanotube/thermoplastic polyurethane nanocomposites. Polymers 2018, 11, 11. [CrossRef]14. Wolterink, G.; Sanders, R.; Krijnen, G. A flexible, three material, 3D-printed, shear force sensor for use on finger tips. Proc. IEEE
Sens. 2019, 2019, 8956757. [CrossRef]15. Shimawaki, S.; Sakai, N. Quasi-static Deformation Analysis of a Human Finger using a Three-dimensional Finite Element Model
Constructed from CT Images. J. Environ. Eng. 2007, 2, 56–63. [CrossRef]16. Tawk, C.; Alici, G. Finite element modeling in the design process of 3D printed pneumatic soft actuators and sensors. Robotics
2020, 9, 52. [CrossRef]17. Qi, H.J.; Boyce, M.C. Stress–strain behavior of thermoplastic polyurethanes. Mech. Mater. 2005, 37, 817–839. [CrossRef]18. Al-Rubaiai, M.; Tsuruta, R.; Gandhi, U.; Wang, C.; Tan, X. A 3D-printed stretchable strain sensor for wind sensing. Smart Mater.
Struct. 2019, 28, 084001. [CrossRef]19. Rusinek, A.; Robles, G.; Arias, A. Conductive 3D Printed PLA Composites: on the interplay of mechanical, electrical and thermal
behaviours. Compos. Struct. 2021, 265, 113744. [CrossRef]20. Das, N.C.; Chaki, T.K.; Khastgir, D. Effect of axial stretching on electrical resistivity of short carbon fibre and carbon black filled
conductive rubber composites. Polym. Int. 2002, 51, 156–163. [CrossRef]21. Sau, K.P.; Chaki, T.K.; Khastgir, D. The effect of compressive strain and stress on electrical conductivity of conductive rubber
composites. Rubber Chem. Technol. 2000, 73, 310–324. [CrossRef]22. Dijkshoorn, A.; Schouten, M.; Wolterink, G.; Sanders, R.; Stramigioli, S.; Krijnen, G. Characterizing the Electrical Properties of
Anisotropic, 3D-Printed Conductive Sheets for Sensor Applications. IEEE Sens. J. 2020, 20, 14218–14227. [CrossRef]23. Wolterink, G.; Sanders, R.; Krijnen, G. Thin, flexible, capacitive force sensors based on anisotropy in 3D-printed structures. In
Proceedings of the 2018 IEEE Sensors, New Delhi, India, 28–31 October 2018; IEEE: Piscataway, NJ, USA, 2018; pp. 1–4.24. Tognetti, A.; Lorussi, F.; Mura, G.D.; Carbonaro, N.; Pacelli, M.; Paradiso, R.; Rossi, D.D. New generation of wearable goniometers
for motion capture systems. J. Neuroeng. Rehabil. 2014, 11, 1–17. [CrossRef] [PubMed]25. Schouten, M.; Prakken, B.; Sanders, R.; Krijnen, G. Linearisation of a 3D printed flexible tactile sensor based on piezoresistive
sensing. Proc. IEEE Sens. 2019, 2019, 2019–2022. [CrossRef]26. Brookhuis, R.A.; Droogendijk, H.; De Boer, M.J.; Sanders, R.G.; Lammerink, T.S.; Wiegerink, R.J.; Krijnen, G.J. Six-axis force-torque
sensor with a large range for biomechanical applications. J. Micromech. Microeng. 2014, 24, 035015. [CrossRef]27. Xie, R.; Xie, Y.; López-Barrón, C.R.; Gao, K.Z.; Wagner, N.J. Ultra-Stretchable Conductive Iono-Elastomer And Motion Strain
Sensor System Developed Therefrom. Technol. Innov. 2018, 19, 613–626. [CrossRef]


![Elastic Model of Deformable Fingertip for Soft-Fingered ... · [19] J. J. Craig, Introduction to Robotics: Mechanical and Control, 2nd ... partment of Robotics, Ritsumeikan University,](https://img.pdfslide.us/doc/110x75/5ae4da3c7f8b9a9e5d8babd2/elastic-model-of-deformable-fingertip-for-soft-fingered-19-j-j-craig-introduction.jpg)