Embed Size (px)
Citation preview

9M2013 RESULTS PRESENTATION DECEMBER 23, 2013
DISCLAIMER
This presentation does not constitute or form part of and should not be construed as,
an offer to sell or issue or the solicitation of an offer to buy or acquire securities of
Mechel OAO (Mechel) or any of its subsidiaries in any jurisdiction or an inducement to
enter into investment activity. No part of this presentation, nor the fact of its
distribution, should form the basis of, or be relied on in connection with, any contract
or commitment or investment decision whatsoever. Any purchase of securities should
be made solely on the basis of information Mechel files from time to time with the U.S.
Securities and Exchange Commission. No representation, warranty or undertaking,
express or implied, is made as to, and no reliance should be placed on, the fairness,
accuracy, completeness or correctness of the information or the opinions contained
herein. None of the Mechel or any of its affiliates, advisors or representatives shall
have any liability whatsoever (in negligence or otherwise) for any loss howsoever
arising from any use of this presentation or its contents or otherwise arising in
connection with the presentation.
This presentation may contain projections or other forward-looking statements
regarding future events or the future financial performance of Mechel, as defined in
the safe harbor provisions of the U.S. Private Securities Litigation Reform Act of 1995.
We wish to caution you that these statements are only predictions and that actual
events or results may differ materially. We do not intend to update these statements.
We refer you to the documents Mechel files from time to time with the U.S. Securities
and Exchange Commission, including our Form 20-F. These documents contain and
identify important factors, including those contained in the section captioned “Risk
Factors” and “Cautionary Note Regarding Forward-Looking Statements” in our Form
20-F, that could cause the actual results to differ materially from those contained in
our projections or forward-looking statements, including, among others, the
achievement of anticipated levels of profitability, growth, cost and synergy of our
recent acquisitions, the impact of competitive pricing, the ability to obtain necessary
regulatory approvals and licenses, the impact of developments in the Russian
economic, political and legal environment, volatility in stock markets or in the price of
our shares or ADRs, financial risk management and the impact of general business
and global economic conditions.
The information and opinions contained in this document are provided as at the date
of this presentation and are subject to change without notice
2

FINANCIAL HIGHLIGHTS

61% 59% 60% 59%
31% 33% 33% 32%
1% 1% 1% 1%7% 7% 6% 8%
2Q13 3Q13 9M12 9M13
Steel Mining Ferroalloys Power
SEGMENTS OVERVIEW
REVENUE FROM THIRD PARTIES EBITDA BY SEGMENTS
$ Mln
$ Mln
(1) Adjusted EBITDA represents EBTIDA adjusted by forex gain/loss, interest income, net income on the disposal of non-current assets, amount attributable to non-controlling interests gain/loss from remeasurement of
contingent liabilities at fair value, impairment of long-lived assets and goodwill, result of disposed companies (incl.the result from their disposal) provision for amounts due from related parties and losses from discontinued
operations, net of income tax. 4
Steel Mining Ferroalloys Power
EBITDA(1) BY SEGMENTS
2,243 2,089 8,222 6,692
331
88
421
305
88
397
29
96
147124
62
211
127
64
202
148
49
196
Mining Steel Ferroalloys Power Consolidated*
2Q12 3Q12 4Q12 1Q13 2Q13 3Q13
3Q2013
1%
25%
76%
-2%
2Q2013
2%
2%
32%
64%
Declining prices put pressure on consolidated revenue
which is down to $2.1 bn q-o-q
Bad debt provisions and write-offs due to assets disposals
result in a Net Loss of $2.2 bn for 9M2013
Due to lower cash costs and higher volumes Mining
segment EBITDA grew by 17% q-o-q dominating the
consolidated EBITDA with a share of 76% -3
64
-6-0.6
15
0.6
23
533
-4
MINING SEGMENT
$ Mln
CASH COSTS, US$/TONNE COS STRUCTURE
$527 mn $431 mn
5
REVENUE, EBITDA(1)
936
786
678
770693 695
151
164
142136
130 110
30%32%
4%14% 15%
18%
0%
30%
60%
0
300
600
900
1,200
2Q12 3Q12 4Q12 1Q13 2Q13 3Q13
Revenues (lhs) Intersegment revenues (lhs) Adj. EBITDA margin (rhs)
42
32
45
88
3928
43
89
41
29
45
115
4334
52
88
3931
53
78
34 32
43
86
Coal SKCC Coal YU Iron Ore Bluestone
2Q12 3Q12 4Q12 1Q13 2Q13 3Q13
44% 44% 42%
21% 23% 25%
12% 9% 9%
15% 17% 17%
8% 7% 7%
1Q13 2Q13 3Q13
Other
Depreciation and depletion
Energy
Staff costs
Raw materials and purchased goods
(1) Adjusted EBITDA represents EBTIDA adjusted by forex gain/loss, interest income, net income on the disposal of non-current assets, amount attributable to non-controlling interests gain/loss from remeasurement of
contingent liabilities at fair value, impairment of long-lived assets and goodwill, result of disposedcompanies (incl.the result from their disposal) provision for amounts due from related parties and losses from discontinued
operations, net of income tax.
$459 mn
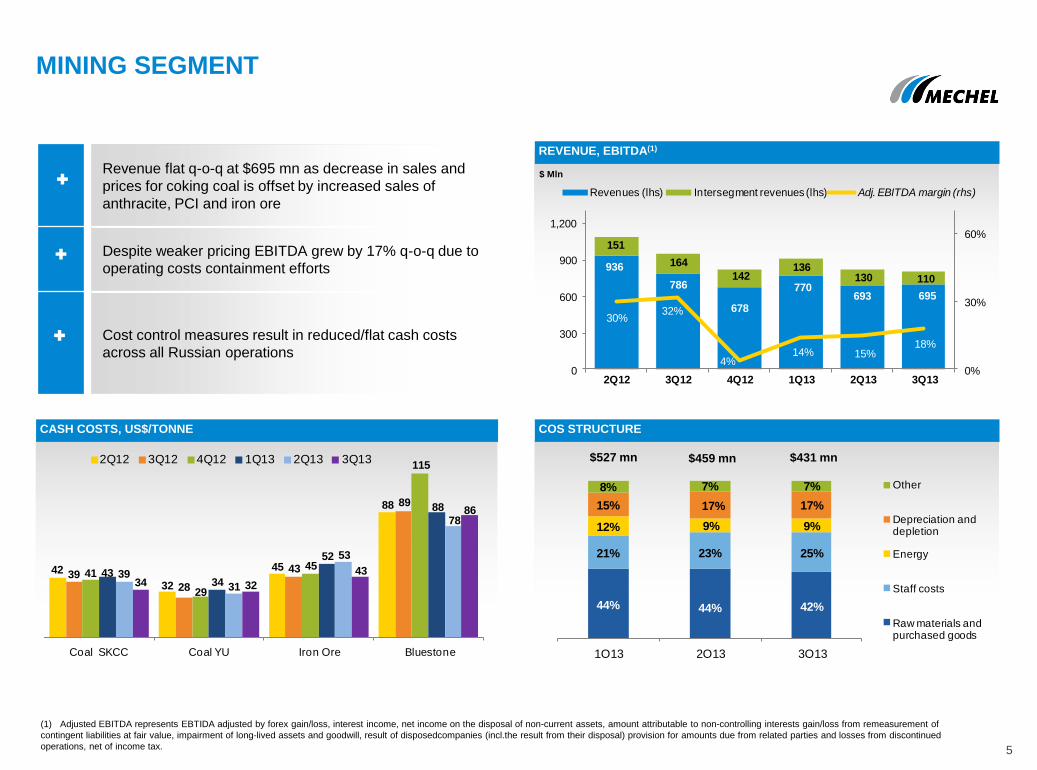
Revenue flat q-o-q at $695 mn as decrease in sales and
prices for coking coal is offset by increased sales of
anthracite, PCI and iron ore
Despite weaker pricing EBITDA grew by 17% q-o-q due to
operating costs containment efforts
Cost control measures result in reduced/flat cash costs
across all Russian operations
42% 37%45%
39%
23%26%
21%24%
8% 7%11%
8%3% 3%
2%2%
8% 9%8%
8%
15% 17%12%
16%
1% 1% 1% 3%
2Q13 3Q13 9M12 9M13
Coking coal Anthracites and PCI Coke Coking products Steam coal Iron ore Other
MINING SEGMENT
6
REVENUE BREAKDOWN BY REGION AVERAGE SALES PRICES FCA, US$/TONNE
*Restated to include middlings
EXTERNAL SALES STRUCTURE
239
129
94
49
84
229
122
80
49
65
214
93
69
5159
207
95
63
52
92
199
83
66
52
77
178
71
5749
78
Coke Coking coal Anthracite and PCI Steam coal* Iron ore
2Q12 3Q12 4Q12 1Q13 2Q13 3Q13
28% 26% 26% 28%
15%14% 14% 14%
1%1%
10%2%
42%42%
29% 39%
8% 10%13%
10%
1% 2% 4% 3%5% 5% 4% 4%
2Q13 3Q13 9M12 9M13
Russia Europe CIS China Asia w/o China Middle East Other
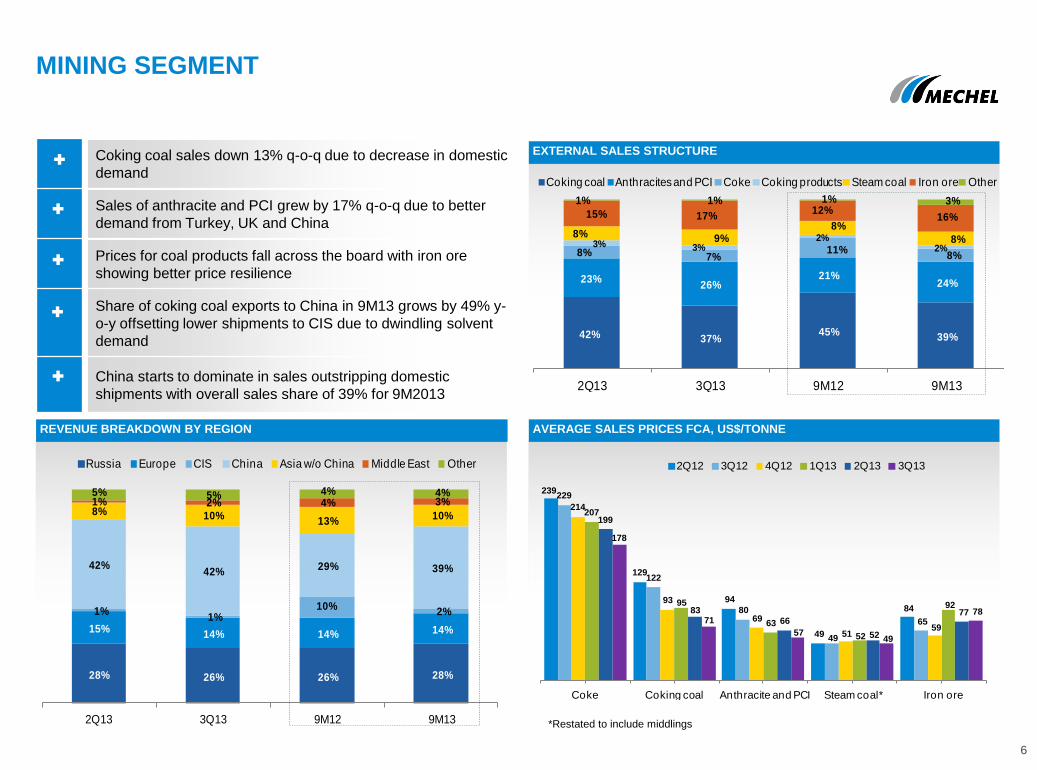
Coking coal sales down 13% q-o-q due to decrease in domestic
demand
Sales of anthracite and PCI grew by 17% q-o-q due to better
demand from Turkey, UK and China
Prices for coal products fall across the board with iron ore
showing better price resilience
Share of coking coal exports to China in 9M13 grows by 49% y-
o-y offsetting lower shipments to CIS due to dwindling solvent
demand
China starts to dominate in sales outstripping domestic
shipments with overall sales share of 39% for 9M2013
STEEL SEGMENT
7
CASH COSTS, US$/TONNE COS STRUCTURE
REVENUE, EBITDA(1)
$1,165 mn $1,061mn
$ Mln
1,765
1,606 1,492
1,343 1,3591,225
6649
7270 50
50
5% 5%6%
4%5%
4%
-5%
-2%
1%
4%
7%
10%
13%
0
500
1,000
1,500
2,000
2Q12 3Q12 4Q12 1Q13 2Q13 3Q13
Revenues (lhs) Intersegment revenues (lhs) Adj. EBITDA margin (rhs)
508
452 470487
431452
502
437 444
494
439 447472 468 479
504
419 425
Billets* Wire Rod Rebar
2Q12 3Q12 4Q12 1Q13 2Q13 3Q13
75% 78% 76%
10% 9% 9%
11% 8% 9%
2% 2% 2%2% 3% 4%
1Q13 2Q13 3Q13
Other
Depreciation
Energy
Staff costs
Raw materials and purchased goods
(1) Adjusted EBITDA represents EBTIDA adjusted by forex gain/loss, interest income, net income on the disposal of non-current assets, amount attributable to non-controlling interests gain/loss from remeasurement of
contingent liabilities at fair value, impairment of long-lived assets and goodwill, result of disposed companies (incl.the result from their disposal) provision for amounts due from related parties and losses from discontinued
operations, net of income tax.
$1,185 mn
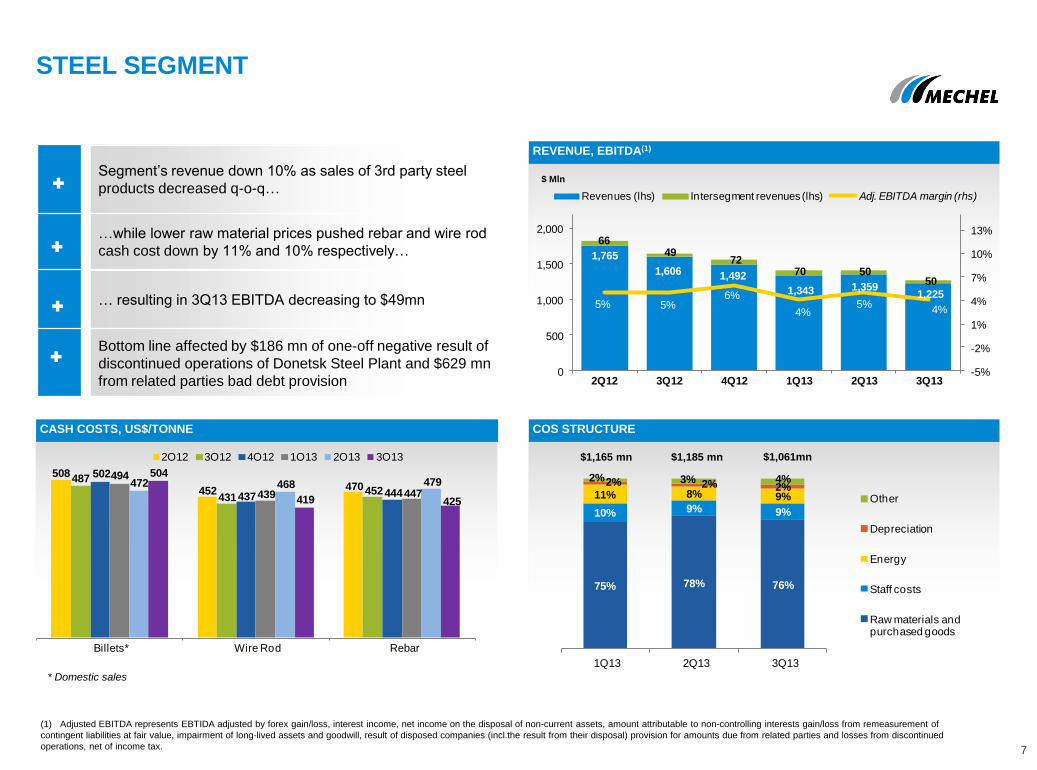
Segment‟s revenue down 10% as sales of 3rd party steel
products decreased q-o-q…
…while lower raw material prices pushed rebar and wire rod
cash cost down by 11% and 10% respectively…
… resulting in 3Q13 EBITDA decreasing to $49mn
Bottom line affected by $186 mn of one-off negative result of
discontinued operations of Donetsk Steel Plant and $629 mn
from related parties bad debt provision
* Domestic sales
65% 66%58%
64%
17% 18%
19%17%
3% 0%4%
3%
11% 13%10%
12%
3% 2%7%
3%1% 1% 2% 1%
2Q13 3Q13 9M12 9M13
Russia Europe Asia CIS Middle East Other
STEEL SEGMENT
8
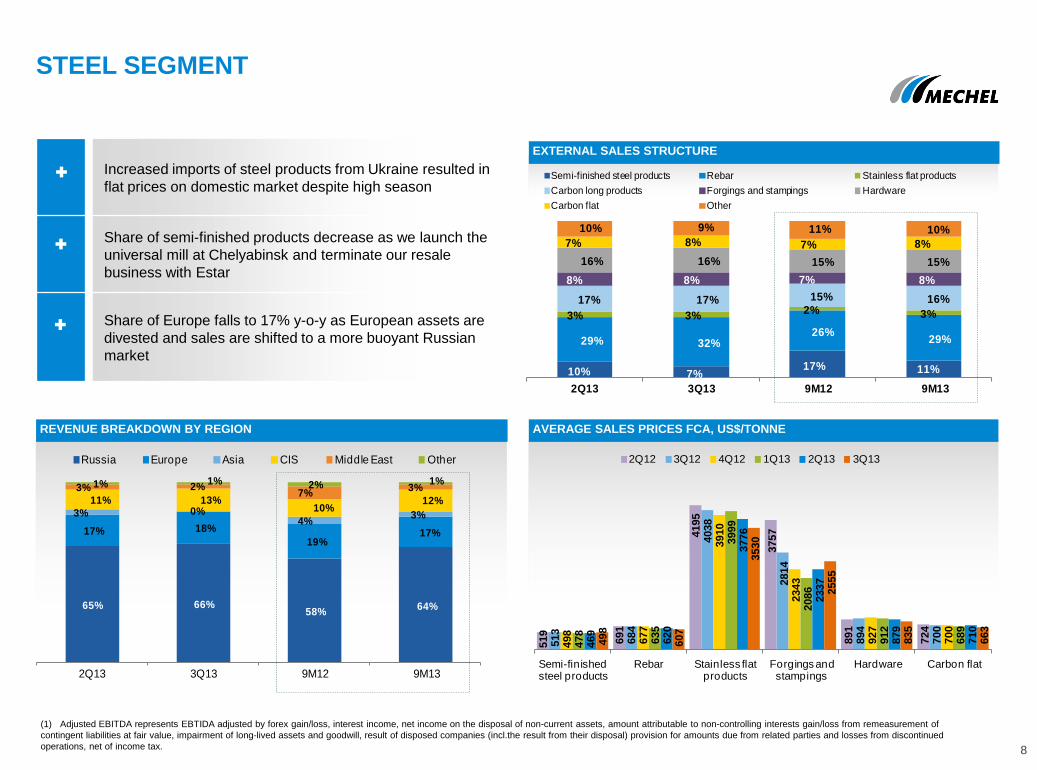
REVENUE BREAKDOWN BY REGION AVERAGE SALES PRICES FCA, US$/TONNE
EXTERNAL SALES STRUCTURE
10% 7%17% 11%
29% 32%26%
29%
3% 3%2% 3%
17% 17% 15% 16%
8% 8% 7% 8%
16% 16% 15% 15%
7% 8% 7% 8%
10% 9% 11% 10%
2Q13 3Q13 9M12 9M13
Semi-finished steel products Rebar Stainless flat products
Carbon long products Forgings and stampings Hardware
Carbon flat Other
519
691
4195
3757
891
724
513
684
4038
2814
894
700
498
677
3910
2343
927
700
478
635
3999
2086
912
689
469
620
3776
2337
879
710
498
607
3530
2555
835
663
Semi-finished steel products
Rebar Stainless flat products
Forgings and stampings
Hardware Carbon flat
2Q12 3Q12 4Q12 1Q13 2Q13 3Q13
(1) Adjusted EBITDA represents EBTIDA adjusted by forex gain/loss, interest income, net income on the disposal of non-current assets, amount attributable to non-controlling interests gain/loss from remeasurement of
contingent liabilities at fair value, impairment of long-lived assets and goodwill, result of disposed companies (incl.the result from their disposal) provision for amounts due from related parties and losses from discontinued
operations, net of income tax.
Increased imports of steel products from Ukraine resulted in
flat prices on domestic market despite high season
Share of semi-finished products decrease as we launch the
universal mill at Chelyabinsk and terminate our resale
business with Estar
Share of Europe falls to 17% y-o-y as European assets are
divested and sales are shifted to a more buoyant Russian
market
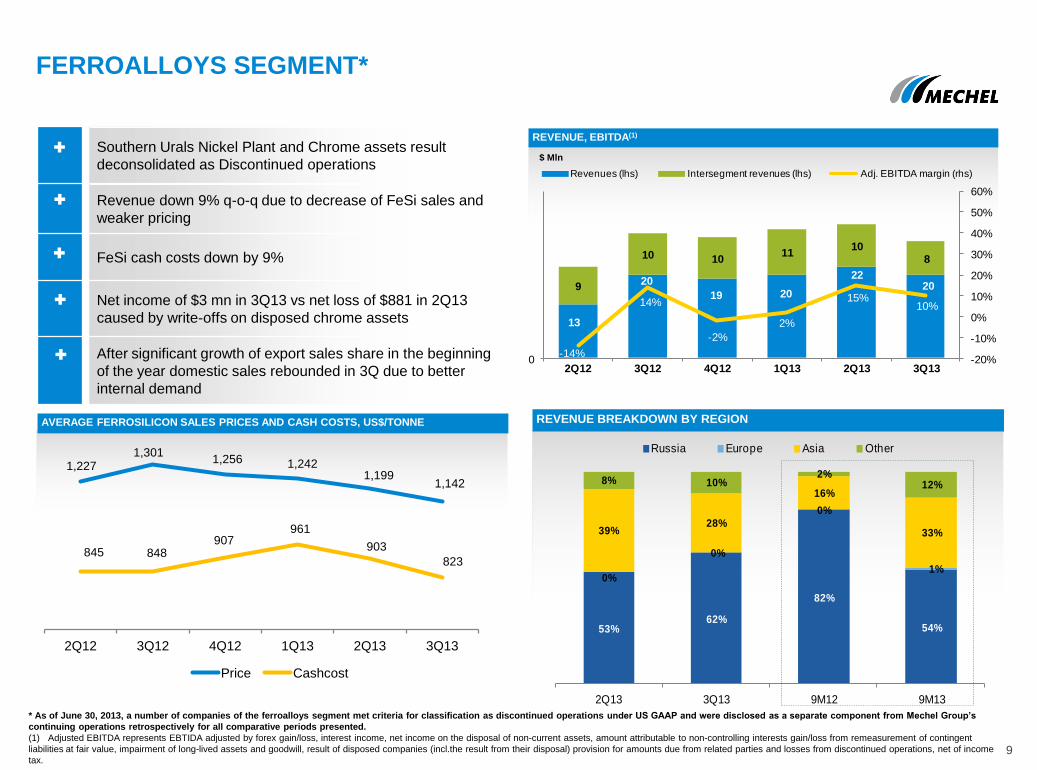
AVERAGE FERROSILICON SALES PRICES AND CASH COSTS, US$/TONNE
FERROALLOYS SEGMENT*
REVENUE, EBITDA(1)
9
$ Mln
13
20
19 20
22209
10 1011
108
-14%
14%
-2%
2%
15%10%
-20%
-10%
0%
10%
20%
30%
40%
50%
60%
02Q12 3Q12 4Q12 1Q13 2Q13 3Q13
Revenues (lhs) Intersegment revenues (lhs) Adj. EBITDA margin (rhs)
* As of June 30, 2013, a number of companies of the ferroalloys segment met criteria for classification as discontinued operations under US GAAP and were disclosed as a separate component from Mechel Group’s
continuing operations retrospectively for all comparative periods presented.
(1) Adjusted EBITDA represents EBTIDA adjusted by forex gain/loss, interest income, net income on the disposal of non-current assets, amount attributable to non-controlling interests gain/loss from remeasurement of contingent
liabilities at fair value, impairment of long-lived assets and goodwill, result of disposed companies (incl.the result from their disposal) provision for amounts due from related parties and losses from discontinued operations, net of income
tax.
Southern Urals Nickel Plant and Chrome assets result
deconsolidated as Discontinued operations
Revenue down 9% q-o-q due to decrease of FeSi sales and
weaker pricing
FeSi cash costs down by 9%
Net income of $3 mn in 3Q13 vs net loss of $881 in 2Q13
caused by write-offs on disposed chrome assets
After significant growth of export sales share in the beginning
of the year domestic sales rebounded in 3Q due to better
internal demand
53%62%
82%
54%
0%
0%
0%
1%
39%28%
16%
33%
8% 10%2%
12%
2Q13 3Q13 9M12 9M13
Russia Europe Asia Other
REVENUE BREAKDOWN BY REGION
1,227 1,301
1,256 1,242 1,199
1,142
845 848 907
961
903
823
2Q12 3Q12 4Q12 1Q13 2Q13 3Q13
Price Cashcost

POWER SEGMENT
10
AVERAGE ELECTRICITY SALES PRICES AND CASH COSTS (RUSSIA), US$/MWH COS STRUCTURE
REVENUE, EBITDA(1)
$ Mln
53.5 54.7 53.856.2
52.554.4
28.030.1
24.5 26.2
29.0
35.0
2Q12 3Q12 4Q12 1Q13 2Q13 3Q13
Sales price Cash costs
89% 86% 87%
4% 4% 3%5% 8% 7%
1% 1% 1%1% 1%
2%
1Q13 2Q13 3Q13
Other
Depreciation
Energy
Staff costs
Raw materials and purchased goods
$249 mn $197 mn
168140
220227
169149
95 98
118 123
10198
2%-2%
4% 7%1%
-2%
-20%
-10%
0%
10%
20%
30%
40%
50%
0
100
200
300
2Q12 3Q12 4Q12 1Q13 2Q13 3Q13
Revenues (lhs) Intersegment revenues(lhs) Adj. EBITDA margin (rhs)
(1) Adjusted EBITDA represents EBTIDA adjusted by forex gain/loss, interest income, net income on the disposal of non-current assets, amount attributable to non-controlling interests gain/loss from remeasurement of
contingent liabilities at fair value, impairment of long-lived assets and goodwill, result of disposed companies (incl.the result from their disposal) provision for amounts due from related parties and losses from discontinued
operations, net of income tax.
$201 mn
Traditional seasonal decrease in revenues and margins
Lower production volumes and seasonal maintenance works
and repairs resulted in cash costs growth
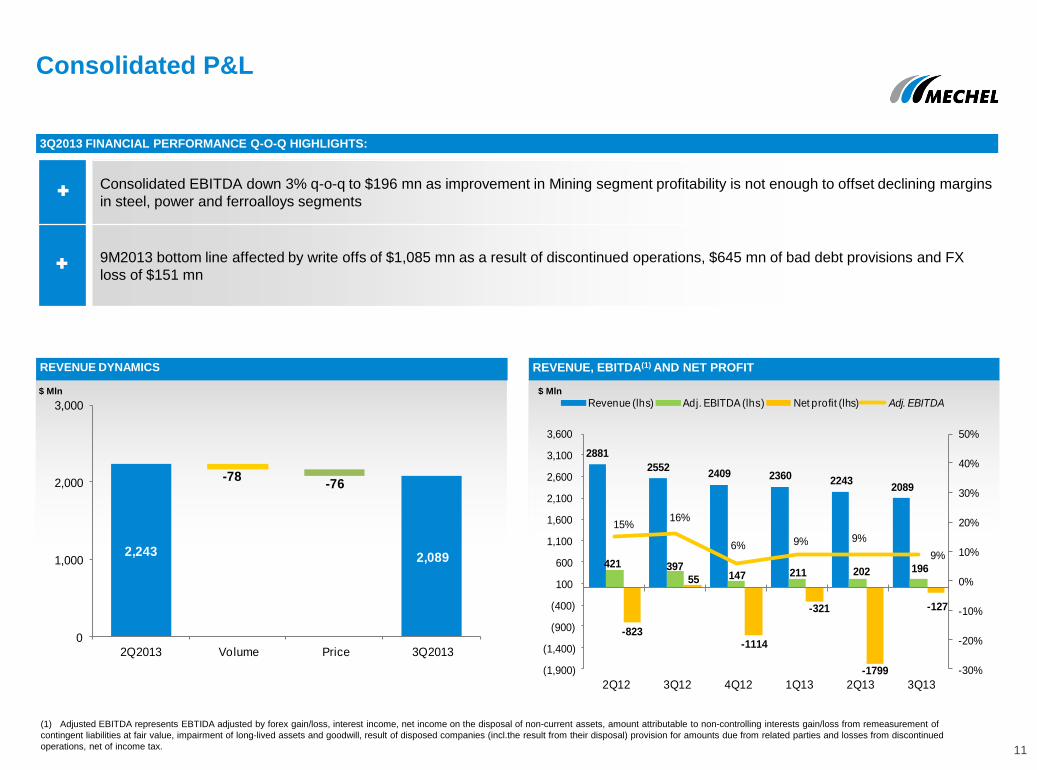
Consolidated P&L
11
REVENUE DYNAMICS REVENUE, EBITDA(1) AND NET PROFIT
Consolidated EBITDA down 3% q-o-q to $196 mn as improvement in Mining segment profitability is not enough to offset declining margins
in steel, power and ferroalloys segments
9M2013 bottom line affected by write offs of $1,085 mn as a result of discontinued operations, $645 mn of bad debt provisions and FX
loss of $151 mn
3Q2013 FINANCIAL PERFORMANCE Q-O-Q HIGHLIGHTS:
$ Mln $ Mln
2,243 2,089
-78-76
0
1,000
2,000
3,000
2Q2013 Volume Price 3Q2013
2881
25522409 2360 2243
2089
421 397147 211 202 196
-823
55
-1114
-321
-1799
-127
15%16%
6% 9% 9%
9%
-30%
-20%
-10%
0%
10%
20%
30%
40%
50%
(1,900)
(1,400)
(900)
(400)
100
600
1,100
1,600
2,100
2,600
3,100
3,600
2Q12 3Q12 4Q12 1Q13 2Q13 3Q13
Revenue (lhs) Adj. EBITDA (lhs) Net profit (lhs) Adj. EBITDA
(1) Adjusted EBITDA represents EBTIDA adjusted by forex gain/loss, interest income, net income on the disposal of non-current assets, amount attributable to non-controlling interests gain/loss from remeasurement of
contingent liabilities at fair value, impairment of long-lived assets and goodwill, result of disposed companies (incl.the result from their disposal) provision for amounts due from related parties and losses from discontinued
operations, net of income tax.
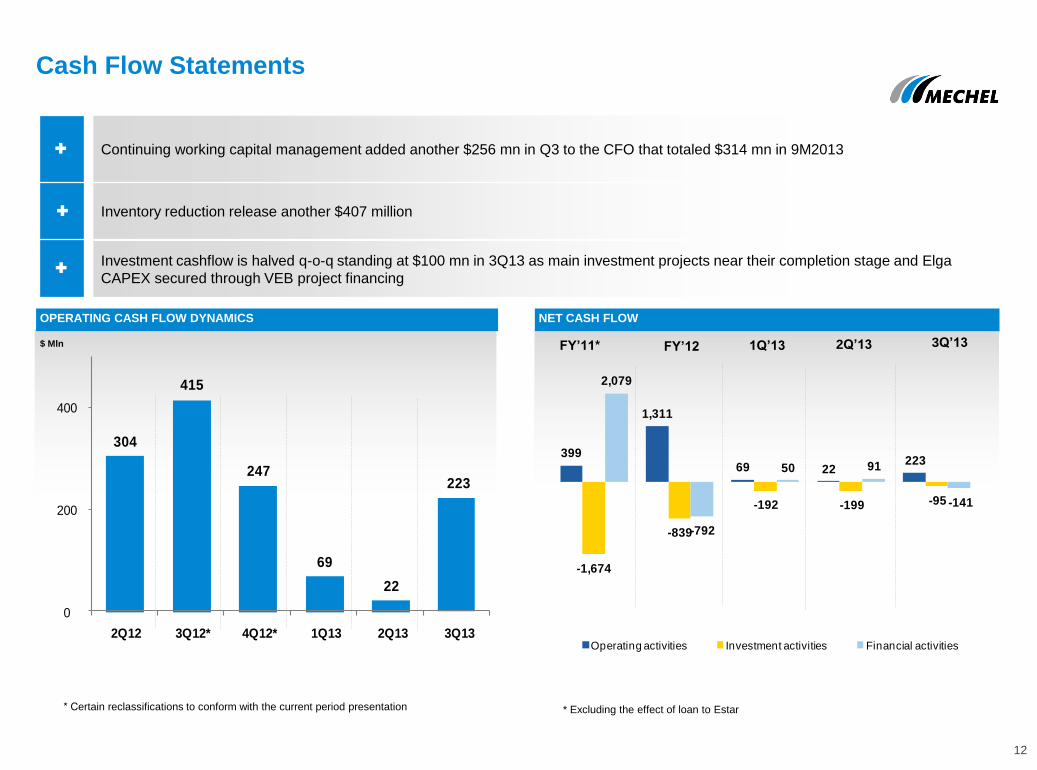
Cash Flow Statements
12
OPERATING CASH FLOW DYNAMICS NET CASH FLOW
Continuing working capital management added another $256 mn in Q3 to the CFO that totaled $314 mn in 9M2013
Inventory reduction release another $407 million
Investment cashflow is halved q-o-q standing at $100 mn in 3Q13 as main investment projects near their completion stage and Elga
CAPEX secured through VEB project financing
$ Mln FY’11* FY’12 1Q’13
* Excluding the effect of loan to Estar
2Q’13 3Q’13
304
415
247
69
22
223
0
200
400
2Q12 3Q12* 4Q12* 1Q13 2Q13 3Q13
399
1,311
69 22223
-1,674
-839
-192 -199 -95
2,079
-792
50 91
-141
Operating activities Investment activities Financial activities
* Сertain reclassifications to conform with the current period presentation

Successful refinancing and improved liquidity to service upcoming maturities
Net debt stable, estimated at $9.4 bln (including financial lease) as
of December 6, 2013
Cash and available credit lines total $0.44 bln as of December 6,
2013
Company succeeded in refinancing of PXF (granting additional
grace period of 12 months and extending the tenor until December
2016), Sberbank (grace period of 15 months, extending the tenor
until December 2018), VTB and GPB. New levels of financial
covenants ratios negotiated (including testing holiday until
December 2014)
DEBT PROFILE AS OF DECEMBER 6, 2013
RUR 58%
USD 35%
EUR 7%
Russian
Banks
69%
14
DEBT MATURITY SCHEDULE AS OF DECEMBER 6, 2013 ** DEBT MATURITY SCHEDULE AS OF JUNE 1, 2013 WITH PRO FORMA*
Foreign
Banks
20%
Bonds
11%
** assuming refinancing of GBP lines of 2009 and changes in schedule of VTB – lease from December 20, 2013
DRAFT
123 84 - - - -
506
1,788 1,866 1,630
1,336
584
81
472 314
472
-
-
156
- - -
-
-
97
139
86 51
37
15
965
2,483
2,267 2,153
1,373
598
0
500
1000
1500
2000
2500
3000
1.6.13 2013 2014 2015 2016 2017 2018 and after
Renewable lines Other term loans
Expiration of put options on bonds Maturity of bonds
Expiration of financial lease
79 131 99
1,306
2,146 2,153
1,447
780
429
198 297
-
-
-
- -
-
-
13
168
118 77
57
24
191
2,034
2,461 2,527
1,504
803
0
500
1000
1500
2000
2500
3000
20.12.13 2013 2014 2015 2016 2017 2018 and after
Renewable lines Other term loans
Expiration of put options on bonds Maturity of bonds
Expiration of financial lease
* assuming refinancing of GBP lines according to the terms of executed committed credit facilities
69 340 31
440
Cash
Other undrawn credit lines
ECA undrawn amount
283
367
141
790
Cash
Other undrawn credit lines
ECA undrawn amount
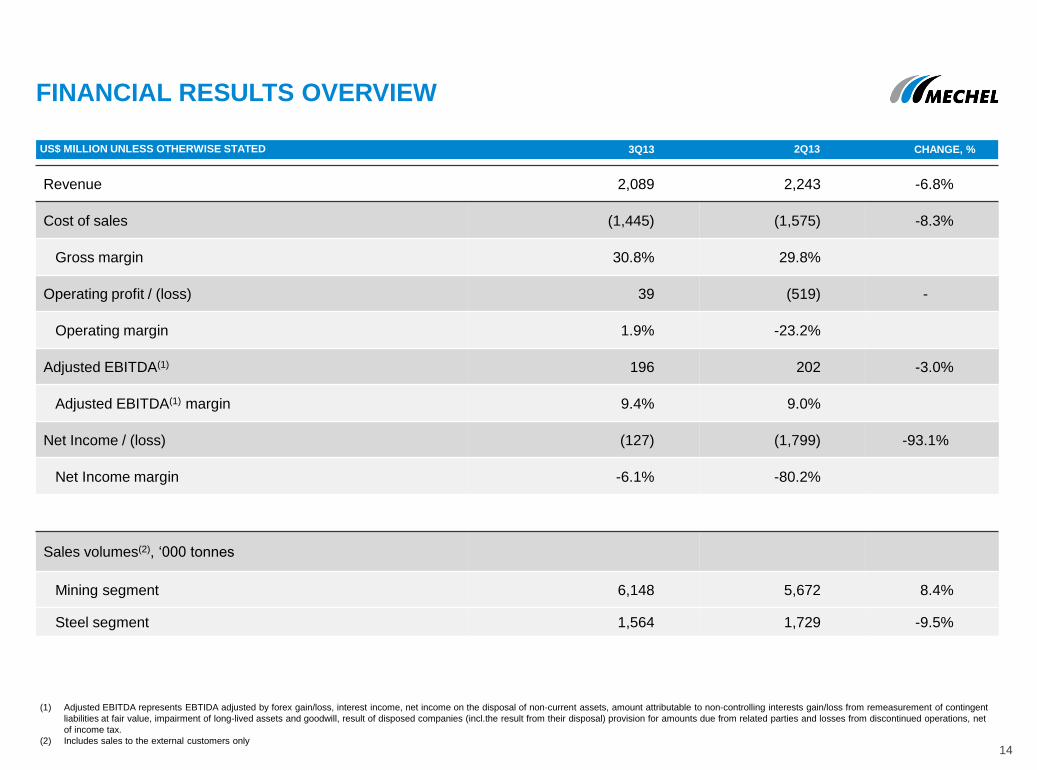
Revenue 2,089 2,243 -6.8%
Cost of sales (1,445) (1,575) -8.3%
Gross margin 30.8% 29.8%
Operating profit / (loss) 39 (519) -
Operating margin 1.9% -23.2%
Adjusted EBITDA(1) 196 202 -3.0%
Adjusted EBITDA(1) margin 9.4% 9.0%
Net Income / (loss) (127) (1,799) -93.1%
Net Income margin -6.1% -80.2%
Sales volumes(2), „000 tonnes
Mining segment 6,148 5,672 8.4%
Steel segment 1,564 1,729 -9.5%
FINANCIAL RESULTS OVERVIEW
(1) Adjusted EBITDA represents EBTIDA adjusted by forex gain/loss, interest income, net income on the disposal of non-current assets, amount attributable to non-controlling interests gain/loss from remeasurement of contingent
liabilities at fair value, impairment of long-lived assets and goodwill, result of disposed companies (incl.the result from their disposal) provision for amounts due from related parties and losses from discontinued operations, net
of income tax.
(2) Includes sales to the external customers only
US$ MILLION UNLESS OTHERWISE STATED 3Q13 2Q13 CHANGE, %
14