Embed Size (px)
Citation preview
of Gas-Buying Customers April 2019
9
Consumer Behavior
Habits
Page 1 | 9 Habits of Gas-Buying Customers
9 Habits of Gas-Buying Customers
With about 40 million Americans purchasing gas every day, they’re bound to reveal some interesting behaviors at the pump.
1HABIT #1 Consumers typically decide to buy gas when…
Perhaps often, because they keep
the tank as fullas possible
The gas indicator light
comes on
They see a cheap gas price
Creature of habit! They always buy gas on a specific
day/time
58%
17%
9%
4%
They're going inside
the store to buy
something
1%11%
They’re running lowand it’s convenient
to stop
E
$
Page 2 | 9 Habits of Gas-Buying Customers
40% 61%
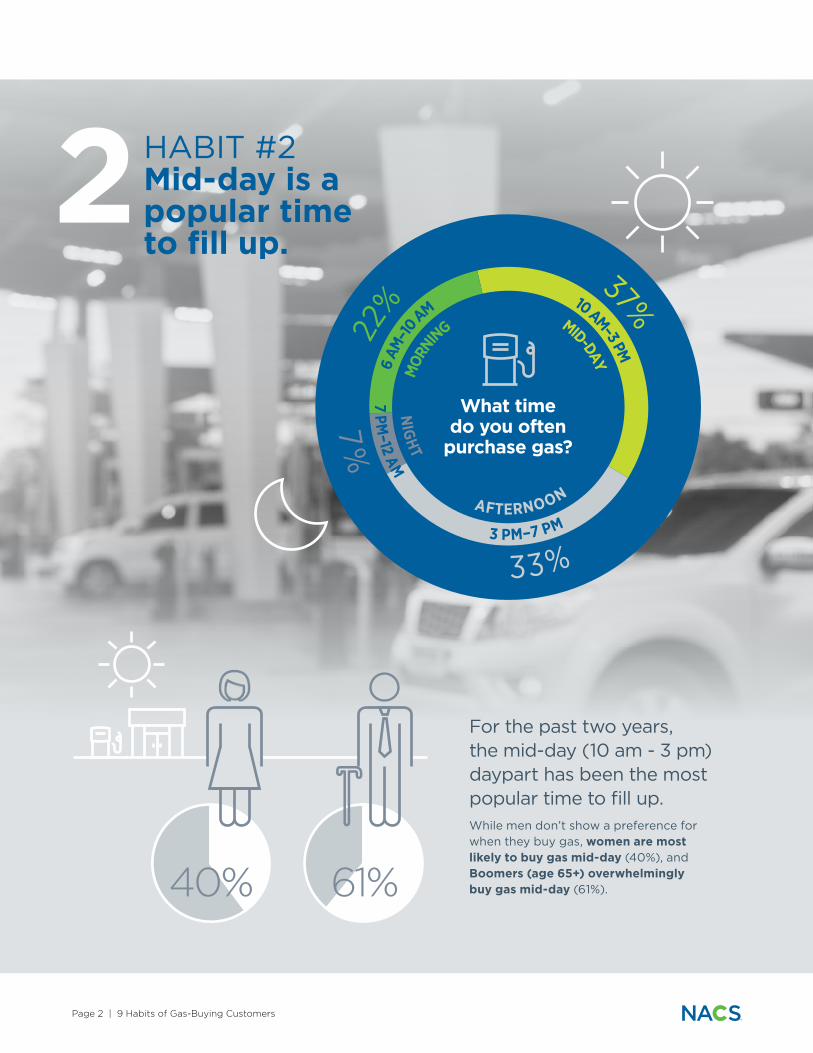
22%
6 AM
–10 AM
37%10 AM–3 PM
33%3 PM–7 PM
7%
7 PM–12 AM
MOR
NING MID-DAY
AFTERNOON
NIG
HTWhat time
do you oftenpurchase gas?
2HABIT #2 Mid-day is a popular time to fill up.
For the past two years, the mid-day (10 am - 3 pm) daypart has been the most popular time to fill up. While men don’t show a preference for when they buy gas, women are most likely to buy gas mid-day (40%), and Boomers (age 65+) overwhelmingly buy gas mid-day (61%).
Page 3 | 9 Habits of Gas-Buying Customers
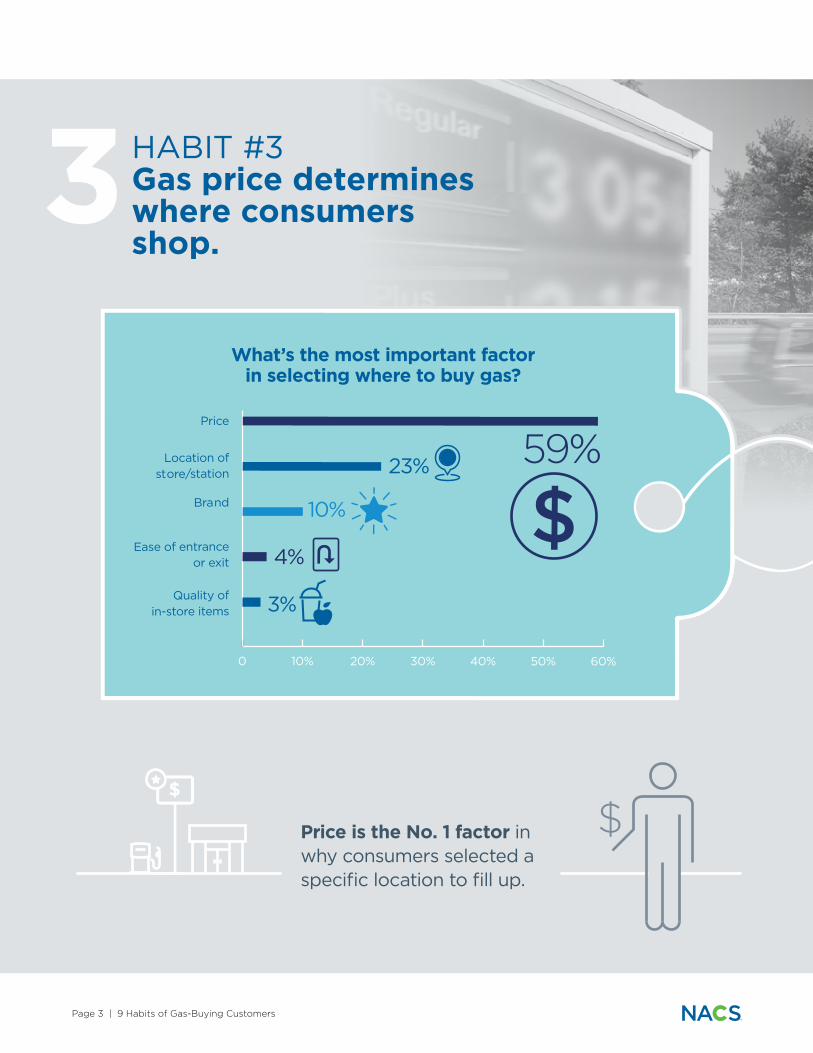
What’s the most important factor in selecting where to buy gas?
$
$
$
0 10% 20% 30% 40% 50% 60%
Price
Location of store/station
Quality of in-store items
Brand
Ease of entrance or exit
59%23%
10%
4%
3%
3HABIT #3 Gas price determines where consumers shop.
Price is the No. 1 factor in why consumers selected a specific location to fill up.
Page 4 | 9 Habits of Gas-Buying Customers
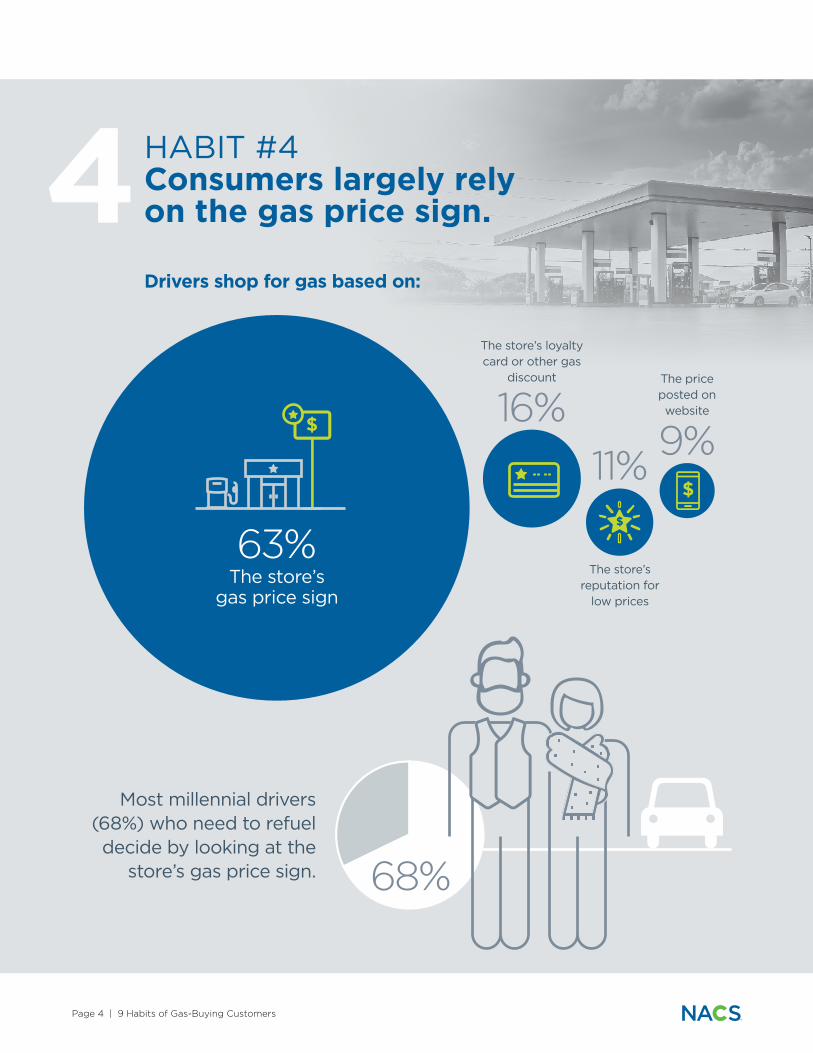
4HABIT #4 Consumers largely rely on the gas price sign.
Drivers shop for gas based on:
The store’s loyalty card or other gas
discount
The store’s reputation for
low prices
The price posted on website
63%
16%9%
11%
The store’sgas price sign
68%
$
$$
Most millennial drivers (68%) who need to refuel decide by looking at the
store’s gas price sign.
Page 5 | 9 Habits of Gas-Buying Customers
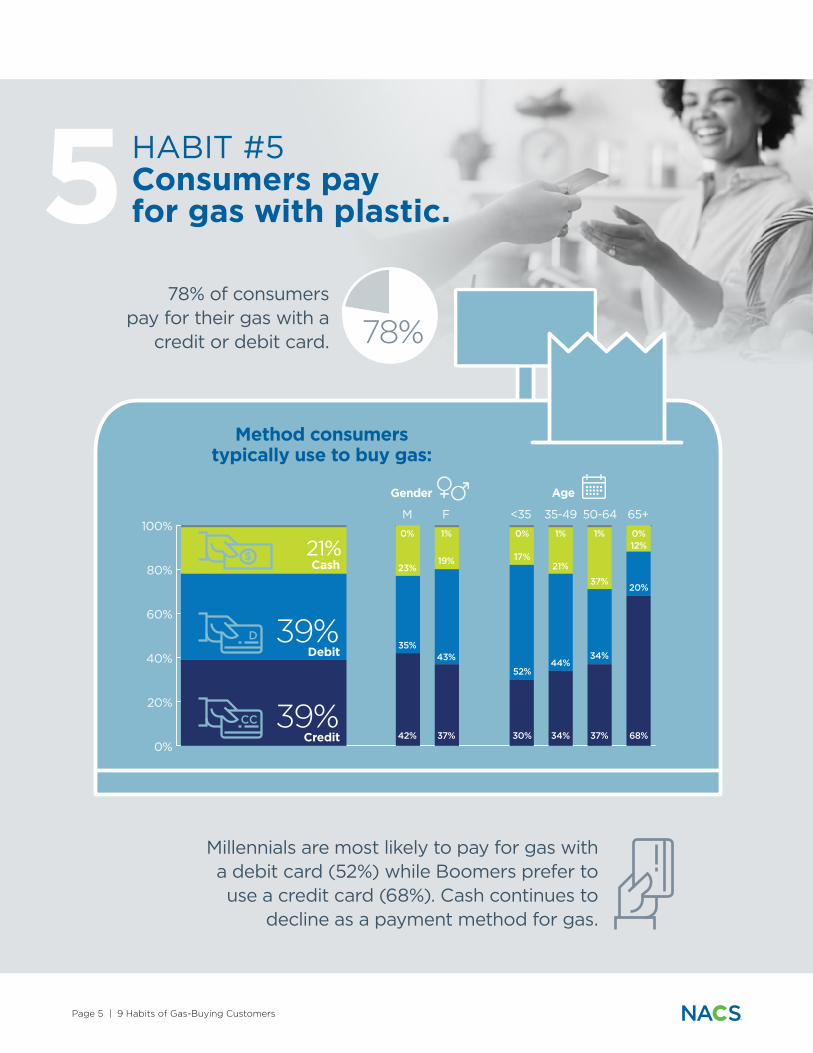
Method consumerstypically use to buy gas:
0%
20%
40%
60%
80%
100%
Credit
Debit
Cash
Gender
M0%
35%
42%
23%
1%
43%
37%
19%
0%
52%
30%
17%
1%
44%
34%
21%
1%
34%
37%
37%
0%
20%
68%
12%
F <35 35-49 50-64 65+
Age
39%
39%
21%$
CC
D
78%
5HABIT #5 Consumers pay for gas with plastic.
Millennials are most likely to pay for gas with a debit card (52%) while Boomers prefer to use a credit card (68%). Cash continues to
decline as a payment method for gas.
78% of consumers pay for their gas with a
credit or debit card.
Page 6 | 9 Habits of Gas-Buying Customers
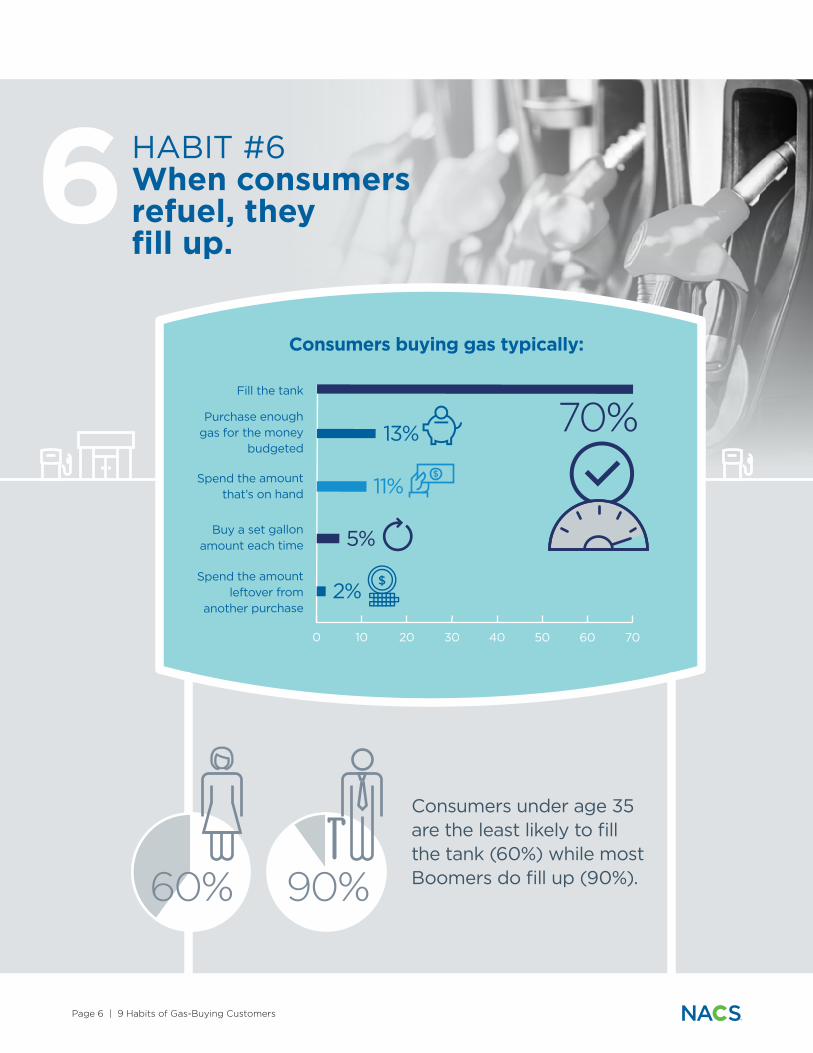
Consumers buying gas typically:
60% 90%
0 10 20 30 40 50 60 70
Fill the tank
Purchase enoughgas for the money
budgeted
Spend the amountleftover from
another purchase
Spend the amount that’s on hand
Buy a set gallon amount each time
70%13%
11%
5%
2%
$
$
Consumers under age 35 are the least likely to fill the tank (60%) while most Boomers do fill up (90%).
6HABIT #6When consumers refuel, they fill up.
Page 7 | 9 Habits of Gas-Buying Customers
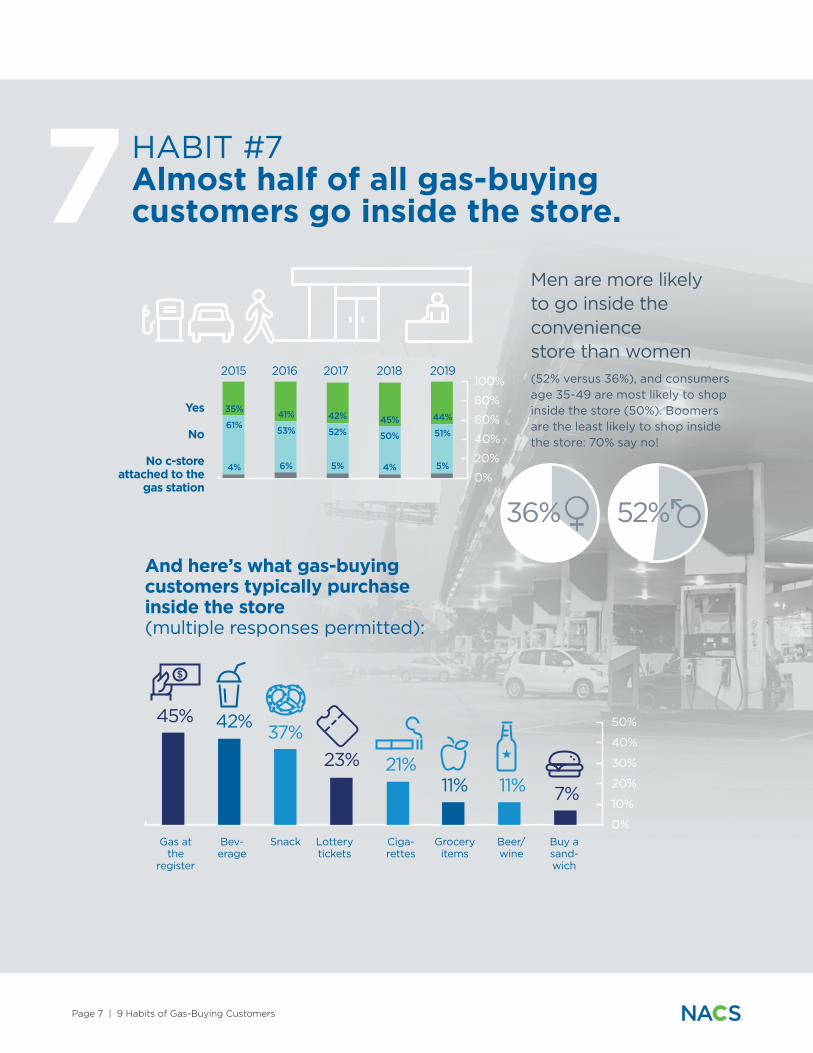
7HABIT #7 Almost half of all gas-buying customers go inside the store.
52%36%
And here’s what gas-buying customers typically purchase inside the store (multiple responses permitted):
Region
2015 2016 2017 2018 2019
0%
20%
40%
60%
80%
100%
Yes
No
No c-store attached to the
gas station
35%
61%
4%
41%
53%
6%
42%
52%
5%
45%
50%
4%
44%
51%
5%
0%
10%
20%
30%
40%
50%45% 42% 37%23% 21%
11% 11% 7%
$
Gas at the
register
Bev-erage
Snack Lottery tickets
Ciga-rettes
Grocery items
Beer/wine
Buy a sand-wich
Men are more likely to go inside the convenience store than women(52% versus 36%), and consumers age 35-49 are most likely to shop inside the store (50%). Boomers are the least likely to shop inside the store: 70% say no!
Page 8 | 9 Habits of Gas-Buying Customers
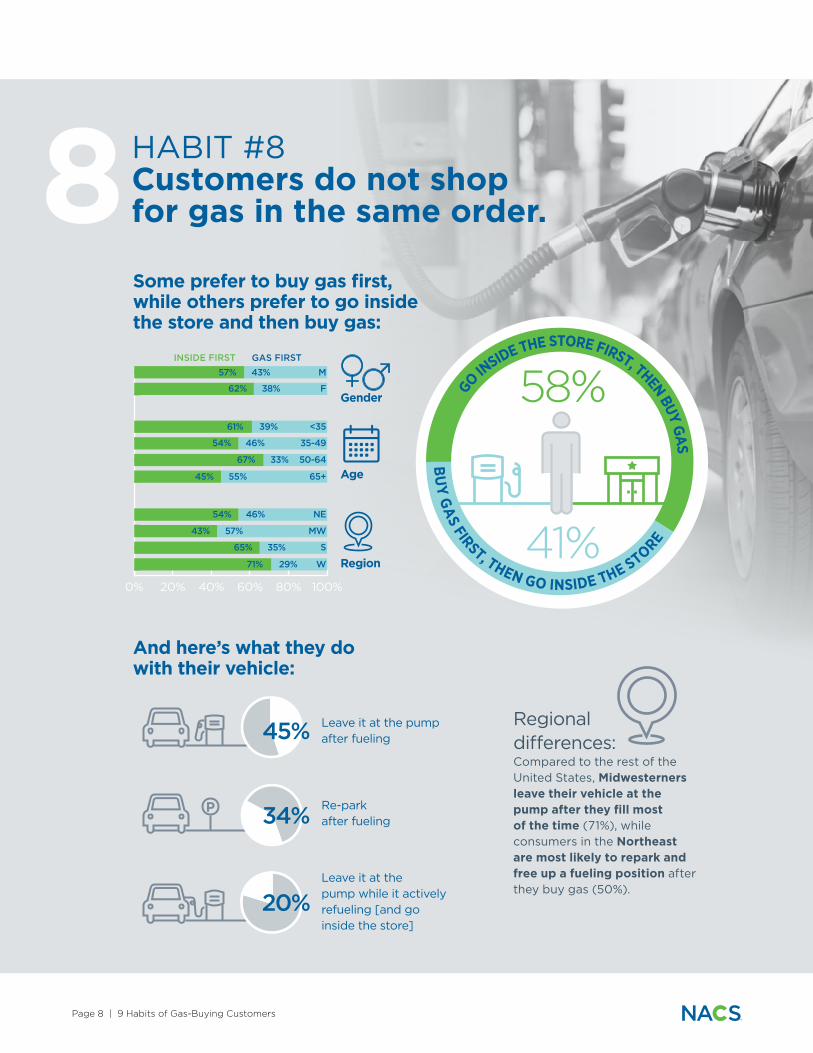
Some prefer to buy gas first, while others prefer to go inside the store and then buy gas:
And here’s what they dowith their vehicle:
Leave it at the pump after fueling
Re-park after fueling
Leave it at the pump while it actively refueling [and go inside the store]
P
GO INSIDE THE STORE FIRST, THEN BUY GAS
BU
Y GA
S FIRST, THEN GO INSIDE THE STORE41%
58%
45%
34%
20%
0% 20% 40% 60% 80% 100%
Gender
INSIDE FIRST GAS FIRST57% M43%
62% F38%
Age
61% <3539%
54% 35-4946%
67% 50-6433%
45% 65+55%
Region
54% NE46%
43% MW57%
65% S35%
71% W29%
8HABIT #8 Customers do not shop for gas in the same order.
Regional differences:Compared to the rest of the United States, Midwesterners leave their vehicle at the pump after they fill most of the time (71%), while consumers in the Northeast are most likely to repark and free up a fueling position after they buy gas (50%).
Page 9 | 9 Habits of Gas-Buying Customers
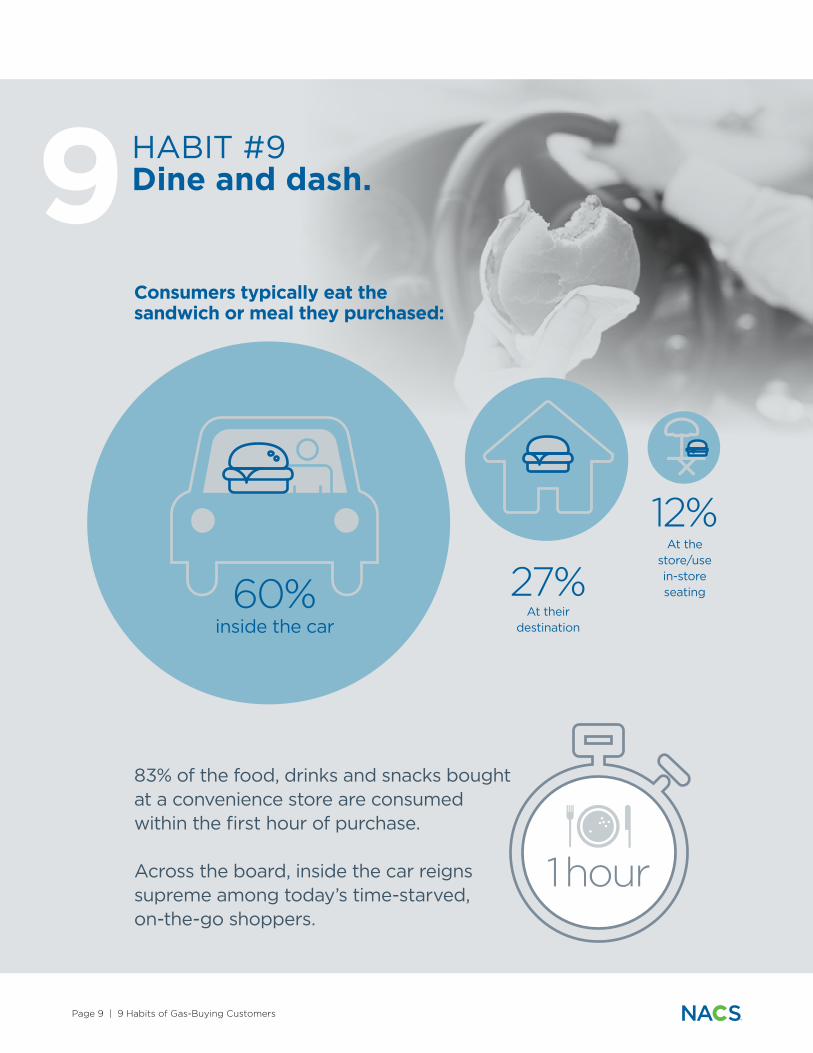
Consumers typically eat thesandwich or meal they purchased:
1 hour
At their destination
27%At the
store/use in-store seating
12%
60%inside the car
83% of the food, drinks and snacks bought at a convenience store are consumed within the first hour of purchase.
Across the board, inside the car reigns supreme among today’s time-starved, on-the-go shoppers.
9HABIT #9 Dine and dash.
About NACSNACS (convenience.org) advances the role of convenience stores as positive economic, social and philanthropic contributors to the communities they serve. The U.S. convenience store industry, with more than 153,000 stores nationwide selling fuel, food and merchandise, serves 165 million customers daily—half of the U.S. population—and has sales that are 11% of total U.S. retail and foodservice sales. NACS has 1,900 retailer and 1,800 supplier member companies from more than 50 countries.
1600 Duke Street | Alexandria VA 22314-3436 | 703.684.3600 | convenience.org
FOR MORE INFORMATION, PLEASE CONTACT:
Jeff LenardVice President, Strategic Industry [email protected]
Chris BlasinskyContent Communications Strategist [email protected]
Survey Methodology: NACS has surveyed consumers about their perceptions related to gas prices since 2007. The NACS Consumer Fuels Survey is conducted by noted marketing and polling firm PSB. A total of 1,101 fuels consumers nationwide were surveyed over the period of January 17-23, 2019, and consumers reported a median gas price nationally of $2.23. The margin of error for the study is +/- 2.95 at the 95% confidence level.