Embed Size (px)
Citation preview
98
HSR Proceedings in Intensive Care and Cardiovascular Anesthesia 2013, Vol. 5
ORIGINAL ARTICLE
Corresponding author:Paolo Grassi, M.D.Department of Anesthesia and Intensive CareOspedale di CattinaraStrada di Fiume, 447 - 34149 Trieste, Italye-mail: [email protected]
Pulse pressure variation as a predictor of fluid responsiveness in mechanically ventilated patients with spontaneous breathing activity: a pragmatic observational studyP. Grassi1, L. Lo Nigro2, K. Battaglia1, M. Barone2, F. Testa2, G. Berlot1,2
1Department of Anesthesia and Intensive Care, Azienda Ospedaliero Universitaria, Trieste, Italy; 2Trieste University School of Medicine, Trieste, Italy
HSR Proc Intensive Care Cardiovasc Anesth. 2013; 5(2): 98-109
INTRODUCTION
Intravenous fluid administration is the first intervention to correct hemodynamic instability in critically ill patients. How-ever, only roughly 50% of treated patients
will benefit from plasma volume expansion in terms of enhanced cardiac output (1) while the rest will suffer the detrimental effects of excessive fluid loading, including heart failure and interstitial tissue edema. Hence, predicting in advance fluid respon-siveness in intensive care medicine is ad-vantageous. Nowadays it is widely accepted that the dynamic indices pulse pressure variation (PPV), stroke volume variation (SVV)
HSR Proc Intensive Care Cardiovasc Anesth. 2013; 5(2): 98-109
ABSTRACT
Introduction: Pulse pressure variation predicts fluid responsiveness in mechanically ventilated patients pas-sively adapted to the ventilator. Its usefulness in actively breathing ventilated patients was examined only by few studies with potential methodological shortcomings. This study sought to describe the performance of pulse pressure variation as a predictor of fluid responsiveness in hypotensive critically ill patients who trigger the ventilator.Methods: We studied forty two hypotensive, mechanically ventilated patients with documented spontaneous breathing activity in whom a fluid challenge was deemed necessary by the attending physician. All patients were ventilated with a Maquet Servo-i Ventilator in different ventilatory modes with a flow-regulated inspiratory trig-ger set on position 4. Pulse pressure variation, mean and systolic arterial pressure were observed before and after the fluid challenge, which consisted in the intravenous administration of a 250 ml bolus of 6% hetastarch. Fluid responsiveness was defined as a more than 15% increase in arterial pressure after volume expansion. Results: The area under the receiver operator characteristic curve for pulse pressure variation was 0.87 (95% CI 0.74-0.99; p<0.0001) and the grey zone limits were 10% and 15%. Pulse pressure variation was correlated with increase in systolic arterial pressure (r2=0.32; p<0.001) and mean arterial pressure (r2=0.10; p=0.037). Conclusions: Pulse pressure variation predicts fluid responsiveness in patients who actively interact with a Servo-i ventilator with a flow-regulated inspiratory trigger set on position 4.
Keywords: dynamic indices, pulse pressure variation, f luid responsiveness, preload reserve, hemodynamic opti-mization, spontaneous breathing.
Pulse pressure variation
99
HSR Proceedings in Intensive Care and Cardiovascular Anesthesia 2013, Vol. 5
and systolic pressure variation (SPV) ac-curately predicts fluid responsiveness in mechanically ventilated patients passively adapted to the ventilator (2, 3). During the inspiratory phase, if both ventricles are on the ascending limb of the Frank-Starling curve (i.e. they still have a preload re-serve), the venous return to the right heart is hampered by the positive intrathoracic pressure. This will lead to a reduction of the right ventricle stroke volume (SV) that, with a few cardiac cycles delay, will cause a change in left ventricular filling and SV resulting in a change in the arterial pres-sure curve. When the plateau of the Frank-Starling curve is reached, i.e. the preload reserve is exhausted, this phenomenon is greatly reduced. For this purpose the de-livered tidal volume must be 8-10 ml/kg of body weight (4), the patients should not be suffering right ventricle dysfunction (5), and pulmonary compliance should not be excessively reduced (6, 7).In patients who actively interact with the ventilator the regularity of the intrathorac-ic pressure swings can be altered by vari-ous degrees by inspiratory and expiratory efforts and by variations in respiratory rate. According to the published evidence the accuracy of dynamic indices is lost in this setting (3, 8). However, only few stud-ies addressed this issue, they considered heterogeneous indices without mentioning the algorithm used to measure them and they did not report key aspects of ventila-tor setting like inspiratory and expiratory trigger (9-11). Inspiratory and expiratory trigger could indeed act as airway resis-tors and profoundly affect the amplitude of intrathoracic pressure variations and, as a consequence, the dynamic indices and their fluid responsiveness predictive abil-ity (12). Based on clinical observations made in our intensive care unit (ICU), where PPV is routinely monitored, we hy-pothesized that PPV’s clinical usefulness
in actively breathing ventilated patients is critically influenced by the interaction between a specific ventilator setting and a specific PPV measurement algorithm. We, therefore, decided to undertake an obser-vational study aimed at understanding if PPV is a clinically useful predictor of fluid responsiveness in mechanically ventilated ICU patients with spontaneous breathing activity. While the standard method to assess the effect of volume expansion relies on cardi-ac output (CO) or SV measurement, recent data suggest that, although there are some limitations (13), arterial pressure accurate-ly tracks blood flow changes immediately after a fluid challenge (14-16). We opted therefore to use an arterial pressure-based definition of fluid responsiveness.
METHODS
The local ethics committee approved the protocol and, because of the strictly ob-servational characteristics of the study, waived the need for informed consent. We enrolled in the study 42 patients admitted to our general, 13 bed ICU who, in any mo-ment of their ICU stay, were at the same time hypotensive, were mechanically ven-tilated in any ventilatory mode through a tracheal tube or a tracheostomy, had spon-taneous breathing activity, had a valid PPV reading and in whom the attending physi-cian thought indicated to perform a fluid challenge.Hypotension was defined as a systolic ar-terial pressure (SAP) less than 90 mm Hg and/or a mean arterial pressure (MAP) less than 65 mm Hg as measured invasively from a radial or femoral artery. Spontane-ous breathing activity was defined as an evident respiratory activity if in pressure support ventilation (PSV) or a measured respiratory rate at least 20% higher than
100
P. Grassi, et al.
HSR Proceedings in Intensive Care and Cardiovascular Anesthesia 2013, Vol. 5
the respiratory rate set on the ventilator if in all other ventilation modalities. A valid PPV reading was defined as a readily avail-able PPV value measured and displayed according to monitoring details described below. The use of the vasoactive drugs do-butamine and/or noradrenaline was left at the discretion of the attending physician. Exclusion criteria were age 18 years or less, heart rhythm that precluded PPV reading, pregnancy and a change in sedation level or in vasoactive drugs while the data col-lection was carried out as described below.The protocol did not allow any change in ventilation or monitoring strategies divert-ing from normal procedures routinely car-ried out in our ICU based on good clinical practice criteria. All patients were venti-lated with a Servo-i ventilator (Maquet, Rastatt, Germany) and were studied while under stable respiratory conditions, i.e. with an SpO2 of at least 90% and normo-capnia without the need to adjust ventila-tion parameters over a consistent period of time. Ventilator setting was decided by the attending physician with the general aim to reach a PaO2 of at least 60 mm Hg and a PaCO2 between 35 and 45 mm Hg with a 6-8 ml/kg tidal volume (TV) while avoid-ing peak airway pressure higher than 35 cm H2O. The inspiratory trigger was kept, according to our standard clinical practice, at a threshold not imposing unnecessary in-spiratory effort, i.e. at flow position 4. This means that to trigger the ventilator the pa-tient had to generate a flow of at least 1,4 l/min, which is the 70% of the basal flow (2 l/min). Expiratory trigger was again set by clinical judgment independent from study enrollment between 25% and 40%, depending on the individual estimated risk of dynamic hyperinflation. PEEP was ap-plied as deemed clinically appropriate be-tween 0 and 10 cm/H2O. Blood pressure was measured through a standard trans-ducer (Pressure Monitoring Kit, Edwards
Lifesciences, Irvine, California, USA). In all patients PPV was measured through a Philips Intellivue MP 70 monitor (Philips, Suresnes, France). The device calculates PPV from the arterial pressure curve using a specific algorithm developed by Aboy in 2004 (17) and later clinically validated by Canesson (18).Once a patient was enrolled, demographic and anthropometric data, admission diag-nosis, vasoactive drug dosages, ventilation modality, peak airway pressure, PEEP, PPV, SAP and MAP values were manually recorded. Fluid challenge was than admin-istered with standard criteria used in ev-eryday clinical practice in our ICU, which is to say a 250 ml 6% hydroxyethyl starch (Amidolite, B.Braun, Melsungen AG, Ger-many) intravenous bolus delivered at the highest available infusion rate. Immediate-ly after the end of the fluid challenge PPV, SAP and MAP values were again recorded. A patient was defined as fluid responder if the arterial pressure on which he was de-fined hypotensive (SAP and/or MAP) in-creased by at least 15% as compared with pre-fluid challenge values. Fluid responder status was than manually recorded as a bi-nary variable (yes or no).In order to test the PPV fluid responsive-ness prediction performance we a priori decided to analyze data with receiver op-erator characteristic (ROC) curve analysis. A power analysis showed that to detect an expected area under the ROC curve (AUC) of 0.85 or higher with the alfa level set a 0.05, the beta level at 0.20 (i.e. with a pow-er of 80%) and assuming equal sample size in the two groups, a minimum of 20 pa-tients per group would have been required. We scheduled to enroll 50 patients to com-pensate for incomplete data. The optimal PPV threshold was determined with the Youden’s index (19). In line with a more clinically useful approach that was recent-ly suggested (19-21) we also adopted a “grey
Pulse pressure variation
101
HSR Proceedings in Intensive Care and Cardiovascular Anesthesia 2013, Vol. 5
zone”, or two cutoffs, approach to describe the PPV range of values for which formal clinical conclusions cannot be reached. To this purpose we determined the PPV values with both specificity and sensitivity lower than 90% and plotted a two-curves graph. The positive and negative likelihood ratios (LR), the positive and negative predictive values (PV) and their 95% confidence in-tervals (CI) were calculated. The relation between PPV and fluid re-sponder status was explored also with lo-gistic regression while linear regression was used to study the association between baseline PPV and percentage variation in MAP and SAP after fluid challenge. Dif-ferences between independent groups were analyzed with the Mann-Whitney rank sum test or the independent samples t-test and differences between paired groups
were studied with the Wilcoxon test or the paired samples t-test as appropriate. Nor-mality was checked with the Kolmogorov-Smirnov test. We used the MedCalc version 12.2.1 statistical software (MedCalc, Mar-iakerke, Belgium).
RESULTS
We studied 42 patients between December 2010 and April 2012. None of the enrolled patient was excluded from the study. The study was terminated before reaching the scheduled sample size (50 patients) because of slow enrollment rate and because data quality at a sample size sufficient to guar-antee adequate power was satisfactory. No patient had incomplete data except one, for which body weight was missing. According
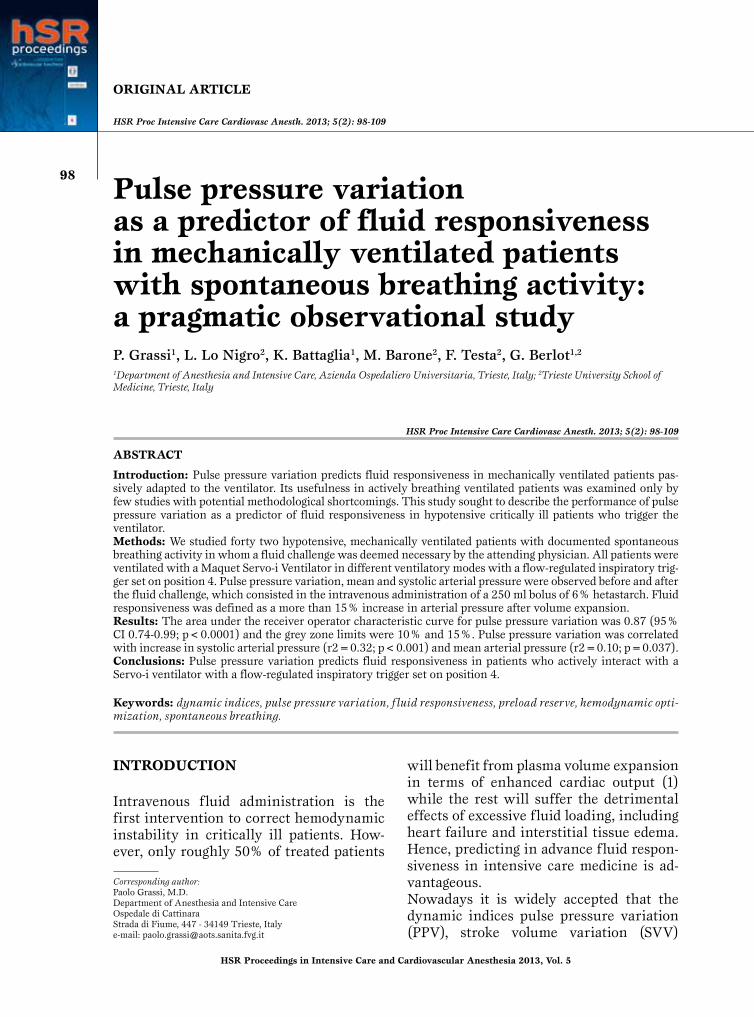
Figure 1Receiver operator char-acteristic curve for pulse pressure variation with “responder” as classifi-cation variable (Area under the curve = 0.87; p< 0.0001).
102
P. Grassi, et al.
HSR Proceedings in Intensive Care and Cardiovascular Anesthesia 2013, Vol. 5
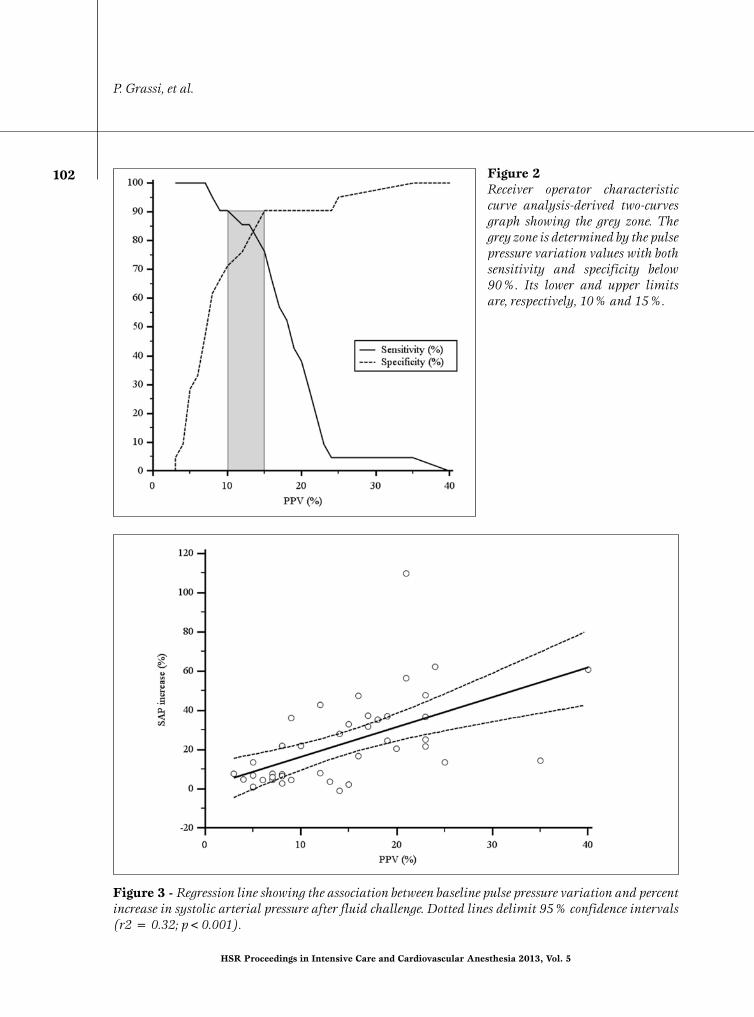
Figure 2Receiver operator characteristic curve analysis-derived two-curves graph showing the grey zone. The grey zone is determined by the pulse pressure variation values with both sensitivity and specificity below 90%. Its lower and upper limits are, respectively, 10% and 15%.
Figure 3 - Regression line showing the association between baseline pulse pressure variation and percent increase in systolic arterial pressure after fluid challenge. Dotted lines delimit 95% confidence intervals (r2 = 0.32; p<0.001).
Pulse pressure variation
103
HSR Proceedings in Intensive Care and Cardiovascular Anesthesia 2013, Vol. 5
to the adopted criterion exactly 50% of pa-tients were responders to fluid administra-tion. Patients’ characteristics and differenc-es between responders and non responders are summarized in Table 1. Ventilation mo-dalities are shown in Table 2. The area under the ROC curve for PPV with responder status as classification variable was 0.87 (95% CI 0.74 to 0.99; p<0.0001; Figure 1). The optimal single cutoff value was 13%, yielding a sensitivity of 85.71% (95% CI 63.70 to 97.00) and a specificity of 80.95% (95% CI 58.10 to 94.60). The lower and higher cutoffs delimiting the gray zone were, respectively, 10% and 15% (Figure 2). Eight patients (19%) had PPV values in-cluded in this interval. The negative LR corresponding with the lower limit of the grey zone was 0.13 (95% CI 0.03 to 0.60)
and the positive LR corresponding with the higher limit of the grey zone was 8.00 (95% CI 6.10 to 10.50). The negative LR remained equal to 0.00 for all PPV values lower than 8% while the highest posi-tive LR was 8.00 and it corresponded to a PPV=15%. Somehow unexpectedly, the positive LR decreased after peaking at this point. Overall, ROC curve analysis defined PPV as a good predictor of fluid respon-siveness in the studied setting (19-22). Logistic regression confirmed this finding: the odds ratio (OR) for PPV with responder status as classification variable was 1.21 (95% CI 1.07 to 1.37; p=0.002). Linear re-gression showed a significant relationship between PPV and percentage increase in SAP after fluid administration (r2=0.32; p<0.001; Figure 3).
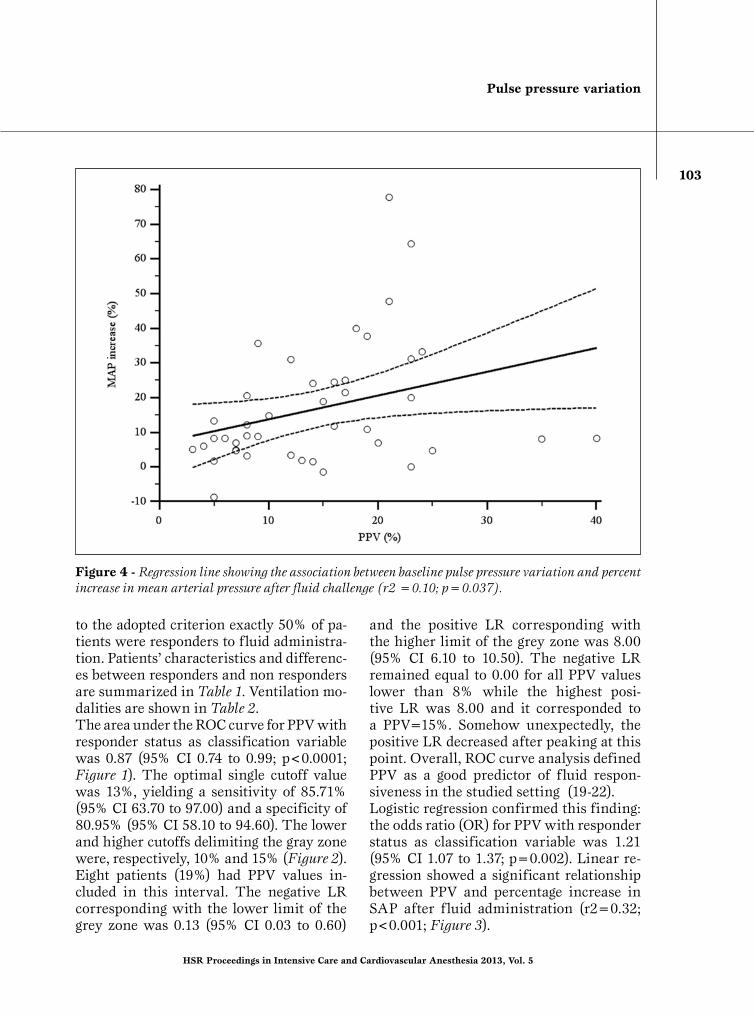
Figure 4 - Regression line showing the association between baseline pulse pressure variation and percent increase in mean arterial pressure after fluid challenge (r2 =0.10; p=0.037).
104
P. Grassi, et al.
HSR Proceedings in Intensive Care and Cardiovascular Anesthesia 2013, Vol. 5
The relationship was marginal, although still significant, for MAP (r2=0.10; p=0.037; Figure 4) possibly reflecting an increase in pulse pressure which modified SAP and diastolic arterial pressure (DAP) leaving MAP almost unchanged as a con-sequence of volume expansion. Overall, only 2 patients were treated with dobuta-mine and they were both responders while 14 received noradrenaline, 8 of which
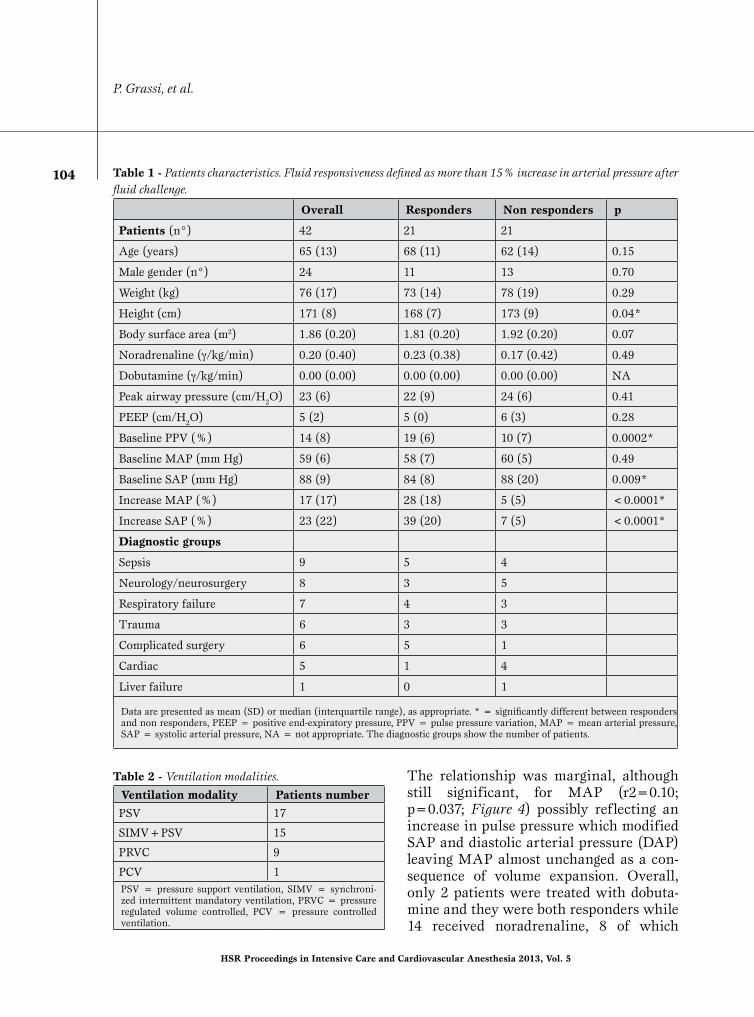
Table 1 - Patients characteristics. Fluid responsiveness defined as more than 15% increase in arterial pressure after fluid challenge.
Overall Responders Non responders p
Patients (n°) 42 21 21
Age (years) 65 (13) 68 (11) 62 (14) 0.15
Male gender (n°) 24 11 13 0.70
Weight (kg) 76 (17) 73 (14) 78 (19) 0.29
Height (cm) 171 (8) 168 (7) 173 (9) 0.04*
Body surface area (m2) 1.86 (0.20) 1.81 (0.20) 1.92 (0.20) 0.07
Noradrenaline (γ/kg/min) 0.20 (0.40) 0.23 (0.38) 0.17 (0.42) 0.49
Dobutamine (γ/kg/min) 0.00 (0.00) 0.00 (0.00) 0.00 (0.00) NA
Peak airway pressure (cm/H2O) 23 (6) 22 (9) 24 (6) 0.41
PEEP (cm/H2O) 5 (2) 5 (0) 6 (3) 0.28
Baseline PPV (%) 14 (8) 19 (6) 10 (7) 0.0002*
Baseline MAP (mm Hg) 59 (6) 58 (7) 60 (5) 0.49
Baseline SAP (mm Hg) 88 (9) 84 (8) 88 (20) 0.009*
Increase MAP (%) 17 (17) 28 (18) 5 (5) <0.0001*
Increase SAP (%) 23 (22) 39 (20) 7 (5) <0.0001*
Diagnostic groups
Sepsis 9 5 4
Neurology/neurosurgery 8 3 5
Respiratory failure 7 4 3
Trauma 6 3 3
Complicated surgery 6 5 1
Cardiac 5 1 4
Liver failure 1 0 1
Data are presented as mean (SD) or median (interquartile range), as appropriate. * = significantly different between responders and non responders, PEEP = positive end-expiratory pressure, PPV = pulse pressure variation, MAP = mean arterial pressure, SAP = systolic arterial pressure, NA = not appropriate. The diagnostic groups show the number of patients.
Table 2 - Ventilation modalities.
Ventilation modality Patients number
PSV 17
SIMV+PSV 15
PRVC 9
PCV 1PSV = pressure support ventilation, SIMV = synchroni-zed intermittent mandatory ventilation, PRVC = pressure regulated volume controlled, PCV = pressure controlled ventilation.
Pulse pressure variation
105
HSR Proceedings in Intensive Care and Cardiovascular Anesthesia 2013, Vol. 5
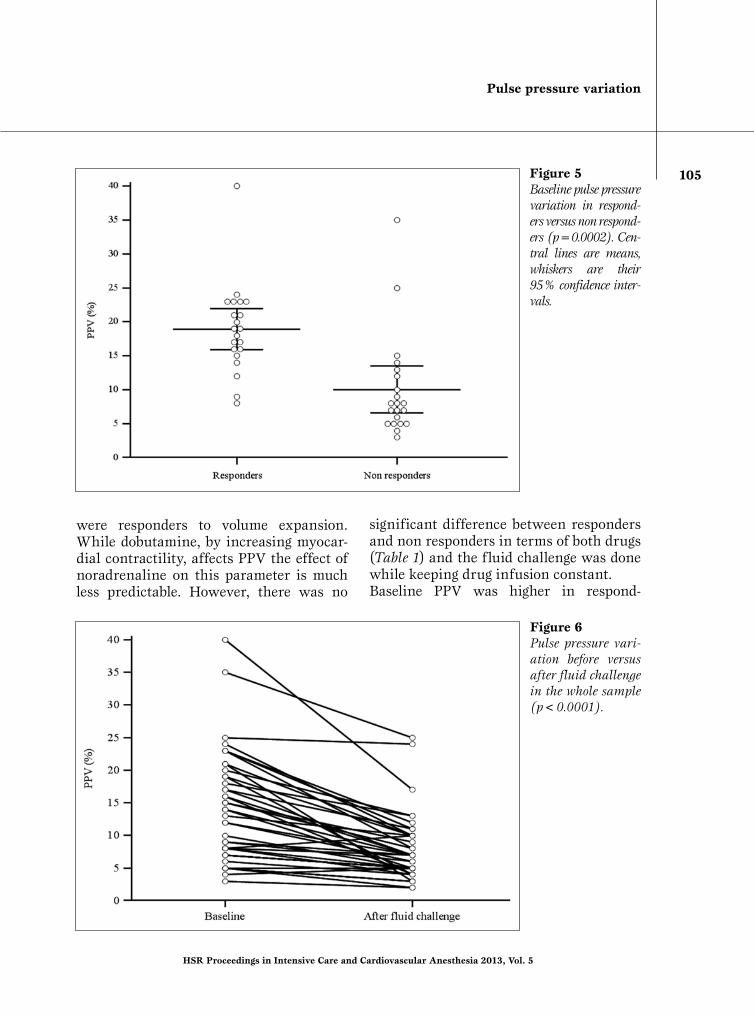
Figure 5Baseline pulse pressure variation in respond-ers versus non respond-ers (p=0.0002). Cen-tral lines are means, whiskers are their 95% confidence inter-vals.
Figure 6Pulse pressure vari-ation before versus after fluid challenge in the whole sample (p<0.0001).
were responders to volume expansion. While dobutamine, by increasing myocar-dial contractility, affects PPV the effect of noradrenaline on this parameter is much less predictable. However, there was no
significant difference between responders and non responders in terms of both drugs (Table 1) and the fluid challenge was done while keeping drug infusion constant. Baseline PPV was higher in respond-
106
P. Grassi, et al.
HSR Proceedings in Intensive Care and Cardiovascular Anesthesia 2013, Vol. 5
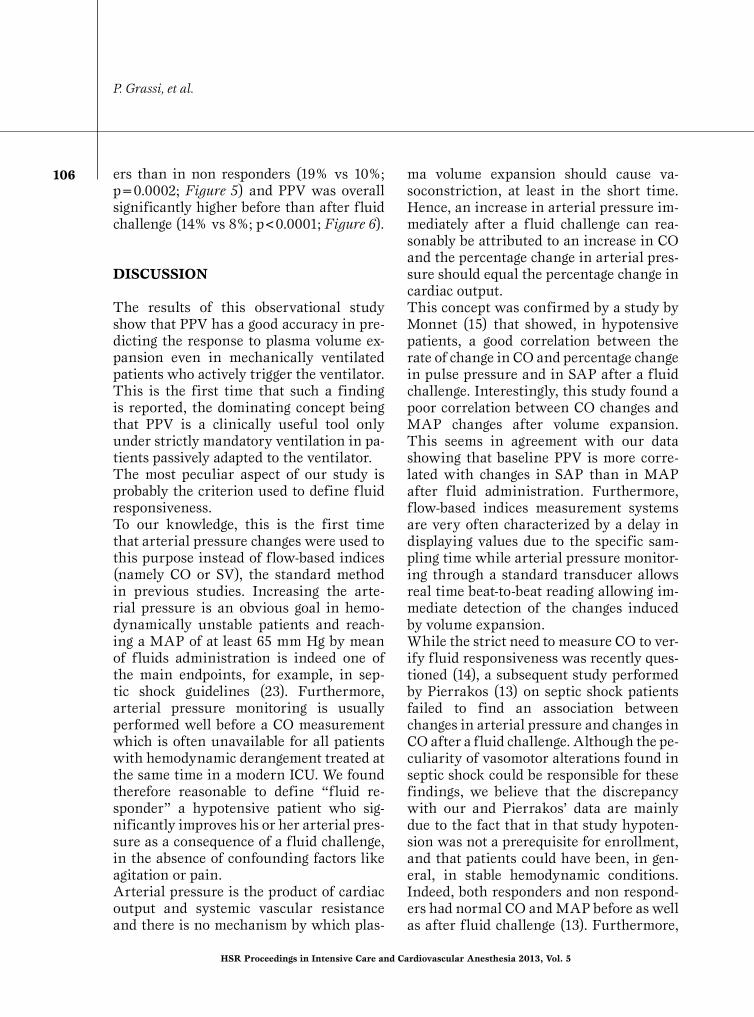
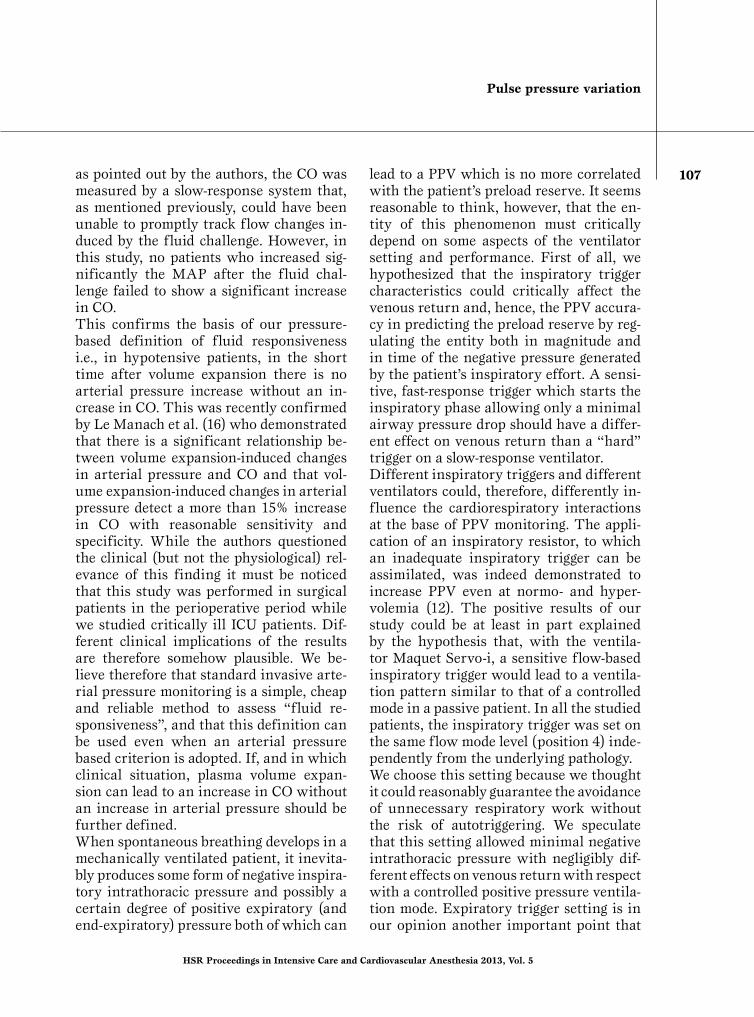
ers than in non responders (19% vs 10%; p=0.0002; Figure 5) and PPV was overall significantly higher before than after fluid challenge (14% vs 8%; p<0.0001; Figure 6).
DISCUSSION
The results of this observational study show that PPV has a good accuracy in pre-dicting the response to plasma volume ex-pansion even in mechanically ventilated patients who actively trigger the ventilator. This is the first time that such a finding is reported, the dominating concept being that PPV is a clinically useful tool only under strictly mandatory ventilation in pa-tients passively adapted to the ventilator. The most peculiar aspect of our study is probably the criterion used to define fluid responsiveness. To our knowledge, this is the first time that arterial pressure changes were used to this purpose instead of flow-based indices (namely CO or SV), the standard method in previous studies. Increasing the arte-rial pressure is an obvious goal in hemo-dynamically unstable patients and reach-ing a MAP of at least 65 mm Hg by mean of fluids administration is indeed one of the main endpoints, for example, in sep-tic shock guidelines (23). Furthermore, arterial pressure monitoring is usually performed well before a CO measurement which is often unavailable for all patients with hemodynamic derangement treated at the same time in a modern ICU. We found therefore reasonable to define “fluid re-sponder” a hypotensive patient who sig-nificantly improves his or her arterial pres-sure as a consequence of a fluid challenge, in the absence of confounding factors like agitation or pain. Arterial pressure is the product of cardiac output and systemic vascular resistance and there is no mechanism by which plas-
ma volume expansion should cause va-soconstriction, at least in the short time. Hence, an increase in arterial pressure im-mediately after a fluid challenge can rea-sonably be attributed to an increase in CO and the percentage change in arterial pres-sure should equal the percentage change in cardiac output. This concept was confirmed by a study by Monnet (15) that showed, in hypotensive patients, a good correlation between the rate of change in CO and percentage change in pulse pressure and in SAP after a fluid challenge. Interestingly, this study found a poor correlation between CO changes and MAP changes after volume expansion. This seems in agreement with our data showing that baseline PPV is more corre-lated with changes in SAP than in MAP after fluid administration. Furthermore, flow-based indices measurement systems are very often characterized by a delay in displaying values due to the specific sam-pling time while arterial pressure monitor-ing through a standard transducer allows real time beat-to-beat reading allowing im-mediate detection of the changes induced by volume expansion. While the strict need to measure CO to ver-ify fluid responsiveness was recently ques-tioned (14), a subsequent study performed by Pierrakos (13) on septic shock patients failed to find an association between changes in arterial pressure and changes in CO after a fluid challenge. Although the pe-culiarity of vasomotor alterations found in septic shock could be responsible for these findings, we believe that the discrepancy with our and Pierrakos’ data are mainly due to the fact that in that study hypoten-sion was not a prerequisite for enrollment, and that patients could have been, in gen-eral, in stable hemodynamic conditions. Indeed, both responders and non respond-ers had normal CO and MAP before as well as after fluid challenge (13). Furthermore,
Pulse pressure variation
107
HSR Proceedings in Intensive Care and Cardiovascular Anesthesia 2013, Vol. 5
as pointed out by the authors, the CO was measured by a slow-response system that, as mentioned previously, could have been unable to promptly track flow changes in-duced by the fluid challenge. However, in this study, no patients who increased sig-nificantly the MAP after the fluid chal-lenge failed to show a significant increase in CO. This confirms the basis of our pressure-based definition of fluid responsiveness i.e., in hypotensive patients, in the short time after volume expansion there is no arterial pressure increase without an in-crease in CO. This was recently confirmed by Le Manach et al. (16) who demonstrated that there is a significant relationship be-tween volume expansion-induced changes in arterial pressure and CO and that vol-ume expansion-induced changes in arterial pressure detect a more than 15% increase in CO with reasonable sensitivity and specificity. While the authors questioned the clinical (but not the physiological) rel-evance of this finding it must be noticed that this study was performed in surgical patients in the perioperative period while we studied critically ill ICU patients. Dif-ferent clinical implications of the results are therefore somehow plausible. We be-lieve therefore that standard invasive arte-rial pressure monitoring is a simple, cheap and reliable method to assess “fluid re-sponsiveness”, and that this definition can be used even when an arterial pressure based criterion is adopted. If, and in which clinical situation, plasma volume expan-sion can lead to an increase in CO without an increase in arterial pressure should be further defined.When spontaneous breathing develops in a mechanically ventilated patient, it inevita-bly produces some form of negative inspira-tory intrathoracic pressure and possibly a certain degree of positive expiratory (and end-expiratory) pressure both of which can
lead to a PPV which is no more correlated with the patient’s preload reserve. It seems reasonable to think, however, that the en-tity of this phenomenon must critically depend on some aspects of the ventilator setting and performance. First of all, we hypothesized that the inspiratory trigger characteristics could critically affect the venous return and, hence, the PPV accura-cy in predicting the preload reserve by reg-ulating the entity both in magnitude and in time of the negative pressure generated by the patient’s inspiratory effort. A sensi-tive, fast-response trigger which starts the inspiratory phase allowing only a minimal airway pressure drop should have a differ-ent effect on venous return than a “hard” trigger on a slow-response ventilator. Different inspiratory triggers and different ventilators could, therefore, differently in-fluence the cardiorespiratory interactions at the base of PPV monitoring. The appli-cation of an inspiratory resistor, to which an inadequate inspiratory trigger can be assimilated, was indeed demonstrated to increase PPV even at normo- and hyper-volemia (12). The positive results of our study could be at least in part explained by the hypothesis that, with the ventila-tor Maquet Servo-i, a sensitive flow-based inspiratory trigger would lead to a ventila-tion pattern similar to that of a controlled mode in a passive patient. In all the studied patients, the inspiratory trigger was set on the same flow mode level (position 4) inde-pendently from the underlying pathology. We choose this setting because we thought it could reasonably guarantee the avoidance of unnecessary respiratory work without the risk of autotriggering. We speculate that this setting allowed minimal negative intrathoracic pressure with negligibly dif-ferent effects on venous return with respect with a controlled positive pressure ventila-tion mode. Expiratory trigger setting is in our opinion another important point that
108
P. Grassi, et al.
HSR Proceedings in Intensive Care and Cardiovascular Anesthesia 2013, Vol. 5
can have effects on lung mechanics and as a consequence on the entity and clinical usefulness of PPV. All our patients had the expiratory trigger set to minimize the risk of dynamic hyper-inflation: thus when intrinsic positive end-expiratory pressure (iPEEP) was suspect-ed, expiratory flow-based cycling threshold was increased from our default 25% level to the value that allowed an expiration time sufficiently long to avoid clinically relevant iPEEP. This could have contrib-uted to maintain the association between PPV and fluid responsiveness since the ap-plication of an expiratory resistor had been demonstrated to affect the PPV accuracy as a fluid responsiveness predictor (12). As far as external PEEP is concerned, applied levels were generally low in all patients (Table 1). While non responders had slightly higher PEEP than responders, the difference was minimal and not statistically significant. We believe, therefore, that differences in this parameter did not affect our results.Our study has some limitations. First, we did not record the TV of the studied pa-tients. TV is a major determinant of PPV and other dynamic circulatory indices (3) and we acknowledge that the lack of infor-mation about this parameter could impede clear interpretation of the data. While we cannot formally exclude a differ-ence in TV between responders and non responders we also believe that this could not have distorted the final and pragmati-cally relevant interpretation of our data, which is that, in the setting found in every-day clinical practice in our ICU, in patients who actively trigger the ventilator in PSV, SIMV, PRVC or PCV and who are in stable respiratory conditions, PPV remains a very accurate predictor of response to plasma volume expansion. Second, all our patients were ventilated and monitored with the same devices. We
believe that, when spontaneous breathing is present, the usefulness of PPV critically depends on the specific performance of both ventilator and monitoring algorithm. We cannot exclude, therefore, that differ-ent results could have been found if differ-ent technology and different settings were used. Third, we could not calculate the confidence interval of the best single cutoff because our statistical software lacked this possibility.
CONCLUSION
Our data suggest that in critically ill pa-tients with spontaneous breathing activity ventilated with a Servo-i ventilator with the inspiratory trigger set on flow position 4, PPV, when measured through a Philips Intellivue MP 70 monitor, is a clinically useful tool that accurately predicts fluid responsiveness.
REFERENCES1. Marik PE. Techniques for assessment of intravascular vol-
ume in critically ill patients. J Intensive Care Med 2009; 24: 329-37.
2. Marik PE, Cavallazzi R, Vasu T, et al. Dynamic changes in arterial waveform derived variables and fluid responsive-ness in mechanically ventilated patients: a systematic re-view of the literature. Crit Care Med 2009; 37: 2642-7.
3. Biais M, Ouattara A, Janvier G, et al. Case scenario: respira-tory variations in arterial pressure for guiding fluid man-agement in mechanically ventilated patients. Anesthesiol-ogy 2012; 116: 1354-1361.
4. De Backer D, Heenen S, Piagnerelli M, et al. Pulse pressure variations to predict fluid responsiveness: influence of tidal volume. Intensive Care Med 2005; 31: 517-23.
5. Von Ballmoos MW, Takala J, Roeck M, et al. Pulse-pressure variation and hemodynamic response in patients with ele-vated pulmonary artery pressure: a clinical study. Crit Care 2010; 14: 111.
6. Lakhal K, Ehrmann S, Benzekri-Lefèvre D, et al. Respira-tory pulse pressure variation fails to predict fluid respon-siveness in acute respiratory distress syndrome. Crit Care 2011; 15: 85.
7. Monnet X, Bleibtreu A, Ferré A, et al. Passive leg-raising and end-expiratory occlusion tests perform better than pulse pressure variation in patients with low respiratory system compliance. Crit Care Med 2012; 40: 152-7.
8. Teboul JL, Monnet X. Prediction of volume responsiveness in critically ill patients with spontaneous breathing activ-ity. Curr Opin Crit Care 2008; 14: 334-9.
9. Perner A, Faber T. Stroke volume variation does not predict
Pulse pressure variation
109
HSR Proceedings in Intensive Care and Cardiovascular Anesthesia 2013, Vol. 5
Cite this article as: Grassi P, Lo Nigro L, Battaglia K, Barone M, Testa F, Berlot G. Pulse pressure variation as a predictor of fluid responsiveness in mechanically ventilated patients with spontaneous breathing activity: a pragmatic observational study. HSR Proc Intensive Care Cardiovasc Anesth. 2013; 5 (2): 98-109.
Source of Support: Nil. Disclosures: None declared.
fluid responsiveness in patients with septic shock on pres-sure support ventilation. Acta Aneaesthesiol Scand 2006; 50: 1068-73.
10. Heenen S, De Backer D, Vincent JL. How can the response to volume expansion in patients with spontaneous respira-tory movement be predicted? Crit Care 2008; 10: 102.
11. Monnet X, Rienzo M, Osman D, et al. Passive leg raising predict fluid responsiveness in the critically ill. Crit Care Med 2006; 34: 1402-7.
12. Dahl MK, Vistisen ST, Koefoed-Nielsen J, et al. Using an expiratory resistor, arterial pressure variations predict fluid responsiveness during spontaneous breathing: an experi-mental porcine study. Crit Care 2008; 13: 39.
13. Pierrakos C, Velissaris D, Scolletta S, et al. Can changes in arterial pressure be used to detect changes in cardiac index during fluid challenge in patients with septic shock? Inten-sive Care Med 2012; 38: 422-8.
14. Vincent JL. “Let’s give some fluid and see what happens” versus the “mini fluid challenge”. Anesthesiology 2011; 115: 455-6.
15. Monnet X, Letierce A, Hamzaoui O, et al. Arterial pressure allows monitoring the changes in cardiac output induced by volume expansion but not by norepinephrine. Crit Care Med 2011; 39: 1394-9.
16. Le Manach Y, Hofer CK, Lehot JJ, et al. Can changes in
arterial pressure be used to detect changes in cardiac out-put during volume expansion in the perioperative period? Anesthesiology 2012; 117: 1165-74.
17. Aboy M, McNames J, Thong T, et al. A novel algorithm to estimate the pulse pressure variation index PP. IEEE Trans Biomed Eng 2004; 51: 2198-203.
18. Cannesson M, Slieker J, Desebbe O, et al. The ability of a novel algorithm for automatic estimation of the respira-tory variations in arterial pulse pressure to monitor fluid responsiveness in the operating room. Anesth Analg 2008; 106: 1195-200.
19. Ray P, Le Manach, Y, Riou B, Houle TT. Statistical evalua-tion of a biomarker. Anesthesiology 2010; 112: 1023-40.
20. Cannesson M, Le Manach Y, Hofer CK, et al. Assessing the diagnostic accuracy of pulse pressure variations for the prediction of fluid responsiveness. A “grey zone” approach. Anesthesiology 2011; 115: 231-41.
21. De Hert SG. Assessment of fluid responsiveness. Insights in a “grey zone”. Anesthesiology 2011; 115: 229-30.
22. Grimes DA, Schulz KF. Refining clinical diagnosis with likelihood ratios. Lancet 2005; 365: 1500-5.
23. Dellinger RP, Levy MM, Carlet JM, et al. Surviving sep-sis campaign: International guidelines for management of severe sepsis and septic shock: 2008. Intensive Care Med 2008; 34: 17-60.