Embed Size (px)
Citation preview

RMC DISCUSSION PAPER SERIES 123
What Explains Changing Spreads on EmergingMarket DebtFundamentals or Market Sentiment?
Barry EichengreenAshoka Mody
Pub
lic D
iscl
osur
e A
utho
rized
Pub
lic D
iscl
osur
e A
utho
rized
Pub
lic D
iscl
osur
e A
utho
rized
Pub
lic D
iscl
osur
e A
utho
rized
Pub
lic D
iscl
osur
e A
utho
rized
Pub
lic D
iscl
osur
e A
utho
rized
Pub
lic D
iscl
osur
e A
utho
rized
Pub
lic D
iscl
osur
e A
utho
rized


iii
Foreword v
Acknowledgments vi
Abstract vii
Emerging Market Bonds: Recent Trends and Debates 1
The Literature 4
Data and Sample Characteristics 6The Bonds: Numbers, Spreads, and Issuers 6Explanatory Variables 8
Specification and Estimation 9
Results 11Interpretation of Coefficients 12Sensitivity of the Results to Country Sample 14
Disaggregation and Sensitivity Analysis 15Private and Nonprivate Borrowers 15Behavior Over Time 15
Changes in Spreads Over Time: The Contribution of Fundamentals and Sentiment 18
Using 1991–95 Estimates to Forecast 1996 Spreads 20
Conclusions and Implications 21
Data Appendix 22
References 24
Contents

FiguresFigure 1 Trends in emerging market secondary spreads and U.S. interest rates 2Figure 2 Primary (contemporary) versus secondary spreads 6
TablesTable 1 Gross bond issues, equity issues, and syndicated loans to emerging markets 1Table 2 Bonds issued and usable for anlysis, 1991–96 7Table 3 Bond spreads, 1991–96 7Table 4 Bond spreads by type of issuer 8Table 5 Descriptive statistics of issuers (is = 1)
and non-issuers (is = 0), 1991–96 9Table 6 Determinants of spreads, 1991–95 11Table 7 Determinants of the probability of a bond issue, 1991–95 13Table 8 Public and private issues in Latin America and East Asia 16Table 9 Rolling regressions 17Table 10 Oxaca decompositions, various subperiods 19Table 11 Was the market irrationally exuberant in 1996? 20
iv

v
Foreword
The flow of private capital to emerging markets increased tremendously during the 1990s. Purchases of bonds issuedby both the public and the private sector were a major conduit for these capital flows. The spreads on the bonds,or the risk premium charged above a benchmark rate, is of obvious interest to the international community. Spreads
rose rapidly in the wake of the Mexican peso devaluation in late 1994. But through 1996 and into early 1997 spreads fell,only to rise again following the Asian crisis.
This paper assembles data on a substantial set of bonds issued during the 1990s and seeks to determine the factorsthat lead to bond issuance and those that influence the spreads on the bonds. The evidence is that at any given point intime, the spreads on the bonds reflect conventionally accepted risk factors. However, the movements over time appearless tied to economic fundamentals, suggesting that market sentiment plays an important role over periods of severalmonths.
This paper forms part of our ongoing effort to better understand and interpret market trends. I hope that it will be ofuse to policymakers and to market participants.
Nina ShapiroDirectorProject Finance and Guarantees

vi
The authors are grateful to Steve Dunaway and Anne Jensen of the International Monetary Fund for data, to AnandaChanda for sterling research assistance, and to Richard Parry for arranging an early informal discussion of the results atthe International Finance Corporation. Nina Shapiro provided many comments throughout the writing of the paper.
Acknowledgments

vii
This paper analyzes data on nearly one thousand developing country bonds issued during 1991–96, a period thatspans the recent episode of heavy reliance on bonded debt. Both the issue decisions of debtors and the pricingdecisions of investors are considered, minimizing the potential for selectivity bias. Overall, the results confirm that
measures of higher credit quality lead to a higher probability of issue and to a lower spread. Observed changes in funda-mentals, however, explain only a small portion of the spread compression in the period leading up to the recent crisis inemerging markets.
Abstract


1
The number and value of bonds issued by emergingmarket borrowers have grown enormously duringthe 1990s (table 1). These bonds have been a major
source of capital for developing countries and have hadsignificant implications for international capital markets.The value of bonds issued by developing countries rosefrom negligible levels in the 1980s—less than $3.5 billionin 1989—to $24 billion in 1992, more than $50 billion ayear in 1993–95, $102 billion in 1996, and even higher lev-els in 1997.1 Equity issues, while the subject of much atten-tion, have never reached comparable heights.
The market’s ability to discriminate among borrowersand to price risk appropriately has been controversial, tosay the least. Some observers believe that the informationrequired to forecast returns is too costly to acquire and pro-cess. Thus, they say, investors price bonds based on incom-plete knowledge of countries’ economic and financialcircumstances, a practice conducive to herding and mar-ket volatility.2 Others insist that investors have powerful
incentives to be informed and discriminating. As evidencethey cite the differentials that exist between yields on bondsissued by countries with different credit ratings and eco-nomic characteristics.
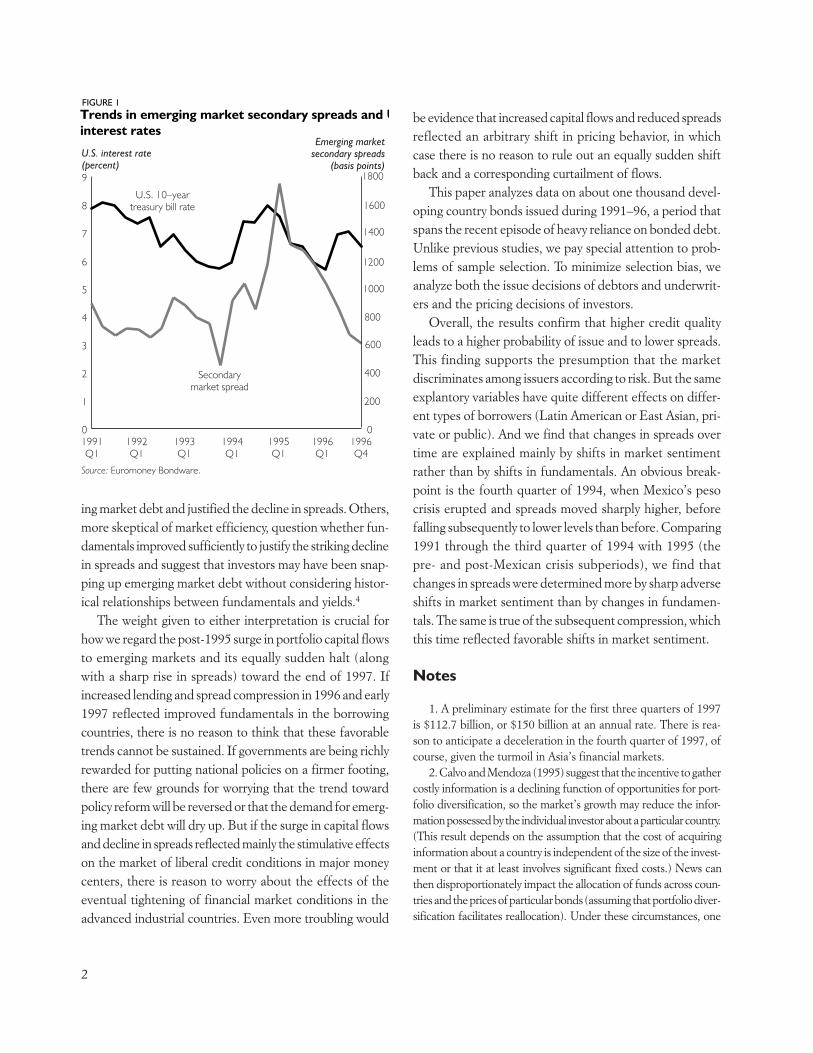
Proponents of both views have advanced their preferredexplanation for the drop in emerging market bond spreadsthat occurred between 1995 and early 1997. The secondarymarket spread between developing country sovereign bondsand high-yield U.S. corporate issues fell from 1,752 basispoints in March 1995 to 537 basis points in December1996.3 (The declining spreads of stripped Brady bonds overU.S. Treasury rates is shown in figure 1.) Advocates of the“efficiently functioning markets” view explain this trendby pointing to improving macroeconomic and financial fun-damentals in developing countries, which rededicated them-selves to economic liberalization and structural reform and,following Mexico’s 1994 peso crisis, redoubled their effortsto organize their fiscal, monetary, and financial affairs. Betterpolicies, in this view, reduced the risk of investing in emerg-
Emerging Market Bonds: Recent Trends and Debates
TABLE 1
Gross bond issues, equity issues, and syndicated loans to emerging markets(billions of U.S. dollars)
1991 1992 1993 1994 1995 1996 1997Q1
Bonds 13.9 24.3 62.7 56.5 57.6 101.9 27.7Western hemisphere 7.1 12.9 28.8 18.0 23.1 47.1 11.9Asia 4.1 5.9 22.0 29.9 25.3 43.1 12.7Europe and Central Asia 2.1 4.8 9.7 3.5 6.6 7.4 2.8Middle East 0.4 0 2.5 3.0 0.7 2.6 0.3Africa 0.3 0.7 0.2 2.1 1.9 1.6 0
Portfolio equity 5.6 7.2 11.9 18.0 11.2 16.4 3.2
Syndicated loan commitments 50.7 42.5 43.0 55.1 74.9 79.7 21.3
Short-term commitments 5.2 8.2 11.9 14.3 21.6 30.5 7.4
Total 75.4 82.4 129.5 144.0 165.3 228.5 59.6
Source: IMF 1997.
2
ing market debt and justified the decline in spreads. Others,more skeptical of market efficiency, question whether fun-damentals improved sufficiently to justify the striking declinein spreads and suggest that investors may have been snap-ping up emerging market debt without considering histor-ical relationships between fundamentals and yields.4
The weight given to either interpretation is crucial forhow we regard the post-1995 surge in portfolio capital flowsto emerging markets and its equally sudden halt (alongwith a sharp rise in spreads) toward the end of 1997. Ifincreased lending and spread compression in 1996 and early1997 reflected improved fundamentals in the borrowingcountries, there is no reason to think that these favorabletrends cannot be sustained. If governments are being richlyrewarded for putting national policies on a firmer footing,there are few grounds for worrying that the trend towardpolicy reform will be reversed or that the demand for emerg-ing market debt will dry up. But if the surge in capital flowsand decline in spreads reflected mainly the stimulative effectson the market of liberal credit conditions in major moneycenters, there is reason to worry about the effects of theeventual tightening of financial market conditions in theadvanced industrial countries. Even more troubling would
be evidence that increased capital flows and reduced spreadsreflected an arbitrary shift in pricing behavior, in whichcase there is no reason to rule out an equally sudden shiftback and a corresponding curtailment of flows.
This paper analyzes data on about one thousand devel-oping country bonds issued during 1991–96, a period thatspans the recent episode of heavy reliance on bonded debt.Unlike previous studies, we pay special attention to prob-lems of sample selection. To minimize selection bias, weanalyze both the issue decisions of debtors and underwrit-ers and the pricing decisions of investors.
Overall, the results confirm that higher credit qualityleads to a higher probability of issue and to lower spreads.This finding supports the presumption that the marketdiscriminates among issuers according to risk. But the sameexplantory variables have quite different effects on differ-ent types of borrowers (Latin American or East Asian, pri-vate or public). And we find that changes in spreads overtime are explained mainly by shifts in market sentimentrather than by shifts in fundamentals. An obvious break-point is the fourth quarter of 1994, when Mexico’s pesocrisis erupted and spreads moved sharply higher, beforefalling subsequently to lower levels than before. Comparing1991 through the third quarter of 1994 with 1995 (thepre- and post-Mexican crisis subperiods), we find thatchanges in spreads were determined more by sharp adverseshifts in market sentiment than by changes in fundamen-tals. The same is true of the subsequent compression, whichthis time reflected favorable shifts in market sentiment.
Notes
1. A preliminary estimate for the first three quarters of 1997is $112.7 billion, or $150 billion at an annual rate. There is rea-son to anticipate a deceleration in the fourth quarter of 1997, ofcourse, given the turmoil in Asia’s financial markets.
2. Calvo and Mendoza (1995) suggest that the incentive to gathercostly information is a declining function of opportunities for port-folio diversification, so the market’s growth may reduce the infor-mation possessed by the individual investor about a particular country.(This result depends on the assumption that the cost of acquiringinformation about a country is independent of the size of the invest-ment or that it at least involves significant fixed costs.) News canthen disproportionately impact the allocation of funds across coun-tries and the prices of particular bonds (assuming that portfolio diver-sification facilitates reallocation). Under these circumstances, one
FIGURE 1Trends in emerging market secondary spreads and Uinterest rates
0
1
2
3
4
5
6
7
8
9
1996Q4
1996Q1
1995Q1
1994Q1
1993Q1
1992Q1
1991Q1
0
200
400
600
800
1000
1200
1400
1600
1800
U.S. 10–yeartreasury bill rate
Secondarymarket spread
U.S. interest rate(percent)
Emerging marketsecondary spreads
(basis points)
Source: Euromoney Bondware.

can imagine how investors might fail to raise the risk premium on aparticular bond issue to reflect a gradual deterioration in economicconditions, how news about this trend could lead to a jump inprices, and how information about conditions in one country couldlead investors to revise their expectations about the prospects of oth-ers with superficially similar characteristics. Chari and Kehoe (1997)argue that “hot money” results from “frictions” in information lead-ing to herd-like behavior of investors in and out of countries on themargin, that is, countries that are not obviously attractive or defi-nitely “no-no’s.” They contrast their model with that of Calvo andMendoza where the ability to diversify limits incentives for infor-mation acquisition. Chari and Kehoe argue that their model predictsthe types of countries that will experience hot money flows whereasCalvo and Mendoza predict only that hot money flows will occur.
Herd behavior may also be observed for foreign investment (Kinoshitaand Mody 1997).
3. Spreads continued to fall through the third week of February1997, after which they reversed direction and began to fluctuatemore widely.
4. One frequently heard justification for this view is that theMexican rescue removed the need for investors to concern them-selves with a potential borrower’s credit worthiness, or at least leftthem with this belief, since the U.S.- and IMF-led package allowedthem to escape the 1994–95 Mexican crisis scot free. If the same“chain of guarantees” is likely to again come into play in theevent of future debt-servicing difficulties, bondholders have lit-tle reason to invest the time and effort needed to discriminateamong bonds according to risk.
3

Despite the explosive growth of emerging marketdebt, there have been few systematic studies of theissue and pricing of developing country bonds.
(This is in contrast to the secondary market for bank loans,on which there are many studies, reflecting the dominanceof bank lending during 1974–82).1 But there is reason tothink that the determinants of risk and therefore pricingbehavior differ between bank loans and bonds. Models ofdelegated monitoring suggest that banks may have a com-parative advantage in assembling and processing informa-tion about their clients, and that this reputational asset maybe incorporated into the secondary market prices of theirclaims. Pecking order theories of finance suggest that claimswith different degrees of seniority have different levels ofrisk and that their prices should bear a different relation-ship to fundamentals. Bonds typically have senior status,while the legal status of bank loans is more variable. Thusthe conclusions from studies of the secondary market inbank loans may not carry over to the market in bonded debt.
The few extant studies of the market for developingcountry bonds are subject to other limitations. For instance,Cantor and Packer (1996) analyze the determinants ofspreads on sovereign bonds for 49 countries in 1995, relat-ing spreads to per capita income, GDP growth, inflation,the fiscal balance, the external balance, and external debt,to indicators of economic development and default his-tory, and to the average of Moody’s and Standard & Poor’scountry credit ratings. Limitations of this study include thefact that it considers developed as well as developing coun-tries, that it analyzes only sovereign bonds and not also pri-vate issues, and that none of the macroeconomic variablesis statistically significant when credit ratings are included.Cline (1995) limits his consideration to developing coun-tries and includes corporate as well as government bor-
rowers. However, he studies only highly indebted countries,whose representativeness may be questioned, and he con-siders only four economic determinants of interest ratespreads: inflation, per capita income, export growth, andGDP growth (along with dummy variables for private issuesand participation in Brady plan debt reduction schemes).Because his sample ends with the second quarter of 1993,he has only 92 bond issues, and some of his estimates arefor just 68 bonds. Of his four economic variables only exportgrowth and GDP growth differ significantly from zero atstandard confidence levels. A follow-up study just publishedat the time of writing (Cline and Barnes 1997) uses morerecent data and a somewhat longer list of explanatory vari-ables but is otherwise subject to many of these same limi-tations. In addition, it uses data for selected WesternEuropean borrowers as well as emerging markets, raisingquestions about the homogeneity of the sample.
Eichengreen and Portes (1989) analyze a larger sampleof 375 international bonds issued in the 1920s, the last timebond markets were a leading vehicle for international lend-ing. But the fact that their sample includes both develop-ing and advanced industrial countries and that theinformation and regulatory structure of the market haschanged over time limits the relevance of this study forpresent purposes. Edwards (1986) analyzes bond spreadsin 1976–80, but since there did not then exist an active mar-ket in developing country debt he has data for only 13 coun-tries and 167 bonds. And it is not clear that we should expectpricing performance to remain the same over time.2 Newinvestors have entered the market since the period Edwardsanalyzes: while banks held fully 97 percent of all emergingmarket debt at the end of the 1980s, their share had fallento less than two thirds by the mid-1990s (Bernstein andPenicook 1996). New issuers entered as well.3
4
The Literature
5
Finally, a recent study by Kamin and Kleist (1997) employsa portion of the same data set utilized here. There analyzelaunch spreads on 304 bonds (and 358 syndicated bankloans) issued in the 1990s drawn from Euromoney’sBondware (and Loanware). In contrast to other work (suchas our’s), the only variables they add to the informationavailable from this source are the Moody’s and Standard& Poor’s country credit rating (as a summary measure ofthe macroeconomics determinants of country creditworthiness) and industrial country interest rates (as ameasure of international financial conditions). Aftercontrolling for these variables and adding time trends andMexican crisis dummies, they find that Latin Americanspreads are on average 39 percent higher than otherwisecomparable Asian issues. Surprisingly, they find that thecoefficient on industrial country interest rates tends to besignificantly negative or else insignificantly different fromzero, but never positive.
The fact that country participation in the bond markethas risen over time suggests that ordinary-least-squaresestimates of the relationship between spreads and country
characteristics will suffer from selectivity bias. The samechanges in economic and financial conditions that affectthe price of issues can also affect the decision to enter themarket. Bond traders often remark that a rise in U.S.Treasury rates raises spreads on developing country bondsless than proportionately, for example, because high-riskborrowers are discouraged from coming to the market.Focusing exclusively on the determinants of the pricingdecision to the neglect of the impact of those same factorson the decision to enter the market may therefore be asource of selectivity bias. In the next sections we employa data set and methodology designed to ameliorate theseproblems.
Notes
1. See Hajivassiliou (1989) and Huizinga (1989) for exam-ples and surveys of the literature.
2. As emphasized in the introduction to our paper. 3. Potentially accentuating the tradeoff between portfolio diver-
sification and information acquisition emphasized by Calvo andMendoza (1995).

6
The bonds we study are fixed income securities witha specified maturity, face value and coupon.1 Theyare placed on international markets; while issued
by emerging market borrowers, they are denominated indeveloped country currencies (nearly always in U.S. dol-lars). Although the bulk of this market consists of bondsplaced in the Euromarkets (mainly the Eurodollar mar-ket), over our sample period a growing number of coun-tries floated bonds on the U.S. public market for foreignissuers (the Yankee market) and the U.S. private place-ment market (under provisions of Rule 144a); there wasalso some growth in issues denominated in deutche marksand yen. The bonds are typically underwritten by a syn-dicate of investment banks who commit to placing themwith investors. After placement they trade on the sec-ondary market and may be listed on an exchange.
The Bonds: Numbers, Spreads, and Issuers
Our data are initial offer or “launch” spreads for the bondsoffered between January 1991 and December 1996 by 37countries, obtained from Euromoney Bondware. Thatthey are launch spreads is important. Figure 2 showsthat launch spreads move differently over time thanspreads on the secondary markets. While there is sometendency for primary spreads to follow secondary spreadsby a lag of three or four quarters; the two series frequentlydiverge. In poor market conditions, when secondaryspreads rise, primary spreads do not rise proportionately;indeed, sometimes they fall. This reflects the tendencyfor the number of issues to fall and for only the most cred-itworthy borrowers to remain in the market. In otherwords, factors which increase the perceived risk of emerg-ing market debt, while raising secondary market spreads,
may have the opposite effect on launch spreads insofaras riskier borrowers are rationed out of the market, leav-ing only low-risk, low-spread borrowers to launch newissues. This makes it important to control for the likeli-hood of new issues by different classes of borrowers.
Our source provides data for 1,489 bonds during1991–96 (table 2). Of these, 884 were issued during1994–95 and 605 were issued in 1996. We were unableto use all the issues for 1996 because in many cases ancil-lary information on country conditions was not yet avail-able. Our principal results are therefore based on datafor 1991 through 1995, for which we have 863 usablebonds. At this stage, we have ancillary data for 135 bonds
Data and Sample Characteristics
FIGURE 2Primary (contemporary) versus secondary spreads(moved three quarters forward)
0
50
100
150
200
250
300
350
400
450
500
1996Q4
1996Q1
1995Q1
1994Q1
1993Q1
1992Q1
1991Q1
0
200
400
600
800
1000
1200
1400
1600
1800
Primary spread
Secondarymarket spread
U.S. interest rate(percent)
Secondary spreads(basis points)
Source: Euromoney Bondware.

7
issued in 1996, which can be used for stability tests andout-of-sample forecasting.
Accounting as it does for just under half the bonds issued,Latin America dominates table 2. Argentina, Brazil, andMexico were the main issuers from Latin America. In 1995,however, when market entry was difficult, East Asia issuedmore bonds than Latin America. And in 1996 the numberof East Asian issues grew rapidly, outstripping Latin Americanissues by a wide margin. Among other regions, EasternEurope has been the only significant issuer, again withconsiderable growth in 1996.
Raw spreads are consistently higher in Latin America thanelsewhere. The simple average shows that Latin spreads var-ied from a low of 339 basis points in 1991 to a high of 409basis points in 1996 (table 3). In contrast, East Asian spreadsaveraged less than 200 basis points. That said, there is con-
siderable variation within East Asia—the standard devia-tion of spreads relative to the mean is typically higher forEast Asia than Latin America. It does appear that averagespreads for the two regions moved in the same directionfrom year to year, except in 1995, in the wake of the Mexicancrisis, when Latin spreads rose and Asian spreads fell.2
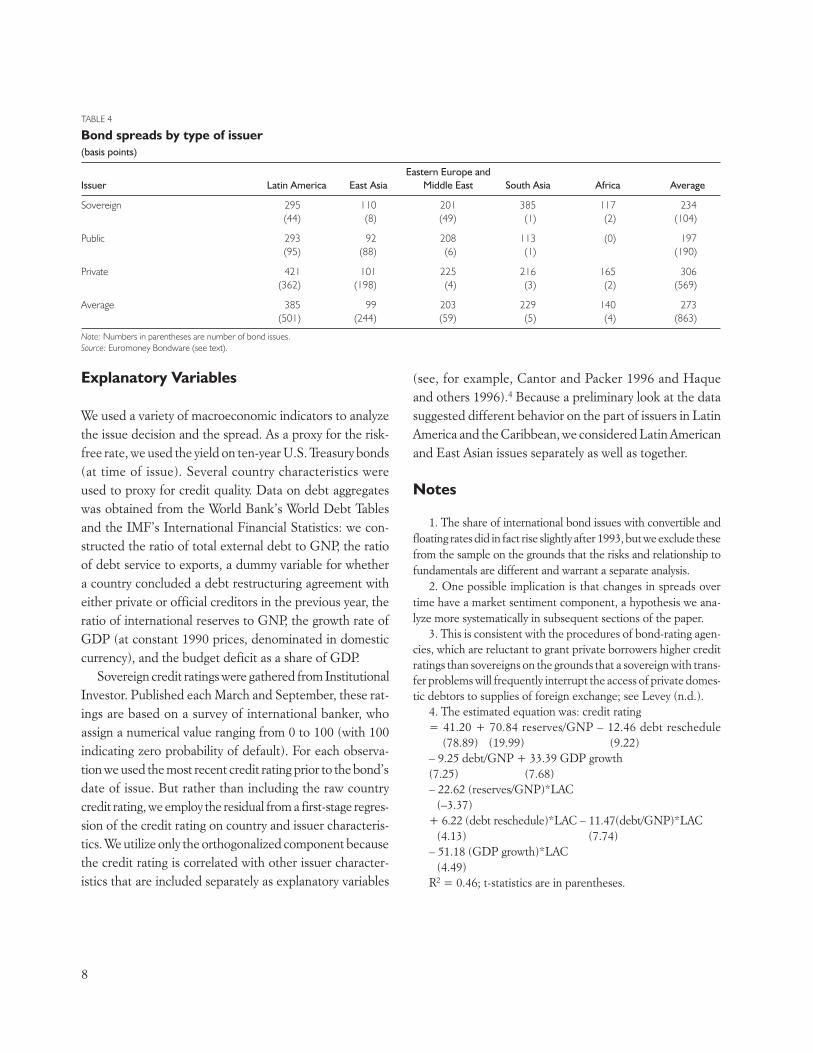
Table 4 summarizes sample characteristics by type ofissuer. Three categories are distinguished: sovereign, otherpublic, and private. Most of the issues are by private bor-rowers, although public agencies in East Asia have a rela-tively high propensity to issue bonds. Sovereign issuesdominate in Eastern Europe and the Middle East. We wouldexpect private issues to carry higher spreads, reflecting thebenchmark status of public issues and private bonds’ greaterperceived riskiness.3 The simple averages for Latin Americaand Africa confirm this presumption.
TABLE 3
Bond spreads, 1991–96(basis points)
Region 1991 1992 1993 1994 1995 1996
Latin America 339 399 408 346 405 409East Asia 54 83 116 107 83 127Eastern Europe and Middle East 300 231 189 162 298 148South Asia 263 93Africa 132 165Average 247 331 322 230 214 260
Note: A blank cell indicates that no bonds were issued in that year. Spreads are calculated by calculating the yield to maturity using the market price at the time of issue, then sub-tracting the yield on sovereign securities of the same currency and maturity.Source: Euromoney Bondware (see text).
TABLE 2
Bonds issued and usable for analysis, 1991–96Eastern Europe and
Year Latin America East Asia Middle East South Asia Africa Total
1991 Usable 29 14 1 0 0 44Issued 29 15 2 0 0 46
1992 Usable 74 18 5 0 0 97Issued 74 18 6 0 0 98
1993 Usable 217 73 27 0 0 317Issued 219 73 28 0 0 320
1994 Usable 132 114 17 4 3 270Issued 134 116 20 4 4 278
1995 Usable 49 75 9 1 1 135Issued 49 80 11 1 1 142
1996 Usable 69 62 4 0 0 135Issued 209 327 48 15 6 605
Total Usable 570 356 63 5 4 998Issued 714 629 115 20 11 1489
Source: Euromoney Bondware (see text).
8
Explanatory Variables
We used a variety of macroeconomic indicators to analyzethe issue decision and the spread. As a proxy for the risk-free rate, we used the yield on ten-year U.S. Treasury bonds(at time of issue). Several country characteristics wereused to proxy for credit quality. Data on debt aggregateswas obtained from the World Bank’s World Debt Tablesand the IMF’s International Financial Statistics: we con-structed the ratio of total external debt to GNP, the ratioof debt service to exports, a dummy variable for whethera country concluded a debt restructuring agreement witheither private or official creditors in the previous year, theratio of international reserves to GNP, the growth rate ofGDP (at constant 1990 prices, denominated in domesticcurrency), and the budget deficit as a share of GDP.
Sovereign credit ratings were gathered from InstitutionalInvestor. Published each March and September, these rat-ings are based on a survey of international banker, whoassign a numerical value ranging from 0 to 100 (with 100indicating zero probability of default). For each observa-tion we used the most recent credit rating prior to the bond’sdate of issue. But rather than including the raw countrycredit rating, we employ the residual from a first-stage regres-sion of the credit rating on country and issuer characteris-tics. We utilize only the orthogonalized component becausethe credit rating is correlated with other issuer character-istics that are included separately as explanatory variables
(see, for example, Cantor and Packer 1996 and Haqueand others 1996).4 Because a preliminary look at the datasuggested different behavior on the part of issuers in LatinAmerica and the Caribbean, we considered Latin Americanand East Asian issues separately as well as together.
Notes
1. The share of international bond issues with convertible andfloating rates did in fact rise slightly after 1993, but we exclude thesefrom the sample on the grounds that the risks and relationship tofundamentals are different and warrant a separate analysis.
2. One possible implication is that changes in spreads overtime have a market sentiment component, a hypothesis we ana-lyze more systematically in subsequent sections of the paper.
3. This is consistent with the procedures of bond-rating agen-cies, which are reluctant to grant private borrowers higher creditratings than sovereigns on the grounds that a sovereign with trans-fer problems will frequently interrupt the access of private domes-tic debtors to supplies of foreign exchange; see Levey (n.d.).
4. The estimated equation was: credit rating= 41.20 + 70.84 reserves/GNP – 12.46 debt reschedule
(78.89) (19.99) (9.22) – 9.25 debt/GNP + 33.39 GDP growth(7.25) (7.68)– 22.62 (reserves/GNP)*LAC
(–3.37)+ 6.22 (debt reschedule)*LAC – 11.47(debt/GNP)*LAC
(4.13) (7.74)– 51.18 (GDP growth)*LAC
(4.49)R2 = 0.46; t-statistics are in parentheses.
TABLE 4
Bond spreads by type of issuer(basis points)
Eastern Europe andIssuer Latin America East Asia Middle East South Asia Africa Average
Sovereign 295 110 201 385 117 234(44) (8) (49) (1) (2) (104)
Public 293 92 208 113 (0) 197(95) (88) (6) (1) (190)
Private 421 101 225 216 165 306(362) (198) (4) (3) (2) (569)
Average 385 99 203 229 140 273(501) (244) (59) (5) (4) (863)
Note: Numbers in parentheses are number of bond issues.Source: Euromoney Bondware (see text).

9
Astandard model of spreads is a linear relationshipof the form:
(1) log (spread) = f X’ + u2
where the dependent variable is the logarithm of thespread, X is a vector of issue and issuer characteristics,and u2 is a random error. X comprises bond characteris-tics (the maturity of the bond, principal amount, andwhether it was privately placed); global economic condi-tions proxied by the ten-year rate on U.S. treasuries; issuercharacteristics like the region of the borrower and whetherthe borrower is sovereign, other public, or private; andcountry characteristics like the sovereign credit rating resid-ual, the ratio of debt to GDP, the ratio of debt service to
exports, a dummy variable if the country underwent adebt restructuring in the previous year, and the GDPgrowth rate.
In practice, the conditions under which this linear rela-tionship provides an unbiased estimate of the relationship ofissuer characteristics to spreads may not be met, for not allpotential issuers will be in the sample at all points in time. Thespread and its relationship to issue and issuer characteristicswill be observed only when positive decisions to borrow andlend are made. We assume that spreads are observed whena latent variable b crosses a threshold ß’ defined by:
(2) ß’ = gX’ + u2
where X ’ is the vector of variables that determines thedesire of borrowers to borrow and willingness of lenders
Specification and Estimation
TABLE 5
Descriptive statistics of issuers (is = 1) and non-issuers (is = 0), 1991–96All Latin America
regions and East Asia Latin America East Asiais=1 is=0 is=1 is=0 is=1 is=0 is=1 is=0
Spread 278 284 389 116Amount 596 448 271 730Maturity 5.12 4.95 4.41 5.81Private placement 0.43 0.43 0.44 0.40U.S. Treasury rate 6.64 6.88 6.65 6.90 6.55 6.90 6.79 6.91Credit rating 45.1 39.3 45.3 42.3 34.9 30.5 61.9 62.4Credit rating residual 5.32 –1.02 5.78 1.90 1.56 –1.16 12.5 7.91Debt/GNP 0.33 0.45 0.32 0.54 0.37 0.62 0.24 0.35Dummy for debt rescheduling 0.25 0.13 0.26 0.20 0.40 0.29 0.03 0.07Debt service/exports 0.23 0.17 0.23 0.20 0.31 0.22 0.11 0.14GDP growth 0.016 0.010 0.017 0.013 0.010 0.010 0.027 0.017Reserves/GNP 0.10 0.13 0.10 0.16 0.07 0.10 0.16 0.26Deficit/GDP –0.003 –0.014 0.001 0.002 –0.005 0.029 0.011 0.015Latin AmericaPublic 0.21 0.33 0.22 0.33 0.18 0.34 0.27 0.31Private 0.66 0.32 0.70 0.29 0.70 0.31 0.70 0.27
Source: Author’s computations (see data appendix).

10
to lend (which we refer to as determinants of bond sup-ply and demand, respectively) and u2 is a second error term.If the error terms are bivariate normal with standard devi-ations s1 and s2 and covariance s12
2 (where p2 = s122/s1s2),
this is a standard sample selection model, a la Heckman(1979). The model can be identified by the nonlinearityof the fitted probabilities in the selection equation and bythe inclusion of elements in X’ that are not also in X.1
Estimating the probit requires information on those whodid not issue bonds. To address this problem we used thefollowing approach. For each country we allowed for threetypes of issuers: sovereign, public, and private. For eachquarter and country where one of these issuer types didnot come to the market, we recorded a zero. Table 5 high-lights the characteristics of issuers (is = 1) relative to non-issuers (is = 0). It suggests, plausibly, that issues are morelikely when U.S. interest rates are low, when the borroweris of better quality credit (with lower debt and a smaller
budget deficit), and when reserves are low (creating a pub-lic sector demand for foreign funds).
We estimate equations (1) and (2) jointly using maxi-mum likelihood. Implemented with the full sample, themaximum-likelihood estimates converge nicely. When per-forming the sensitivity tests using smaller samples, the fullmaximum-likelihood estimates do not always converge; inthis case we perform the conventional two-step proce-dure, first estimating a maximum-likelihood probit modeland then a regression using the estimated Inverse MillsRatio (with full-information standard errors). Where esti-mates are obtained using both procedures, we find littledifference in the results.
Note
1. Ozler and Huizinga (1992) estimate a similar model on
data for the secondary market prices of bank loans.

11
Table 6 reports the estimates for the determinantsof the spreads and table 7 reports the probit forthe determinants of the issue decision. The coef-
ficients for the probit in table 7—and elsewhere in this
paper—are normalized to the partial derivative of theprobability distribution function with respect to a smallchange in the independent variable evaluated at averagevalues of the independent variables to facilitate interpre-
Results
TABLE 6
Determinants of spreads, 1991–95All Latin America
regions and East Asia Latin America East Asia
Log amount –0.047 –0.057 –0.023 –0.069(–3.16) (–3.58) (–1.03) (–3.37)
Maturity 0.017 0.018 –0.013 0.05(3.19) (2.99) (–1.81) (6.17)
Private placement 0.09 0.09 0.13 –0.004(2.60) (2.65) (3.53) (–0.069)
Log of U.S. Treasury rate –0.32 –0.39 –0.013 –0.47(–1.72) (–2.28) (–0.072) (–0.069)
Credit rating residual –0.030 –0.027 –0.023 –0.027(–11.46) (–11.49) (–6.11) (–8.47)
Debt/GNP 0.60 0.49 1.37 –1.99(2.87) (2.48) (4.19) (–4.11)
Dummy for debt rescheduling 0.24 0.27 0.24 0.69(5.47) (5.94) (5.55) (4.12)
Debt service/exports 1.66 1.24 –0.11 7.13(6.26) (4.31) (0.24) (5.99)
GDP growth –0.40 –0.27 1.96 –1.07(–1.42) (–0.80) (2.84) (–2.91)
Israel –2.05(–12.71)
Latin America 0.49 0.68(7.65) (8.42)
Public –0.13 0.009 –0.024 0.24(–1.82) (0.10) (–0.31) (1.07)
Private 0.068 0.22 0.26 0.54(0.71) (2.02) (3.51) (2.20)
Constant 5.29 5.29 5.34 4.94(16.73) (16.24) (10.65) (9.48)
Rho –0.20 –0.10 –0.46 0.22Lambda –0.09 –0.05 –0.19 0.10
(–0.81) (–0.59) (–32.3) (0.81)Number of bonds 863 795 495 294Number of observations 2197 1587 889 577
Note: Numbers in parentheses are t-statistics.Source: Authors’ computations (see data appendix).

12
tation of the coefficients. We report separate equationsfor the full data set and for the Latin American andCaribbean (henceforth referred to as Latin America) andEast Asian subsamples.
Interpretation of Coefficients
Most of the coefficients are intuitively signed and well deter-mined. The coefficient on issue amount indicates that largerissues command smaller spreads (consistent with the exis-tence of economies of marketing and distribution and thegreater liquidity of larger issues on the secondary market).Private placements enter the spreads equation with a pos-itive sign (except in East Asia), consistent with the factthat these bonds are issued in markets with less stringentdisclosure requirements. Disclosure requirements for pri-vate placements are less stringent because trading in thosebonds is restricted to “qualified investors” (that is, investorscapable of managing the associated risk). Because the pri-vate placement market is narrower in terms and becauseinformation on issuer characteristics may be somewhatless complete, the presumption is that purchasers of bondsplaced in that market will demand a higher spread. Inaddition, there is a large negative coefficient in the spreadsequation on the dummy variable for Israel, reflecting thefact that its issues are guaranteed by the U.S. government.
For variables that appear in both the issue and spreadsequations, it is useful to ask whether they work in the sameor opposing directions, for this leads to an intuitive inter-pretation in terms of supply and demand.1 Consider theregressions on the full sample of bonds. There, a largercredit rating residual (a better credit rating, other thingsequal) increases the probability of an issue and reducesthe spread, as if countries are penalized for inferior creditratings by finding it both more difficult and more costly toborrow. Similarly, a higher debt/GNP ratio both reducesthe probability of an issue and increases the spread. Debtrescheduling works the other way around—it has a weakpositive effect on the probability of an issue (that is, thoserescheduling debt are apt to come to the capital marketquickly) while increasing the spread that successful issuersare forced to pay. The dummy variable for Latin Americabehaves similarly: other things equal, Latin American bor-rowers issue more bonds but pay higher spreads.
Our interpretation in terms of supply and demand is asfollows. Variables whose coefficients work in reinforcingdirections in the equations for issues and spreads are prox-ies for the demand for bonds. For example, the market isless inclined to demand the bonds of issuers with highdebt/GNP ratios; consequently, the probability of observ-ing an issue is less, and the corresponding decline in demandraises the spread on observed issues. The same interpreta-tion applies to the credit-rating residual: by diminishingmarket demand, an inferior credit rating reduces the prob-ability of an issue and raises the spread. Finally, althoughthe magnitude and the signficance of rho—the correlationcoefficient of the errors in the two equations—varies bytime period and sample, it is almost always negative. Theimplication is that unobserved factors that cause an issueto come to the market also lower the spread and should beinterpreted as unobserved determinants of demand.
In contrast, variables whose coefficients work in off-setting directions are proxies for the supply of bonds.For example, while countries which have recently resched-uled tend to have accumulated an unsatisfied appetitefor borrowing and therefore to supply additional newissues, the corresponding outward shift in the supplyreduces the price of their bonds, increasing the spread.Similarly, the Latin dummies suggest that Latin Americancountries have continent-specific characteristics, not oth-erwise quantified, that cause them to supply an unusu-ally high volume of bonds; this works, other things equal,to drive down the prices of their issues and increase thespreads they are charged.
The results confirm the importance of interest ratesin the major money centers as a determinant of capitalflows. A rise in U.S. interest rates is associated with alarge and statistically significant fall in the probability ofan issue while at the same time reducing spreads.2 Thecoefficient on the log treasury rate in the spreads equa-tion being on the order of one half, higher interest ratesin the money centers still raise interest rates on devel-oping country bonds, but less than proportionately. Whilethis result is surprising, it is robust.3 It suggests that, over-all, movements in U.S. Treasury rates should be inter-preted in terms of supply: as U.S. rates rise, a decliningnumber of emerging-country issuers come to the mar-ket. This decline in supply increases the price—equiva-

13
lently, reduces the spread—on their bonds. This is not todeny the existence of demand-side effects—that is, thetendency for investors to shift to emerging market debtin periods of low money-center rates as they search foryield—but to observe that supply-side effects having todo with the timing of the emerging economies’ issues (and
perhaps borrowers’ willingness to take them at any price)appear to dominate. As we descibe below, when we dis-aggregate by time period, we find that the other effect—the tendency for investors to shift into emerging marketdebt in periods of low money-center rates, seems to havebeen gaining importance over time.
TABLE 7
Determinants of the probability of a bond issue, 1991–95All Latin America and East Asia Latin America East Asia
Log of U.S. Treasury rate –0.731 –0.970 –0.999 –0.964(–5.33) (–4.39) (–5.87) (–4.39)
Credit rating residual 0.021 0.006 0.019 0.006(11.68) (1.39) (6.43) (1.39)
Debt/GNP –0.815 –0.827 –1.249 –0.823(–5.58) (–2.74) (–10.07) (–2.74)
Dummy for debt rescheduling 0.142 0.070 0.087 0.072(1.85) (0.58) (2.08) (0.58)
Debt service/exports 1.60 –0.520 0.030 –0.522(5.27) (–0.62) (0.11) (–0.62)
Reserves/GNP 1.24 –0.611 –2.63 –0.610(6.89) (–1.49) (–6.03) (–1.49)
Deficit/GDP 0.80 1.79 2.65 1.78(1.64) (2.35) (2.91) (2.35)
Public 0.064 0.574 0.219 0.580(0.214) (7.61) (3.85) (7.61)
Private 0.214 0.718 0.490 0.719(5.38) (10.34) (10.01) (10.34)
Latin America 0.90 0.656(2.96) (1.38)
Latin America interactions
U.S. Treasury rate –0.16 –0.27(–0.79) (0.10)
Credit rating residual –0.005 0.012(–1.55) (2.44)
Debt/GNP –0.30 –0.42(–1.63) (1.28)
Dummy for debt rescheduling –0.56 0.015(–0.69) (0.12)
Debt service/exports –1.57 0.56(3.94) (0.62)
Reserves/GNP –3.58 –2.01(–8.36) (–3.36)
Deficit/GDP 1.56 –0.85(1.65) (0.72)
Public 0.14 –0.37(2.00) (–4.19)
Private 0.27 –0.32(4.16) (–3.39)
Number of observations 2197 1587 1010 577Psuedo R2 0.374 0.392 0.489 0.347
Note: Numbers in parentheses are t-statistics.Source: Authors’ computations (see data appendix).

14
Sensitivity of the Results to Country Sample
The coefficients are sensitive to sample, which is not sur-prising given that we are analyzing a rapidly evolving mar-ket. An example is the influence of the debt/GNP anddebt service/export ratios, whose coefficients vary by regionand period considered. In table 7 the coefficient on thedebt stock is largest for the full sample and somewhat smallerwhen only Latin America and East Asia are considered, asif the sensitivity of spreads to debt is greatest outside theregions where bond issues are most prevalent. Also inter-esting is the fact that the sign of the debt/GNP ratio isnegative within both Latin America and East Asia. WithinLatin America that negative coefficient is driven by out-liers (seven private issues, one each from Bolivia and Jamaicaand five from Panama). When these observations aredropped the coefficient becomes positive, large, and highlysignificant. In contrast, the negative correlation betweenspreads and the debt stock within East Asia does not appearto be driven by a few outliers. Within East Asia, however,a rapid rate of GDP growth reduces spreads, an effect notevident in Latin America or the sample as a whole. In otherwords, within East Asia countries are not penalized by largerspreads when debt is high but growth is also fast, while inLatin America rapid growth does not compensate for heavyindebtedness.4 Note, too, that in the issue equation the pos-itive coefficient on the ratio of reserves to GNP in the fulldata set turns negative when the sample is limited to LatinAmerica and East Asia (and strongly so for Latin America),as if countries issue bonds in order to build up reserves.
A number of issue and issuer characteristics have notice-ably different effects in Latin America than East Asia. Thereis evidence of a well-behaved yield curve in East Asia butnot in Latin America, where the coefficient on maturity inthe spreads equation is if anything negative. Some of thesedifferences are interpretable in terms of our aggregate sup-ply–aggregate demand framework. For example, in LatinAmerica the credit rating residual has a larger impact on theprobability of a bond issue but a smaller effect on the spread,
as if the supply of Latin bonds is relatively elastic.5 Thedebt/GNP ratio and the U.S. Treasury rate similarly have alarger (in this case, negative) impact on the probability of anissue in Latin America but a smaller impact on the spread,again suggesting that they are supplied more elastically.
A basic message of our analysis, then, is that studies thatfail to disaggregate Latin American borrowers from borrowersin other parts of the world are likely to yield misleading results.
Notes
1. We invoke this interpretation sparingly and with caution, forin a market with imperfect information and enforcement, it is pos-sible for the demand to bend back and for movements along thatportion of the demand schedule to look like movements along asupply curve. (Note that we frame our discussion in terms of bondsupply and bond demand, not in terms of credit supply and creditdemand, as in textbook models of credit rationing. The distinc-tion is of only terminological importance, but the importance ofthe terminological distinction is great; it leads us to speak of abackward bending demand curve rather than a backward bend-ing supply curve.)
2. The point estimate suggests that a rise in U.S. Treasury yieldsof one percentage point from our sample average of 6.78 percentcan reduce the probability of issue almost 100 percent and thuslead to virtual closure of the emerging market bond issues. Asdiscussed below in the context of time-varying estimates, the coef-ficient for U.S. Treasury rates changes considerably over time,but it is uniformly negative.
3. And as noted above, it is also a finding a Kamin and Kleist(1997). Still, the exact size of this coefficient varies significantlyacross periods, as noted below.
4. An interesting instance of this variability is the sign of rho,the correlation of the error terms, which is negative for the fullsample, for Latin America and East Asia combined, and withinLatin America but positive within East Asia. Note that the signof rho and lambda (the Inverse Mills Ratio included in the spreadsequation to correct for selectivity) is always the same, since lambdais the product of rho and the standard error of the dependent vari-able.
5. We think of an improved credit rating as, other things beingsequal, shifting the demand for bonds to the right, which will affectthe quantity more than the price when the supply is relativelyelastic.

15
This section explores differences in issue and pric-ing decisions for private and nonprivate (sovereignand public agency) borrowers and changes over
time in these relationships.
Private and Nonprivate Borrowers
Table 8 disaggregates private from nonprivate borrowers,where the latter include sovereigns and public corporations.Unobserved characteristics influencing the probability ofan issue and observed launch spreads should be more impor-tant for private issuers than for public entities since sovereigncredit quality will depend, among other things, on observ-able macroeconomic variables like debt and debt serviceratios, while corporate credit quality will be a function offirm-specific determinants of expected future profitability,many of which are difficult to observe. We expect that theseunobserved characteristics of issuers will lead to a higherprobability of issue and to a lower spread (we expect rhoto be negative, in other words).
This expectation is confirmed. For private issues wesee a large negative correlation coefficient of error termsacross equations, which is statistically significant at the 5percent level in both the Latin American and East Asiansubsamples. Its magnitude is similar in the two subsam-ples (–0.56 for Latin America and –0.53 for East Asia).Our expectation that unobserved characteristics should beless influential in the subsample of public issues finds mixedsupport. While it is confirmed for East Asia, the story forLatin America is more complex. Our initial regressions onthe Latin America subsample produced a strong negativecorrelation coefficient for the error terms in the two equa-tions. Sensitivity analysis suggests that this effect reflectsthe influence of the observations for Venezuela and the
observations for 1994. Although the prediction of our basicequation is that a country with its macroeconomic char-acteristics has a relatively low probability of issue, Venezuelahad a substantial number of public issues that were moreaggressively priced than predicted by our spreads equa-tion. (We conjecture that this reflects other macroeconomiccharacteristics not controlled for in the basic regression,such as the importance of petroleum production, whichwould work to both increase ease of borrowing and lowerthe spread.) Similarly, the number of public issues wassignificantly higher than predicted in 1994, when spreadswere unusually low. If we add a dummy variable for 1994,its sign is negative and its coefficient is significant at the10 percent level. The correlation of error terms across equa-tions then falls to -0.44, lower than the correlation coeffi-cient for private issues but still higher than that for publicissues in East Asia.
Behavior Over Time
To explore what is driving changes over time, we esti-mated rolling regressions for successive ten-quarter peri-ods (table 9). In the equation for spreads, several of thecoefficients are strikingly stable. The coefficient on thecredit-rating residual remains in the 0.02–0.03 rangethroughout, and that on the debt-rescheduling variableis consistently between 0.2 and 0.4. In contrast, the coef-ficients on the debt/GNP and debt service/export ratiosvary considerably. Their combined influence generallygrows over time, although the sum of the coefficients islargest between the second quarter of 1993 and the thirdquarter of 1995. The influence of debt service also appearsto rise relative to that of the debt stock. This trend reflectstwo factors: the growing presence of East Asian issuers
Disaggregation and Sensitivity Analysis

16
in the market (since we know from our separate regres-sions for Latin America and East Asia that debt servicehas a more important influence on spreads in the secondof these two regions) and the increasing magnitude of thedebt service coefficient within Latin America over time.The quantitative effect of the debt service variable isimportant: given a coefficient in the nieghborhood ofunity, an increase in the debt service/export ratio of 20percentage points raises spreads by more than 20 percent.
The coefficient on the U.S. interest rate in the spreadsequation is negative for 14 of the 15 subperiods. Its abso-lute value is at least 0.3 in eight. However, there is con-siderable variation in the size of the coefficient. It is revealingto compare the coefficient on the U.S. Treasury rate inthe spreads equation with the same coefficient in the issueequation. In the earlier subperiods, the U.S. Treasury ratehas a negative effect on the issue decision (higher money-center rates reduce the probability of an issue), and emerg-
TABLE 8
Public and private bond issues in Latin America and East AsiaLatin America East Asia
Nonprivatea Private Nonprivate Private
SpreadsLog amount 0.056 –0.097 –0.068 –0.074
(1.52) (–2.92) (–1.86) (–2.98)Maturity 0.000 –0.016 0.05 0.06
(0.049) (–1.55) (3.88) (4.33)Private placement 0.19 0.11 0.09 –0.03
(2.24) (2.72) (0.88) (–0.45)Log of U.S. Treasury rate 0.18 –0.33 –0.24 –0.15
(0.48) (–1.43) (–0.51) (–0.47)Credit rating residual –0.043 –0.005 –0.033 –0.031
(–3.97) (–1.08) (–5.74) (–9.13)Debt/GNP 1.67 –0.69 –1.38 –2.19
(1.81) (–1.38) (–1.67) (–3.63)Dummy for debt rescheduling 0.29 0.11 0.85 0.60
(3.05) (1.87) (3.09) (2.59)Debt service/exports –1.56 –0.87 4.35 9.37
(–1.41) (–1.69) (2.16) (6.35)GDP growth –0.72 2.42 –0.65 –1.13
(–0.51) (2.88) (–0.88) (–2.69)1994 dummy –0.22
(–1.79)Constant 4.91 7.48 5.06 4.95
(4.76) (13.31) (5.38) (8.03)Rho –0.45 –0.56 –0.13 –0.53
ProbitLog of U.S. Treasury rate –0.44 –0.82 –1.14 –0.24
(–3.08) (–4.07) (–4.90) (–0.93)Credit rating residual 0.014 0.009 –0.005 0.015
(5.87) (2.76) (–1.15) (3.08)Debt/GNP –0.80 –1.17 –0.40 –0.76
(–5.34) (–8.66) (–1.22) (–2.22)Dummy for debt rescheduling 0.047 0.10 –0.065 0.16
(1.31) (2.12) (–0.56) (0.87)Debt service/exports –0.001 –0.06 –1.02 –0.09
(–0.002) (–0.05) (–1.13) (–0.09)Reserves/GNP –1.71 –3.58 –1.57 0.51
(–4.78) (–6.42) (–3.63) (1.07)Deficit/GDP 1.79 3.82 1.59 1.48
(2.22) (3.45) (1.61) (1.80)
Note: Probit coefficients are the partial derivatives of the distribution function at the mean values of the independent variables.a. Does not include Venezuela (see text).Source: Authors’ computations (see data appendix).

17
ing market spreads are compressed when U.S. rates rise.In the most recent subperiods, in contrast, the treasury-rate coefficient is positive in the issue equation, althoughit retains its negative sign in the spreads equation. By ourprevious interpretation, in the early part of the decade themain effect of falling U.S Treasury rates was to draw moredeveloping country borrowers into the market, while inmore recent years their main effects was to attract moreforeign investors. Explaining this difference is not straight-forward, although we conjecture that it reflects the effectsof the Mexican crisis, in whose immediate aftermath newissues fell off despite the fact that U.S. Treasury rateswere declining, after which the backlog of potential new
issues was released despite the fact that U.S. Treasury rateshad begun to rise.
The correlation coefficient for the error terms in the twoequations declines in absolute value over time. This suggeststhat the importance of unobservable attributes of borrowersthat increase the probability of an issue while reducing thespread has tended to diminish over time. A well-definedyield curve appears to emerge gradually, with the positive coef-ficient on maturity progressively gaining significance. Thereis also growing evidence of emerging economies of scale(reflecting marketing costs or trading-depth effects); the coef-ficient on issue amount, which is essentially zero at the startof the sample, becomes significantly negative over time.
TABLE 9
Rolling regressions Spreads Probit
Log of Log ofLog U.S. Treasury Credit Debt Debt Debt Latin U.S. Treasury
Period amount Maturity rate rating stock reschedule service America Rho rate
1991Q1–1993Q2 0.03 –0.009 –0.33 –0.03 0.62 0.32 0.08 0.69 –0.91 –1.301991Q2–1993Q3 0.01 –0.016 –0.21 –0.03 0.56 0.29 –0.11 0.74 –0.83 –1.541991Q3–1993Q4 –0.02 –0.007 –0.08 –0.03 0.93 0.22 0.60 0.60 –0.74 –1.831991Q4–1994Q1 –0.02 0.000 0.17 –0.03 1.40 0.30 –0.07 0.63 –0.59 –1.951992Q1–1994Q2 –0.03 0.005 –0.10 –0.02 1.20 0.32 –0.01 0.72 –0.36 –1.651992Q2–1994Q3 –0.06 0.018 –0.32 –0.02 0.61 0.32 0.60 0.74 –0.03 –1.191992Q3–1994Q4 –0.05 0.023 –0.28 –0.02 0.40 0.35 1.03 0.73 0.23 –0.511992Q4–1995Q1 –0.05 0.025 –0.34 –0.03 0.34 0.36 1.31 0.68 0.22 –0.671993Q1–1995Q2 –0.06 0.026 –0.30 –0.03 0.47 0.38 1.36 0.62 0.05 –0.521993Q2–1995Q3 –0.06 0.025 –0.25 –0.03 0.60 0.32 1.41 0.61 –0.09 –0.561993Q3–1995Q4 –0.07 0.024 –0.19 –0.03 0.70 0.24 1.60 0.57 –0.29 –0.231993Q4–1996Q1 –0.07 0.030 –0.33 –0.03 0.57 0.20 1.89 0.55 –0.26 –0.171994Q1–1996Q2 –0.09 0.041 –0.40 –0.03 0.34 0.28 1.49 0.70 –0.21 0.321994Q2–1996Q3 –0.09 0.044 –0.90 –0.03 0.48 0.26 0.80 0.93 –0.40 0.971994Q3–1996Q4 –0.10 0.038 –0.76 –0.03 0.41 0.26 1.02 0.85 –0.23 1.00
Note: The coefficients reported in the final column are estimated using the “dprobit” command in STATA and represent the change in the probability of an issue on account of asmall change in the U.S. Treasury rate at the average value of the independent variables.Source: Authors’ computations (see data appendix).

18
Acentral question in the literature on capital flowsto emerging markets is whether changes in spreadsare explicable by changes in fundamentals or
whether there have been changes in pricing behavior overtime. If lower debt and debt service ratios, faster growthrates, and fewer restructurings can explain the reductionsin spreads that occurred between 1995 and 1997, then theremay be reason to be relatively sanguine about the market’spricing behavior and, for that matter, about the sustain-ability of capital flows. If, on the other hand, recent capi-tal inflows were encouraged by a not otherwise explicableshift in pricing behavior, then there is no a priori reason torule out a sudden and equally dramatic shift back and a cor-responding curtailment of flows.
The change in spreads between two periods, denotedS1 – S2, can be expressed as follows:
(3) S1 – S2 = ß1X1 – ß2 X 2
Adding and subtracting ß1X2 and rearranging, one obtainsthe familiar Oxaca decomposition:
(4) S1 – S2 = ß1(X1 – X2) + X2(ß1 – ß2)
The first term on the right-hand side of equation (4) is thecontribution to the change in spreads of the change in theireconomic determinants (X1 – X2); this can be thought of asthe contribution of the change in fundamentals. The secondterm is the contribution of the change in coefficients (ß1 –ß2). This can be thought of as the contribution of changesin market sentiment—in the way the markets regard the creditworthiness of countries with given characteristics.
To aid interpretation, we further break these two effectsinto subcategories. Among changes in sentiments, we dis-
tinguish the impact on spreads of changes in the constantterm (C1 – C2), which can be thought of as blanket changesin sentiment as emerging market bonds come into or fallout of favor, from the impact on spreads of changes in thecoefficients on the independent variables [X2(ß1 – ß2)],which can be thought of as changes in sentiment towardcountries with given macroeconomic characteristics (as, forexample, the issues of relatively risky borrowers come tobe regarded as more attractive). Similarly, we distinguishchanges between periods due to changes in the averagevalue of the Inverse Mills Ratio (which can be thought ofas a measure of sample selectivity) versus changes in theaverage value of the other variables. Finally, we distinguishchanges in the effect of a given level of the Inverse MillsRatio on spreads (which can be thought of as the impacton spreads of having in the sample an issue that our selec-tion equation predicts should not be included) from changesin the effect of other regressors. Intuitively, a rising coeffi-cient on the Inverse Mills Ratio suggests that the market isgrowing more discriminating.
Note that when the spread in the first period is largerthan in the second (spreads are falling), a positive changein log spread is recorded in table 10. The first three columnsshow that launch spreads declined following the Mexicancrisis. That decline was especially sharp in 1995, when onlyhigh quality issues were brought to the market. (Recallthat secondary spreads skyrocketed in 1995. That shift insentiment against developing countries is reflected in issuebehavior, as discussed below.)
The change in mean value of the dependent variable islarger than can be explained by the changes in the mean val-ues of the independent variables (the X’s) alone. To be sure,improved country characteristics contributed to the declinein spreads (the quality of issuers improved, especially in 1995
Changes in Spreads Over Time:The Contribution of Fundamentals and Sentiment

19
as noted above). But the share of the change attributable tothe X’s is only a fraction of the total. While the contributionof the changes in b‘s is also small, this is misleading in somesense because several large offsetting changes occur. The sizeof the constant term increases enormously, indicating a gen-eral shift in sentiment against developing countries. (Recallthat a negative sign implies an increase.) Thus, even thoughaverage launch spreads were low in 1995 because low-qual-ity borrowers do not come to the market, the large constantterm mirrors the high secondary market spreads. A substantialpart of this shift in sentiment is, however, negated by spreadcompression relative U.S. Treasury rates (as the coefficient
on the U.S. interest rate moves in the other direction fromthe constant term). The combined effect was to reduce thepremium paid by poorer credit risks.
In 1996 we see shifts in the opposite direction. Relativeto 1995, observed primary spreads rise, as do the meansof variables associated with higher spreads. At the sametime, overall market sentiment (as summarized by theconstant) improves. Once again, this shift in market sen-timent is moderated by two offsetting factors: the reducedsensitivity of spreads to changes in U.S. interest rates,and a higher premium on the poorer risks entering themarket.
TABLE 10
Oxaca decompositions, various subperiods1991Q1–1993Q4 1991Q1–1994Q3 1991Q1–1994Q3 1995Q1–1995Q4
to1994Q4–1996Q4 to1994Q4–1996Q4 to 1995Q1–1995Q4 to 1996Q1–1996Q4
Log spread 0.39 0.28 0.54 –0.62Due to change inXs 0.23 0.23 0.46 –0.94ßs 0.16 0.05 0.08 0.32Constant –1.96 –1.51 –2.41 0.82Treasury rate coefficient 1.89 0.99 1.62 –0.64Inverse Mills Ratio –0.05 0.00 –0.05 –0.07
Source: Authors’ computations (see data appendix).
20
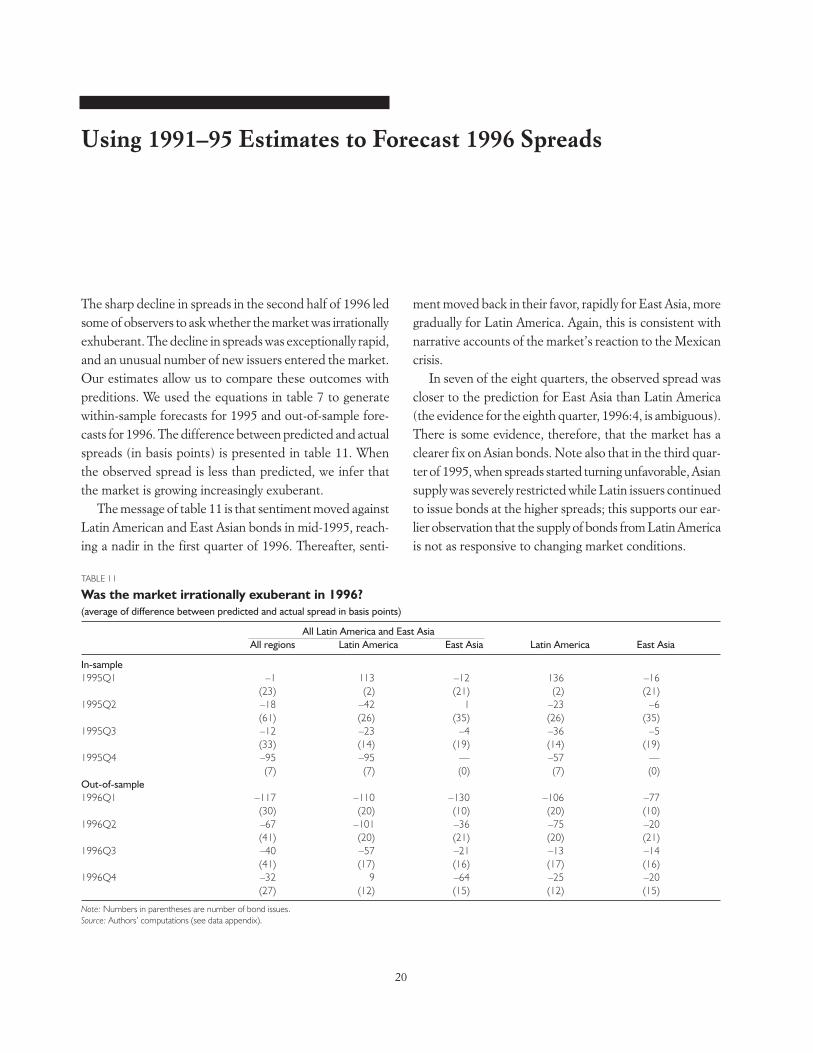
The sharp decline in spreads in the second half of 1996 ledsome of observers to ask whether the market was irrationallyexhuberant. The decline in spreads was exceptionally rapid,and an unusual number of new issuers entered the market.Our estimates allow us to compare these outcomes withpreditions. We used the equations in table 7 to generatewithin-sample forecasts for 1995 and out-of-sample fore-casts for 1996. The difference between predicted and actualspreads (in basis points) is presented in table 11. Whenthe observed spread is less than predicted, we infer thatthe market is growing increasingly exuberant.
The message of table 11 is that sentiment moved againstLatin American and East Asian bonds in mid-1995, reach-ing a nadir in the first quarter of 1996. Thereafter, senti-
ment moved back in their favor, rapidly for East Asia, moregradually for Latin America. Again, this is consistent withnarrative accounts of the market’s reaction to the Mexicancrisis.
In seven of the eight quarters, the observed spread wascloser to the prediction for East Asia than Latin America(the evidence for the eighth quarter, 1996:4, is ambiguous).There is some evidence, therefore, that the market has aclearer fix on Asian bonds. Note also that in the third quar-ter of 1995, when spreads started turning unfavorable, Asiansupply was severely restricted while Latin issuers continuedto issue bonds at the higher spreads; this supports our ear-lier observation that the supply of bonds from Latin Americais not as responsive to changing market conditions.
Using 1991–95 Estimates to Forecast 1996 Spreads
TABLE 11
Was the market irrationally exuberant in 1996?(average of difference between predicted and actual spread in basis points)
All Latin America and East AsiaAll regions Latin America East Asia Latin America East Asia
In-sample1995Q1 –1 113 –12 136 –16
(23) (2) (21) (2) (21)1995Q2 –18 –42 1 –23 –6
(61) (26) (35) (26) (35)1995Q3 –12 –23 –4 –36 –5
(33) (14) (19) (14) (19)1995Q4 –95 –95 — –57 —
(7) (7) (0) (7) (0)Out-of-sample1996Q1 –117 –110 –130 –106 –77
(30) (20) (10) (20) (10)1996Q2 –67 –101 –36 –75 –20
(41) (20) (21) (20) (21)1996Q3 –40 –57 –21 –13 –14
(41) (17) (16) (17) (16)1996Q4 –32 9 –64 –25 –20
(27) (12) (15) (12) (15)
Note: Numbers in parentheses are number of bond issues.Source: Authors’ computations (see data appendix).

21
In this paper we have studied the determinants of launchspreads on emerging market debt using a framework thataccounts for the joint determination of the issue and pric-ing decisions and controls for selectivity. Factors that increasethe probability of observing an issue and raise the spreadwe interpret in terms of the supply of bonds, while thosewhich increase the probability of an issue while reducingthe spread we interpret in terms of demand. The resultsconfirm the importance of both blades of the scissors. Butthe results for Latin America and East Asia are different,especially toward the beginning of the 1990s. For exam-ple, there is evidence that the supply of bonds by LatinAmerican issuers is less responsive to changing market con-ditions. There is some sign that the extent of this regionaldifferentiation has narrowed with time as the market hasgrown deeper. Other signs of a maturing market includethe appearance of a well-defined yield curve for LatinAmerica, evidence that borrowers are exploiting scaleeconomies when issuing bonds, and a smaller role for unob-servables common to the issue and spread equations.
Our most striking finding is that changes in marketsentiment not obviously related to fundamentals havemoved the market by large amounts over short periods.Changes in observable issuer characteristics and theresponsiveness of spreads and issues to those character-istics do not provide an adequate explanation for changesover time in the value of new bond issues and launch
spreads. In important periods, such as the wake of theMexican crisis, blanket shifts in sentiment play the dom-inant role.
The obvious implication for policy is that governmentsshould exercise caution when contemplating an economicpolicy strategy that relies on continuous inflows of foreigncapital intermediated by the international bond market.Large quantities of foreign credit may be available whensentiment shifts in their favor, but it can equally well shiftagainst them for reasons beyond their control, making itimpossible to finance large current account deficits andforcing a difficult adjustment. There is an argument forinsuring against the capriciousness of the bond market bydiversifying sources of international borrowing to includeforeign direct investment, equity investment, and syndi-cated bank loans. And it would be prudent to insure againstthe sudden evaporation of foreign financing and the sud-den appearance of a painful adjustment burden by takingsteps to limit the size of the current account deficit.
Most of the empirical work for this paper was done inthe first half of 1997, a period of large-scale bond issues byemerging market borrowers and dramatic spread com-pression. There were but a few voices in the wildernesswarning that this favorable state of affairs could come to asudden end at any time. In a sense, this was the centralprediction of our empirical work. It came true in the finalquarter of that year.
Conclusions and Implications

22
Bond Characteristics
The data cover a total of 883 bonds from 1991-1995 and605 bonds in 1996. The Euromoney Bondware data setincludes: (a) spreads (in basis points, where one basis pointis on-hundredth of a percentage point) over “risk-free” issuedenominated in the same currency and of about the samematurity; (b) the amount of the issue (millions of U.S. dol-lars); (c) the maturity in years; and (d) a dummy variabletaking the value 1 if the bond was “privately placed” andzero otherwise.
Issuer Characteristics
The following variables were constructed from Bondware.
S Sovereign P PrivateO Other
LAC Latin America and CarribeanECA Eastern Europe and Central AsiaAFR AfricaSAS South AsiaEAP East Asia and Pacific
Country Characteristics
edt total external debt (US$)gnp gross national product in current prices (US$)
reserves total foreign reserves minus gold (US$)gdp90 gross domestic product in 1990 prices and national
currency
gdpnc gross domestic product at current prices in nationalcurrency
gdp gross domestic product in current prices and denomnated in US$
deficit total budget deficit (national currency)dres indicator variable to denote whether a debt
rescheduling took place the previous yearedtgnp ratio : edt/gnpggdp90 gdp growth 0.25*ln[gdp90_t/gdp_{t-1}]defgdp deficit/gdpresgnp reserves/gnptdsxgs total external debt service/total exportstb10 yield of 10 years treasury bondcrtg credit rating
Reserves, gdp90, gdpnc, and deficit are reported quar-terly in the IMF’s International Financial Statistics. Wherequarterly data was not available, annual data were con-verted to quarterly figures by mutiplying the “log difference”by 1/4.
The two main sources for these variables were the WorldBank’s World Debt Tables (WBDT) and the IMF’sInternational Financial Statistics (IFS)
The exact series are:edt WBDT vol 2, series called “EDT”gnp WBDT vol 2, series called “GNP”tdsxgs WBDT vol 2, series classified under Topic 4. Debt
Indicatorsresimf IMF IFS, series number “1l.d”gdp90 IMF IFS, series number “99b.p”gdpnc IMF IFS, series number “99b”deficit IMF IFS, series number “80”
Data Appendix

23
dres WBDT vol 1, table A3.3 Multilateral debt relief agreements with official creditors, Jan 80–Jan 96,pp. 66–72 of the 1996 issue; table A4.4 Multilateraldebt relief agreements with commercial banks, Jan80–Dec 95, pp. 78–82 of the 1996 issue.
Credit ratings were obtained from Institutional Investor’sCountry Credit Ratings.
U.S. interest rates were obtained from the Bureau ofPublic Debt of the Department of Treasury.Web address:http://www.publicdebt.treas.gov/of/ofrt102.htm
Other specific sources included:
• IMF country desks for data on Argentina Hong Kong,Hungary, Israel, the Republic of Korea, Singapore,and South Africa.
• Brazil’s deficit/ratio was obtained from the Central Bankof Brazil, the Brazilian Ministry of Finance, and Garantiaas reported by Dornbusch in Brookings Papers onEconomic Activity 1:1997, table 5. page 387.
• Additional data for Hong Kong were obtained fromthe Quarterly Report of Gross Domestic ProductEstimates, published by the Census and StatisticsDepartment, Hong Kong, August 1997.
• Data for Taiwan (China) was obtained from theDecember 1996/January 1997 Balance of Paymentsof Taiwan District, the Republic of China, publishedby the Central Bank of China (Taiwan).
The economies included in the analysis are Argentina, Bahrain,Barbados, Bolivia, Brazil, Chile, China, Colombia, Costa Rica,Croatia, Czech Republic, Cyprus, Estonia, Ghana, HongKong, Hungary, India, Indonesia, Israel, Jamaica, Kazakhstan,Republic of Korea, Lebanon, Lithuania, Macao, Malaysia,Malta, Mexico, Morocco, Pakistan, Panama, Peru, Philippines,Poland, Qatar, Romania, Russia, Saudi Arabia, Singapore,Slovak Republic, South Africa, Taiwan (China), Thailand,Trinidad and Tobago, Tunisia, Turkey, Uruguay, and Venezuela.

24
Bernstein, Robert J., and John A. Penicook, Jr. 1996. “EmergingMarket Debt: Practical Portfolio Considerations.” Paperpresented to the New York University and SolomonBrothers Center conference on emerging market debt.
Calvo, Guillermo, and Enrique G. Mendoza. 1995.“Reflections on Mexico’s Balance-of-Payments Crisis:A Chronicle of a Death Foretold.” University of Maryland,College Park.
Cantor, Richard, and Frank Packer. 1994. “The Credit RatingIndustry.” Federal Reserve Bank of New York QuarterlyReview (Summer/Fall): 1–26.
Cantor, Richard, and Frank Packer. 1995. “Determinants andImpact of Sovereign Credit Ratings.” Federal Reserve Bankof New York Economic Policy Review 2(October): 37–53.
Cline, William R. 1995. International Debt Reexamined.Washington, D.C.: Institute for International Economics.
Cline, William R., and Kevin J.S. Barnes. 1997. “Spreadsand Risk in Emerging Market Lending.” Research Paper97–1. Washington, D.C.: Institute of InternationalFinance.
Chari, V.V., and Patrick Kehoe. 1997. “Hot Money.” ResearchDepartment, Federal Reserve Bank of Minneapolis.
Dialynas, Chris P., and David H. Edington. 1992. “BondYield Spreads: A Postmodern View.” Journal of PortfolioManagement 19: 68–75.
Diamond, Douglas W. 1991. “Monitoring and Reputation:The Choice Between Bank Loans and Directly PlacedDebt.” Journal of Political Economy 99: 689–721.
Edwards, Sebastian. 1986. “The Pricing of Bonds and BankLoans In International Markets.” European EconomicReview 30: 565–89.
Eichengreen, Barry, and Richard Portes. 1989. “After theDeluge: Default, Negotiation, and Readjustment Duringthe Interwar Years.” In Barry Eichengreen and Peter
Lindert, eds. The International Debt Crisis in HistoricalPerspective. Cambridge, Mass.: MIT Press.
Fama, Eugene F., and Kenneth R. French. 1993. “CommonRisk Factors in the Returns on Stocks and Bonds.” Journalof Financial Economics 33: 3–56.
Hajivassilious, V. 1989. “Do Secondary Markets Believein Life After Debt?” In H. Ishrat and I. Diwan, eds.Dealing with the Debt Crisis. Washington, D.C.: WorldBank.
Haque, Nadeem, Mammohan Kumar, Nelson Mark, andDonald J. Mathieson. 1996. “The Economic Contentof Indicators of Developing Country Creditworthiness.”Staff Papers 43: 688–724.
Heckman, James. 1979. “Sample Section Bias as aSpecification Error.” Econometrica 47: 153–61.
Huizinga, Harry. 1989. “Commercial Bank Claims onDeveloping Countries: How Have Banks BeenAffected?” In H. Ishrat and I. Diwan, eds. Dealing withthe Debt Crisis. Washington, D.C.: World Bank.
Ilmanen, Antti, 1995. “Time-Varying Expected Returns inInternational Bond Markets.” Journal of Finance 50:481–506.
IMF (International Monetary Fund). 1995. InternationalCapital Markets: Developments, Prospects and Policy Issues.Washington, D.C.
———. 1997. International Capital Markets: Developments,Prospects, and Key Policy Issues: Background Material, Part1: Recent Developments and Trends in Capital Markets andBanking Systems. Washington, D.C.
Ilamanen, Antti. 1995. “Time-Varying Expected Returnsin International Bond Markets.” Journal of Finance 50:481–506.
Kamin, Steven, and Karsten van Kleist. 1997. “TheEvolution and Determinants of Emerging Market
References

25
Credit Spreads in the 1990s.” Federal Reserve Boardand BIS.
Kinoshita, Yuko, and Ashoka Mody. 1997. “The Usefulnessof Private and Public Information for Foreign InvestmentDecisions.” Policy Research Working Paper 1733,Washington D.C.
Lee, Suk Hun. 1993. “Are the Credit Ratings Assigned byBankers Based on the Willingness of LDC Borrowersto Repay?” Journal of Development Economics 40:49–359.
Levey, David H. “Evaluating Sovereign Risk.” Moody’sInvestors Service.
Longstaff, Francis A., and Eduardo S. Schwartz. 1993.“Valuing Risky Debt: A New Approach.” Anderson Schoolof Management, UCLA.
Ozler, Sule, and Harry Huizinga. 1992. “Bank Exposure,Capital, and Secondary Market Discounts on DevelopingCountry Debt.” NBER Working Paper 3961.
Purcell, John., Ernest Brown, Joyce Chang, and DirkDamrau, 1993. “Ferment Over Developing CountrySovereign Ratings: The Case of Mexico.” EmergingMarkets Research Salomon Brothers 1–10.
Standard & Poor’s. 1995. “Local Currency Date RatingsCriteria: An Update.” Standard & Poor’s Criteria (27 March).