Embed Size (px)
Citation preview

THE REPORT
9780198085386 Bricks Report_00_FM.indd i9780198085386 Bricks Report_00_FM.indd i 09/03/12 4:49 PM09/03/12 4:49 PM

9780198085386 Bricks Report_00_FM.indd ii9780198085386 Bricks Report_00_FM.indd ii 09/03/12 4:49 PM09/03/12 4:49 PM

1
A Study of Brazil, Russia, India, China, and South Africa with special focus on synergies
and complementarities
THE REPORT
9780198085386 Bricks Report_00_FM.indd iii9780198085386 Bricks Report_00_FM.indd iii 09/03/12 4:49 PM09/03/12 4:49 PM
3Oxford University Press is a department of the University of Oxford.
It furthers the University’s objective of excellence in research, scholarship, and education by publishing worldwide. Oxford is a registered trademark of
Oxford University Press in the UK and in certain other countries
Published in India byOxford University Press
YMCA Library Building, 1 Jai Singh Road, New Delhi 110 001, India
© Ministry of Finance, Government of India 2012
The moral rights of the author have been asserted
First Edition published in 2012
All rights reserved. No part of this publication may be reproduced, stored ina retrieval system, or transmitted, in any form or by any means, without the
prior permission in writing of Oxford University Press, or as expressly permittedby law, by licence, or under terms agreed with the appropriate reprographics
rights organization. Enquiries concerning reproduction outside the scope of theabove should be sent to the Rights Department, Oxford University Press, at the
address above
You must not circulate this book in any other form and you must impose this same condition on any acquirer
ISBN-13: 978-0-19-808538-6ISBN-10: 0-19-808538-9
Typeset in 11/14.6 Adobe Garamond Proby Excellent Laser Typesetters, Pitampura, Delhi 110 034
Printed in India at G.H. Prints Pvt. Ltd, New Delhi 110 020
This report is written by experts and scholars from BRICS countries with thesupport of BRICS governments. It aims to promote pragmatic
economic cooperation among BRICS countries. The data from international institutions and individual country sources have
been used in this report for comparability reasons, which may not be fully consistentwith government statistics, and hence shall not be deemed as officially approved.
9780198085386 Bricks Report_00_FM.indd iv9780198085386 Bricks Report_00_FM.indd iv 09/03/12 4:49 PM09/03/12 4:49 PM

Contents
List of Tables vi
Preface ix
Acknowledgements xi
Executive Summary xiii 1. Overview of BRICS 1
2. Impact of the Financial Crisis on BRICS 79
3. Best Practices 103
4. Major Challenges 160
5. BRICS Cooperation 169

Tables
1.1 Overview of BRICS, 2010 21.2 Land Use in BRICS, 2008 41.3 Growth Rate of Gross Domestic Product 71.4 Gross Domestic Investment and Savings 81.5 Sectoral Share in GDP 101.6 Rank on Global Competitiveness Index (GCI), 12 2010–11 1.7 Population and Demographic Profi le of BRICS 131.8 Social Sector Indicators, 2007 151.9 Fiscal Defi cit of General Government 181.10 Fiscal Balance of General Government 201.11 Gross Debt of General Government 211.12 Fiscal Consolidation Policy 211.13 Composition of Fiscal Adjustment Plans 231.14 Monetary Frameworks in BRICS 241.15 Infl ation: Average Consumer Prices 301.16 Global Integration of BRICS Economies 321.17 BRICS Share of Global Trade 33

tables vii
1.18 BRICS Exports of Goods and Services 331.19 BRICS Share in World Exports 341.20 BRICS Exports Profi le, 2009 351.21 High-technology Exports 361.22 BRICS Share of World Exports of Services 361.23 Imports of Goods and Services 371.24 BRICS Imports Profi le, 2009 381.25 BRICS Share of World Imports of Services 391.26 Export Linkages of BRICS 401.27 BRICS Share in Global Remittance Infl ows 411.28 Trade Balance and Current Account Balance 421.29 Share of Global FDI Infl ows 431.30 Cross-country Movement of FDI Flows 451.31 Cross-country Movement of Portfolio Flows 461.32 BRICS and Foreign Exchange Reserves 471.33 External Debt Stocks, Total 481.34 BRICS Exchange Rate Regime 501.35 Stock Market Performance of BRICS Countries 531.36 Total Listed Domestic Companies 551.37 Market Capitalization of Listed Companies 561.38 Stocks Traded, Turnover Ratio 581.39 Equity Valuation Measures: Dividend– 59 Yield Ratios1.40 Emerging Market External Financing: 60 Total Bonds, Equities, and Loans 1.41 Insurance Sector in BRICS Economies 611.42 Prudential Indicators of the Banking Sector 65 in BRICS1.43 Bank Profi tably Indicators in BRICS 661.44 Financial Services Accessibility in BRICS 74

viii tables
1.45 Credit Depth of Information Index 751.46 Domestic Credit Provided by Banking Sector 76
2.1 Global Financial Crisis and BRICS: 82 Summary Indicators 2.2 Size of Discretionary Measures in Financial Crisis 872.3 Measures by Central Banks 88

Preface
Th e acronym BRIC stands for Brazil, Russia, India, and China. Th e term was coined by the Chief Economist of Goldman Sachs, in 2001, in a paper titled ‘Building Better Global Economic BRICs’, which looked at the growth prospects of the four largest emerg-ing economies that are culturally and geographically disparate. Th e main fi nding was that the BRICs would play an increasingly important role in the global economy. Th e projections were revised in later publications, as the BRIC economies fared better than expected. Th is study expands the original terms of reference to include South Africa because of its growing signifi cance in the global economy. Th e new acronym is, therefore, BRICS and it symbolizes the collective economic power of Brazil, Russia, India, China, and South Africa. Together the BRICS account for more than 40 per cent of the global population, nearly 30 per cent of the land mass, and a share in world GDP (in PPP terms) that increased from 16 per cent in 2000 to nearly 25 per cent in 2010 and is expected to rise signifi cantly in the near future.

x preface
Th is study, which is supported by the ministries of fi nance and the central banks of the BRICS, focuses on synergies and comple-mentarities between the economies, highlighting their role as growth drivers of the world economy. Th e emphasis is on best practices, areas of cooperation, and strengthening economic links so that the BRICS could collectively play a more central role in the ‘new normal’ of the post-crisis global economy. Th is is also perhaps the most opportune time for forging closer links, given that the world economy is in a state of fl ux and a rebal-ancing is taking place towards the emerging economies. Th eir pivotal role in the global recovery has already catapulted the BRICS into the leadership role, which needs further cementing through greater interface among economies. Th e study, which is in fi ve parts, is in the nature of a forward-looking report that seeks to reinforce and strengthen the position of BRICS in the global economy. Chapter 1 of the study provides an overview of the BRICS, their fi nancial, government, and regula-tory framework, and their share in the global economy. Chapter 2 examines the impact of the global crisis, the resilience of the BRICS economies, their use of fi scal and monetary stimuli, the process of recovery, and their contribution to global growth. Chapter 3 looks at the best practices in the BRICS and the lessons they hold for each other and the world economy. Chapter 4 looks at the challenges that the BRICS are likely to face in moving to a higher growth path. Chapter 5 explores areas of cooperation among the BRICS including initiatives that could propel the BRICS and the world economy to a higher growth trajectory.

Acknowledgements
The following officials contributed to the preparation of The BRICS Report: (Brazil) Jose Nelson Bessa Maia, Fabio Augusto Najjarian Batista, Eiiti Sato, Paula Gala, Marcos Antonio Macedo Cintra, Daniel Silva Grimaldi, and Andre de Mello e Souza; (Russia) Alexey Rybkin, Alexey Shestov, Alexey Chernov, Sergey Potapov, Andrey Bokarev, Maxim Kulikov, Pavel Chernyshev, Lubov Starikova, Ilya Prilepskiy, Vasily Miheev, and Irina Kim; (India) Anil Bisen, Alok Sheel, S.V.S. Dixit, Sunil Saran, Rajiv Ranjan, Supriyo De, Reetu Jain, Rajmal, Rangeet Ghosh, Rakesh Kumar, Sonna Thangzason, Vishal Raina, and Suraj Kumar; (China) Wu Guoqi, Wang Xin, Song Hong, Zhao Fuchang, Guo Wensong, Wangui Mo, Tianwei Zhang, and Zhan Shu; (South Africa) Xavier Carim, Marisa Fassler, Neil Gary Cole, Mashabela Victor, and Gert Marincowitz. Dr Kaushik Basu, Chief Economic Adviser, Ministry of Finance, Government of India, was the reviewing authority on the overall progress of the work.
9780198085386 Bricks Report_00_FM.indd xi9780198085386 Bricks Report_00_FM.indd xi 26/03/12 10:07 AM26/03/12 10:07 AM

Executive Summary
Th is study, which is supported by the ministries of fi nance and the central banks of the BRICS, focuses on synergies and complementa-rities between the economies, highlighting their role as growth driv-ers of the world economy. Th e emphasis is on best practices, areas of cooperation, and strengthening economic links so that the BRICS could collectively play a more central role in the ‘new normal’ of the post-crisis global economy. Th e study is divided into fi ve chapters.
I. Overview of BRICS
Chapter 1 of the study provides an overview of the BRICS, their fi nancial, government, and regulatory framework, and their share in the global economy. Together, the BRICS account for more than 40 per cent of the global population, nearly 30 per cent of the land mass, and a share in world GDP (in PPP terms) that increased from 16 per cent in 2000 to nearly 25 per cent in 2010, and is expected to rise signifi cantly in the near future. If one compares the GDP in

xiv executive summary
PPP terms for 2010, four economies fi gure among the G-20 top ten, with China, India, Russia, Brazil, and South Africa in 2nd, 4th, 6th, 8th, and 26th place, respectively. In terms of contribution to growth of PPP-adjusted global GDP of the world, these fi ve economies accounted for 55 per cent during 2000–8, and their contribution is expected to rise in the coming years. However, as per the criterion of GDP at market prices, among the members of the G-20, China holds the 2nd position while Brazil, India, Russia, and South Africa hold the 7th, 9th, 11th, and 19th positions, respectively.
II. Impact of the Financial Crisis on BRICS
Chapter 2 examines the impact of the global crisis, the resilience of the BRICS economies, their use of fi scal and monetary stimuli, the process of recovery, and their contribution to global growth. Th e recent global fi nancial crisis that engulfed almost all economies marked a painful adjustment at the macro level coupled with micro-level distortions and incentives created by past policy actions. Th e crisis spread to the BRICS through four channels—trade, fi nance, commodity, and confi dence. Th e slump in export demand and tight-er trade credit caused a deceleration in aggregate demand. Th e global fi nancial crisis infl icted signifi cant loss in output in all the BRICS economies. However, real GDP growth in India and China remained impressive even though they also witnessed some moderation due to weakening global demand. Th e crisis also exposed the structural weakness of the global fi nancial and real sectors. Th e reversal of capital fl ows led to equity market losses and currency depreciations, resulting in lower external credit fl ows. Th e banking sectors of the BRICS economies performed relatively well.

executive summary xv
Th e BRICS, however, recovered swiftly with the support of domestic demand. Still, the recovery is yet to be made compatible with the fi scal consolidation process. Besides the current recovery process, there are specifi c lessons for the BRICS economies from the recent crisis. Th ese lessons include (i) recognizing the invalidation of the decoupling hypothesis, (ii) allowing domestic demand to serve as a durable source of growth, (iii) instituting fi nancial sector reforms, (iv) monitoring and managing speculative capital fl ows, (v) creating fi scal policy space on a sustainable basis as a central feature of their reform agenda, and (vi) focusing on infrastructure development and employment generation.
III. Best Practices
Chapter 3 looks at the best practices and institutions within the BRICS economies that have made signifi cant diff erences to these economies and contributed to their high growth rates. Many of these practices and institutions have relevance within the BRICS bloc for enhancing cooperation and creating synergies, so that the BRICS collectively could grow faster. Major showcase areas for Brazil include agricultural research, which has transformed the country into a major exporter, the use of bio-fuel for road transport, and the emergence of Embraer as a high-technology aircraft manufacturer. In the social sphere, conditional cash transfers that target poverty and the success of the anti-AIDS policy provide useful lessons. A regulatory framework that helped Brazil withstand the shock of the global crisis, including the regulation of capital fl ows, and the issuance of domestic currency-denominated international bonds, which transfer currency

xvi executive summary
risk to investors, are other successful practices that have been highlighted. Russia’s major achievements include reforms during 1999–2009 that promoted economic growth, lowered infl ation, and led to a dramatic fall in the number of people living below the poverty line. Specifi c achievements include setting up of the Oil Stabilisation Fund that was successful during the crisis, budgetary reforms through the devolution of decision-making powers, and the introduction of a fl at personal income tax rate of 13 per cent that ensured improve-ment in compliance. Th e main showcase institution for India is private entrepreneur-ship which has been instrumental in achieving 8–9 per cent annual growth of the economy in recent years. Private initiative has been responsible for the excellence achieved in the information technology sector and the innovative streak that has led to improvization and production of low-cost goods for the Indian mass market. Besides, the calibrated approach to capital account convertibility and the External Commercial Borrowing Policy have helped insulate the economy against surges and reversals of debt fl ows and maintained the external debt at sustainable levels. Th e Right to Information Act is increasing the transparency and accountability of government operations and the Mahatma Gandhi National Rural Employment Guarantee Scheme is a major step towards making growth inclusive. Th e best practices and institutions of China are those that have helped ensure progress in terms of sustaining its rapid economic growth, enhancing its overall national strength, and improving the living standards of its people. It also includes the success in making the historic transition from a highly centralized planned economy to a robust socialist market economy, and from a closed and semi-closed country to one that is open to the outside world. Specifi c

executive summary xvii
areas are FDI attraction and utilization, and infrastructure fi nancing, among others. Th e Chinese globalization model has also been diff erent, in that foreign direct investment was encouraged. Th e sub-national govern-ments (cities/provinces) have been successful in attracting foreign investment by providing improved infrastructure and a favourable regulatory environment. China also has experience in fi nancial mac-ro-management. Th e reform and development of China’s banking industry and fi nancial market is an important driver for rapid and sustainable growth. South Africa has a long record of responsible macroeconomic management, which has helped to promote the development of a deep and liquid bond market and reduced external vulner-ability. South Africa has strong institutions and a highly developed, well-regulated banking sector that escaped the worst eff ects of the fi nancial crisis. With the most developed industrial and fi nancial capabilities on the African continent, South Africa’s role in the integration of policies, markets, fi nance, and infrastructure is vital to Africa’s economic development and realization of the continent’s potential as a growth pole in the global economy. Outwardly ori-ented South African companies are among the largest sources of FDI in Africa and the country’s development fi nancing institutions are playing an increasing role in the funding of regional infrastruc-ture investment.
IV. Major Challenges
Chapter 4 looks at the challenges that the BRICS could face in mov-ing to a higher growth path. Since the macroeconomic parameters

xviii executive summary
and features of development vary within BRICS economies, the chal-lenges they face to make their growth process sustainable also vary. For instance, in Brazil macroeconomic stabilization is a key precon-dition for successful reforms and sustainable growth. Th e challenges that the Brazilian economy face are as follows: (i) its tradeable goods sector is small when compared to other EMEs like China; (ii) saving and investment rates have to increase as in other BRICS economies like China and India; (iii) improvements are required in public sec-tor management; and (iv) it also needs to enhance the depth of the fi nancial sector as well as improve long-term fi nancing structures for the private sector. In the case of Russia, the key challenges are accelerating the implementation of structural reforms, particularly in ineffi cient and undercapitalized natural monopolies, and strengthening the invest-ment climate. For India, the major challenges are (i) making the growth process more inclusive, (ii) improving physical infrastructure, (iii) develop-ing the agriculture sector, and (iv) enhancing delivery of essential public services, such as education and health, to large parts of the population. Similarly for China, policy changes are needed to address both domestic and external challenges. Th e policy challenge for China is to sustain rapid and stable economic growth, driven by both exports and domestic demand in a more balanced way. To facilitate restruc-turing of the economy, fi nancial sector reforms are needed to improve the intermediation of China’s large private savings. Th e government also needs to raise social spending in the areas of education, health-care, and pensions, which will serve to reduce precautionary saving and boost consumption over time. Th ere is also a need to improve

executive summary xix
the investment structure, advance reforms in the healthcare, pension, and education systems, and provide more support to rural areas and less-developed regions. Th e key challenge for South Africa is to achieve higher levels of inclusive growth that raise employment and reduce inequality. Low domestic savings, currency volatility, inadequate investment in pro-ductive sectors of the economy, skill shortages, and ensuring effi cient government services delivery are other challenges. Policies proposed in the New Growth Path constitute the key means to address these challenges through a developmental state that places employment at the centre of the fi ght against inequality. Within a prudently managed macroeconomic framework, the government is prioritizing policy measures focused on the expansion of infrastructure networks, skills development, interventions to raise youth employment, industrial policy that promotes higher value added exports, the development of rural economies, small enterprise promotion, green economy initia-tives, and regional integration. One common challenge that BRICS economies face is the need for institutional development without which sustainable growth cannot be ensured. In a post-global crisis world largely shaped by fi nancial instability and weak growth in the major economies, the BRICS countries have a remarkable opportunity to coordinate their economic policies and diplomatic strategies not only to enhance their position as a grouping in the international economic and fi nancial system, but also to be a stabilization factor for the world economy as a whole. BRICS should increasingly harmonize and coordinate their policies with a view to sustaining their growth momentum and capacity to weather global turbulence. Th e benefi t of cooperat-ing among themselves is immense for the BRICS as well as for the
xx executive summary
global economy. A strategic agenda for forging closer links among the BRICS, as outlined in this joint report, may contribute to consoli-dating and expanding their roles in global aff airs.
V. BRICS Cooperation
Chapter 5 lists exsting areas of cooperation among the BRICS, and explores new areas of cooperation including initiatives that could increase growth and development in BRICS countries and world-wide. In the BRICS economies, there exist huge opportunities to extend economic growth and development to the next level. In this regard, there is possibility to further increase cooperation among the BRICS to gain competitive advantages. It is important to note that all the proposals laid out in this chapter might contribute to promote synergetic relationships among the BRICS economies. However, implementation of these may require further deliberations and their political and technical feasibility is yet to be determined in greater detail. Th e new areas of cooperation listed below should be seen basi-cally as exploratory items to be included in further discussions and in the agenda of future meetings of the BRICS leaders, ministers, and other policymakers. Th e focus areas suggested are as follows:
(i) Intra-BRICS Trade and Investment Cooperation (ii) Cooperation in Infrastructure Financing(iii) Industrial Development and Cooperation(iv) Cooperation in Transportation(v) Cooperation in Food Security(vi) Cooperation in Technical Education (vii) Cooperation in Financial Market Development

executive summary xxi
(viii) Cooperation in Research and Development(ix) Cooperation in the Area of Culture and Tourism(x) Cooperation in International Issues(xi) Cooperation in Energy Security(xii) Cooperation to Build Eff ecitve Institutions(xiii) International Development Bank for Fostering South–South
Investment
To conclude, even though the BRICS have pursued diff erent paths of growth with diff erent macroeconomic parameters and varied institutional strengths, the world seems to be optimistic about their emergence based on their respective durable comparative advantages. Th e growing role of the BRICS is confi rmed by the rapid recovery of these economies from the global fi nancial crisis, which demonstrates that optimal global economic policymaking cannot be undertaken without including the BRICS economies at the highest level.

Overview of BRICS
Basic Information on BRICS Countries
In the past few decades, some large economies such as Brazil, Russia, India, China, and South Africa (BRICS) have acquired a vital role in the world economy as producers of goods and services, receivers of capital, and as potential consumer markets. Th e BRICS economies have been identifi ed as some of the fastest growing countries and the engines of the global recovery process, which underscores the changed role of these economies. Even in the G-20 countries’ forum, BRICS are playing a formidable role in shaping macroeconomic policy after the recent fi nancial crisis. At present, these fi ve countries encompass over 40 per cent of the world’s population and account for nearly 25 per cent of total global GDP in terms of PPP. If one compares the GDP in PPP terms, four economies fi gure among the top ten, with China, India, Russia, Brazil, and South Africa in 2nd, 4th, 6th, 8th, and 26th places, respectively (Table 1.1). In terms of contribution to growth of PPP-adjusted global GDP of the world, these fi ve economies accounted for 55 per cent during
1

Tabl
e 1.
1 O
verv
iew
of B
RIC
S, 2
010
G
DP
in P
PP
GD
P Sh
are
in W
orld
GD
P Pe
r Cap
ita
(in U
S$ b
illio
n)
(US$
bill
ion)
(in
per
cen
t)
GD
P (U
S$)
R
ank
in W
orld
G
DP
1990
20
10
1990
20
10
1990
20
10
1
2 3
4 5
6
7
8
9
Braz
il 8
2,17
2 50
8 2,
090
3.3
2.9
3,46
4 10
,816
Russ
ia
6 2,
223
– 1,
465
– 3.
0 –
10,4
37
Indi
a
4 4,
060
326
1,53
8 3.
1 5.
4 37
8 1,
265
Chi
na
2 10
,086
39
0 5,
878
3.9
13.6
34
1 4,
382
Sout
h Af
rica
26
524
112
357
0.9
0.7
5,45
6 7,
158
Sour
ce: I
MF
data
base
.N
ote:
– N
ot a
vaila
ble.

overview of brics 3
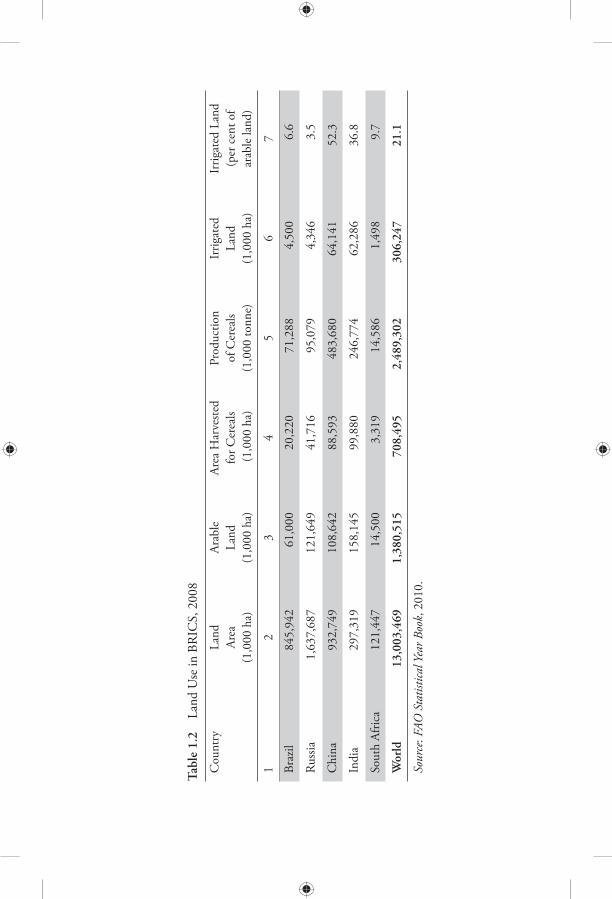
2000–8, and their contribution is expected to rise in the coming years. Th e BRICS comprise a huge land share of the world (Table 1.2) and, as a result, own vast natural resources. China, which has a land area of about 9.6 million sq. km, is the third-largest country in land size, after only Russia and Canada. Russia accounts for around 20 per cent of the world’s oil and gas reserves, while China has about 12 per cent of the world’s mineral resources. In terms of agricultural land, Russia has 121.5 million hectares of arable land. Brazil covers 47 per cent of South America and is the fi fth-largest country in the world (8.5 million sq km), surpassed only by Russia, Canada, China, and the United States of America. Each of the BRICS countries has multiple and diff erent attributes and thus each has a huge potential to develop. Brazil is extremely rich in resources such as coff ee, soybeans, sugar cane, iron ore, and crude oil, with around 60 million hectares of arable land (just 7 per cent of its land area) but with an agricultural area of 31.2 per cent of the total land area. Russia is noted for its massive deposits of oil, natural gas, and minerals. India is a strong service provider with a rising manufacturing base, while China is seen as the manufacturing work-shop of the world with a highly skilled workforce and relatively low wage costs. South Africa is the 26th largest economy in the world, with a GDP of US$ 357 billion. It is a medium-sized country with a total land area of slightly more than 1.2 million sq. km and around 12 per cent arable land area. It is the world’s largest producer of plati-num and chromium and holds the world’s largest known reserves of manganese, platinum group metals, chromium, vanadium, and alumino-silicates. South Africa generates 45 per cent of Africa’s electricity and the South African power supplier provides the 4th cheapest electricity in the world.
Tabl
e 1.
2 La
nd U
se in
BR
ICS,
200
8
Cou
ntry
La
nd
Arab
le
Area
Har
veste
d Pr
oduc
tion
Irrig
ated
Ir
rigat
ed L
and
Ar
ea
Land
fo
r Cer
eals
of C
erea
ls La
nd
(per
cen
t of
(1
,000
ha)
(1
,000
ha)
(1
,000
ha)
(1
,000
tonn
e)
(1,0
00 h
a)
arab
le la
nd)
1 2
3 4
5 6
7
Braz
il 84
5,94
2 61
,000
20
,220
71
,288
4,
500
6.6
Russ
ia
1,63
7,68
7 12
1,64
9 41
,716
95
,079
4,
346
3.5
Chi
na
932,
749
108,
642
88,5
93
483,
680
64,1
41
52.3
Indi
a 29
7,31
9 15
8,14
5 99
,880
24
6,77
4 62
,286
36
.8
Sout
h Af
rica
12
1,44
7 14
,500
3,
319
14,5
86
1,49
8 9.
7
Wor
ld
13,0
03,4
69
1,38
0,51
5 70
8,49
5 2,
489,
302
306,
247
21.1
Sour
ce: F
AO S
tatis
tical
Yea
r Boo
k, 2
010.
overview of brics 5
Economic Growth
It is widely perceived that over the next few decades the growth gen-erated by the largest developing countries, particularly the BRICS, could become a much more signifi cant force in the world economy. Among the BRICS, India and Brazil are relatively more domestic demand-driven economies. As a group, they witnessed faster eco-nomic recovery from the 2008 fi nancial crisis than advanced and other emerging market economies (EMEs). Although they have strong external linkages, they have nonetheless undergone signifi cant rebalancing of their economies towards their domestic sectors in the post-crisis period. According to an estimate by Goldman Sachs, the four original BRIC countries are expected to represent 47 per cent of global GDP by 2050, which would dramatically change the list of the world’s 10 largest economies. An important change that we may expect over the medium to long term is that the top 10 countries in terms of GDP may be diff erent from the top 10 countries in terms of per capita GDP. Th e inherent strength of the BRICS emanates from strong domes-tic demand-based economies in the case of India and Brazil and the signifi cant outward linkages of China and Russia. South Africa ben-efi ts from its large resource base and proximity to untapped growth potential of the African continent. Among the BRICS, China, followed by India, are the fastest-growing economies in the current decade. Between 1978 and 2009, the Chinese economy grew at an average annual rate of 9.9 percent, which is much higher than the world average for the period. Th e growth performance of Russia and Brazil also improved signifi cantly after the fi nancial crises of the 1990s.
6 the brics report
Th e sustained economic reforms and improved macroeconomic fundamentals along with a buoyant macroeconomic environment contributed to the improved growth performance of the BRICS in the current decade (Table 1.3). Th e strong growth performance of the BRICS is attributed to strong macroeconomic fundamentals, as refl ected by the high sav-ings and investment rates, even though Brazil and South Africa still have room to increase these rates. South Africa’s investment ratio has increased strongly over the past decade as government and public corporations have stepped up infrastructure investment, but overall investment is constrained by low savings. Among the BRICS, China has the highest saving and investment rates followed by India. High savings have also helped reduce the contribution of net exports to GDP in the case of China and India. As a result, high investment-led growth was largely fi nanced by domestic savings (Table 1.4). Th e salient features of the BRICS economies are their large geo-graphical dimensions and size of population. It is widely perceived that all the BRICS markets have great potential for establishing the most stabilising of forces, that is, a prosperous middle class. Th is middle-income group in each country is growing at varying rates but the future direction is clear, that is, the middle class will both broaden and deepen, providing a solid base for the growth and development of the economies.
Linkages between Agriculture, Industry, and Services Sectors
Th e output structures in the BRICS economies have changed sig-nifi cantly when compared to previous decades. Th e declining share

Tabl
e 1.
3 G
row
th R
ate
of G
ross
Dom
estic
Pro
duct
(p
er c
ent)
19
91–2
002
20
02
2005
20
06
2007
20
08
2009
20
10
1 2
3 4
5 6
7 8
9
BR
ICS
Braz
il 2.
6 2.
7 3.
2 4.
0 6.
1 5.
2 –0
.6
7.5P
Russ
ia
– 4.
7 6.
4 8.
2 8.
5 5.
2 –7
.8
4.0P
Indi
a 5.
7 4.
6 9.
2 9.
8 9.
4 7.
3 5.
7 10
.4
Chi
na
10.3
9.
1 10
.4
11.6
13
.0
9.6
8.7
10.3
Sout
h Af
rica
2.1
3.7
5.3
5.6
5.8
3.7
–1.7
2.
8
Adv
ance
d Ec
onom
ies
2.8
1.7
2.7
3 2.
8 0.
5 –3
.2
3.0
Euro
Are
a 2.
1 0.
9 1.
7 3
2.8
0.6
–4.1
1.
7
USA
3.
5 1.
8 3.
1 2.
7 2.
1 0.
4 –2
.4
2.8
Wor
ld
3.2
2.9
4.5
5.1
5.2
3.0
–0.6
5.
0
Sour
ce: W
orld
Eco
nom
ic O
utlo
ok, I
MF
(201
1).
Not
e: P:
Pro
ject
ion;
– N
ot a
vaila
ble.

Tabl
e 1.
4 G
ross
Dom
estic
Inve
stmen
t and
Sav
ings
(per
cen
t to
GD
P)
Cou
ntry
1990
19
95
2000
20
06
2007
20
08
2009
20
10
1
2 3
4 5
6 7
8 9
Braz
il
Inve
stmen
t 20
.2
18
18.3
16
.8
18.3
20
.7
16.5
19
.3
Savi
ng
21.4
16
.5
16.5
19
.7
18.8
18
.4
16.1
17
.0
Russ
ia
Inve
stmen
t –
25
.4
18.7
21
.4
24.1
26
.2
22.7
19
.8
Savi
ng
–
28.8
38
.7
34.1
33
.2
34.9
33
24
.7
Indi
a
Inve
stmen
t 24
.2
26.6
24
.2
36
37.6
35
.6
34.5
37
.9
Savi
ng
22.7
25
.4
23.2
32
.9
33.5
30
.2
29.8
34
.7
Chi
na
Inve
stmen
t 36
.1
41.9
35
.1
43.6
41
.7
42.5
44
.8
48.8
Sa
ving
39
.6
44.1
37
.5
51.3
50
.5
50.2
54
.2
54.0
Sout
h Af
rica
Inve
stmen
t –
18.2
15
.9
19.7
21
.3
22.0
19
.4
21.7
Sa
ving
19
.1
16.5
15
.8
14.4
14
.1
14.9
15
.4
20.0
Sour
ce: W
orld
Ban
k D
atab
ase.
Not
e: –
Not
ava
ilabl
e.

overview of brics 9
of agriculture in their respective GDPs has been a common trend over the years. While there has been considerable stability in agricul-tural growth in Brazil and Russia during 2000–5 compared to earlier decades, agricultural performance in India and China has shown greater volatility. However, Russia has experienced a decline in share of agriculture from 7.6 per cent in 1995 to 4.9 per cent in 2008, while Brazil’s share remained relatively stable between 1995 and 2008 (Table 1.5). Another common trend is the rising share of services in BRICS country GDPs since 1990. In China, industry continues to dominate in GDP at around 42.8 per cent in 2008 (around 35.5 per cent in 1990), while the share of services has increased from 38.5 per cent in 1990 to 45.7 per cent in 2008. Agri-business plays a central role in Brazil’s economic develop-ment, engaging 35 per cent of its workforce and contributing to almost 42 per cent of its export dollars. Brazilian agriculture has undergone dramatic changes in the past few decades. From a net importer of food grains until the 1970s, Brazil has emerged as the major net exporter of food products. A similar trend is witnessed in the case of India, where the Green Revolution and developments in biotechnology helped the country become self-reliant in food production. With increasing global demand for food and scarcity of arable land in the world, agronomic conditions will enable Brazil to continue its growth and become a larger supplier of agricultural commodities to nations around the world. In China, especially since 1991 with the introduction of the socialist market economy system, many changes in urban areas were ushered in. Th e share of primary industry rapidly went down, while that of the secondary and tertiary industries increased. In Russia, there are measures to implement the National Project in agro-industrial complex. Among the BRICS, South Africa has the smallest share of agriculture in GDP, at around

Tabl
e 1.
5 Se
ctor
al S
hare
in G
DP
(per
cent
age
to G
DP)
Cou
ntry
Se
ctor
s 19
90
199
5 20
00
2005
20
08
2009
1 2
3 4
5 6
7 8
Braz
il Ag
ricul
ture
10
.1
5.8
5.6
5.7
5.9
6.1
In
dustr
y 29
.9
22.0
27
.7
29.3
27
.9
25.4
Se
rvic
es
60.0
72
.2
66.7
65
.0
66.2
68
.5
Russ
ia
Agric
ultu
re
– 7.
6 6.
7 5.
4 4.
9 4.
7
Indu
stry
– 27
.9
31.4
32
.9
29.7
32
.9
Serv
ices
–
64.6
62
.0
61.6
65
.6
62.4
Indi
a Ag
ricul
ture
30
.0
26.8
23
.2
18.9
19
.0
17.1
In
dustr
y 22
.3
23.2
20
.7
21.0
21
.0
28.2
Se
rvic
es
47.7
50
.0
56.1
60
.0
60.0
54
.6
Chi
na
Agric
ultu
re
26.0
19
.7
15.2
12
.2
11.6
11
.0
Indu
stry
35.5
40
.6
40.7
42
.2
42.8
48
.0
Serv
ices
38
.5
39.7
44
.1
45.6
45
.7
41.1
Sout
h Af
rica
Agric
ultu
re
4.6
3.9
3.3
2.7
3.2
3.0
In
dustr
y 40
.1
34.8
31
.8
31.2
32
.5
31.1
Se
rvic
es
55.3
61
.3
64.9
66
.2
64.3
65
.8
Sour
ce: U
nite
d N
atio
ns S
yste
m o
f Nat
iona
l Acc
ount
s.N
ote:
– N
ot a
vaila
ble.

overview of brics 11
3 per cent and its services sector accounts for more than 60 per cent of the total GDP. In terms of the World Economic Forum ranking on global com-petitiveness, China ranks 27 (out of 139 countries) in 2010–11, while the rest of the BRICS economies are placed at 51 (India), 54 (South Africa), 58 (Brazil), and 63 (Russia), respectively. Th e better rank of China can be attributed to its large market size (2), macro-economic environment (4), and innovation (26). Th e ranks of vari-ous indicators of competitiveness suggest that the BRICS have strong and deep markets, which is also evident in the case of South Africa (Table 1.6).
Education, Inequality, Demographic Trends,and Other Social Indicators
Th e demographic dividend that BRICS economies enjoy, in com-parison with rapidly aging societies and longer life-expectancies in advanced countries, is likely to benefi t the group in the future. Th e share of the urban population is rising and the child-dependency ratio is falling, pointing to a rising share of the working age popula-tion. Th e increasing labour force shows the huge demand-and-supply potential in the BRICS economies (Table 1.7). Th ough these economies are better placed demographically than advanced countries, a decline in the working age population is expect-ed to take place at a faster pace in some of the BRICS countries. At present, the population in the age group of 0 to 14 years is the high-est in India (32.1 per cent), followed by Brazil (27.9 per cent), China (21.4 per cent), and Russia (15.3 per cent). It is expected that the average age of the population in India will decline, before it begins to

Tabl
e 1.
6 R
ank
on G
loba
l Com
petit
iven
ess I
ndex
(GC
I), 2
010–
11
Cou
ntry
G
loba
l Com
petit
ive
Infra
struc
ture
M
acro
econ
omic
H
ighe
r Edu
catio
n M
arke
t Bu
sines
s In
nova
tion
In
dex
En
viro
nmen
t an
d Tr
aini
ng
Size
So
phist
icat
ion
1 2
3 4
5 6
7 8
Braz
il 58
62
11
1 58
10
31
42
Russ
ia
63
47
79
50
8 10
1 57
Indi
a 51
86
73
85
4
44
39
Chi
na
27
50
4 60
2
41
26
Sout
h Af
rica
54
63
43
75
25
38
44
Sour
ce: G
loba
l Com
petit
iven
ess R
epor
t 201
0–11
, Wor
ld E
cono
mic
For
um.

Tabl
e 1.
7 Po
pula
tion
and
Dem
ogra
phic
Pro
fi le
of B
RIC
S
To
tal P
opul
atio
n U
rban
Pop
ulat
ion
Dep
ende
ncy
Tota
l Fer
tility
Rat
e
(mill
ion)
(p
er c
ent o
f tot
al)
Rat
io
(birt
hs p
er w
oman
)
Cou
ntry
19
90
2010
1
990
2010
1
990
2010
19
90–5
20
05–1
0
1 2
3 4
5 6
7 8
9
Braz
il
149.
6 19
5.4
73.9
86
.5
65.9
47
.9
2.6
1.7
Russ
ia
148.
1 14
0.4
73.4
73
.2
49.4
38
.7
1.6
1.5
Indi
a
862.
2 12
14.5
25
.6
30.0
71
.5
55.6
3.
9 2.
5
Chi
na
1142
.1
1354
.1
26.4
47
.0
51.2
39
.1
2.0
1.8
Sout
h Af
rica
36.7
50
.5
52.0
61
.7
72.7
53
.6
3.3
2.4
Sour
ce: H
uman
Dev
elopm
ent R
epor
t, U
ND
P.N
ote:
Dat
a fo
r 199
0 in
the
case
of R
ussia
has
bee
n ta
ken
from
HD
R 20
10.

14 the brics report
rise after 25 years. According to projections by the United Nations, the median age in India will cross 30 only by 2025 and will remain at around 35 until 2040. In 2020, the average Indian will be only 29 years old, compared with the average age of 37 years in China and the US, 45 years in Western Europe and 48 years in Japan. As projected, China’s population would peak at around 1.5 billion in the beginning of 2030s and decline slowly afterwards. According to government estimates, the population of India is expected to increase from 1,029 million to 1,400 million during the period 2001–26, which is an increase of 36 per cent in 25 years at the rate of 1.2 per cent annually. According to 2010 data, India has an urbanization rate of less than 30 per cent, and China’s a little more than 40 per cent, while Russia’s and Brazil’s rates are 73 and 85 per cent, respectively. In the case of South Africa, about 61.7 per cent of the population lives in urban areas. Judging from these data, it is evident that China and India still have much room for urbanization, which will become an engine for their future growth. South Africa’s fertility rate has declined over the past decade due to rapid urbanization and the high prevalence of HIV/AIDS. Th e BRICS economies have to work together to improve living conditions for their populations and the quality of social services. Various social sector indicators suggest that there is a large scope for improvement in all the BRICS economies (Table 1.8). Among the BRICS, the Russian Federation ranks highest (71st out of 169 countries) in terms of the Human Development Index (HDI, 2010), while South Africa (129th) and India (134th) are ranked the lowest. South Africa has fairly high adult literacy rates (per cent of popula-tion 15 years and older) for both males (88.9 per cent) and females (87.2 per cent) (HDI, average for 1999–2007).

Tabl
e 1.
8 So
cial
Sec
tor I
ndic
ator
s, 20
07
Br
azil
Russ
ia
Indi
a C
hina
SA
1 2
3 4
5 6
Hum
an D
evel
opm
ent I
ndex
(HD
I, 2
007)
H
DI R
ank
75
71
134
92
129
Adul
t Lite
racy
(per
cen
t of 1
5 yr
s and
abo
ve d
urin
g 19
99–2
007)
M
ale
89
.8
99.7
76
.9
96.5
88
.9Fe
mal
e 90
.2
99.4
54
.5
90
87.2
Chi
ld-r
elat
ed In
dica
tors
Gro
ss E
nrol
men
t Rat
io (2
007)
87
.2
81.9
68
.7
61.0
76
.8C
hild
ren
unde
r Age
0–5
yrs
(dur
ing
2000
–6)
6 3
46
7 12
Popu
lati
on b
elow
Inco
me
Nat
iona
l Pov
erty
Lin
e 21
.5
19.6
28
.6
2.8
–Po
pula
tion
not U
sing
Impr
oved
Wat
er S
uppl
y (2
006)
9
3 11
12
7
Life
Exp
ecta
ncy
(yrs
)
M
ale
68
.6
59.9
62
.0
71.3
53
.2Fe
mal
e 75
.9
72.9
64
.9
74.7
49
.8In
equa
lity
Mea
sure
s
R
iche
st 10
per
cen
t to
Poor
est 1
0 pe
r cen
t 40
.6
11
8.6
13.2
35
.1G
ini I
ndex
55
.0
37.5
36
.8
41.5
57
.8So
urce
: UN
DP,
Hum
an D
evelo
pmen
t Rep
ort,
2010
.N
ote:
– N
ot a
vaila
ble.
16 the brics report
Better quality healthcare provision has reduced infant mortality in Brazil (from 47 per 1,000 live births in 1990 to 22.5 in 2009), contributing to an improvement in the well-being of the Brazilian population, which is somewhat witnessed in Russia as well.
Fiscal Sector
As a result of the 2007–9 crisis, fi scal stability in many countries deteriorated. Most countries encountered rising fi scal defi cits and public debts and, therefore, had to implement fi scal consolidation. Fiscal consolidation was the main point on the agenda of the G-20 Summit in Toronto, June 2010. G-20 leaders agreed to implement responsible economic policies, eliminate fi scal defi cits resulting from stimulus programmes, and prevent the escalation of growth in public debt. In particular, it was decided to reduce the fi scal defi cit twofold in three years. BRICS economies have diff erent political systems. Th erefore, the political environments under which reforms are initiated and implemented are quite distinct. For instance, China has a socialist democratic political system. India is a federal republic that has a democratic set-up with a parliamentary system similar to England; India is also the world’s largest voting republic, with participatory multi-party democracy. Th e politics of Russia and Brazil take place within the framework of a federal presidential republic. South Africa has been a constitutional multi-party democracy since the end of Apartheid in 1994. In all the BRICS countries, governments have played a signifi cant role in the growth and development process. In early 2000, the BRICS initiated fi scal consolidation mea-sures. In addition to putting in place the Fiscal Responsibility Law

overview of brics 17
(FRL), Brazilian authorities are committed to maintaining primary surplus targets stipulated in the draft Budget Guidelines Law every year. Similarly, in India, the fi scal position of the central govern-ment underwent consolidation in terms of targeted reduction in fi scal defi cit indicators under the Fiscal Responsibility and Budget Management (FRBM) Act. In the same manner, Chinese authori-ties showed their commitment to reform the budget process. In the late 1990s, South Africa took steps to improve the transparency of budgeting by publishing medium-term expenditure estimates over a three-year horizon. Th is coincided with a period of debt consolidation to reduce interest payments and reforms to improve the effi ciency of tax collection. Russia has taken a number of steps to achieve this goal. Already in the Law on Federal Budget for 2011–13, a substantial reduction in defi cit (resulting, in part, from the fall in public spending/GDP ratio) was envisaged. Th e defi cit was to decline from 5.9 per cent of GDP in 2009 to 3.6 per cent of GDP on 2011 and, further to 2.9 per cent of GDP in 2013. In practice, actual market conditions helped signifi cantly improve fi scal balance forecasts. Th e Law on Federal Budget for 2012–14 envisages reduction in defi cit to 1.6 per cent of GDP in 2013 and 0.7 per cent of GDP in 2014. Fiscal consolidation also featured prominently in the Budget Address of the President, which required elimination of federal budget defi cit by 2015. Apart from reducing the defi cit, a number of other important measures were taken in Russia to achieve medium- and long-term budget stability. In particular, it was decided to re-expand the Reserve Fund and to re-introduce fi scal rules (which were cancelled during the crisis) in 2015; the latter will be modifi ed taking into account the crisis experience.

18 the brics report
Already at the end of 2011, a substantial part of fi scal oil and gas revenues will be transferred to the Reserve Fund, which was sig-nifi cantly depleted during the crisis when it was the main source of fi nancing the government’s stimulus programme. In fact, most of the extra revenues (as compared to the original Law on Budget) result-ing from the favourable external conditions will be transferred there; only a small part has been used to increase expenditures. Expansion of the Reserve Fund is also planned for 2012–14. Currently, in Russia, there is an active discussion (in the framework of expert groups on the update of ‘2020 Strategy’) of new budgetary rules to be implemented in the near future. Th ese rules will likely put upper bounds on federal public expenditures depending on the external parameters and contribute to the medium- and long-term fi scal stability. In contrast to China, India, and Brazil, Russia being an oil-surplus economy has a surplus in general government accounts, driven mainly by a sharp rise in oil prices in recent years. India’s fi scal defi cit was the highest even before the emergence of the global fi nancial crisis (Table 1.9).
Table 1.9 Fiscal Defi cit of General Government (percentage of GDP)
Country 1998 2000 2006 2007 2008 2009 2010
1 2 3 4 5 6 7 8
Brazil –6.5 –3.84 –3.5 –2.36 –1.4 –3.1 –2.9
Russia –8.0 3.3 8.3 6.8 4.9 –6.3 –3.6
India –7.8 –9.3 –5.3 –4.0 –8.0 –10.0 –9.4
China –2.8 –3.3 –0.7 0.9 –0.4 –3.1 –2.6
South Africa – –1.5 0.8 1.4 –0.5 –5.2 –5.8
Source: IMF Database.Note: – Not available.

overview of brics 19
In some BRICs economies, the global economic slowdown has impacted on fi scal consolidation targets negatively. During 2008 and 2009, the fi scal position of all the BRICS economies worsened mainly due to countercyclical expansionary fi scal measures to aug-ment domestic demand. Even Russia, which had mostly managed its fi scal surplus in the recent past, saw a deterioration in the fi scal situation during 2009. Despite large fi scal expansionary measures in 2009, Brazil and China maintained better fi scal balance among the BRICS (Table 1.10). High and rising levels of gross debt imply signifi cant risks for the economy as demonstrated by the recent European debt crisis. In the long run, persistently high levels of public debt make economies more vulnerable to adverse shocks, reduce their long-run growth potential, and endanger the prospects for monetary stability. Among the BRICS, India and Brazil have the largest gross debt-to-GDP ratio at around 69 per cent and 66 per cent of GDP, respectively, in 2010 (Table 1.11). Looking ahead, with the current level of unemployment and frag-ile macroeconomic environment, fi scal consolidation in the years to come will be a challenge for the BRICS (Table 1.12). In the case of India, Brazil, and South Africa, in view of the gap in terms of socio-economic performance and widespread deprivation, carrying out required government fi scal consolidation is a major challenge. On balance, the consolidation of economic recovery in the BRICS, along with global economic recovery, would be crucial for moving towards fi scal consolidation. Th e planned composition of fi scal adjustment during 2010–15 diff ers among the BRICS economies. From the broad announce-ments made so far, it appears that India intends to rely on revenue measures, while Russia and South Africa foresee greater reliance on a

Tabl
e 1.
10
Fisc
al B
alan
ce o
f Gen
eral
Gov
ernm
ent
(per
cent
age
of G
DP)
Br
azil
Ru
ssia
In
dia
C
hina
So
uth
Afric
a
Year
Re
venu
e Ex
pend
iture
Re
venu
e Ex
pend
iture
Re
venu
e Ex
pend
iture
Re
venu
e Ex
pend
iture
Re
venu
e Ex
pend
iture
1 2
3 4
4 5
6 7
8 9
10
1998
27
.8
42.3
34
.6
42.5
16
.1
23.9
12
.1
14.9
–
–
2000
30
.4
35.3
36
.2
32.8
16
.6
26.0
13
.8
17.1
26
.3
27.9
2001
31
.3
37.2
36
.9
33.7
16
.6
26.1
15
.1
17.9
27
.4
27.8
2002
31
.9
39.5
37
.0
36.3
17
.1
26.4
15
.9
18.9
26
.4
27.5
2003
31
.4
39.2
36
.4
34.9
17
.5
26.1
16
.2
18.6
26
.6
29.0
2004
32
.2
37.6
36
.6
31.7
18
.2
25.4
16
.6
18.1
28
.1
29.9
2005
33
.4
39.2
41
.0
32.8
18
.4
24.8
17
.2
18.6
30
.1
29.9
2006
33
.4
39.4
39
.5
31.1
19
.4
24.7
18
.2
18.9
31
.6
30.4
2007
33
.9
38.3
39
.9
33.1
21
.0
25.0
19
.8
18.9
31
.8
30.5
2008
34
.1
38.0
38
.6
34.3
19
.7
27.2
19
.7
20.0
30
.7
30.9
2009
33
.1
39.3
34
.3
40.5
18
.9
28.5
20
.0
23.0
27
.3
32.4
2010
37
.4
40.3
35
.3
38.9
17
.5
26.5
20
.4
22.9
27
.5
33.3
Sour
ce: I
MF
Dat
abas
e.N
ote:
– N
ot a
vaila
ble.

Table 1.11 Gross Debt of General Government (percentage of GDP)
1998 2000 2006 2007 2008 2009 2010
1 2 3 4 5 6 7 8
Brazil – 66.7 66.7 65.2 64.1 68.9 66.1
Russia – 59.9 9.0 8.5 7.8 10.9 9.9
India 65.4 71.4 76 72.9 72.6 74.2 69.2
China 11.4 16.4 16.5 19.8 16.8 18.6 17.7
South Africa – 42.0 31.4 27.4 26.7 30.1 35.7
Source: IMF Database.Note: – Not available.
Table 1.12 Fiscal Consolidation Policy
Country Medium-term Fiscal Target
Brazil Fiscal consolidation is being carried out. Th e R$ 50 billion budget cut announced in March 2011 by the government derives from a review on net revenues, as well as cuts in expenses. Mandatory spending will be reduced by R$ 15.8 billion, whereas discretionary spending will be cut by R$ 34.3 billion during 2011. In order to make the former feasi-ble, the government has adopted a set of measures regarding payroll and hiring, unemployment and social benefi ts, as well as grants and subsidies. Public investment remains low by international standards but is expected to increase substantially under the Growth Acceleration Programme (PAC).
Russia Refl ecting a gradual unwinding of the anti-crisis package, in 2010 the general government defi cit was projected to improve by 3 per cent of GDP. Beyond 2010, the authori-ties’ 2010–12 federal government budget implies a steady decline in the non-oil balance by about 1–2 per cent of GDP a year to 9.5 per cent of GDP by 2012, mainly through lower spending on public administration and low-priority infrastructure projects, but also higher social security con-tributions. Over the longer term, the authorities plan to reduce the non-oil defi cit to their sustainable target of 4.7 per cent of GDP by 2013.
(Contd)

22 the brics report
India Gradual fi scal consolidation is envisaged by reducing the central government fi scal defi cit to 3 per cent of GDP by 2013–14. Th e planned reduction would be mainly revenue-driven, from higher growth and from measures to simplify the tax code, raise voluntary compliance, and reduce exemptions.
China Th e fi scal stimulus package is temporary with an explicit timeline through 2010. It was decided that China would continue with its proactive fi scal policy in 2011.
South Africa South Africa will continue to manage public fi nances in a countercyclical manner to support long-run fi scal sustain-ability. Th e narrowing of the consolidated government balance will continue over the medium-term expenditure framework. Th is will be done through a moderation in the growth of expenditure and a recovery in revenue in line with the economic cycle. Th e public sector will continue to support large-scale infrastructure projects to address transportation, water, and energy sector bottlenecks. Social income grants provide a safety net for the poor, while initia-tives to support job creation will be intensifi ed. Th e ratio of debt to GDP is expected to stabilize in 2015–16 before declining.
Table 1.12 (Contd)
Country Medium-term Fiscal Target
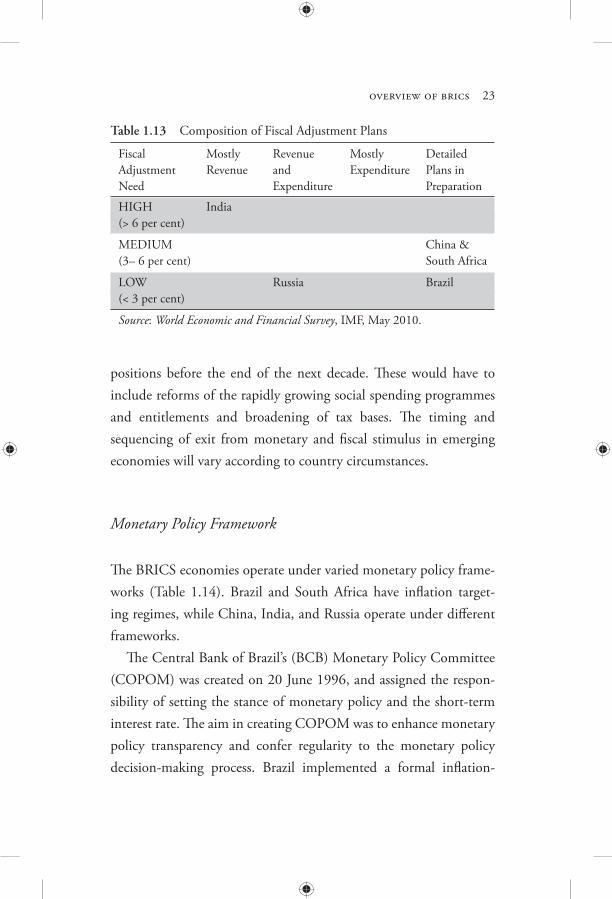
combination of revenue and expenditure management (Table 1.13). On the other hand, Brazil, which comes under the category of medium and low need of fi scal adjustment, has yet to lay out detailed plans. It was decided that China would continue its proactive fi scal policy to maintain economic growth and curb price rise in 2011. Once the growth process has recovered, the BRICS economies need to revert to a path of fi scal consolidation. As a result, demand should emanate from private sources, given the widespread roll-back of large fi scal defi cits. Th e most urgent challenge is to put in place credible fi scal consolidation plans to achieve sustainable fi scal
overview of brics 23
Table 1.13 Composition of Fiscal Adjustment Plans
Fiscal Mostly Revenue Mostly DetailedAdjustment Revenue and Expenditure Plans inNeed Expenditure Preparation
HIGH India(> 6 per cent)
MEDIUM China &(3– 6 per cent) South Africa
LOW Russia Brazil(< 3 per cent)
Source: World Economic and Financial Survey, IMF, May 2010.
positions before the end of the next decade. Th ese would have to include reforms of the rapidly growing social spending programmes and entitlements and broadening of tax bases. Th e timing and sequencing of exit from monetary and fi scal stimulus in emerging economies will vary according to country circumstances.
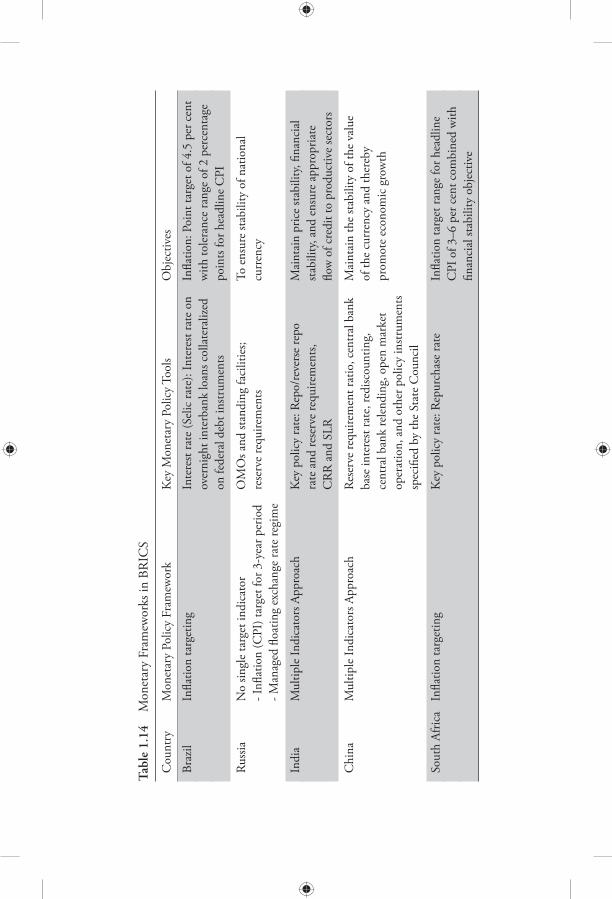
Monetary Policy Framework
Th e BRICS economies operate under varied monetary policy frame-works (Table 1.14). Brazil and South Africa have infl ation target-ing regimes, while China, India, and Russia operate under diff erent frameworks. Th e Central Bank of Brazil’s (BCB) Monetary Policy Committee (COPOM) was created on 20 June 1996, and assigned the respon-sibility of setting the stance of monetary policy and the short-term interest rate. Th e aim in creating COPOM was to enhance monetary policy transparency and confer regularity to the monetary policy decision-making process. Brazil implemented a formal infl ation-
Tabl
e 1.
14
Mon
etar
y Fr
amew
orks
in B
RIC
S
Cou
ntry
M
onet
ary
Polic
y Fr
amew
ork
Key
Mon
etar
y Po
licy
Tool
s O
bjec
tives
Braz
il In
fl atio
n ta
rget
ing
Inte
rest
rate
(Sel
ic ra
te):
Inte
rest
rate
on
Infl a
tion:
Poi
nt ta
rget
of 4
.5 p
er c
ent
over
nigh
t int
erba
nk lo
ans c
olla
tera
lized
w
ith to
lera
nce
rang
e of
2 p
erce
ntag
e
on
fede
ral d
ebt i
nstr
umen
ts po
ints
for h
eadl
ine
CPI
Russ
ia
No
singl
e ta
rget
indi
cato
r O
MO
s and
stan
ding
faci
litie
s;
To e
nsur
e sta
bilit
y of
nat
iona
l
- Infl
atio
n (C
PI) t
arge
t for
3-y
ear p
erio
d re
serv
e re
quire
men
ts cu
rren
cy
- Man
aged
fl oa
ting
exch
ange
rate
regi
me
Indi
a M
ultip
le In
dica
tors
App
roac
h K
ey p
olic
y ra
te: R
epo/
reve
rse
repo
M
aint
ain
pric
e sta
bilit
y, fi n
anci
al
ra
te a
nd re
serv
e re
quire
men
ts,
stabi
lity,
and
ensu
re a
ppro
pria
te
C
RR
and
SLR
fl o
w o
f cre
dit t
o pr
oduc
tive
sect
ors
Chi
na
Mul
tiple
Indi
cato
rs A
ppro
ach
Rese
rve
requ
irem
ent r
atio
, cen
tral
ban
k M
aint
ain
the
stabi
lity
of th
e va
lue
base
inte
rest
rate
, red
iscou
ntin
g,
of th
e cu
rren
cy a
nd th
ereb
y
ce
ntra
l ban
k re
lend
ing,
ope
n m
arke
t pr
omot
e ec
onom
ic g
row
th
op
erat
ion,
and
oth
er p
olic
y in
strum
ents
spec
ifi ed
by
the
Stat
e C
ounc
il
Sout
h Af
rica
Infl a
tion
targ
etin
g K
ey p
olic
y ra
te: R
epur
chas
e ra
te
Infl a
tion
targ
et ra
nge
for h
eadl
ine
C
PI o
f 3–6
per
cen
t com
bine
d w
ith
fi n
anci
al st
abili
ty o
bjec
tive
overview of brics 25
targeting framework for monetary policy in June 1999. Under this regime, COPOM’s monetary policy decisions have as their main objective the achievement of the infl ation targets set by the National Monetary Council (CMN). If infl ation breaches the target set by the CMN, the Governor of the Central Bank is required to write an open letter to the Minister of Finance explaining the reasons for missing the target, as well as measures required to bring infl ation back to the target, and the period over which these measures are expected to take eff ect. In Brazil the central bank’s main policy instrument is the overnight, inter-bank interest rate, called the Over-Selic rate. Th e target for the Over-Selic rate is set at regular meetings of the BCB’s Monetary Policy Committee (COPOM). Th e Open Market Operations Department (Demab) is responsible for carrying out open market operations to keep the Over-Selic rate as close as possible to the target established by COPOM. Since 2006, eight regular meetings of COPOM have been held, with each lasting for two days. Eight days after each meeting, the Committee releases the meeting minutes on the Central Bank’s web-site and to the press through the Central Bank’s press offi cer. At the end of each quarter (March, June, September, December), COPOM publishes the Central Bank’s Infl ation Report, which provides detailed information on economic conditions, as well as COPOM’s infl ation projections from its most recent meeting. Monetary policy, conducted by the Bank of Russia, is designed to maintain fi nancial stability and create conditions conducive to sustainable economic growth. In the 2000s, Russia’s monetary policy was geared at containing infl ation and smoothing fl uctuations of the nominal exchange rate. In the past few years the scaling down of interventions in the domestic foreign exchange market, the increased

26 the brics report
fl exibility of the exchange rate, and the gradual winding up of anti-crisis measures stimulated the role of interest rate policy in reducing infl ation. Th e principal objective of monetary policy over the next three years is to reduce infl ation to an annual rate of 5 per cent. At present monetary policy instruments used by the Bank of Russia are open market operations, standing facilities, and reserve requirements. Th e Bank of Russia infl uences interest rates through its open market operations and standing facilities: the upper limit of the interest rate corridor is the fi xed rate on overnight refi nancing operations (REPO and lombard loans) and the lower limit is the fi xed overnight deposit rate. Th e Bank of Russia has been implementing its exchange rate policy in the context of the managed fl oating regime, aimed at mitigating the eff ect of external shocks on the Russian economy. Th e opera-tional benchmark of the exchange rate policy is the rouble value of the bi-currency basket, currently consisting of 0.45 euro and 0.55 US dollar. Th e Bank of Russia uses the fl oating operational intra-day band of fl uctuations in the value of the bi-currency basket. As the monetary authority of the country, the Reserve Bank of India (RBI) formulates, implements, and monitors monetary policy with the objective of maintaining price stability and ensuring adequate fl ow of credit to productive sectors. Monetary policy in India evolved with increasing current and capital account liberalization, liberaliza-tion of the fi nancial sector, changing patterns of credit requirements of the real sector, and rapid changes in the world economic scenario. Th e operating procedure of monetary policy in terms of targets and instruments, therefore, saw substantial changes. Th e twin objectives of monetary policy, that is, maintaining price stability and ensuring availability of adequate credit to productive sectors of the economy to support growth, have remained unchanged,

overview of brics 27
though their relative emphasis varied depending on the circum-stances. In line with this, in recent years, a preference emerged for a soft and fl exible interest rate environment within the framework of macroeconomic stability. Th e use of broad money as an intermediate target has been de-emphasised, but the growth in broad money (M3) continues to be used as an important indicator of monetary policy. A multiple-indicators approach was adopted in 1998–9, wherein inter-est rates or rates of return in diff erent markets (that is, money, capital, and government securities markets) along with high frequency data on currency, credit extended by banks and fi nancial institutions, fi scal position, trade, capital fl ows, infl ation rate, exchange rate, refi nanc-ing and transactions in foreign exchange are juxtaposed with output data to draw policy perspectives. With the increasing market orientation of the fi nancial structure and deregulation of the operations of commercial banks, the RBI has restructured its armoury of instruments with direct instruments gradually giving way to indirect ones. Th e thrust of monetary policy in recent years has been to develop an array of instruments to trans-mit liquidity and interest rate signals in the short term in a more fl exible and bi-directional manner. A Liquidity Adjustment Facility (LAF) was introduced in June 2000 to modulate short-term liquidity and signal short-term interest rates. Th e LAF operates through repo and reverse repo auctions, thereby setting a corridor for the short-term interest rate consistent with policy objectives. Th e RBI is able to modulate the large market borrowing programme by combining strategic devolvement/private placement of government securities with active open market operations. In China, the objective of the monetary policy is to maintain the stability of the value of the currency and thereby promote economic growth. Th e monetary policy instruments applied by the People’s

28 the brics report
Bank of China (PBC) include the reserve requirement ratio, central bank base interest rate, rediscounting, central bank lending, open market operations, and other policy instruments specifi ed by the State Council. Th e Monetary Policy Committee in China plays an important role in macroeconomic management and in the formulation and adjust-ment of monetary policy. Th e responsibilities, composition, and working procedures of the Committee are prescribed by the State Council. Th e rules of the Committee stipulate that it is a consultative body responsible for the formulation of monetary policy by the PBC; its responsibilities are to advise on the formulation and adjustment of monetary policy and policy targets for a certain period, application of monetary policy instruments and major monetary policy measures, and coordination between monetary policy and other macroeco-nomic policies. Th e Committee plays its advisory role based on comprehensive research on macroeconomic situations and the macro targets set by the government. Th e Committee performs its functions through regular quarterly meetings. An ad hoc meeting is held in case it is proposed by the Chairman or endorsed by more than one-third of the members of the Monetary Policy Committee. Th e mandate of the South African Reserve Bank (SARB) is defi ned in the Constitution of the Republic of South Africa as ‘the protection of the value of the currency in the interest of balanced and sustainable economic growth in the Republic’. Deriving from this constitutional mandate, the Bank regards its primary goal in the South African economic system as ‘the achievement and maintenance of price stability’. Infl ation targeting was adopted as a framework for monetary policy in February 2000 with the aim of achieving and maintaining headline CPI infl ation within a range of 3–6 per cent on a continuous basis.

overview of brics 29
Th e government sets the infl ation target in consultation with the Reserve Bank. Th e monetary policy committee (MPC) meets at least six times per year. Decisions are announced immediately after the meeting at a televised press conference and the MPC statement is published on SARB’s website. Th e minutes are not published, but the bi-annual Monetary Policy Review discusses factors infl uencing infl ation and risks to the outlook. SARB engages directly with the public twice a year at Monetary Policy Forums that are held in major centres around the country. In addition, the Governor of SARB appears before the Parliament’s Portfolio Committee on Finance at least three times a year. Th e SARB implements infl ation targeting in a fl exible and forward-looking manner taking cognisance of external shocks to the economy, as well as other factors such as changes in the output gap and domestic imbalances. Financial stability is also an important objective of SARB. SARB has also focused on maintaining and improving its domestic market operations. Liquidity in the domestic and inter-national interbank markets is carefully monitored. Although contingency plans were put in place and communicated to the banking counterparties, it was not necessary to provide any addi-tional or special liquidity to domestic banks beyond the normal daily operations during the global fi nancial crisis and subsequent recession. Th e MPC takes cognisance of movements in the exchange rate and their potential impact on infl ation in determining policy rates. However, the rand is a freely fl oating exchange rate and SARB does not try to infl uence the level of the currency. Interventions, if any, are aimed at smoothing out excessive currency volatility in the short term through open-market operations. Over the past few years, reserve

30 the brics report
accumulation has been necessary to reduce South Africa’s external vulnerability in the face of a rising current account defi cit.
Price Situation
Over the past few years, large fl uctuations in the prices of indus-trial and agricultural commodities combined with volatile exchange rates have increased the volatility of infl ation in BRICS economies, particularly India, China, and South Africa (Table 1.15). Among the BRICS, Russia, Brazil, and South Africa received the direct positive impact of high commodity prices, while they acted as constraints on growth for China and India. In the second half of 2010, central banks grappled with the balancing act of anchoring high infl ation along with managing fragile economic growth.
Table 1.15 Infl ation: Average Consumer Prices(per cent change)
Country 2000 2005 2006 2007 2008 2009 2010
1 2 3 4 5 6 7 8
Brazil 7.1 6.9 4.2 3.6 5.7 4.9 5.0
Russia 20.8 12.7 9.7 9.0 14.1 11.7 6.9
India 4.0 4.2 6.2 6.4 8.3 10.9 13.2
China 0.4 1.8 1.5 4.8 5.9 –0.7 3.3
South Africa 5.4 3.4 4.7 7.1 11.5 7.1 4.3
Source: IMF.
External Sector
Global integration of most of the emerging market economies, in general, and the BRICS in particular, gained momentum in the

overview of brics 31
1990s, mainly on account of the structural adjustments adopted by these economies. Th e fi nancial sector developments in these econo-mies enhanced trade and capital fl ows along with increased technol-ogy transfers and mobility of labour. Increased global integration is highly visible in terms of the openness of the BRICS economies through higher share in global trade and other fi nancial fl ows, which enhanced the growth potentials of these economies (Table 1.16). Integration changed the course of development of the BRICS econo-mies through active management of their external liabilities and assets across segments. Th is resulted in minimizing external sector vulnerabilities, which helped the BRICS economies withstand the recent global fi nancial crisis and its aftershocks.
Merchandise Trade and Invisible Flows
Th e share of the BRICS in global trade continued to grow at a rapid pace. Th eir share in world exports increased substantially over the past decade mostly through broad-based diversifi cation, both in commodities and regions of trade, while imports witnessed a sharp rise that was driven by increased investment and consumption demand led by the increasing purchasing power of these economies (Table 1.17).
brics exports
All the BRICS economies maintained persistent trends of rising share of exports in GDP, refl ecting the structural transitions witnessed by these economies in exploring avenues for exports based on compara-tive advantage and supported by productivity gains (Table 1.18).

Tabl
e 1.
16
Glo
bal I
nteg
ratio
n of
BR
ICS
Econ
omie
s
Sh
are
in
Trad
e C
urre
nt
Fore
x Re
serv
es
Exte
rnal
Deb
t D
ebt S
ervi
ce
Wor
ld T
rade
O
penn
ess
Acco
unt B
alan
ce
(per
cen
t (U
S$ b
illio
n)
Rat
io
(per
cen
t of G
DP)
of
GD
P)
Cou
ntry
19
90
2010
19
90
2010
19
90
2010
19
90
2010
19
90
2009
19
90
2009
1 2
3 4
5 6
7 8
9 10
11
12
13
Braz
il 0.
8 1.
2 6.
9 11
.2
0.8
–2.3
1.
5 13
.7
119.
7 27
6.9
22.5
23
.4
Russ
ia
– 2.
3 –
30.3
–
4.9
0.0
30.4
–
381.
3 4.
4 17
.7
Indi
a 0.
5 1.
8 6.
9 21
.7
–1.2
–3
.2
0.5
18.0
85
.7
237.
7 34
.9
5.9
Chi
na
1.6
9.2
17.4
29
.5
1.3
5.2
7.6
48.8
55
.3
428.
4 11
.7
2.9
Sout
h Af
rica
0.6
0.5
24.3
27
.9
1.4
–2.8
0.
9 10
.7
23.3
42
.1
– 9.
3
Sour
ce: I
MF,
UN
CTA
D, a
nd W
orld
Ban
k.
Not
e: –
Not
ava
ilabl
e.

overview of brics 33
Th e composition of BRICS exports changed drastically over the past two decades due to structural changes across the sectors of these economies during the period. Th ough the BRICS are still known for exports of natural resources, these economies moved from being exporters of primary products to exporters of manufactured prod-ucts. Likewise, their export destinations have undergone dramatic changes in response to globalization and liberalization which, in turn, helped the BRICS increase their share in global trade (Table 1.19).
Table 1.18 BRICS Exports of Goods and Services(per cent of GDP)
Country 1990 1995 2000 2005 2008 2009 2010
Brazil 6.9 6.8 10.1 15.1 13.8 11.3 11.2
Russia – 29.8 44.3 35.2 31.5 28.2 30.3
India 6.9 10.2 12.3 18.8 23.7 20.1 21.7
China 17.4 23.1 23.3 37.1 34.9 26.7 29.5
South Africa 24.3 22.8 27.8 27.4 35.9 27.7 27.9
Source: UNCTAD.Note: – Not available.
Table 1.17 BRICS Share of Global Trade(per cent)
1990 1995 2000 2005 2008 2009 2010
BRICS 3.6 6.0 7.0 11.2 13.6 13.7 15.0
Brazil 0.8 0.8 0.8 1.0 1.1 1.1 1.2
Russia – 1.5 1.4 2.1 2.6 2.2 2.3
India 0.5 0.6 0.7 1.2 1.5 1.6 1.8
China 1.6 2.6 3.5 6.4 7.9 8.3 9.2
South Africa 0.6 0.5 0.5 0.5 0.5 0.5 0.5
Source: UNCTAD.Note: – Not available.

34 the brics report
Table 1.19 BRICS Share in World Exports
1990 1995 2000 2005 2008 2009 2010
BRICS 3.9 6.5 7.5 12.2 14.8 15.1 16.3
Brazil 0.9 0.9 0.9 1.1 1.2 1.2 1.3
Russia – 1.6 1.6 2.3 2.9 2.4 2.6
India 0.5 0.6 0.7 0.9 1.2 1.3 1.4
China 1.8 2.9 3.9 7.3 8.9 9.6 10.4
South Africa 0.7 0.6 0.5 0.5 0.5 0.5 0.6
Source: UNCTAD.Note: – Not available.
Despite the fact that all the BRICS economies having signifi cant human capital endowments, the diff erence in their resource endow-ments are refl ected in their export baskets. For instance, manufac-tures account for 93.6 per cent of total merchandise exports from China in contrast to 66.0 and 51.8 per cent from India and South Africa, respectively, while it is 38.0 per cent of Brazilian exports and 21.1 per cent of Russian exports. Russia’s export basket is dominated by fuel and mining exports (nearly 70 per cent), while agriculture products, fuel, and mining products account for nearly 60 per cent of exports from Brazil. South Africa’s emergence has coincided with the rise of other emerging markets in Africa. Th e demand for South Africa’s manufactured commodities (nearly 51.8 per cent) have boosted the countries exports and, subsequently, economic growth (Table 1.20). Structural developments across sectors in BRICS economies during the past two decades are more visible in technological devel-opments, which may also be responsible for the changes in the com-position and destination of BRICS exports. Th is is revealed by the share of high-technology goods in the export baskets, which have registered an increasing trend (Table 1.21).

Tab
le 1
.20
BR
ICS
Expo
rts P
rofil
e, 2
009
Cou
ntry
M
erch
andi
se
Shar
e in
S
hare
by
Com
mod
ity
Expo
rts
Wor
ld
Agri-
Fu
els a
nd
Man
u-
Shar
e by
Des
tinat
ion
(U
S$
Tota
l cu
ltura
l M
inin
g fa
ctur
es
billi
on)
Expo
rts
Prod
ucts
Pro
duct
s
1 2
3 4
5 6
7 8
9 10
11
Braz
il 15
3.0
1.2
37.
7 2
1.3
38.0
EU
C
hina
U
S Ar
gent
ina
Japa
n
(2
2.3)
(1
3.2)
(1
0.3)
(8
.4)
(2.8
)
Russ
ia*
303.
4 2.
5 6.
9 69
.0
21.1
EU
Be
laru
s C
hina
T
urke
y U
krai
ne
(5
2.7)
(5
.5)
(5.5
) (5
.4)
(4.6
)
Indi
a 16
4.9
1.3
10.
2 2
0.6
66.0
EU
U
AE
US
Chi
na
Hon
g K
ong
SAR
, Chi
na
(2
0.5)
(1
4.4)
(1
0.8)
(5
.9)
(4.0
)
Chi
na
1,20
1.6
9.6
3.4
2.9
93.6
EU
U
S H
ong
Kon
g Ja
pan
Rep
. Kor
ea
SA
R, C
hina
(19.
7)
(18.
4)
(13.
8)
(8.1
) (4
.5)
Sout
h Af
rica
61.7
0.
5 10
.7
34.8
51
.8
EU
Chi
na
US
Japa
n Sw
itzer
land
(26.
5)
(10.
5)
(9.0
) (7
.6)
(4.2
)
Sour
ce o
f sta
tistic
s: W
TO
.N
ote:
* N
atio
nal a
ccou
nts d
ata.
9780198085386 Brics Report_01_Ch-01.indd 359780198085386 Brics Report_01_Ch-01.indd 35 26/03/12 12:50 PM26/03/12 12:50 PM
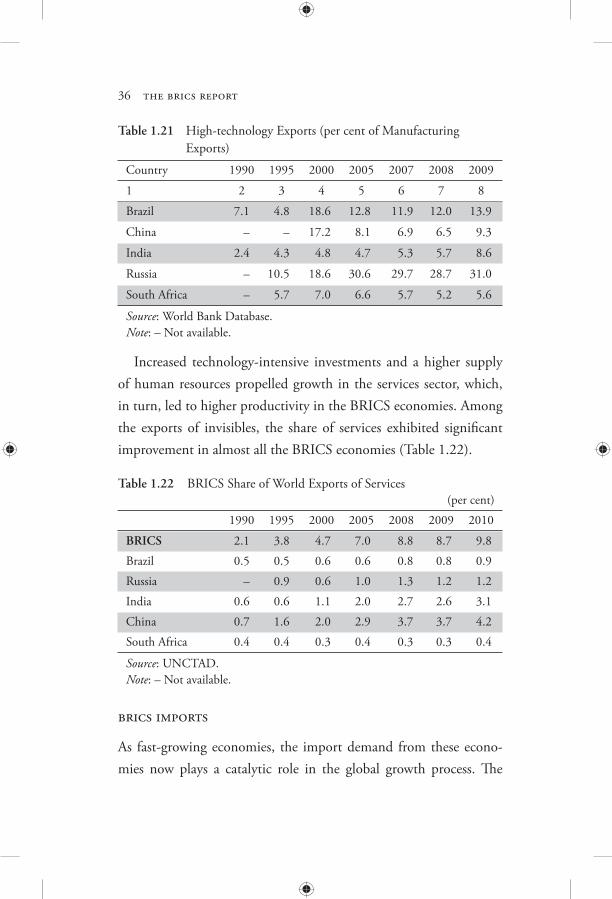
36 the brics report
Table 1.21 High-technology Exports (per cent of Manufacturing Exports)
Country 1990 1995 2000 2005 2007 2008 2009
1 2 3 4 5 6 7 8
Brazil 7.1 4.8 18.6 12.8 11.9 12.0 13.9
China – – 17.2 8.1 6.9 6.5 9.3
India 2.4 4.3 4.8 4.7 5.3 5.7 8.6
Russia – 10.5 18.6 30.6 29.7 28.7 31.0
South Africa – 5.7 7.0 6.6 5.7 5.2 5.6
Source: World Bank Database.Note: – Not available.
Increased technology-intensive investments and a higher supply of human resources propelled growth in the services sector, which, in turn, led to higher productivity in the BRICS economies. Among the exports of invisibles, the share of services exhibited signifi cant improvement in almost all the BRICS economies (Table 1.22).
Table 1.22 BRICS Share of World Exports of Services (per cent)
1990 1995 2000 2005 2008 2009 2010
BRICS 2.1 3.8 4.7 7.0 8.8 8.7 9.8
Brazil 0.5 0.5 0.6 0.6 0.8 0.8 0.9
Russia – 0.9 0.6 1.0 1.3 1.2 1.2
India 0.6 0.6 1.1 2.0 2.7 2.6 3.1
China 0.7 1.6 2.0 2.9 3.7 3.7 4.2
South Africa 0.4 0.4 0.3 0.4 0.3 0.3 0.4
Source: UNCTAD.Note: – Not available.
brics imports
As fast-growing economies, the import demand from these econo-mies now plays a catalytic role in the global growth process. Th e

overview of brics 37
diversifi cation in the composition of exports from primary to manu-factured products, mostly in the form of value additions, requires large imports (Table 1.23).
Table 1.23 Imports of Goods and Services (per cent of GDP)
Country 1990 1995 2000 2005 2008 2009 2010
1 2 3 4 5 6 7 8
Brazil 5.6 8.2 11.0 10.8 13.0 10.6 11.4
Russia – 26.7 23.7 21.7 22.3 20.9 22.1
India 8.5 11.5 13.9 22.1 30.5 25.0 26.4
China 13.7 20.2 20.3 30.6 26.5 21.7 24.9
South Africa 18.6 22.8 25.3 28.9 38.3 29.4 24.9
BRICS: Share in World Imports
BRICS 3.3 6.1 6.2 10.0 12.5 13.3 14.8
Brazil 0.6 1.0 0.9 0.7 1.1 1.1 1.3
Russia – 1.3 0.7 1.3 2.0 1.7 1.8
India 0.7 0.7 0.8 1.3 2.0 2.0 2.1
China 1.5 2.5 3.4 6.1 6.9 8.0 9.1
South Africa 0.5 0.6 0.5 0.6 0.6 0.6 0.5
Source: UNCTAD.Note: – Not available.
Th e major chunk of BRICS economies’ import basket consists of capital goods, indicating the process of large-scale industrialization in these economies which is also refl ected in their changed composition of commodity exports (Table 1.24). Th e BRICS’ imports of services have also grown, refl ecting the increasingly broad-based nature of growth achieved by these econo-mies over the past decades. As in the case of demand for commodity imports, large-scale industrialization and the increased emphasis on

Tab
le 1
.24
BR
ICS
Impo
rts P
rofil
e, 2
009
Cou
ntry
M
erch
andi
se
Shar
e in
S
hare
by
Com
mod
ity
Impo
rts
Wor
ld
Agri-
Fu
els a
nd
Man
u-
Shar
e by
Orig
in
(US$
To
tal
cultu
ral
Min
ing
fact
ures
bi
llion
) Im
port
s Pr
oduc
ts P
rodu
cts
1 2
3 4
5 6
7 8
9 10
11
Braz
il 13
3.7
1.1
6.4
17.6
75
.9
EU
US
Chi
na
Arge
ntin
a Ja
pan
(22.
9)
(15.
8)
(12.
5)
(8.8
) (4
.2)
Russ
ia
191.
8 1.
5 15
.2
3.8
79.8
EU
C
hina
U
S U
krai
ne
Japa
n
(4
5.9)
(1
3.4)
(5
.4)
(5.3
) (4
.2)
Indi
a 25
7.2
2.0
5.6
37.6
46
.6
EU
Chi
na
UAE
U
S Sa
udi A
rabi
a
(1
4.4)
(1
1.5)
(7
.4)
(6.0
) (5
.4)
Chi
na
1,00
5.9
7.9
7.6
24.9
67
.1
Japa
n EU
R
ep. o
f H
ong
Kon
g
Tai
wan
,
(1
3.0)
(1
2.7)
K
orea
SA
R, C
hina
Pr
ovin
ce o
f
C
hina
(1
0.2)
(8
.6)
(8.5
)
Sout
h Af
rica
73.2
0.
6 7.
4 23
.3
68.3
EU
C
hina
U
S Sa
udi A
rabi
a Ja
pan
(32.
2)
(13.
1)
(7.8
) (5
.0)
(4.9
)
Sour
ce o
f sta
tistic
s: W
TO
.
9780198085386 Brics Report_01_Ch-01.indd 389780198085386 Brics Report_01_Ch-01.indd 38 26/03/12 12:50 PM26/03/12 12:50 PM
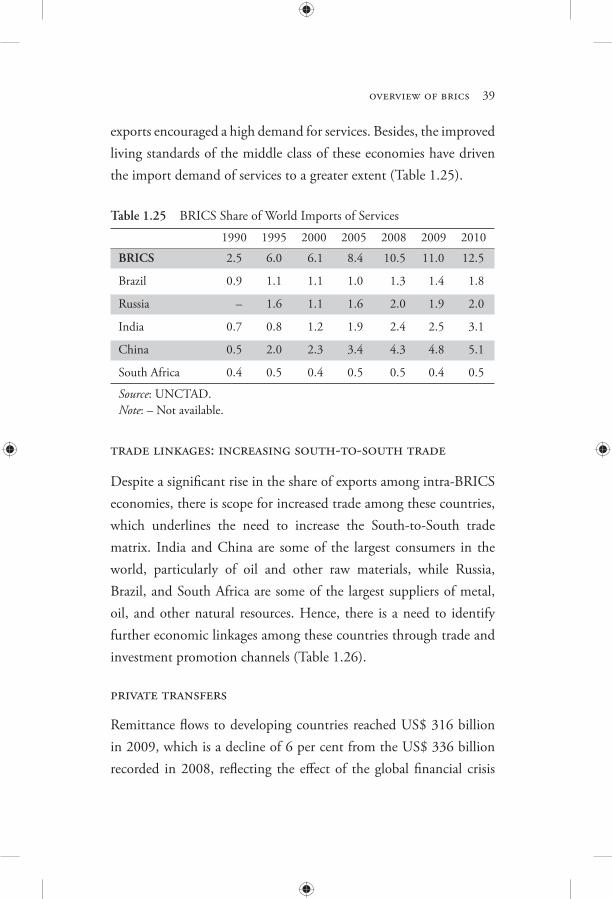
overview of brics 39
exports encouraged a high demand for services. Besides, the improved living standards of the middle class of these economies have driven the import demand of services to a greater extent (Table 1.25).
Table 1.25 BRICS Share of World Imports of Services
1990 1995 2000 2005 2008 2009 2010
BRICS 2.5 6.0 6.1 8.4 10.5 11.0 12.5
Brazil 0.9 1.1 1.1 1.0 1.3 1.4 1.8
Russia – 1.6 1.1 1.6 2.0 1.9 2.0
India 0.7 0.8 1.2 1.9 2.4 2.5 3.1
China 0.5 2.0 2.3 3.4 4.3 4.8 5.1
South Africa 0.4 0.5 0.4 0.5 0.5 0.4 0.5
Source: UNCTAD.Note: – Not available.
trade linkages: increasing south-to-south trade
Despite a signifi cant rise in the share of exports among intra-BRICS economies, there is scope for increased trade among these countries, which underlines the need to increase the South-to-South trade matrix. India and China are some of the largest consumers in the world, particularly of oil and other raw materials, while Russia, Brazil, and South Africa are some of the largest suppliers of metal, oil, and other natural resources. Hence, there is a need to identify further economic linkages among these countries through trade and investment promotion channels (Table 1.26).
private transfers
Remittance fl ows to developing countries reached US$ 316 billion in 2009, which is a decline of 6 per cent from the US$ 336 billion recorded in 2008, refl ecting the eff ect of the global fi nancial crisis

Tabl
e 1.
26
Expo
rt L
inka
ges o
f BR
ICS
(US$
bill
ion)
Expo
rts f
rom
Rus
sia
Braz
il C
hina
In
dia
Sout
h Af
rica
Adva
nced
Eco
nom
ies
Euro
Are
a19
90
– –
– –
– –
2000
0.
6 5.
2 1.
1 0.
03
60.6
34
.120
09
1.4
16.1
4.
8 0.
2 13
8.1
92.3
Expo
rts f
rom
Indi
a Br
azil
Chi
na
Russ
ia
Sout
h Af
rica
Adva
nced
Eco
nom
ies
Euro
Are
a 19
90
0.0
0.0
– 0.
0 11
.1
3.0
2000
0.
3 0.
8 0.
9 0.
3 27
.4
7.6
2009
2.
2 10
.2
0.9
1.9
79.0
26
.3Ex
port
s fro
m C
hina
Br
azil
Indi
a Ru
ssia
So
uth
Afric
a Ad
vanc
ed E
cono
mie
s Eu
ro A
rea
1990
0.
1 0.
2 –
0.0
52.0
5.
120
00
1.2
1.6
2.2
1.0
208.
3 30
.620
09
15.9
29
.7
17.5
7.
4 85
8.5
174.
4Ex
port
s fro
m B
razil
C
hina
In
dia
Russ
ia
Sout
h Af
rica
Adva
nced
Eco
nom
ies
Euro
Are
a 19
90
0.4
0.2
– 0.
2 22
.9
8.1
2000
1.
1 0.
38
0.4
0.3
34.6
13
.020
09
21.0
3.
4 25
1.
3 65
.1
28.5
Expo
rts f
rom
Sou
th A
frica
C
hina
In
dia
Russ
ia
Braz
il Ad
vanc
ed E
cono
mie
s Eu
ro A
rea
1990
–
– –
– –
–20
00
0.3
0.4
0.03
0.
2 15
.7
6.2
2009
5.
6 2.
0 0.
2 0.
4 30
.9
10.7
Sour
ce: D
irecto
ry o
f Tra
de S
tatis
tics,
IMF.
Not
e: –
Not
ava
ilabl
e.

overview of brics 41
on remittances. Th e contribution of private transfers in the BRICS also varies widely among member countries. India and China remain as the top two recipients of global remittances in 2009, with US$ 49 billion and US$ 48 billion, respectively. For India, with an increas-ing current account defi cit, remittances play a cushioning role. Russia tops the list of emerging market economies in terms of money trans-fer outfl ows; calculated on the basis of balance of payments data, the value of remittances from Russia in 2009 stood at US$ 19 billion, or 7 per cent of the world’s total remittances. Unlike other private capital fl ows, remittances maintained a consistent increasing trend at least in the cases of India and China, while it showed a declining trend in Russia and Brazil (Table 1.27).
Table 1.27 BRICS Share in Global Remittance Infl ows(per cent)
1990 1995 2000 2005 2007 2008 2009 Remittances to GDP Ratio
Brazil 0.8 3.3 1.2 1.3 1.1 1.1 1.0 0.3
Russia 0.0 2.5 1.0 1.1 1.2 1.4 1.3 0.4
India 3.5 6.1 9.8 8.1 9.7 11.3 11.9 3.9
China 0.3 0.9 4.0 8.8 10.1 10.9 11.5 1.0
South Africa 0.2 0.1 0.3 0.2 0.2 0.2 0.2 0.3
Source: World Bank.
current account
Th e performance of the BRICS on the external front, as refl ected in the current account, varied widely over the years as well as among the countries. China experienced an increase in its current account surplus prior to the crisis that moderated thereafter, while the current account surplus of Russia has declined over time. India, South Africa, and Brazil have been running current account defi cits (Table 1.28).

Tabl
e 1.
28
Trad
e Ba
lanc
e an
d C
urre
nt A
ccou
nt B
alan
ce(p
er c
ent o
f GD
P)
Tr
ade
Bala
nce*
Cur
rent
Acc
ount
Bal
ance
Cou
ntry
19
90
2000
20
08
2009
20
10
1990
20
00
2008
20
09
2010
1 2
3 4
5 6
7 8
9 10
11
BR
ICS
Braz
il 1.
4 –0
.9
0.8
0.7
–0.2
–0
.7
–3.8
–1
.7
–1.5
–2
.3
Russ
ia
– 20
.7
9.2
7.3
8.3
0.0
18.0
6.
2 4.
1 4.
9
Indi
a –1
.6
–1.6
–6
.7
–4.9
–4
.8
–2.4
–1
.0
–2.0
–2
.8
–3.2
Chi
na
3.7
3.1
8.3
5.0
4.6
3.1
1.7
9.6
6.0
5.2
Sout
h Af
rica
6.3
3.4
7.0
–5.8
–7
.3
1.4
–0.1
–7
.1
–4.1
–2
.8
Adv
ance
d Ec
onom
ies
Japa
n 0.
9 1.
8 1.
2 1.
1 2.
1 1.
5 2.
6 3.
2 2.
8 3.
6
Uni
ted
Stat
es
–0.9
–3
.1
–3.8
–2
.0
–2.6
–1
.4
–4.2
–4
.7
–2.7
–3
.2
Sour
ce: U
NC
TAD
and
IMF.
N
ote:
– N
ot a
vaila
ble.
* G
oods
and
serv
ices
.
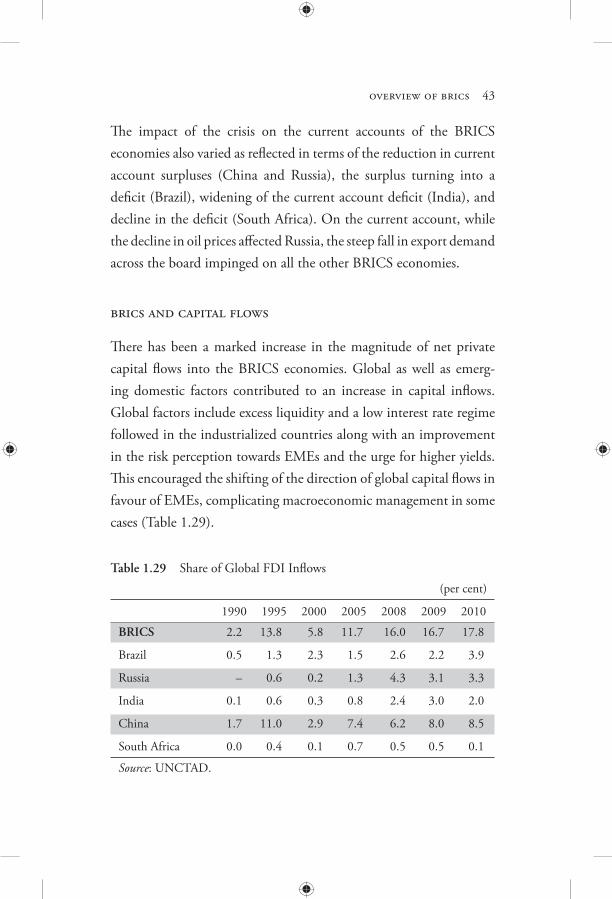
overview of brics 43
Th e impact of the crisis on the current accounts of the BRICS economies also varied as refl ected in terms of the reduction in current account surpluses (China and Russia), the surplus turning into a defi cit (Brazil), widening of the current account defi cit (India), and decline in the defi cit (South Africa). On the current account, while the decline in oil prices aff ected Russia, the steep fall in export demand across the board impinged on all the other BRICS economies.
brics and capital flows
Th ere has been a marked increase in the magnitude of net private capital fl ows into the BRICS economies. Global as well as emerg-ing domestic factors contributed to an increase in capital infl ows. Global factors include excess liquidity and a low interest rate regime followed in the industrialized countries along with an improvement in the risk perception towards EMEs and the urge for higher yields. Th is encouraged the shifting of the direction of global capital fl ows in favour of EMEs, complicating macroeconomic management in some cases (Table 1.29).
Table 1.29 Share of Global FDI Infl ows(per cent)
1990 1995 2000 2005 2008 2009 2010
BRICS 2.2 13.8 5.8 11.7 16.0 16.7 17.8
Brazil 0.5 1.3 2.3 1.5 2.6 2.2 3.9
Russia – 0.6 0.2 1.3 4.3 3.1 3.3
India 0.1 0.6 0.3 0.8 2.4 3.0 2.0
China 1.7 11.0 2.9 7.4 6.2 8.0 8.5
South Africa 0.0 0.4 0.1 0.7 0.5 0.5 0.1
Source: UNCTAD.

44 the brics report
Within private capital fl ows to the BRICS, FDI witnessed a sub-stantial increase together with the high presence of portfolio fl ows, especially debt fl ows, over the past decade. Portfolio debt fl ows moderated in general, while equity fl ows remained volatile on cues of global and domestic growth perceptions. Unlike portfolio fl ows, net FDI fl ows to the BRICS remained steady even during the recent crisis, refl ecting the longer-term view on the growth potentials of the BRICS and the soundness of their fi nancial systems (Table 1.30). Outfl ows of FDI from these economies also increased, taking advan-tage of the attractive investment opportunities abroad with a view to acquiring new technologies and natural resources. In contrast to FDI fl ows, portfolio fl ows to developing and emerg-ing market economies were driven by global risk factors. Th e liberal policy approach towards equity infl ows and technological advances witnessed in the BRICS equity markets resulted in a heightened concentration of global portfolio fl ows (Table 1.31).
foreign exchange reserves
All BRICS economies witnessed signifi cant accumulation of inter-national reserves through the past decade, barring some moderation during periods of the global fi nancial crisis. Th e reserve accumulation of the BRICS can be viewed as a measure of insurance against future crises. As a result the BRICS’ share in global international reserves increased remarkably during the current decade (Table 1.32).
external debt
Th e total external debt of the BRICS economies has increased signifi -cantly over the years. Although the volume of BRICS’ external debt showed an increase, its magnitude declined in general, barring the recent crisis period, as in the case of India (Table 1.33).

Tabl
e 1.
30
Cro
ss-c
ount
ry M
ovem
ent o
f FD
I Flo
ws
(US$
bill
ion)
Cou
ntry
FDI I
nfl o
ws
F
DI O
utfl o
ws
19
90
2000
20
05
2007
20
08
2009
20
10
1990
20
00
2005
20
07
2008
20
09
2010
1 2
3 4
5 6
7 8
9 10
11
12
13
14
15
BR
ICS
Braz
il 1.
0 32
.8
15.1
34
.6
45.1
25
.9
48.4
0.
6 2.
3 2.
5 7.
1 20
.5
–10.
1 11
.5
Russ
ia
0.0
2.7
12.9
55
.1
75.0
36
.5
41.2
–
3.2
12.8
45
.9
55.6
43
.7
51.7
Indi
a 0.
2 3.
6 7.
6 25
.3
42.5
35
.6
24.6
0.
0 0.
5 3.
0 17
.2
19.4
15
.9
14.6
Chi
na
3.5
40.7
72
.4
83.5
10
8.3
95.0
10
5.7
0.8
0.9
12.3
22
.5
52.2
56
.5
68.0
Sout
h Af
rica
–0.1
0.
9 6.
6 5.
7 9.
0 5.
4 1.
6 0.
0 0.
3 0.
9 3.
0 –3
.1
1.2
0.5
Adv
ance
d Ec
onom
ies
Japa
n 1.
8 8.
3 2.
8 22
.5
24.4
11
.9
–1.3
50
.8
31.6
45
.8
73.5
12
8.0
74.7
56
.3
UK
30
.5
118.
8 17
6.0
196.
4 91
.5
71.1
45
.9
17.9
23
3.4
80.8
27
2.4
161.
1 44
.4
11.0
US
48.4
31
4.0
104.
8 21
6.0
306.
4 15
2.9
228.
2 31
.0
142.
6 15
.4
393.
5 30
8.3
282.
7 32
8.9
Sour
ce: U
NC
TAD
. N
ote:
– N
ot a
vaila
ble.
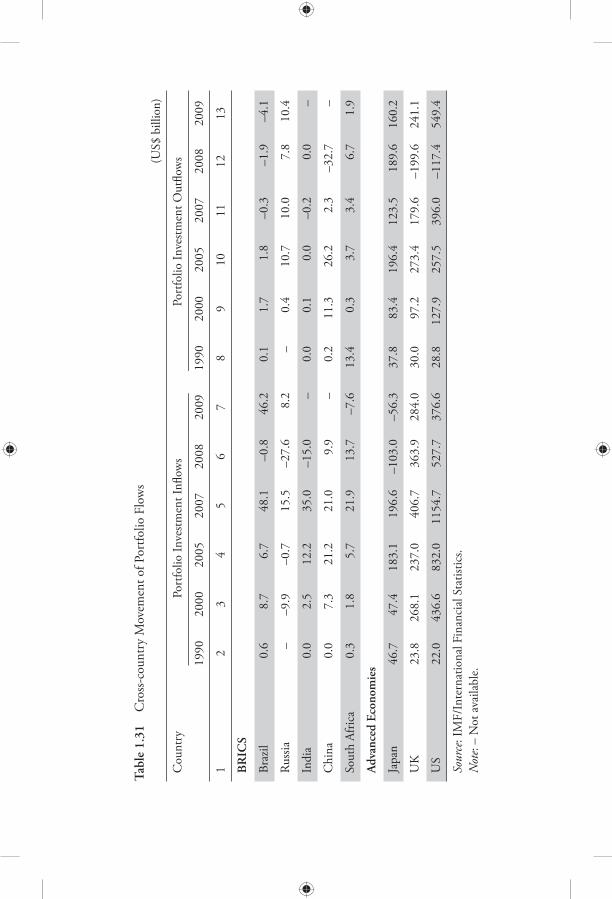
Tabl
e 1.
31
Cro
ss-c
ount
ry M
ovem
ent o
f Por
tfolio
Flo
ws
(US$
bill
ion)
Cou
ntry
Po
rtfo
lio In
vestm
ent I
nfl o
ws
Port
folio
Inve
stmen
t Out
fl ow
s
19
90
2000
20
05
2007
20
08
2009
19
90
2000
20
05
2007
20
08
2009
1 2
3 4
5 6
7 8
9 10
11
12
13
BR
ICS
Braz
il 0.
6 8.
7 6.
7 48
.1
–0.8
46
.2
0.1
1.7
1.8
–0.3
–1
.9
–4.1
Russ
ia
– –9
.9
–0.7
15
.5
–27.
6 8.
2 –
0.4
10.7
10
.0
7.8
10.4
Indi
a 0.
0 2.
5 12
.2
35.0
–1
5.0
– 0.
0 0.
1 0.
0 –0
.2
0.0
–
Chi
na
0.0
7.3
21.2
21
.0
9.9
– 0.
2 11
.3
26.2
2.
3 –3
2.7
–
Sout
h Af
rica
0.3
1.8
5.7
21.9
13
.7
–7.6
13
.4
0.3
3.7
3.4
6.7
1.9
Adv
ance
d Ec
onom
ies
Japa
n 46
.7
47.4
18
3.1
196.
6 –1
03.0
–5
6.3
37.8
83
.4
196.
4 12
3.5
189.
6 16
0.2
UK
23
.8
268.
1 23
7.0
406.
7 36
3.9
284.
0 30
.0
97.2
27
3.4
179.
6 –1
99.6
24
1.1
US
22.0
43
6.6
832.
0 11
54.7
52
7.7
376.
6 28
.8
127.
9 25
7.5
396.
0 –1
17.4
54
9.4
Sour
ce: I
MF/
Inte
rnat
iona
l Fin
anci
al S
tatis
tics.
Not
e: –
Not
ava
ilabl
e.
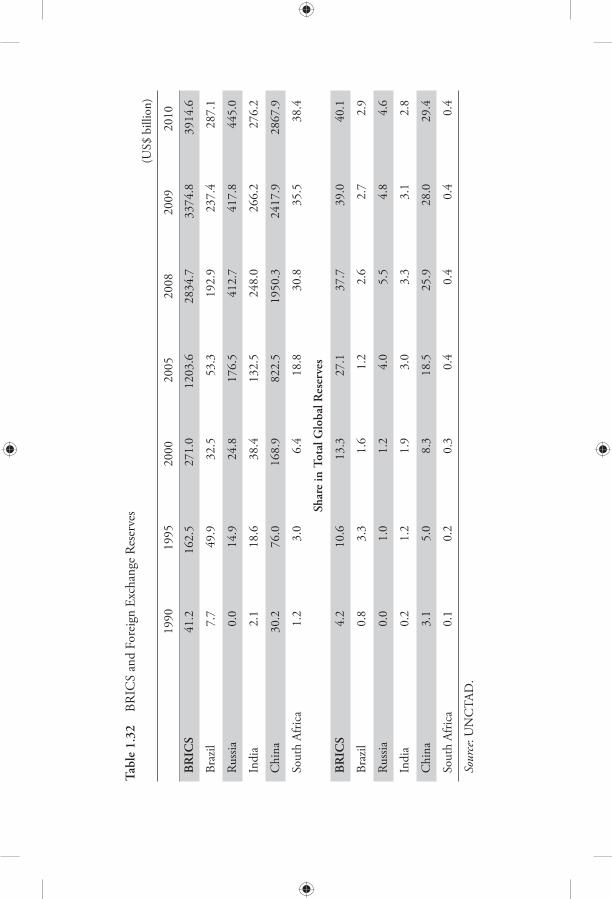
Tabl
e 1.
32
BRIC
S an
d Fo
reig
n Ex
chan
ge R
eser
ves
(US$
bill
ion)
19
90
1995
20
00
2005
20
08
2009
20
10
BR
ICS
41.2
16
2.5
271.
0 12
03.6
28
34.7
33
74.8
39
14.6
Braz
il 7.
7 49
.9
32.5
53
.3
192.
9 23
7.4
287.
1
Russ
ia
0.0
14.9
24
.8
176.
5 41
2.7
417.
8 44
5.0
Indi
a 2.
1 18
.6
38.4
13
2.5
248.
0 26
6.2
276.
2
Chi
na
30.2
76
.0
168.
9 82
2.5
1950
.3
2417
.9
2867
.9
Sout
h Af
rica
1.2
3.0
6.4
18.8
30
.8
35.5
38
.4
Shar
e in
Tot
al G
loba
l Res
erve
s
BR
ICS
4.2
10.6
13
.3
27.1
37
.7
39.0
40
.1
Braz
il 0.
8 3.
3 1.
6 1.
2 2.
6 2.
7 2.
9
Russ
ia
0.0
1.0
1.2
4.0
5.5
4.8
4.6
Indi
a 0.
2 1.
2 1.
9 3.
0 3.
3 3.
1 2.
8
Chi
na
3.1
5.0
8.3
18.5
25
.9
28.0
29
.4
Sout
h Af
rica
0.1
0.2
0.3
0.4
0.4
0.4
0.4
Sour
ce: U
NC
TAD
.

Tabl
e 1.
33
Exte
rnal
Deb
t Sto
cks,
Tota
l (D
OD
, cur
rent
US$
)
Cou
ntry
19
90
1995
20
00
2005
20
07
2008
20
09
1 2
3 4
5 6
7 8
Braz
il 11
9.7
160.
5 24
1.5
187.
5 23
7.6
262.
1 27
6.9
Russ
ia
– 12
1.4
160.
0 22
9.9
368.
1 40
2.5
381.
3
Indi
a 85
.7
95.2
10
0.2
120.
2 20
2.8
224.
7 23
7.7
Chi
na
55.3
11
8.1
145.
7 28
4.0
373.
8 37
8.2
428.
4
Sout
h Af
rica
23.3
25
.4
24.9
31
.1
43.6
41
.9
42.1
Exte
rnal
Deb
t-to
-GD
P R
atio
Braz
il
23.6
20
.8
37.6
21
.1
17.2
15
.8
17.3
Russ
ia
– 38
.7
61.6
30
.1
28.3
24
.2
31.2
Indi
a 26
.3
25.9
20
.9
14.8
17
.6
17.8
18
.7
Chi
na
14.2
16
.2
12.2
12
.6
10.7
8.
4 8.
6
Sout
h Af
rica
20.8
16
.8
18.7
12
.6
15.3
15
.2
14.8
Sour
ce: W
orld
Ban
k, G
loba
l Dev
elop
men
t Fin
ance
, and
IMF,
WEO
, Oct
ober
201
0.
Not
e: –
Not
ava
ilabl
e.

overview of brics 49
exchange rate regime and convertibility
Th e exchange rate regime and the implementation of supporting policies are critical for economic development and fi nancial stabil-ity of countries. Due to wide diff erences in economic and fi nancial environments, the BRICS economies follow diff erent exchange rate systems in their current and capital accounts (Table 1.34). Th e macroeconomic instabilities experienced by Brazil during the previous decades, particularly the vulnerabilities arising from its external sector, fi nally induced it to adopt infl ation targeting which, in turn, required introducing a fl oating system of exchange rate in January 1999. Since then, the Brazilian real averaged R$ 2.26 against the USD up to 31 December 2010. Th e real eff ective exchange rate has also oscillated substantially, reacting to shifts in fundamentals such as the terms of trade, risk aversion, and underlying capital fl ows. Russia’s exchange rate regime has been reclassifi ed from ‘stabilized arrangement’ to ‘other managed arrangement’, eff ective 1 November 2008, to refl ect the managed depreciation of the Rouble and higher day-to-day exchange-rate fl uctuations. Th e exchange system is free of restrictions on payments and transfers for current international transactions, and legislation is also free of foreign exchange restric-tions on capital account transactions. Th e Bank of Russia imple-ments its foreign exchange policy in the general context of monetary policy. Th e major objectives of the Bank of Russia’s foreign exchange policy are to ensure stability of the national currency and create conditions for the dynamic development of Russia’s foreign exchange market. Th e Bank of Russia pursues managed fl oating arrangement in the exchange rate policy. In 2007 Russia completed liberaliza-tion of the foreign exchange legislation regarding capital account transactions.
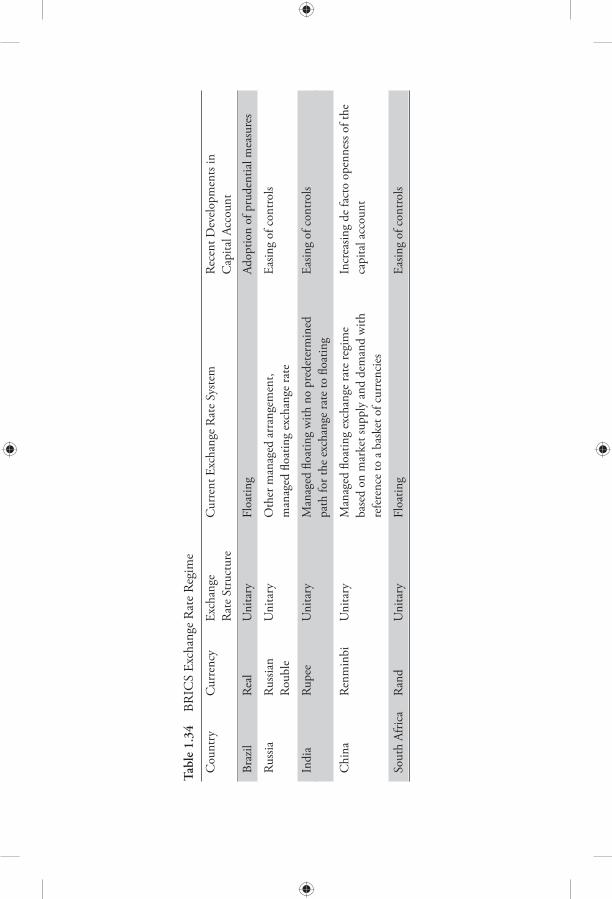
Tabl
e 1.
34
BRIC
S Ex
chan
ge R
ate
Regi
me
Cou
ntry
C
urre
ncy
Exch
ange
C
urre
nt E
xcha
nge
Rat
e Sy
stem
Re
cent
Dev
elop
men
ts in
Rat
e St
ruct
ure
C
apita
l Acc
ount
Braz
il Re
al
Uni
tary
Fl
oatin
g Ad
optio
n of
pru
dent
ial m
easu
res
Russ
ia
Russ
ian
Uni
tary
O
ther
man
aged
arr
ange
men
t, Ea
sing
of c
ontro
ls
Roub
le
m
anag
ed fl
oatin
g ex
chan
ge ra
te
Indi
a Ru
pee
Uni
tary
M
anag
ed fl
oatin
g w
ith n
o pr
edet
erm
ined
Ea
sing
of c
ontro
ls
path
for t
he e
xcha
nge
rate
to fl
oatin
g
Chi
na
Renm
inbi
U
nita
ry
Man
aged
fl oa
ting
exch
ange
rate
regi
me
In
crea
sing
de fa
cto
open
ness
of t
he
base
d on
mar
ket s
uppl
y an
d de
man
d w
ith
capi
tal a
ccou
nt
refe
renc
e to
a b
aske
t of c
urre
ncie
s
Sout
h Af
rica
Ran
d U
nita
ry
Floa
ting
Easin
g of
con
trols

overview of brics 51
In the case of India, given the stated policy of the RBI to contain volatility in the exchange rate without reference to any specifi c target or band, its net intervention operations have helped in signifi cantly absorbing the pressure of capital fl ows on exchange rate volatility. In recent years, however, the exchange rate has become relatively more fl exible, particularly in relation to the size of net intervention opera-tions of the RBI. China adopted a managed fl oating exchange rate regime on 1 January 1994. In July 2005, China launched the reform of the RMB exchange rate regime and moved into a managed fl oating exchange rate regime based on market supply and demand with reference to a basket of currencies. Th e reform of the RMB exchange rate regime has moved ahead in a proactive, controllable, and gradual way to increase the role of the market in establishing the rate. Currently, the US$-RMB spot exchange rate can move intra-day 0.5 per cent from a central parity that is determined at the open of trading by a truncated weighted average of primary dealers’ off er rates and is announced by the China Foreign Exchange Trading System. South Africa has a fl exible exchange rate regime, but excess capi-tal infl ows are sometimes purchased to increase the level of foreign exchange reserves and to reduce exchange rate volatility. Reserve pur-chases are sterilized via, inter alia, the issuance of debentures, repur-chase transactions, and sterilization swaps. Th e National Treasury assists the SARB in funding sterilization operations. Th e SARB does not target a specifi c level for the Rand, but interventions may some-times be contemplated to sterilize large capital infl ows that could fuel volatility in the foreign exchange market. Among the BRICS, South Africa accepted the obligations of Article VIII, sections 2, 3, and 4 of the International Monetary Fund’s Articles of Agreement on 15 September 1973. India accepted
52 the brics report
the obligations of Article VIII of the Articles of Agreement of the IMF in 1994, followed by Russia in June 1996, China in December 1996, and Brazil in November 1999 which obliged them to remove restrictions on the transactions in their current accounts. Regarding the capital account, in accordance with the policy of infl ation target-ing, Brazil adopted a fl oating exchange rate in 1999 under conditions of almost full capital account convertibility. Russia slowly started lib-eralizing its capital account in the early 1990s, but it faced a serious currency crisis in 1998 under its strained fi scal circumstances and introduced a series of emergency measures, including re-intensifi ca-tion of capital controls and the announcement of a debt moratorium. However, the capital account restrictions in Russia have been revers-ing recently. China and India follow a gradual path to capital account liberalization.
Financial Market Performance
Stock Exchange
During the period 1999–2010, capital markets in the BRICS expe-rienced fl uctuations, which also varied within the group. A signifi -cant fall in equity indices was observed between the years 2000 and 2008. Within the group, Brazil and China saw more equity index fl uctuations than Russia, India, and South Africa. Except for the two years mentioned, equity indices rose in all the BRICS economies (Table 1.35). During this period, the price–earnings ratio (PE) as indicator of capital markets in the BRICS were relatively more stable in China and India compared with Brazil, Russia, and South Africa. In 2010, the PE ratios declined for all BRICS countries except India.

Tabl
e 1.
35
Stoc
k M
arke
t Per
form
ance
of B
RIC
S C
ount
ries
Cou
ntry
In
dex
M
ovem
ent (
per c
ent c
hang
e)
PE R
atio
19
99
2005
20
09
2010
19
99
2005
20
09
2010
19
99
2005
20
09
2010
Braz
il 88
9.5
1,56
9.40
3,
624.
50
– 61
.6
50
121.
3 –
18.6
12
.39
17
13.8
Russ
ia
177.
71
1125
14
44.1
–
201.
6 83
.3
128.
6 –
– 8.
3 11
.1
8.3
Indi
a 20
9.5
382.
9 46
8.5
– 89
.1
40.2
10
0.5
– 22
.8
20.1
7 21
.8
22.4
Chi
na
33.5
29
.3
64.8
–
10.2
15
.6
58.8
–
– 15
.78
15.6
14
.6
Sout
h Af
rica
7806
16
438
2499
6 –
74
44
28.6
–
– 14
.4
21.8
18
.9
Sour
ce: B
loom
berg
and
Mor
gan
Stan
ley
Cap
ital I
nter
natio
nal.
Not
es: R
ussia
: RT
S St
ock
Exch
ange
and
shar
es in
clud
ed in
RT
S In
dex
calc
ulat
ion
base
.–
Not
ava
ilabl
e.

54 the brics report
Th e number of companies domestically incorporated in stock exchanges in two of the BRICS economies, namely, Brazil and South Africa declined during the period 2000 to 2006 and has fl uctuated in recent years. As regards Russia, the number of listed companies, which was on a rising trend, fl uctuated in recent years, while China and India witnessed continuous growth in the number of listed domestic companies during most of the years of the same period (Table 1.36). Th e depth of stock markets measured in terms of market capital-ization to GDP in BRICS economies progressively deepened over the years. Th e ratio which was as low as 3.6 per cent in 1990 for Brazil, reached a high of 74 per cent in 2010. Th e corresponding ratios dur-ing the same period in the case of India were 12.2 per cent and 93.4 per cent, respectively. China and Russia, both of which started off with a relatively shallower base, rapidly caught up. In China, the market capitalization-to-GDP ratio in 1995 was 5.8 per cent, which jumped to 81 per cent in 2010. Th e corresponding ratios with respect to Russia were 4.0 per cent and 67.9 per cent, respectively. Among the BRICS, South Africa had the largest market capitalization rela-tive to the size of GDP during 2010 (Table 1.37). Th e turnover ratio as indicators of the depth of fi nancial markets (stock markets) also deepened considerably over the period in the BRICS. Th e ratio jumped from a high base of 115.9 per cent in China in 1995 to 229.6 per cent in 2009. Russia with the ratio of 108.5 per cent in 2009 had a low base of only 36.9 per cent in 2000. Similarly, India which had a turnover ratio of 65.9 per cent in 1990 attained a high in turnover ratio of 119.3 per cent in 2009. Brazil and South Africa also witnessed a signifi cant jump in the ratio during the period, that is, 23.6 per cent to 73.9 per cent during 1990 to 2009 in Brazil and 7.0 per cent to 57.3 per cent in South Africa during 1995

Tabl
e 1.
36
Tota
l List
ed D
omes
tic C
ompa
nies
Cou
ntry
19
90
1995
20
00
2005
20
06
2007
20
08
2009
20
10
1 2
3 4
5 6
7 8
9 10
Braz
il 58
1 54
3 45
9 38
1 39
2 44
2 43
2 37
7 37
3
Russ
ia
– 17
0 24
9 29
6 30
9 32
8 31
4 27
9 34
5
Indi
a 24
35
5398
59
37
4763
47
96
4887
49
21
4955
49
87
Chi
na
0 32
3 10
86
1387
14
40
1530
16
04
1700
20
63
Sout
h Af
rica
732
640
616
388
401
422
425
410
407
Sour
ce: S
tand
ard
& P
oor’s
, Em
ergi
ng S
tock
Mar
kets
Factb
ook
and
supp
lem
enta
l S&
P da
ta.
Not
es: L
isted
dom
estic
com
pani
es a
re d
omes
tical
ly in
corp
orat
ed c
ompa
nies
liste
d on
the
coun
try’s
stoc
k ex
chan
ges a
t the
end
of t
he y
ear.
Th is
indi
cato
r doe
s not
incl
ude
inve
stmen
t com
pani
es, m
utua
l fun
ds, o
r oth
er c
olle
ctiv
e in
vestm
ent v
ehic
les.
– N
ot a
vaila
ble.

Tabl
e 1.
37
Mar
ket C
apita
lizat
ion
of L
isted
Com
pani
es
(per
cen
t of G
DP)
Cou
ntry
19
90
1995
20
00
2005
20
06
2007
20
08
2009
20
10
1 2
3 4
5 6
7 8
9 10
Braz
il 3.
6 19
.2
35.1
53
.8
65.3
10
0.3
35.7
73
.2
74
Russ
ia
0 4
15
71.8
10
6.6
115.
6 23
.9
70.5
67
.9
Indi
a 12
.2
35.7
32
.2
68.3
89
.5
46.4
53
.2
85.4
93
.4
Chi
na
0 5.
8 48
.5
34.9
91
.3
178.
2 61
.8
100.
3 81
Sout
h Af
rica
123
186
118
229
274
291.
3 17
8.5
249.
3 27
8.4
Sour
ce: S
tand
ard
& P
oor’s
, Em
ergi
ng S
tock
Mar
kets
Factb
ook
and
supp
lem
enta
l S&
P da
ta, a
nd W
orld
Ban
k an
d O
ECD
GD
P es
timat
es.
Not
e: M
arke
t cap
italiz
atio
n (a
lso k
now
n as
mar
ket v
alue
) is t
he sh
are
pric
e tim
es th
e nu
mbe
r of s
hare
s out
stand
ing.
Li
sted
dom
estic
com
pani
es a
re d
omes
tical
ly in
corp
orat
ed c
ompa
nies
liste
d on
the
coun
try’s
stoc
k ex
chan
ges a
t the
end
of t
he y
ear.
Liste
d co
mpa
nies
doe
s not
incl
ude
inve
stmen
t com
pani
es, m
utua
l fun
ds, o
r oth
er c
olle
ctiv
e in
vestm
ent v
ehic
les.

overview of brics 57
to 2009. All BRICS countries suff ered a decline in their turnover ratio in 2010 (Table 1.38). Th e dividend–yield ratio as an indicator of capital markets in the BRICS declined gradually, indicating better market value in these countries over the period. Th e year 2008, however, witnessed the ratio rising compared with other years (Table 1.39). Combined external fi nancing of capital markets in the BRICS from bonds, equities and loans in absolute terms during the period 1999–2010 increased signifi cantly. Th is also indicates the integra-tion of the BRICS fi nancial markets with world fi nancial markets (Table 1.40). Th e depth of the fi nancial sector can also be gauged from the extent of insurance sector penetration into the economy. In the absence of population-wise distribution of insurance policies, both life and general, an alternative to measuring the depth of the sector is the volume of the sector with respect to GDP expressed in percentage terms. Th e ratio with respect to life insurance has been on the rise in most BRICS economies with the highest being 0.122 per cent in South Africa in 2008. However, with respect to non-life insurance, the depth remained 0.01–0.03 per cent in all BRICS countries dur-ing the period (Table 1.41).
Financial Sector
Th e Brazilian fi nancial market is based on a modern and solid bank-ing system, a state-of-the-art payment system, and reliable market infrastructure. In 2002, the Brazilian Central Bank launched the new Brazilian Payment System which allows fi nal and irrevocable transfers on a real-time basis. Th e recent credit-market reforms in Brazil have

Tabl
e 1.
38
Stoc
ks T
rade
d, T
urno
ver R
atio
(p
er c
ent)
Cou
ntry
19
90
1995
20
00
2005
20
06
2007
20
08
2009
20
10
1 2
3 4
5 6
7 8
9 10
Braz
il 23
.6
47.8
43
.5
38.3
42
.9
56.2
74
.3
73.9
66
.4
Russ
ia
0 0
36.9
39
64
.1
58.9
59
.2
108.
5 85
.7
Indi
a 65
.9
10.5
13
3.6
94.2
93
.1
84
85.2
11
9.3
75.6
Chi
na
0 11
5.9
158.
3 82
.5
102
180.
1 12
1.3
229.
6 16
4.4
Sout
h Af
rica
– 7
34
39
48.8
55
61
.6
57.3
39
.6
Sour
ce: S
tand
ard
& P
oor’s
, Em
ergi
ng S
tock
Mar
kets
Factb
ook
and
supp
lem
enta
l S&
P da
ta.
Not
es: T
urno
ver r
atio
is th
e tot
al v
alue
of s
hare
s tra
ded
durin
g th
e per
iod
divi
ded
by th
e ave
rage
mar
ket c
apita
lizat
ion
for t
he p
erio
d. A
vera
ge
mar
ket c
apita
lizat
ion
is ca
lcul
ated
as t
he a
vera
ge o
f the
end
-of-p
erio
d va
lues
for t
he c
urre
nt a
nd th
e pr
evio
us p
erio
d.–
Not
ava
ilabl
e.

Tabl
e 1.
39
Equi
ty V
alua
tion
Mea
sure
s: D
ivid
end–
Yiel
d R
atio
s
Cou
ntry
19
98
1999
20
00
2001
20
02
2003
20
04
2005
20
06
2007
20
08
2009
20
10
1 2
3 4
5 6
7 8
9 10
11
12
13
14
Braz
il 9.
34
2.95
3.
18
4.93
5.
51
3.46
4.
43
3.9
3.1
2.2
4.6
2.9
2.7
Russ
ia
0.72
0.
14
0.92
1.
11
1.87
2.
38
3.12
1.
6 1
1.2
3.5
1.4
1.5
Indi
a 2
1.25
1.
59
2.03
1.
81
1.47
1.
53
1.3
1 0.
7 1.
8 0.
9 0.
9
Chi
na
3.71
3.
14
0.95
1.
95
2.41
2.
19
2.26
2.
7 1.
5 1.
2 3.
1 1.
9 2.
2
Sout
h Af
rica
– –
2.8
3.5
3.8
3.2
2.6
2.5
2.4
2.7
4.5
2.7
2.3
Sour
ce: D
ata
from
Mor
gan
Stan
ley
Cap
ital I
nter
natio
nal.
Not
e: –
Not
ava
ilabl
e.

Tabl
e 1.
40
Emer
ging
Mar
ket E
xter
nal F
inan
cing
: Tot
al B
onds
, Equ
ities
, and
Loa
ns
(in U
S$ m
illio
n)
Cou
ntry
19
98
1999
20
00
2001
20
02
2003
20
04
2005
20
06
2007
20
08
2009
20
10
1 2
3 4
5 6
7 8
9 10
11
12
13
14
Braz
il 14
,214
12
,952
21
,454
19
,266
11
,119
12
,909
15
,834
27
,486
31
,219
73
,218
30
,843
39
,601
67
,703
Russ
ia
13,1
56
167
8,31
3 2,
831
8,53
5 12
,239
22
,532
37
,004
59
,165
84
,536
61
,230
53
,940
45
,389
Indi
a 1,
434
2,37
6 3,
428
2,06
6 1,
360
3,77
6 13
,060
21
,660
29
,534
60
,513
37
,561
58
,320
11
5,92
9
Chi
na
6,97
5 3,
462
9,22
7 4,
255
4,25
6 12
,843
22
,850
38
,805
50
,040
75
,677
28
,261
66
,829
79
,879
Sout
h Af
rica
– 3,
423
8,69
9 4,
647
4,05
8 7,
837
5,41
3 6,
266
12,7
01
19,9
04
2,81
6 7,
980
7,46
0
Sour
ce: D
ata
prov
ided
by
the
Bond
, Equ
ity, a
nd L
oan
Dat
abas
e of
the
Inte
rnat
iona
l Mon
etar
y Fu
nd so
urce
d fro
m C
apita
l Dat
a.N
ote:
– N
ot a
vaila
ble.

overview of brics 61
contributed to a substantial rise in intermediation, paving the way for solid fi nancial inclusion. Improvements such as the reduction of directed lending and dissemination of information can contribute to enhancing the power of monetary policy and reduce debt service (credit cost). Th e Central Bank of Brazil has decided to implement the Basel II framework in the Brazilian banking sector and is directly involved in formatting the Basel III framework. After the global fi nancial crisis, all the BRICS economies are envisaged to implement the revised framework for better banking sector regulation. In Russia, banking supervision has continued to improve and the regulatory framework is considered to be broadly adequate. Russian banks are generally well-capitalized and suffi ciently pro-visioned. Capital adequacy ratios are at comfortable levels by
Table 1.41 Insurance Sector in BRICS Economies
Country 1990 1995 2000 2005 2006 2007 2008
1 2 3 4 5 6 7 8
Life Insurance Premium Volume/GDP
Brazil 0.002 0.003 0.004 0.013 0.013 0.014 0.015
Russia – – – 0.001 0.001 0.001 0.001
India 0.010 0.012 0.017 0.026 0.041 0.040 0.039
China 0.002 0.003 0.010 0.018 – – –
South Africa 0.077 0.110 0.146 0.108 0.130 0.126 0.122
Non-Life Insurance Premium Volume/GDP
Brazil 0.01 0.02 0.02 0.02 0.02 0.02 0.02
Russia – – – 0.02 0.02 0.02 0.02
India 0.00 0.01 0.01 0.01 0.01 0.01 0.01
China 0.01 0.01 0.01 0.01 – – –
South Africa 0.02 0.03 0.03 0.03 0.03 0.03 0.03
Source: World Bank.Note: – Not available.
62 the brics report
international standards. Profi tability in the banking system is robust and has improved, even as foreign banks have entered the market and increased competition. As of the end of November 2010, there were 225 banks with foreign investment in their authorized capital. In India, major policy measures during the reform of the bank-ing sector included phased reductions in statutory pre-emption like cash reserve and statutory liquidity requirements and deregulation of interest rates on deposits and lending, except for a select segment. Th e diversifi cation of ownership of banking institutions is another feature which has enabled private shareholding in public sector banks through listing on the stock exchanges, arising from dilution of gov-ernment ownership. Over the period, the performance of the bank-ing sector has improved, both in terms of reducing non-performing assets (NPAs) and improvement on indicators of prudential mea-sures. Further, at the policy level, greater emphasis has been placed on fi nancial inclusion and improving the delivery of fi nancial services in line with technological developments. Since the reform and opening up of China, China’s banking industry reforms have continuously deepened especially in recent years, with the banking sector’s comprehensive strength, risk man-agement capabilities, and international role gaining signifi cance rapidly. To promote reform and improve management at the same time, shareholding commercial banks in China have continued to deepen reforms, thereby consolidating the micro-foundations of the fi nancial system. Th e South African banking sector has consistently maintained capital adequacy ratios well in excess of the required minimum. As a result, South African banks remained adequately capitalized through the crisis and the fi nancial system did not experience any funding or liquidity problems. Th is is due to the fact that South African banks

overview of brics 63
are well regulated, have sophisticated liquidity management systems, and limited reliance on funding in foreign currency. To further strengthen regulation to support fi nancial stability, the government is currently focused on four main areas of reform in the banking sector: strengthening fi nancial stability, broadening fi nancial services for the poor, increasing competitiveness and effi ciency, and promot-ing investor and consumer protection. A shift is underway to a ‘twin-peak’ approach to regulation with the central bank being responsible for prudential regulation and the fi nancial services regulator for market conduct regulation. Prudential regulation of the insurance sector will be strengthened through the introduction of ‘Solvency Assessment and Management’, an approach similar to Solvency II in Europe. In addition, regulation of the credit rating agency was introduced during 2011. A framework to facilitate moving OTC derivative trading to an exchange and the approach to oversight of shadow banking, hedge fund, and private equity industries will be reviewed. Preparations for implementing the Basel III capital and liquid-ity requirements are underway, including the QIS and assessments of the availability of high-quality liquid assets and banks’ ability to adhere to the required standards. A formalized framework of iden-tifying systemically signifi cant institutions is also being developed. Crisis management arrangements are being strengthened between the National Treasury and SARB. A review of the contingency frame-work has been conducted in terms of a World Bank/First Initiative project.
banking sector performance
Capital-to-asset ratio as an indicator of the performance of BRICS witnessed a gradual fall over the period, indicating an expansion in
64 the brics report
banking activities. Years like 2005 and 2009, however, witnessed a rise in the ratio (an improvement in fi nancial stability, deleverage, increase in risk aversion), indicating contraction in banking activities (Table 1.42). Capital-to-risk weighted assets as an indicator of the soundness of banks has risen considerably in BRICS economies though there were years when it fell marginally in some of the countries. Following the global crisis, there has not been any signifi cant fall in the ratio, indicating that the banking sectors in these countries are sound and well capitalized. A similar pattern is refl ected in the NPAs of banks in the BRICS, which have been gradually declining over the period as a percentage of total loans. As regards banks’ provisions for NPAs, such provisions were kept much in excess of the total non-performing loans in Brazil and China. However, provisions as a percentage of non-performing loans have been increasing in all BRICS countries during the period. Th e profi tability of banks in terms of both return on assets and return on equity has also been rising gradually in most BRICS economies notwithstanding fl uctuations in the ratios over the years (Table 1.43). Th e Brazilian banking system consists of state-owned, foreign, and private domestic banks. Th ere are, however, diff erences in the asset structures of the various banking segments. In Brazil, most fi nan-cial institutions that receive demand deposits are organized under a multiple or universal bank structure, combining the commercial portfolio with at least one of the following portfolios: investment, leasing, real estate credit, or fi nancing. According to the Central Bank Financial Stability Report, published in June 2010, state-owned insti-tutions accounted for 41 per cent of the total assets, while domes-tic private banks held 37 per cent, and private foreign institutions

Tabl
e 1.
42
Prud
entia
l Ind
icat
ors o
f the
Ban
king
Sec
tor i
n BR
ICS
Ba
nk C
apita
l to
Asse
ts Re
gula
tory
Cap
ital t
o R
isk W
eigh
ted
Asse
ts
Cou
ntry
19
99
2005
20
09
2010
19
99
2005
20
09
2010
1 2
3
4 5
6
7 8
9
Braz
il –
10.4
11
.2
10.9
–
17.9
18
.9
17.6
Russ
ia
14.3
12
.8
15.7
–
18.1
15
20
.9
18.9
Indi
a 5.
9 9.
8 10
.3
– 11
.2
12.8
13
.2
–
Chi
na
5.2
4.4
5.6
– 11
.2
2.5
11.4
–
Sout
h Af
rica
– 7.
9 6.
7 –
– 12
.7
14.1
14
.4
Sour
ces:
Nat
iona
l aut
horit
ies;
IMF
staff
estim
ates
.N
ote:
– N
ot a
vaila
ble.

Tabl
e 1.
43
Bank
Pro
fi tab
ly In
dica
tors
in B
RIC
S
(per
cen
t)
Re
turn
on
Asse
ts Re
turn
on
Equi
ty
Non
-per
form
ing
Loan
/ Tot
al L
oan
Cou
ntrie
s 19
99
2005
20
09
2010
19
99
2005
20
09
2010
19
99
2005
20
09
2010
1 2
3 4
5 6
7 8
9 1
0 11
12
13
Braz
il –
3.2
2.4
3.2
– 30
.1
22.1
29
.3
– 3.
5 4.
2 3.
1
Russ
ia
–0.3
3.
2 0.
7 1.
6 –4
.0
24.2
4.
9 10
13
.4
2.6
9.5
9.5
Indi
a 5.
9 0.
9 1
– –
13.3
12
.3
– 14
.7
5.2
2.3
–
Chi
na
5.2
0.6
0.8
– –
15.1
15
.1
– 28
.5
8.6
1.6
–
Sout
h Af
rica
– 1.
2 0.
9 –
– 15
.2
15.9
15
.4
– 1.
5 5.
9 5.
9
Sour
ce: G
loba
l Fin
ancia
l Sta
bilit
y Rep
ort,
IMF.
Not
e: –
Not
ava
ilabl
e.

overview of brics 67
held 19 per cent. Th e remaining 2 per cent was distributed among 1,388 credit co-operatives, which are important agents for agricul-tural business. Since 1994, there has been considerable concentration in the banking sector, with a signifi cant reduction in the number of institu-tions. In June 2010, there were 140 banking institutions, with the fi ve largest accounting for 70 per cent of the total assets. State-owned banks in Brazil play a signifi cant role in agricultural and real estate credit. Given the tough competition for market share, however, private and state-owned banks are gradually operating in the same areas, with private banks increasing their stake in real estate credit and public institutions targeting retail credit through acquisitions of smaller institutions. Finally, it is worth mentioning the important role played by BNDES, the Brazilian Development Bank, in fostering infrastructure investment via long-term credit operations. As of end-2009, China’s banking sector was composed of 3,857 banking institutions with approximately 193,000 outlets and 2,845,000 employees. Th e total assets and total liabilities of fi nan-cial institutions in the banking sector reached RMB 78.8 trillion and RMB 74.2 trillion, respectively; the outstanding deposits of banks denominated in both domestic and foreign currencies grew to RMB 61.2 trillion; and the outstanding loans in both domestic and foreign currencies reached RMB 42.56 trillion. Th e outstanding non-performing loans (NPLs) of commercial banks registered RMB 497.3 billion, the NPL ratio recorded 1.58 per cent, and the coverage ratio for provisioning grew to 155 per cent. In 2009, the net profi ts of banking institutions after tax reached RMB 668.43 billion. In terms of market capitalization, the Industrial and Commercial Bank of China (ICBC), China Construction Bank (CCB), and Bank of
68 the brics report
China (BOC) rank as the top three global banks. Th e fi ve largest commercial banks, namely, ICBC, CCB, BOC, ABC, and BOCOM, account for 50.89 per cent in total assets and 59.86 per cent of the banking sector’s total after-tax net profi ts. Th eir NPL ratios registered 1.54 per cent, 1.50 per cent, 1.52 per cent, 2.91 per cent and 1.36 per cent, respectively. Russia’s fi nancial system is dominated by banks. Th e Russian bank-ing industry comprises a number of players: (i) the Central Bank of Russia (CBR); (ii) state-owned banks; (iii) large private banks, (iv) local private banks, and (v) banks controlled by foreign capital. In 2006 the majority share (90.1 per cent of total assets) of the banking system in Russia was constituted of credit institutions, with private banks accounting for a larger share in the total assets of the banking system (55.5 per cent) vis-à-vis the state-owned banks (34 per cent). Non-bank credit institutions account for only around 10 per cent of the total assets of the banking system. One feature of the Russian market is the large number of credit organizations; as on 1 December 2010 there were 1,023 credit organizations, of which 225 have foreign participation in chartered capital. Th e market is also characterized by signifi cant concentration, with the top 30 banks accounting for approximately 70 per cent of all banking assets. Retail and corporate banking is dominated by state-controlled banks, the main ones being Sberbank and VTB. State-controlled banks taken together held more than 48 per cent of the banking sector’s total assets as of December 2010. Th e largest private-owned banks are Alfa Bank, MDM Bank, PromSvyazBank, and UralSib. Major international banks with substantial retail and corporate banking footprint in Russia are subsidiaries of Barclays, Citibank, Raiff eisen, Société Générale, and Uni Credit.

overview of brics 69
Participation in the Russian formal fi nancial sector remains low. An estimated 60 million people (42 per cent of the population) still have no access to fi nancial services, such as bank savings accounts, credit, or investments in securities. Th e Indian fi nancial system is a complex network of institutions, with a variety of functions and governed by diff erent regulations, that are dominated by public and private commercial banks. Besides commercial banks, which are the predominant intermediaries of the fi nancial system, there are cooperative banks, development fi nance institutions, non-banking fi nancial companies, insurance companies, provident funds, and mutual funds. Th e RBI exercises its supervisory role over the banking system encompassing com-mercial and cooperative banks through the powers provided under the Banking Regulation Act, 1949 and the Reserve Bank of India Act, 1934. Th e RBI also regulates select all-India fi nancial institu-tions under the Reserve Bank of India Act, 1934. Consequent upon amendments to the RBI Act in 1997, a comprehensive regulatory framework for Non-Banking Financial Companies (NBFCs) was also introduced. In respect of state and district central cooperative banks and regional rural banks, while the RBI is the regulator, supervi-sion is vested with the National Bank for Agriculture and Rural Development (NABARD). Insurance companies and mutual funds are regulated by the Insurance Regulatory and Development Authority (IRDA) and the Securities and Exchange Board of India (SEBI), respectively. Th e banking sector in India evolved to a signifi cant extent in response to fi nancial sector reforms initiated as part of structural reforms encompassing trade, industry, investment, and the external sector that were launched by the central government in the early 1990s against the backdrop of a serious balance of payments problem.
70 the brics report
Accordingly, fi nancial sector reforms were initiated as part of overall structural reforms to impart effi ciency and dynamism to the fi nancial sector. Th e country’s approach to reform in the banking and fi nancial sector was guided by Pancha Sutra or fi ve principles: (i) cautious sequencing of reform measures; (ii) introduction of norms that were mainly reinforcing; (iii) introduction of complementary reforms across sectors (monetary, fi scal, external, and fi nancial); (iv) development of fi nancial institutions; and (v) development and inte-gration of fi nancial markets. Th e evolution of the banking sector in this phase can be divided into two phases, that is, from 1991–2 to 1997–8 and from 1997–8 onwards. Th e regional rural banks (RRBs) have been playing an impor-tant role in purveying rural credit. With a view to strengthening them, banks were encouraged to amalgamate state-wise the RRBs sponsored by them. In this context, the Government of India, after consulting NABARD, the concerned state governments and spon-sor banks, initiated the process of amalgamating RRBs in September 2005. As a result of this initiative, 137 RRBs were amalgamated by 31 October 2006 to form 43 new RRBs (sponsored by 18 banks in 15 states). Th is has brought down the total number of RRBs from 196 to 102. Further amalgamation proposals are being con-sidered by the Government of India to strengthen the rural credit sector. South Africa’s banking sector is highly concentrated with the fi ve largest banking groups (ABSA Bank Ltd., Standard Bank of South Africa Ltd., FirstRand Bank Ltd., Nedbank Ltd., and Investec Bank Ltd.), accounting for 91.6 per cent of total bank assets at the end of 2010. Th e fi nancial crisis did not have a direct impact on the South African banking system, but the economic downturn that resulted from the crisis reduced the profi tability of banks.
overview of brics 71
Growth in loans and advances declined sharply at the onset of the crisis as a result of a downturn in the economy and turned negative in September 2009, only returning to positive growth in May 2010. Th e rate of growth has remained relatively subdued since then, and registered year-on-year growth of 2.5 per cent in December 2010. Credit risk remains relatively high, although stable, with asset quality appearing to have reached a plateau. Th rough the crisis, impaired advances rose sharply as households and businesses came under increasing fi nancial strain. Banks continued to face high levels of impaired advances loans during 2010. Impaired advances as a per-centage of gross loans and advances averaged 5.8 per cent in 2010, compared to 5.9 per cent in 2009 and just 3.2 per cent in 2008. As a percentage of gross loans and advances, impaired loans have remained between 5.7 per cent and 6 per cent since August 2009. Credit losses have returned to pre-crisis levels of about 0.1 per cent of gross loans and advances. Th e minimum capital adequacy ratio for South African banks is 9.5 per cent, which is higher than the minimum 8 per cent ratio established by the Basel II requirements. Th e actual capital adequacy ratio for the banking sector increased from 13 per cent at the end of 2008 to 14.1 per cent at the end of 2009 to 14.9 per cent at the end of 2010. Tier 1 capital adequacy improved from 10.2 per cent at the end of 2008 to 11 per cent at the end of 2009 to 11.8 per cent at the end of December 2010 (well in excess of even Basel III’s 7 per cent requirement). Nevertheless, certain features of the South African banking sys-tem can create potential vulnerability to funding market illiquidity, in particular the reliance on short-term wholesale funding from a concentrated depositor base. Th is places a burden on banks to ensure that they are constantly able to roll over borrowed funds from their

72 the brics report
corporate clients and other fi nanciers. While foreign exchange liquidity risk is currently low, the gradual liberalization of exchange controls can place a higher burden on the fi nancial system to monitor and manage liquidity vulnerability. So far, SARB has imposed a pru-dential liquid asset requirement on all banks, which stands at 5 per cent of average liabilities, as adjusted for non-remunerated reserves. South African policymakers, who have amended pension fund rules to encourage pension funds to place longer-term funding with banks, will review securitization rules and investigate why retail depositors have short-dated holdings in banks. In relation to the proposed global liquidity standards, South Africa will take a cautious, gradual approach in adopting standards such as those proposed by the Basel Committee on Banking Supervision (BCBS), in order to minimize their impact on the profi tability and credit extension of banks in South Africa. While South Africa generally takes a proactive approach to adopting international banking supervision standards once they are fi nalized, the global liquidity standards are likely to have a signifi cant impact on the economy as a whole, and not just the banking sector. As a result, a more conservative approach is being taken with respect to this specifi c area of the proposed global standards.
accessibility of financial services
Th e accessibility of the banking sector for the common man can be measured by various indicators. Some of these indicators are num-ber of branches per unit area, branches per population, automatic teller machines (ATMs) in a unit area and per unit of population, and the depth of banking penetration at the aggregate level using indicators like deposit-to-GDP and loan-to-GDP rates. Based on available and comparable data for the period from 2005 to 2010,

overview of brics 73
BRICS economies signifi cantly improved the accessibility of bank-ing services to the common man. Branches per 1,000 sq. km and branches per 100,000 adult population have increased in both India and Brazil, the number of ATMs per 1,000 sq. km and per 100,000 adult population has increased in Brazil and Russia, and deposit to GDP as well as credit to GDP have increased signifi cantly in all the BRICS economies (Table 1.44). In South Africa, the banking sector is continuously studying ways to serve the previously unbanked market. Th e launch of the Financial Sector Charter (FSC) led to the establishment of an entry-level basic bank account called the Mzansi bank account in 2004. It is estimated that by the end of June 2010 more than 5 million Mzansi accounts had been opened. Banks also introduced additional products for low-income people, and engaged with key partners to improve market share and the product base available to customers. Having surpassed their original target of R42 billion for the provision of aff ordable housing in terms of the FSC, banks made further strides to enhance access to housing fi nance. Among other things, a guarantee fund of R1 billion was made available to the banking sector by the govern-ment to accelerate the delivery of housing to low-income earners. Other initiatives by the South African banking sector, aimed at fi nan-cial inclusion, are related to increasing points of access in low income areas, especially due to the competition introduced by smaller banks focusing on unsecured lending, and the innovative use of technology to reach under-served areas.
credit depth
Credit depth information, which is measured in terms of accessibility and quality on a scale of 1–6 with higher values indicating easier and

Tabl
e 1.
44
Fina
ncia
l Ser
vice
s Acc
essib
ility
in B
RIC
S
Braz
il
Ru
ssia
In
dia
Chi
na
Sout
h Af
rica
Indi
cato
r 20
05
2009
20
10
2005
20
09
2010
20
05
2009
20
10
2005
20
09
2010
20
05
2009
20
10
1 2
3 4
5
6 7
8
9 10
11
12
13
1
4 15
16
Num
ber o
f 2.
08
2.37
2.
33
– –
– 23
.86
27.8
6 29
.14
– –
– 1.
91
2.64
2.
8co
mm
erci
alba
nk b
ranc
hes
per 1
,000
sq. k
m
Num
ber o
f 13
.06
3.95
13
.76
– –
– 9.
69
10.4
3 10
.91
– –
– 7.
19
9.37
10
.1co
mm
erci
alba
nk b
ranc
hes
per 1
00,0
00 a
dults
Out
stand
ing
34
46.3
2 47
.51
18.6
6 33
.12
– 47
.31
60.1
1 –
123.
21
137.
11
– 41
.31
44.6
8 41
.62
depo
sits w
ith
com
mer
cial
ban
ks(p
er c
ent o
f GD
P)
Out
stand
ing
loan
s 18
.09
26.2
8 29
.04
26
.46
50.7
6 –
31.2
1 43
.62
– 85
.33
107.
62
– 62
.55
75.2
7 69
.65
from
com
mer
cial
ba
nks (
per c
ent
of G
DP)
Sour
ce: I
MF.
Not
e: –
Not
ava
ilabl
e.
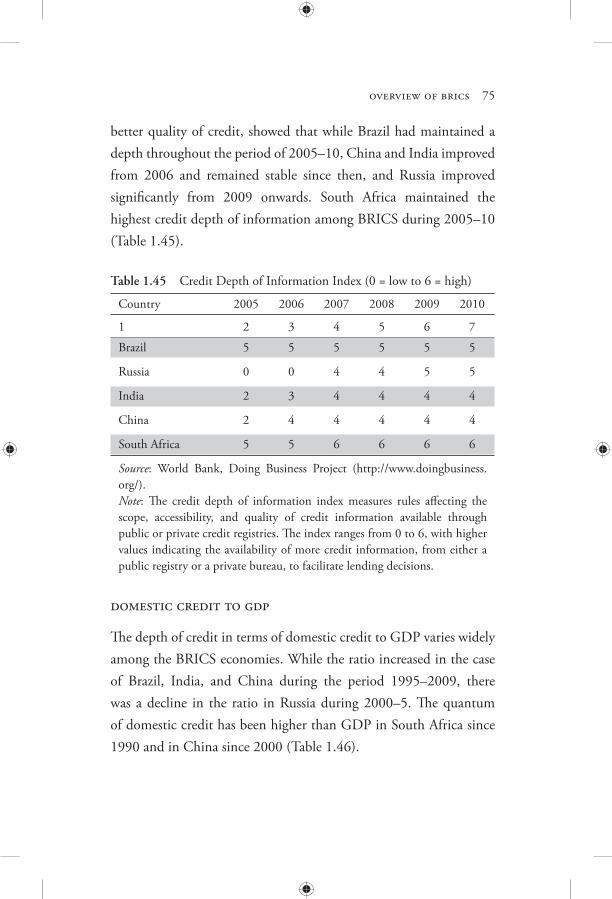
overview of brics 75
better quality of credit, showed that while Brazil had maintained a depth throughout the period of 2005–10, China and India improved from 2006 and remained stable since then, and Russia improved signifi cantly from 2009 onwards. South Africa maintained the highest credit depth of information among BRICS during 2005–10 (Table 1.45).
Table 1.45 Credit Depth of Information Index (0 = low to 6 = high)
Country 2005 2006 2007 2008 2009 2010
1 2 3 4 5 6 7
Brazil 5 5 5 5 5 5
Russia 0 0 4 4 5 5
India 2 3 4 4 4 4
China 2 4 4 4 4 4
South Africa 5 5 6 6 6 6
Source: World Bank, Doing Business Project (http://www.doingbusiness.org/).Note: Th e credit depth of information index measures rules aff ecting the scope, accessibility, and quality of credit information available through public or private credit registries. Th e index ranges from 0 to 6, with higher values indicating the availability of more credit information, from either a public registry or a private bureau, to facilitate lending decisions.
domestic credit to gdp
Th e depth of credit in terms of domestic credit to GDP varies widely among the BRICS economies. While the ratio increased in the case of Brazil, India, and China during the period 1995–2009, there was a decline in the ratio in Russia during 2000–5. Th e quantum of domestic credit has been higher than GDP in South Africa since 1990 and in China since 2000 (Table 1.46).

Tabl
e 1.
46
Dom
estic
Cre
dit P
rovi
ded
by B
anki
ng S
ecto
r(p
er c
ent o
f GD
P)
Cou
ntry
19
90
1995
20
00
2005
20
06
2007
20
08
2009
1 2
3 4
5 6
7 8
9
Braz
il 89
.3
58.9
74
.6
81.5
86
.6
92.2
96
.9
97.5
Russ
ia
0 25
.5
24.7
20
.6
22.4
25
.5
25.1
33
.8
Indi
a 51
.4
44.1
53
60
.1
60.9
60
.8
68.2
69
.4
Chi
na
89.4
87
.7
119.
7 13
5.6
133.
5 12
7.8
120.
8 14
5.2
Sout
h Af
rica
107
150.
5 16
2.5
209
192.
9 19
5.2
172.
2 18
3.5
Sour
ce: I
MF,
Inte
rnat
iona
l Fin
anci
al S
tatis
tics a
nd d
ata
fi les
, and
Wor
ld B
ank
and
OEC
D G
DP
estim
ates
.N
ote:
Dom
estic
cre
dit p
rovi
ded
by th
e ba
nkin
g se
ctor
incl
udes
all
cred
it to
var
ious
sect
ors o
n a
gros
s bas
is, w
ith th
e ex
cept
ion
of c
redi
t to
the
cent
ral g
over
nmen
t, w
hich
is n
et. Th
e b
anki
ng se
ctor
incl
udes
mon
etar
y au
thor
ities
and
dep
osit
mon
ey b
anks
, as w
ell a
s oth
er b
anki
ng
insti
tutio
ns w
here
dat
a ar
e av
aila
ble
(incl
udin
g in
stitu
tions
that
do
not a
ccep
t tra
nsfe
rabl
e de
posit
s but
do
incu
r suc
h lia
bilit
ies a
s tim
e an
d sa
ving
s dep
osits
). Ex
ampl
es o
f oth
er b
anki
ng in
stitu
tions
are
savi
ngs a
nd m
ortg
age
loan
insti
tutio
ns a
nd b
uild
ing
and
loan
ass
ocia
tions
.

overview of brics 77
Concluding Observations
Since the macroeconomic parameters and features of development vary within BRICS economies, the challenges they face in making their growth processes sustainable also vary. In Brazil macroeco-nomic stabilization is a key precondition for successful reforms and sustainable growth. Th e challenges that the Brazilian economy faces are (i) its tradeable goods sector is small when compared to other EMEs like China; (ii) saving and investment rates have to increase as in other BRICS economies like China and India; (iii) improve-ments are required in the public sector, the public debt structure, and fi nancial intermediation; and (iv) it needs to enhance the depth and effi ciency of the fi nancial sector. In the case of Russia, the key challenges are accelerating the implementation of structural reforms, particularly in ineffi cient and undercapitalized natural monopolies, and strengthening the invest-ment climate. For India, the major challenges are (i) making the growth process more inclusive, (ii) improving physical infrastructure, (iii) developing the agriculture sector, and (iv) enhancing delivery of essential public services, such as education and health, to large parts of the population. Similarly for China, policy changes are needed to address both domestic and external challenges. If China is to sustain its rapid eco-nomic growth, the economy needs to be restructured away from heavy dependence on export-led growth towards self-sustaining domestic demand, and the opportunity to share in the benefi ts of growth needs to be spread more equitably across all levels of society. To facilitate all-round, balanced, and sustainable development, fi nancial sector reforms are needed to improve the intermediation of China’s large private savings. Th e government also needs to raise social spending in

78 the brics report
the areas of education, healthcare, and pensions, which will serve to reduce precautionary saving and boost consumption over time. Th ere is also a need to improve the investment structure, advance reforms in the healthcare, pension, and education systems, and provide more support to rural areas and less-developed regions. In South Africa, the key challenge is to achieve higher levels of inclusive growth that raise employment and reduce inequality. Policies proposed in the New Growth Path constitute the key means to address these challenges through a development state that places employment at the center of the fi ght against inequality within a prudently managed macroeconomic framework. Policy measures focused on skill development, the expansion of infrastructure net-works, small enterprise promotion, the development of rural econo-mies, industrial policy that promotes higher-value added exports, green economy initiatives, and regional integration are prioritized. Low domestic savings, currency volatility, inadequate investment in productive sectors of the economy, and the effi ciency of government services delivery are some of the other challenges. To conclude, even though the BRICS have pursued diff erent paths of growth with diff erent macroeconomic parameters and varied institutional strengths, the world seems to be optimistic about their emergence based on their respective durable comparative advantages. Th e growing role of the BRICS is confi rmed by the rapid recovery of these economies from the global fi nancial crisis, which demonstrates that optimal global economic policy-making cannot be undertaken without including the BRICS economies at the highest levels of decision making.

Impact of the Financial Crisis on BRICS
Introduction
Th e recent global fi nancial crisis that engulfed almost all economies marked a painful adjustment at the macro level coupled with micro-level distortions and incentives created by past policy actions. Th is included excessive leverage combined with inadequate regulation, lack of appropriate fi nancial supervision, fl awed credit ratings, and failure to appropriately identify the build-up of risks associated with fi nancial innovations. Th e low interest rate regime, which was the result of an accommodative monetary policy, led to debt levels acquiring unsustainable proportions. Th e global savings glut com-bined with aggressive marketing by housing fi nance institutions and under-pricing of risks fuelled the build-up of sub-prime mortgages. Th us, a number of micro- and macro-economic factors have been listed in the literature as the proximate causes of the crisis—the role of easy money, fi nancial innovations, and regulatory loopholes.
2

80 the brics report
Th e intensifi cation of the fi nancial crisis in September 2008 caused an abrupt increase in uncertainty and led to a downward reassess-ment of wealth and income prospects. Th ese developments, in turn, prompted households to postpone spending on most durables, even though falling commodity prices helped boost real disposable income. Th is drop in demand and dearth of credit set off an unprecedented collapse of real economic activity, sending a feedback loop to the stressed fi nancial sector. As a result, average growth in 2008 slowed by almost similar magnitudes in advanced and emerging economies, with some diff erentiation because of country-specifi c circumstances.
Manifestation of the Global Crisis
Global trade linkages and fi nancial integration led to the rapid trans-mission of shocks from the US and Europe to the rest of the world. Th e impact of the crisis was felt in almost all the economies of the world to varying degrees. Th e crisis spread to the BRICS through all four channels—trade, fi nance, commodity, and confi dence chan-nels. Th e slump in export demand and tighter trade credit caused a deceleration in aggregate demand. Th e reversal of capital fl ows led to equity market losses and currency depreciations, resulting in lower external credit fl ows. During the initial phase of the crisis, the fi nancial shock was transmitted to the real economy, primarily through the equity price channel and, in a more diff erentiated fashion, through the credit channel. Th e shock to international confi dence had an immediate and sharp eff ect on capital fl ows to emerging markets, as investors reassessed risks and global capital fl ows collapsed. In addition to poor confi dence and wealth eff ects, the fall in equity prices led to a rise in

impact of the financial crisis on brics 81
the cost of capital and dampened investment confi dence. In terms of real linkages, the collapse in demand from advanced economies was transmitted through the integrated supply chain to developing economies, with dramatic eff ects on trade in these countries. Among the BRICS, the global fi nancial crisis erupted after the collapse of the US-based investment bank Lehman Brothers in September 2008. Th e banking sectors of the BRICS economies per-formed relatively well. In Brazil, the local currency and stock market saw huge fl uctuations as foreign investment dwindled, demand for commodity exports dried up, and external credit decreased. Th e external shock did interrupt the accelerated growth path by prompt-ing a slight fall of 0.6 per cent in GDP in 2009 (Table 2.1). In terms of foreign trade, Brazilian exports reached US$ 160.6 billion in 2007, about 11.8 per cent of GDP and 1.18 per cent of world exports. In 2009, total Brazilian foreign trade registered a fi gure of US$ 281 billion in its fl ow, a reduction of 24.3 per cent relative to 2008 when US$ 371 billion was traded. Th is drop was the direct result of the global fi nancial crisis, which led to a reduction in the international prices of mineral and agricultural commodities and in the overall external demand for goods and services. In the midst of the crisis, the fi nancial markets in Russia froze due to a rise in risk aversion and signifi cant correction of equity markets since 2007. Sovereign credit default swap (CDS) spreads also jumped by several hundred basis points. Th e sudden change in exchange rate expectations triggered by the collapse of oil prices in September 2008 led Russian banks and fi rms to seek to hedge their foreign currency exposures, exacerbating pressures on the rouble. Early in the crisis, the banking system was put under additional stress by deposit out-fl ows and some bank failures. Several mid-sized banks (Kit Finance, Svyaz Bank, Globex Bank, and Sobinbank) had to be rescued by

Tabl
e 2.
1 G
loba
l Fin
anci
al C
risis
and
BRIC
S: S
umm
ary
Indi
cato
rs
Indi
cato
rs/C
ount
ry
Braz
il Ru
ssia
In
dia
Chi
na
Sout
h Af
rica
20
08
2009
20
08
2009
20
08
2009
20
08
2009
20
08
2009
1 2
3 4
5 6
7 8
9 10
1
1
GD
P G
row
th
5.2
–0.6
5.
2 –7
.8
7.3
5.7
9.6
8.7
3.6
–1.7
Inve
stmen
t Rat
e/G
DP
18.2
16
.6
26.2
22
.7
35.6
34
.5
42.5
44
.8
22
19.4
CPI
Infl a
tion
5.7
4.9
14.1
11
.7
8.3
10.9
5.
9 –0
.7
11.5
7.
1
Fisc
al D
efi c
it/G
DP
–1.3
–3
.2
4.3
–6.2
–7
.4
–9.6
–0
.4
–3
–0.5
–5
.2
Gro
ss D
ebt/G
DP
64.1
68
.9
7.8
10.9
72
.6
74.2
16
.8
18.6
27
.3
30.5
CAD
/GD
P –1
.7
–1.5
6.
2 4.
0 –2
.2
–2.1
9.
4 5.
8 –6
.2
–4.0
Expo
rts G
row
th
23.2
–2
2.7
33.1
–3
5.7
29.7
–1
5.2
17.3
–1
5.9
41.1
–2
4.5
Impo
rts G
row
th
43.4
–2
6.7
30.6
–3
4.3
40.3
–2
0.1
18.3
–1
1.3
38.5
–3
0.4
Exch
ange
Rat
e*
31.9
–2
5.5
5.1
–5.6
22
.9
–3.7
–6
.4
–0.1
-8
.1
4.1
Equi
ty M
arke
t Ind
ices
–5
7.6
121.
3 –5
1.9
58.8
–6
5.1
100.
5 –7
4.2
100.
3 –5
.0
–13.
1(p
erce
ntag
e ch
ange
)
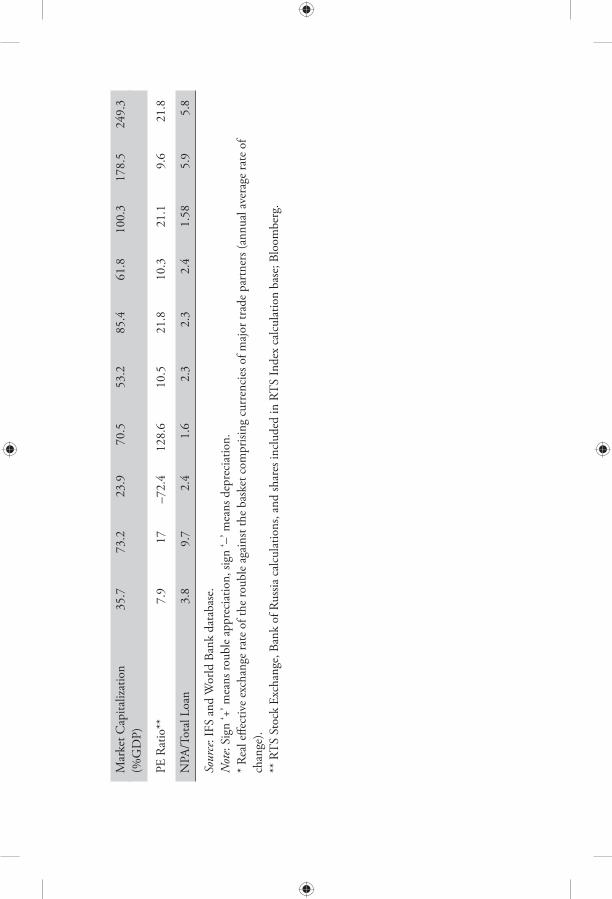
Mar
ket C
apita
lizat
ion
35
.7
73.2
23
.9
70.5
53
.2
85.4
61
.8
100.
3 17
8.5
249.
3(%
GD
P)
PE R
atio
**
7.9
17
–72.
4 12
8.6
10.5
21
.8
10.3
21
.1
9.6
21.8
NPA
/Tot
al L
oan
3.8
9.7
2.4
1.6
2.3
2.3
2.4
1.58
5.
9 5.
8
Sour
ce: I
FS a
nd W
orld
Ban
k da
taba
se.
Not
e: Si
gn ‘+
’ mea
ns ro
uble
app
reci
atio
n, si
gn ‘–
’ mea
ns d
epre
ciat
ion.
* Re
al e
ff ect
ive
exch
ange
rate
of t
he ro
uble
aga
inst
the
bask
et c
ompr
ising
cur
renc
ies o
f maj
or tr
ade
part
ners
(ann
ual a
vera
ge ra
te o
f ch
ange
). **
RT
S St
ock
Exch
ange
, Ban
k of
Rus
sia c
alcu
latio
ns, a
nd sh
ares
incl
uded
in R
TS
Inde
x ca
lcul
atio
n ba
se; B
loom
berg
.

84 the brics report
state entities or private investors between mid-September and mid-October 2008. In the initial phase of the crisis, the Indian economy remained relatively insulated, but witnessed a slowdown in GDP annual-ized growth from around 7.5 per cent in the fi rst half to 6.0 per cent in the second half of 2008, amplifi ed by a sharp contraction in the performance of the manufacturing sector. Th e signifi cant export-orientation of manufacturing exposed the sector to external demand shocks. Further, a large part of manufacturing exports (42 per cent) was accounted for by leather and manufactures, textile and textile products, gems and jewellery, and handicrafts, which are employment-intensive, with a major portion of exports in these sec-tors contributed by small-scale industries (SSIs). Th us, the external demand shock had a larger impact on output and employment in such industries, which had a direct bearing on domestic consump-tion demand. Th e impact of the fi nancial crisis on China took the form of a sharp drop in external demand, which in turn led to an economic slowdown, diffi culties for businesses, and rising unemployment. Structural problems also became more evident. Two indicators are widely accepted and used by economists to fi gure out the impact of the fi nancial crisis on China’s real economy. Th e fi rst one is industrial electricity consumption (which is a real indicator) and the other is industrial value-added (which is a value indicator). Th e trend of elec-tricity use registered an increase of about 10 per cent every month, but from the third season of 2008, the rate of increase dropped dra-matically. Th e outbreak and spread of the global fi nancial crisis had a severe impact on China’s fi nancial and real estate markets, which were mainly refl ected in the following: (i) Th e stock index fell in an accelerated manner. During the six months from May to October

impact of the financial crisis on brics 85
2008, the Shanghai stock exchange composite index dropped over 50 per cent. (ii) Real estate prices continuously declined. Between July 2008 and February 2009, the average sales prices index for buildings in 70 medium-to-large cities in China fell by about 2 per cent cumu-latively. (iii) Money supply and loan supply growth rate continued to fall. From May to November 2008, the year-on-year M2 growth rate fell by 3.3 per cent and loan supply growth rate for the same period remained low. (iv) From July 2008 to February 2009, the RMB’s real eff ective exchange rate rose dramatically by 14.5 per cent, resulting in an unfavourable eff ect on China’s exports. Th e sharp drop in China’s exports lasted over a considerable period, and in the second half of 2008, 15 per cent of export fi rms were forced to reduce output or even shut down. In South Africa, portfolio infl ows, which had accounted for the bulk of the fi nancing of South Africa’s large current account defi cits in the years leading up to the crisis, quickly turned to large net outfl ows, although overall net private fl ows remained positive as South African banks ran down foreign assets. Both export and import volumes plummeted, while the prices of most of South Africa’s main export commodities weakened, although this was outweighed by the eff ect of lower oil prices, resulting in an improvement in the terms of trade. Th e stock market, weakened directly by net outfl ows on the part of non-residents and indirectly by the large corrections in equity prices elsewhere, began falling in May 2008 but saw sharp declines between September and November 2008 in line with equities in other emerg-ing markets. Th e global fi nancial crisis infl icted signifi cant loss in output in all the BRICS economies. In terms of real GDP growth, Russia wit-nessed the sharpest fall in growth on account of worsening oil prices exacerbated by a fall in other commodities prices. Brazil, which had

86 the brics report
signifi cant trade linkages with Mercosur, the US, the Euro zone, and China, also witnessed a fall in external demand. Th e real GDP growth rate fell to (–) 0.6 per cent in 2009 mainly due to external sector shocks. South Africa also suff ered its fi rst recession since the early 1990s with a fall in the real GDP growth rate to (–) 1.7 per cent in 2009 due to the negative trade shock and sharp fall in domestic demand. Infrastructure spending in the run-up to the 2010 FIFA World Cup helped to mitigate some of the eff ects of the crisis, but did not fully off set weak private investment. However, real GDP growth in India and China remained impres-sive even though they also witnessed some moderation on the face of weakening global demand. Large domestic demand and policy measures to move towards more domestic sectors-driven growth helped to achieve strong growth even during a period of shrinking external demand.
Policy Responses and Managing the Recovery by the BRICS
Th e global fi nancial crisis resulted in signifi cant weakening of economic activity led by poor consumer and investor confi dence. As a result, all the BRICS countries initiated fi scal stimulus measures. In response to the global economic slowdown, the BRICS also pursued discretionary measures to move towards more domestic demand-driven mode (Table 2.2). Brazil was one of the fi rst countries to emerge from the crisis, engaging in a V-shaped recovery process after just two quarters of GDP slump. Th e combination of monetary easing, credit stimulus, and countercyclical fi scal policies had a positive impact on private

impact of the financial crisis on brics 87
consumption, propelling industrial growth. As consumption and the unemployment rate were quickly restored, a well-calibrated mon-etary policy allowed infl ation to remain within its aimed oscillation boundaries. Brazil’s strong macroeconomic fundamentals, including an adequate level of foreign exchange reserves and a sound fi nancial system, were key factors in reducing the impact of the crisis and help-ing the country to emerge from it ahead of the other economies. To provide adequate domestic liquidity in Brazil, the rules concern-ing reserve requirements were relaxed. Th is resulted in the injection of additional liquidity equivalent to 4 per cent of the GDP (Table 2.3). However, as most of the additional liquidity was concentrated in the
Table 2.2 Size of Discretionary Measures in Financial Crisis
(percentage of GDP)
Country 2008 2009 2010
1 2 3 4
BRICS
Brazil 0 0.6 0.6
Russia 0 4.1 1.3
India 0.6 0.6 0.6
China 0.4 3.1 2.7
South Africa 2.3 3.0 2.1
Advanced Countries
Italy 0 0.2 0.1
Japan 0.3 2.4 1.8
Korea 1.1 3.6 4.7
United Kingdom 0.2 1.6 0
United States 1.1 2.0 1.8
Source: IMF Staff Position Note, Fiscal Aff airs Department, International Monetary Fund, July 2009.

Table 2.3 Measures by Central Banks
Country Monetary Measures
Brazil Brazil has featured high levels of reserve requirements, allowing the central bank to lower reserve requirements for macro-prudential purposes following the Lehman Brothers episode. In particular, to confront liquidity problems in the inter-bank market, the central bank reduced reserve requirements to support lending from large liquid banks to small illiquid banks. By introducing this liquidity provision mechanism during the crisis, the central bank was able to avoid fi nancial stability problems in the system.
Russia Th e authorities’ eff orts to stabilize the banking system dur-ing the fourth quarter of 2008 aimed to provide signifi cant liquidity while keeping the exchange rate stable to off set the abrupt loss of foreign fi nancing. Starting in April 2008, the government auctioned excess budgetary funds to banks, while the Central Bank of Russia (CBR) provided an ever-widening array of liquidity facilities, including long-term subordinated loans and uncollateralized loans, which had been provided under special federal laws. In 2008–9 the Bank of Russia broadened the range of assets that banks could use as col-lateral in refi nancing transactions and extended the terms of loans secured by non-market assets, such as promissory notes, credit claims, or credit institution guarantees. Th e CBR also off ered guarantees for inter-bank lending to qualifying banks, covering losses in the event that the licence of the counter-party was withdrawn. In March 2009, another bank recapi-talization scheme was announced that entailed an exchange of preferred shares for government bonds. Adjustments in the interest rates were active tools in the Bank of Russia’s response to the global fi nancial crisis. Th e refi nancing rate was increased in the second half of 2008. Th en the Bank of Russia imple-mented a series of reductions in the refi nancing rate: from 13 per cent in April 2009 to 7.75 per cent in June 2010. Th e CBR temporarily lowered the required reserve ratios in September and in October 2008.
India Th e policy repo rate under the liquidity adjustment facility (LAF) was reduced by 400 basis points, from 9 per cent to 5 per cent. Th e policy reverse repo rate under the LAF was

reduced by 250 basis points, from 6 per cent to 3.5 per cent. Th e cash reserve ratio (CRR) was reduced by 400 basis points from 9 per cent of net demand and time liabilities (NDTL) of banks to 5 per cent. Th e statutory liquidity ratio (SLR) was reduced from 25 per cent of NDTL to 24 per cent. Th e export credit refi nance limit for commercial banks was enhanced to 50 per cent from 15 per cent of outstanding export credit. A special 14-day term repo facility was insti-tuted for commercial banks up to 1.5 per cent of NDTL. A special refi nance facility was instituted for scheduled com-mercial banks (excluding RRBs) up to 1 per cent of each bank’s NDTL as of 24 October 2008.
China China made eff orts to guide fi nancial institutions to make remarkable credit planning. Since September 2008, the PBC has lowered the benchmark deposit and lending rates fi ve times, from 4.14 per cent to 2.25 per cent and from 7.47 per cent to 5.31 per cent, respectively. To amplify liquidity in the banking system, the PBC cut the RMB reserve requirement ratio of fi nancial institutions four times in the latter half of the year 2008. Specifi cally, the reserve requirement ratio of large fi nancial institutions was cut by 2 percentage points cumulatively, whereas that of small fi nancial institutions was cut by 4 percentage points cumulatively. Th e 1-year central bank liquidity lending rate was cut from 4.68 per cent to 3.33 per cent. Th e rediscount rate was cut from 4.32 per cent to 1.8 per cent. At the same time, the PBC eliminated quantitative ceilings for fi nancial institutions’ credit lending and promoted greater support for SME lending to increase their credit supply and optimize the credit structure.
South Africa In response to the fi nancial crisis during December 2008, the Monetary Policy Committee of SARB reduced its policy rate by 50 basis points. Further cuts worth 600 basis points reduced the repo rate to an all-time low of 5.5 per cent by November 2010. Interest rate reductions were facilitated by an improved infl ation outlook against the backdrop of slow-ing economic growth (increasing output gap) and declining commodity prices.
Country Monetary Measures
90 the brics report
larger fi nancial institutions, other measures were needed to spread liquidity to the whole system. To dispel fears about the soundness of the domestic banking sector, the central bank (BCB) allowed the Credit Guarantee Fund (FGC, known in Brazil as Fundo Garantidor de Crédito), the Brazilian deposit guarantee system that is privately funded and public regulated, to include an additional temporary guarantee for a special type of time deposit that was especially cre-ated to restore liquidity in the small and medium bank segments. Initiatives to inject liquidity in the foreign currency market com-prised the selling of US$ 14.5 billion in the spot market, exchange rate swap operations of US$ 33 billion and auctions of US$ 24.4 billion to provide short-term fi nancing to exporters. As the crisis deepened, the BCB initiated a series of interest rate cuts that lasted until July 2009 and totalled 5 per cent. To stimulate sales and produc-tion, the tax on manufactured goods (IPI) on vehicles, household appliances, capital goods, and building construction materials was signifi cantly reduced or, in some cases, set to zero. In an additional eff ort to boost consumption, the tax on fi nancial transactions (IOF) charged on credit operations to households was reduced from 3.0 per cent to 1.5 per cent. Apart from these measures, there were loans from state-owned banks, and injections by the treasury into BNDES, the state-owned National Development Bank, which boosted the bank’s lending capacity to energy and infrastructure sectors and allowed the launching of new credit facilities for exporters and for the production of capital and consumption goods. Th ese measures supplemented the growth recovery process in Brazil. Finally, in October 2008, the US central bank (the Fed) agreed to channel the BCB with a US$ 30 billion swap line, which was not drawn upon. Russia came up with one of the largest fi scal stimulus packages in the G-20. Th e expansionary fi scal stance manifested in a rise in
impact of the financial crisis on brics 91
government expenditure and pushed up the government (non-oil) defi cit from 8.25 per cent of GDP in 2008 to 15 per cent of GDP in 2009. In the second half of 2008 the main challenges of the monetary policy were to ensure fi nancial stability and to curb capital outfl ow. Th en the Bank of Russia started to ease monetary policy in order to support economic growth: between April 2009 and June 2010, the refi nancing rate was reduced by 525 basis points to 7.75 per cent. Due to aggressive fi scal policies accompanied by monetary easing, Russia’s fi scal health emerged almost unscathed from the global crisis. Th ough the economy contracted by 7.8 per cent in 2009, it reverted to the path of stability in the fi rst quarter of 2010 with real GDP registering a growth of 3.5 per cent. In the case of Russia, prudent management of oil revenues provided the leeway, not only for substantial fi scal expansion in the face of the crisis, but also to monetize the defi cit. Th e stabilization funds were drawn down without any signifi cant risk to external vulnerability. As a result, apart from the improvement in the general indicators of economic recovery, Russia emerged from the crisis with a low public debt ratio (around 11 per cent of GDP), unlike the advanced economies of the West including those in the Euro zone and the US. India’s policy response to the crisis was aimed at containing the contagion from the outside—to keep the domestic money and credit markets functioning normally and to ensure that the liquidity stress did not trigger solvency cascades. In particular, three objectives were pursued with respect to the fi nancial sector: fi rst, to maintain a comfortable rupee liquidity position; second, to augment foreign exchange liquidity; and third, to maintain a policy framework that would keep credit delivery on track so as to arrest the moderation in growth. Besides challenges thrown by the global fi nancial melt-down, the policy responses also involved the challenge of balancing
92 the brics report
short-term mitigation and medium-term sustainability. Th e measures to meet these objectives came in several policy packages from the Government of India and the RBI starting in mid-September 2008. Th e fi scal policy measures undertaken by India in the form of three fi scal stimulus packages during the second half of 2008–9 constituted tax cuts, encouraging investment in infrastructure and increased expenditure on both investment and consumption. Th e expansion-ary fi scal stance continued in the Union Budget for 2009–10, which was presented against the backdrop of moderation of growth in the economy and signs of stabilization in the global economy. Th e alloca-tion for crucial sectors such as infrastructure, education and health, rural employment, and empowerment of disadvantaged sections of the population was enhanced signifi cantly. Additional expendi-ture amounting to 3 per cent of GDP was provided through three supplementary demands for grants during October–December 2008 and February 2009. Th e monetary policy response was in terms of easing liquidity in the system through conventional measures such as cutting policy rates (cash reserve ratio [CRR], reverse repo, and statutory liquidity ratio [SLR]) and open market operations, and unconventional measures, that is, opening refi nance facilities to SIDBI and EXIM Banks and rolling back prudential norms with regard to provisioning and risk weights. Th e total amount of actual/potential liquidity injected was Rs 5,850 billion. China adopted a proactive fi scal policy and a moderately easy monetary policy, and put in place a package plan to ensure steady and relatively rapid economic growth. Th e most immediate and impor-tant goal of the package plan was to reverse the economic downturn and maintain steady growth. It was also designed to address struc-tural problems constraining China’s economic development, speed up transformation of the growth pattern, and raise the quality and
impact of the financial crisis on brics 93
performance of factors of production in order to lay a more solid foundation for growth in the long run. First, it aimed to boost domestic demand in a comprehensive way and strengthen the role of consumer demand in driving economic growth to promote balanced economic development; second, it sought to improve infrastructure across the country and promote coordinated economic development; third, it attempted to enhance the competitiveness of industry and capac-ity for independent innovation and promote sustainable economic development; and fourth, it worked for all-round development of the people and promoted intensive economic development. To serve the overall objective of promoting economic growth and to expand domestic demand and restructure the economy, the People’s Bank of China (PBC) implemented a moderately easy monetary policy by adopting fl exible and eff ective measures to strengthen fi nancial sup-port for economic growth, ensuring that the aggregate money and credit supply satisfi ed the needs of economic development. Th e PBC has conducted open market operations, timely and appropriately, to ensure suffi cient liquidity in the banking system in general, and to stabilize market expectations. In 2011, to tackle the potential risk of growth slowdown and the increasing pressure from rising prices, China continued its proactive fi scal policy and adjusted the moder-ately easy stance of monetary policy to a prudent one. Proactive fi scal policy eff ectively boosted domestic demand, promoted economic restructuring, and improved the people’s livelihood. Th e problem of price rise was addressed through the use of prudent monetary policy tools. Since September 2008, the PBC has lowered the benchmark deposit and lending rates of fi nancial institutions fi ve times, from 4.14 per cent to 2.25 per cent, and from 7.47 per cent to 5.31 per cent, respectively. Th e deposit and lending rates between fi nancial

94 the brics report
institutions and the PBC were cut twice; in particular, the deposit rates of statutory reserve and excess reserve ratios with the PBC were cut from 1.89 per cent and 0.99 per cent to 1.62 per cent and 0.72 per cent, respectively. Th e 1-year central bank liquidity lending rate (re-loan rate) was cut from 4.68 per cent to 3.33 per cent; the 1-year central bank lending rate to rural credit cooperatives was cut from 3.96 per cent to 2.88 per cent; and the rediscount rate was cut from 4.32 per cent to 1.80 per cent. To ensure suffi cient liquidity in the banking system, the PBC cut the required reserve ratios four times. Specifi cally, the reserve requirement ratio of large fi nancial institu-tions was cut by 2 percentage points cumulatively, while that of small fi nancial institutions was cut by 4 percentage points cumulatively. At the same time, the PBC eliminated quantitative ceilings for fi nancial institutions’ credit lending, guided fi nancial institutions to increase their credit supply, and optimize the credit structure, following the principle of diff erentiated treatment which encouraged growth in some sectors. Th e PBC strengthened credit services to agriculture, rural areas, farmers, small and medium-sized enterprises, employment programmes, post-disaster reconstruction, consump-tion expansion, and independent innovation, while ensuring that loans to eligible central government investment projects were granted in a timely manner. In South Africa, fi scal and monetary policies responded to the crisis in a countercyclical manner by allowing the fi scal defi cit to increase as government revenues dropped, increasing government spending and sharply reducing interest rates. Sound public fi nances during the pre-crisis boom period (2002–7) provided South Africa with the fi scal space to provide stimulus during the 2008–9 recession. Th e size of the budget defi cit had declined from 5.7 per cent of GDP in 1995 to a surplus of about 1 per cent of GDP in 2007–8, which helped
impact of the financial crisis on brics 95
to reduce the government’s debt burden from 47 per cent of GDP to only 27.1 per cent in 2008–9. As a result, the government was able to sustain spending on crucial social services and infrastructure investment during the recession. Th e shortfall between expenditure and revenues was funded by increased borrowing. Th e consolidated government budget balance worsened by about 5 percentage points of GDP in 2009–10, due in roughly equal measure to a decline in the revenue-to-GDP ratio and a rise in expenditures to GDP. Most of that deterioration was cyclical, refl ect-ing the emergence of a negative output gap and the operation of automatic stabilisers on the revenue side, but about 1.4 percentage points of GDP corresponded to a structural increase in expenditure. Th is was less a function of discretionary anti-crisis measures than the maintenance of pre-existing ambitious public sector investment plans (both on the part of the government and government loans to key state-owned enterprises for capital purposes). Public consump-tion also supported output during the decline. Th is was driven by above-budgeted public-sector wage settlements in 2009 and the choice to extend the child support grant up to a child’s 18th birthday, and fi nalization of previously announced extensions to the old age pension grant. Interest rates were reduced by 650 basis points between December 2008 and November 2010. SARB began to ease rates in December 2008 after the eff ects of the collapse of Lehman Brothers became apparent. Soon after the international crisis struck, the Monetary Policy Committee (MPC) moved to monthly meetings, from the earlier frequency of once every two months, to be more responsive to developments. Th e SARB’s repo rate bottomed out at 5.5 per cent and no emergency actions, like capital support for banks or quantitative easing to support lower interest rates were judged necessary, given the

96 the brics report
absence of severe diffi culties in the banking sector. Real interest rates were negative in South Africa in the fi rst half of 2009, but actually less than rates prevailing just before the crisis and, with the continued fall in infl ation by the second half of the year had turned substantially positive again. Th e growing sense of normalization was refl ected in the MPC’s move back to bi-monthly meetings in November 2009. An important element of South Africa’s resilience to the global economic crisis was that it did not experience a banking crisis. Despite the sharp swing from rapid economic growth into recession, and in particular the decline in house prices after a long mortgage lending boom, South Africa experienced no bank failures. Non-performing loan (NPL) rates did surge in 2009, but the surge in bad loans was not refl ected in major losses for the banks. Th ere were several reasons for this, including the banks’ strong profi tability, the low level of NPLs and comfortable capital cushions going into the downturn; their lack of direct exposure to problem assets in the US and Europe; bankruptcy laws that favour creditors in recovering collateral for bad loans; and conservative approaches on the part of both the regulator and the banks themselves. In addition, the lending boom was already cooling prior to the intensifi cation of the international crisis in September 2008, in part because the National Credit Act came into force and tightened standards on lending to households. Th e framework for South Africa’s response to the international eco-nomic crisis emphasised the urgent need to use industrial and trade policy, preferential treatment for domestic fi rms in procurement, and rescue packages for crisis-aff ected sectors, but there has been little concrete action in these areas. Some tariff s, mainly on clothing, were raised, and a small number of anti-dumping investigations were launched. Corporate bail-outs were also not a major feature of the downturn. Although macroeconomic policies were supportive and

impact of the financial crisis on brics 97
the downturn was not particularly deep compared to the international average, it was nonetheless relatively prolonged. Th e main reason why South Africa did not experience a V-shaped recovery, as did some other emerging markets, is that the country was already moving into a cyclical downturn when the international crisis struck. Growth has resumed in South Africa and has been strengthening. After three negative quarters, real GDP growth turned marginally positive (+0.2 per cent quarter-on-quarter seasonally adjusted, and not annualised) in the third quarter of 2009 and quickened to 0.8 per cent in the fourth quarter, as private consumption growth resumed and the rate of inventory drawdowns slowed. Growth accelerated further in the fi rst quarter of 2010 and GDP expanded by 2.7 per cent in the year as a whole. Government consumption contributed positively throughout the recession and subsequent recovery, but pri-vate sector gross fi xed capital formation declined sharply and took a long time to recover. Both export and import volumes rebounded in the second half of 2009. Although some sectors, such as manufactur-ing, have experienced a signifi cant bounce-back from the low point of the recession, others, including wholesale and retail trade, agri-culture and fi sheries, and fi nance and real estate, have lagged. Two important factors hindering the recovery appear to be credit growth and employment. With household debt levels remaining high and weakening labour market conditions, consumption has so far played less of a role in the recovery than in many other emerging countries.
Lessons from the Global Financial Crisis
In their well-researched book, Th is Time is Diff erent: Eight Centuries of Financial Folly, Kenneth Rogoff and Carmen M. Reinhart show
98 the brics report
how over a period of 800 years all fi nancial crises can be traced to the same fundamental causes. Each time, experts have chimed that ‘this time is diff erent’, claiming that the old rules do not apply and the new situation is dissimilar to the previous one. Th e crisis then came as a serious blow to the credibility of central banks and the reputation of central bankers. Th e challenge for central banks, as indeed for all policymakers, is to learn lessons from the crisis and incorporate them in their policies.
Balancing the Financial and Real Sectors
Th e fact that a well-developed fi nancial sector is necessary to act as the intermediary between entrepreneurs/investors and savers can hardly be overstated. An effi cient fi nancial sector reduces the cost and risk of producing and trading goods and services and, thus, makes an important contribution to raising the standards of living. Th e recent crisis, however, showed that the fi nancial sector had apparently assumed a quasi-autonomous existence without close connection with the fi nancing requirements of the real economy. Th e fi nancial industry, indeed, grew oversized in the preceding years as refl ected in rapid credit creation, asset price bubbles and high levels of indebted-ness, particularly in advanced fi nancial systems. Th e disproportionate growth in the global fi nancial sector was largely due to the aggressive search for yield, engendered by easy liquidity in the global system that triggered a wave of fi nancial innovations. Complex fi nancial products were created by structuring and hedging, originating and distributing, all under the belief that real value could be created by sheer fi nancial engineering. As mentioned earlier, there were hardly
impact of the financial crisis on brics 99
any signs of growing capital formation due to the growing and increasingly complex fi nancial sector. In short, as a result of the excess liquidity that permeated the global economy, particularly in the US but also in other countries, there was excessive ‘fi nancialization’. Th e fi nancial sector grew more rapidly than other goods and services sectors. In a way, that made the growth of fi nance an end in itself and not a means to meet human needs such as food, fuel, health, and education. Given that the burst-ing of the oversized fi nancial sector has a devastating impact on the real sector, it becomes important (i) to examine the optimal size of the fi nancial sector relative to growth and development needs and (ii) to make fi nancial sector innovations more meaningful to cater to the needs of the real sector.
Domestic Demand as a More Durable Source of Growth
Th e impact of the crisis on the external demand of EMEs has been clearly visible since the last quarter of 2008. In the fi rst instance, the downturn in the US, Europe, and subsequently in Japan was mani-fested in a sharp contraction in exports from those EMEs that had become the largest exporters to the industrial world. Subsequently, exports of raw and intermediate goods from relatively smaller EMEs to larger EMEs declined. In some commodity-exporting countries, particularly Russia, exports fell by more than 40 per cent in the fi rst quarter of 2009. Since prices fell sharply as world growth slowed, they led to declining incomes in EMEs which, in turn, tended to reduce demand and growth. In view of the adverse impact of the crisis on domestic growth, EMEs may need to review their undue
100 the brics report
dependence on external demand and attempt to generate demand within their economies. A reasonably balanced macroeconomic management strategy appears to have enabled the BRICS econo-mies to minimize the spill-over eff ects of the external shocks to a great extent.
Financial Sector Reforms
Emerging market economies, still in the process of developing their fi nancial systems, can take up this opportunity to learn from the crisis and develop a robust fi nancial sector with a sound systemic oversight framework. Th e experience of the recent crisis demonstrates that the fi nancial system in most emerging Asian countries was relatively resilient to global shocks as reforms, which had been put in place after the East Asian crisis, fostered transparency and governance, and strengthened regulation and supervision. Th e crisis lessons do not call for overregulation as this could restrain growth impulses. A judicious approach while formulating fi nancial liberalization mea-sures, however, proved to be extremely eff ective as refl ected in the strengthening of banks by public recapitalization in some advanced economies. Alternatively, regulators and supervisors should work on proper regulation of the so-called ‘innovations’ that allowed the build-up of risks within the fi nancial sector to be disguised; moni-toring and establishing limits to tame the overexposure of domestic banks to toxic assets globally; adequately regulating and supervis-ing the real estate market, in order to avoid the excessive artifi cial growth of fi nancial investors in real estate; regulating the activities of systemically important non-bank fi nancial institutions as well as sub-mitting all systemically important fi nancial institutions to intensifi ed

impact of the financial crisis on brics 101
supervisory procedures; and speaking out against hasty and poten-tially risky attempts to liberalize the capital account of the balance of payments. Th us, countries should self-insure against future crises by putting in place, as best as they can, robust economic and fi nancial policy frameworks that help minimize their vulnerabilities. It has been observed that banks that rely heavily on wholesale funding are naturally more vulnerable to any shock to market liquid-ity. When loans are larger than deposits, banks may resort to funding from foreign parents or domestic and international wholesale mar-kets to fi nance the gap. Likewise, there is anecdotal evidence that the presence of foreign banks was associated with currency mismatches. Th is indicates that emerging markets, while encouraging the entry of foreign banks, should simultaneously strictly regulate their local lending practices.
Social Security System
Th e resilience of EMEs to external shocks is unlikely to be fully guaranteed given the increasing trade and fi nancial integration with advanced markets. Th erefore, it becomes important, albeit challeng-ing, for emerging and developing countries to gradually put in place an eff ective social safety net system which not only helps as an auto-matic stabilizer but also attenuates the need for undertaking sudden large-scale discretionary fi scal policy measures that lead to long-term fi scal sustainability concerns. An improvement in both the social safety net system and fi nancial markets may foster the development of domestic demand contributing to enhanced market strength. An improvement in the social security system and the fi nancial markets may also decrease private savings in the long run.
102 the brics report
Concluding Observations
Th e global economic crisis which originated in the fi nancial sec-tor infl icted signifi cant output loss, impaired the balance sheets of households and corporations and caused an overall fall in economic activity. Th e crisis also exposed the structural weaknesses of the fi nan-cial and real sectors. Th e BRICS economies recovered swiftly with the support of domestic demand. Still, the recovery is yet to be made compatible with the fi scal consolidation process. Besides the current recovery process, there are specifi c lessons for BRICS economies from the recent crisis. Th ese lessons include (i) recognizing the invalidation of the decoupling hypothesis, (ii) allowing domestic demand to serve as a durable source of growth, (iii) instituting fi nancial sector reforms, (iv) monitoring speculative capital fl ows, (v) recognizing the creation of fi scal policy space on a sustainable basis as a central feature of their reform agenda, and (vi) focusing on infrastructure development and employment generation.

Best Practices
Th is chapter looks at the best practices and institutions within the BRICS economies that have made signifi cant diff erences to these economies and contributed to their high growth rates. Th e purpose is to showcase successful practices and institutions for the rest of the world to draw lessons for social upliftment, poverty reduction, fi nancial sector stability, and faster economic growth. Many of these practices and institutions have relevance within the BRICS bloc for enhancing cooperation and creating synergies, so that the BRICS could collectively grow faster. Th is is the case despite the fact that the BRICS are culturally, demographically, and politically disparate, each with its own unique identity and institutions. Major showcase areas for Brazil include agricultural research, which has transformed the country into a major exporter; the use of bio-fuel for road transport, and the emergence of Embraer as a high-technology aircraft manufacturer. In the social sphere, Conditional Cash Transfers that target poverty and the success of the anti-AIDS policy provide useful lessons. A regulatory framework that helped Brazil withstand the shock of the global crisis and the issuance of
3
104 the brics report
domestic currency-denominated international bonds, which transfer currency risk to investors, are other successful practices that have been highlighted. Russia’s major achievements include reforms during 1999–2009 that promoted economic growth, lowered infl ation, and led to a dramatic fall in the number of people living below the poverty line. Specifi c achievements include setting up of the Oil Stabilisation Fund that was successful during the crisis, budgetary reforms through the devolution of decision-making powers, and the introduction of a fl at personal income tax rate of 13 per cent that ensured improvement in compliance. Th e main showcase institution for India is private entrepreneur-ship which has been instrumental in achieving 8–9 per cent annual growth of the economy in recent years. Private initiative has been responsible for the excellence achieved in the information technology sector and the innovative streak that has led to improvization and production of low-cost goods for the Indian mass market. Besides, the calibrated approach to capital account convertibility and the External Commercial Borrowing Policy have helped insulate the economy against surges and reversals of debt fl ows and maintained the external debt at sustainable levels. Th e Right to Information Act is increasing transparency and accountability of government operations and the Mahatma Gandhi National Rural Employment Guarantee Scheme is a major step towards making growth inclusive. Th e best practices and institutions of China are those that have helped ensure progress in terms of economic growth, enhancing its national strength and improving the living standards of its people as well as the success in making the historic transition from a highly centralized planned economy to a robust socialist market economy and from a closed and semi-closed country to a country that is open
best practices 105
to the outside world. Specifi c areas are FDI attraction and utilization, and infrastructure fi nancing, among others. Th e Chinese globalization model has also been diff erent, in that foreign direct investment was encouraged. Th e sub-national govern-ments (cities/provinces) have been successful in attracting foreign investment by providing improved infrastructure and a favourable regulatory environment. China also has experience in fi nancial mac-ro-management. Th e reform and development of China’s banking industry and fi nancial market played a key role in promoting rapid and sustainable economic growth. South Africa has a long record of responsible macroeconomic management, which has helped to promote the development of a deep and liquid bond market and reduced external vulnerability. South Africa has strong institutions and a highly developed, well-regulated banking sector that escaped the worst eff ects of the fi nancial crisis. With the most developed industrial and fi nancial capabilities on the African continent, South Africa’s role in the integration of policies, markets, fi nance, and infrastructure is vital to Africa’s eco-nomic development and realization of the continent’s potential as a growth pole in the global economy. Outwardly oriented South African companies are among the largest sources of FDI in Africa and the country’s development fi nancing institutions are playing an increasing role in the funding of regional infrastructure investment.
Brazil
Agriculture
Brazilian agriculture has undergone dramatic changes in the past few decades. From a net importer of food grains, Brazil has emerged as

106 the brics report
a major exporter of food products. Th is change has been possible due to major technological breakthroughs and the extension of cultivation to previously uncultivable land. More important, the change has not happened at the expense of the Amazon rainforest, as is sometimes believed, but through the extension of cultivation to a region called the Cerrado, which is 1,000 km south of the Amazon forest and was earlier regarded as having limited cultivation potential. Th e FAO estimate for the total potential cultivable land of Brazil is over 400 million hectares. Th us far only 59.5 million is being used, with most of the new land in the Cerrado. Th e success of agriculture has also raised expectations that Brazil may be able to meet the growing global food demand–supply gap resulting from growth in population and per capita income.
Agricultural Research
Much of the credit for agricultural transformation in Brazil goes to Embrapa, which is the abbreviation for Empresa Brasileira de Pesquisa Agropecuaria or the Brazilian Agricultural Research Corporation. Th e organization was set up by the national government in April 1973 to develop agricultural technologies through research and innovation. Th e decision was prompted by a period of rapid population growth and a large increase in per capita income, which created the risk that the country might not be able to meet its growing domestic demand for food. Th e organization has since developed more than 9,000 technologies for Brazilian agriculture, reduced production costs, and increased the supply of food while conserving natural resources and the environment.

best practices 107
Among its major achievements, Embrapa is largely responsible for expanding the agricultural frontier into a region called the Cerrado, which was previously considered uncultivable. Th e Cerrado occupies about 23 per cent of the Brazilian territory and has acidic soil with low levels of nitrogen and phosphorous. To overcome this limita-tion, Embrapa developed, inter alia, acidity correction technologies by pouring industrial quantities of lime (pulverised limestone or chalk), encouraged the expansion of Brazil’s beef herd and adapted soybeans (a temperate climate crop) for the tropical climate. Today, the Cerrado accounts for 70 per cent of Brazil’s farm output. Th e region also accounts for 60 per cent of the country’s production of soybeans. Th is was followed by the development of a new variety of grass, which is a crossbreed with an African grass called brachiaria. Th e new variety produced 20–25 tonnes of grass feed per hectare, many times the native Cerrado grass output. Th is helped turn parts of the Cerrado into pastures, making possible the enormous expansion of Brazil’s cattle herd. In addition, Embrapa was successful in turning soybean into a tropical crop. Soybean is a temperate climate crop native to north-eastern Asia (Japan, the Koreas, and north-east China) and is sensitive to temperature changes. All other large soybean producers (notably America and Argentina) have temperate climates. Earlier, Brazil was growing soybean in its temperate southern states. However, with cross-breeding, Embrapa began growing soybean in a tropical climate, on the rolling plains of Mato Grosso state, and in the Cerrado. More recently, Brazil has been importing genetically modifi ed soy seeds and is now the world’s second-largest user of genetically modi-fi ed seeds after the United States. Embrapa has won approval for its fi rst genetically modifi ed seeds. Embrapa has also pioneered ‘no-till’ agriculture, where the soil is not ploughed nor the crop harvested at

108 the brics report
ground level. Instead, the crop is cut high on the stalk and the remains of the plant are left to rot into organic material. Next year’s crop is then planted directly into the material, retaining more nutrients in the soil. In 1990, Brazilian farmers used no-till farming for 2.6 per cent of their grain output, which has now risen to over 50 per cent. Embrapa has a budget of over US$ 1.0 billion per year and employs almost 9,000 people. It is organized as a large network, comprising 41 decentralized centres in all regions of the country. It has signed 68 technical co-operation agreements with 46 countries and 89 foreign institutions, particularly in the area of agricultural research, and has ongoing multilateral agreements with 20 international organizations, involving research partnerships and technology transfers. Th e insti-tution has established partnerships with laboratories in the United States and Europe (France, England, and Netherlands) for research in advanced technology. In the sphere of technology transfer to devel-oping countries, achievements include the opening of the Embrapa’s technology transfer projects in Africa (Ghana), South America (Venezuela), and Central America and the Caribbean (Panama), which has allowed wider dissemination of innovations and technolo-gies developed by Embrapa.
Bio-energy Fuels: Ethanol
Brazil has a track record of running the most successful bio-fuel pro-gramme in the world. Th e main objective of the Proálcool Programme, which was launched by the Brazilian government in the mid-1970s, was import substitution. Th e idea was to reduce imports of petro-leum products by using ethanol in transport vehicles. Government subsidy was extensively provided for this purpose.
best practices 109
In addition to government subsidy to promote ethanol use, the Brazilian car industry played a major role in disseminating this technology by developing fl ex-fuel engines that could run on both gasoline and ethanol. Consumers, therefore, have a choice regarding the use of gasoline or ethanol—the choice often depending on the relative prices. Last year, the proportion of fl ex-fuel vehicles in the Brazilian market exceeded 90 per cent. Ethanol now accounts for 90 per cent of liquid biofuels consumed in the world and ethanolproduction in Brazil and the world nearly quadrupled between 2000 and 2008. Research on the use of ethanol as a transport fuel began in Brazil in the 1930s and benefi ted from strong government support. Th e Proálcool Programme was launched in 1975, and provided for a 20 per cent gasoline mix. Th e main purpose was to lower dependence on oil imports. Hydrated alcohol was introduced as a direct substitute for gasoline in 1979. Th is led to a sizeable increase in consumption and production of alcohol between 1976 and the mid-1980s. Th e programme received a setback at the beginning of the 1990s, due to the macroeconomic crisis that aff ected the Brazilian economy. Oil prices were falling and there was a lack of trust among consumers regarding hydrated alcohol. As a result, few cars using ethanol fuel were produced. Th e use of alcohol as a transport fuel was receiving hardly any serious international attention. Th e programme was revived early in 2000, with government sup-port limited to supervision and regulation. A milestone was achieved in 2003 with the introduction of fl ex-fuel vehicles that are dual-fuel, that is, running on gasoline and ethanol. Th e decision regarding fuel choice lies with the consumer, depending on a comparison of prices. As a result, the production of ethanol doubled between 2003 and 2010 from 12.6 to 25.7 billion litres. By 2005, 50 per cent of the cars sold in Brazil had fl ex-fuel engines and the fi gure rose to

110 the brics report
90 per cent in 2010. Brazil became the fi rst country in 2008 to use more biofuels than gasoline. Th is extraordinary success helped lower petrol dependency in the energy matrix from 45.5 per cent in 2000 to 37.3 per cent by 2008. Environmental considerations have been fully integrated into the ethanol production policy. Net CO2 emission is calculated at 260 kilos for each 1,000 litres of ethanol against 2,280 in the case of gasoline, implying an 89 per cent reduction in emissions. Such a calculation takes into account the production /consumption cycle: from planting/harvesting; the high absorption capacity of gases dur-ing cultivation; the co-generation of energy as well as emissions in the process of generating energy; and the emissions during transport and consumption. Th e high absorption capacity of gases by sugar-cane cultivation was recognized by the UN when it included ethanol in the Clean Development Mechanism (CDM) Scheme. Based on its success and the increasing eff orts by the world to expand the use of renewable energy sources, ethanol stopped being treated as a curi-osity from Brazil. Indeed, key international players like Shell, BP, Cargill, and Bunge, among others, have stepped in through acqui-sition and joint-ventures since 2007 and reinforced the process of concentration and capitalization of the sector. Petrobras itself has set up a special division for biofuel and in 2010 ranked fourth in pro-duction in Brazil. In 2009, one of the major Indian sugar refi neries, Shree Renuka Sugars, also entered the market through acquisition of a Brazilian ethanol company. Ethanol as a bio-fuel has enormous potential for future development, as it is more effi cient and drasti-cally diminishes land use. New technological pathways (hydrolyses of cellulosic materials) are being explored. Th e Brazilian experience suggests, therefore, that it is possible to harmonize food and bio-fuel production in a sustainable way.

best practices 111
Conditional Cash Transfers
Th e Conditional Cash Transfer (CCT) programme aims at directly transferring cash to the poor, provided that benefi ciaries fulfi ll certain conditions like enrolling children in school, getting regular medical check-ups, and receiving vaccinations. Th e programme is running in many South American countries along with Brazil and is regarded as an example of a best practice in the provision of a social safety net. Th e Bolsa Família programme in Brazil was created in October 2003 to improve the effi ciency and coherence of the social safety net. It is designed to meet two major goals: short-term poverty alleviation and the fi ght against intergenerational poverty traps. Th e former is addressed through cash-transfers, while the latter uses conditionali-ties to encourage families to persist in human capital investment. Th e programme requires 85 per cent school attendance for school-aged children, updated immunization cards for children up to six years of age, and regular visits to health centres for lactating and pregnant women. Conditional cash transfers proved to be an important factor in reducing inequalities. A study by the International Policy Centre for Inclusive Growth (IPC-IG) shows that, despite its small share in total income (about 0.5 per cent of GDP), the programme has helped reduce inequalities in Brazil by about 21 per cent between 1995 and 2004. Bolsa Família has also been eff ective in poverty reduction. Th e share of population living in extreme poverty (on less than US$ 1.25 per day) reached 5.5 per cent in 2007, from about 11 per cent in the mid-1990s and 15 per cent at the end of the 1980s. According to the World Bank (Press Release No. 2011/093/LAC), the programme is among the most eff ective social protection programmes in the world,

112 the brics report
having helped raise approximately 20 million people out of poverty between 2003 and 2009 as well as signifi cantly reducing income inequality.
Anti-AIDS Policy
Brazil was the fi rst nation to provide anti-AIDS therapies at no cost to all patients who needed them since 1991 and has played a pivotal role in public policy debates concerning HIV/AIDS. Its national HIV/AIDS programme was praised as the best of its kind in the developing world by the United Nations and has served as a model for 31 other developing countries as well as for the global HIV/AIDS policy adopted by the World Health Organization (WHO) since 2003. By 2010, about 200,000 patients in the country benefi ted from these therapies. By providing universal treatment, the country proved that it was possible for developing countries to off er effi cient AIDS treatment. Moreover, Brazil has demonstrated that a strategy that combines prevention and treatment is far more eff ective than concentrating on prevention alone. Th e success of the anti-AIDS programme can be seen from the fact that (i) the occurrence of opportunistic infections in Brazil fell by 80 per cent since triple therapies began to be administrated in 1996. As a result, around 358,000 AIDS-related hospitalizations were avoided in the country, saving the Ministry of Health over US$ 2.1 billion between 1996 and 2002, and (ii) anti-AIDS cocktails have prolonged and sensibly improved the life-quality of those infected with AIDS in Brazil. A study conducted throughout the country found a twelvefold increase in mean survival time of AIDS patients from the 1980s to the 2000s—a result similar to that observed in
best practices 113
high-income countries. Th e study also showed that anti-retroviral therapies have allowed these patients to continue to work and inter-act with their families and friends. Although in 1992 the World Bank projected that by the year 2000 Brazil would have 1.2 million HIV-positive people, it has in fact had only half as many, that is, about 600,000. From 1994 to 2000, it is estimated that Brazil’s treatment policy has avoided a large number of AIDS cases. Anti-retroviral treatment has thereby also signifi cantly reduced the economic costs generated by the loss of productivity of individuals deceased or handicapped by AIDS. AIDS treatment in Brazil has relied heavily on the local produc-tion of generic anti-retrovirals as a strategy to contain treatment costs. Th is strategy has not only reduced imports of unpatented anti-AIDS drugs but also forced brand-name pharmaceutical companies to concede large discounts in their prices of patented drugs in order to avoid having their patents’ monopoly rights overrun by compulsory licensing. Crucially, since the Ministry of Health began substituting expensive imports with local generic equivalents in 1996, the prices of unpatented anti-retroviral drugs fell by an average of 80.9 per cent in Brazil until 2001. By 2011, 11 of the 19 anti-AIDS drugs off ered in Brazil were locally supplied.
Regulatory Framework
During the global fi nancial crisis, the Brazilian banking system proved to be substantially resilient. Th is ensured that the crisis had a minimal eff ect on the Brazilian economy and there was a quick recovery. Four important aspects stand out and need highlighting as best practices: (i) supervision: Brazil adopted a consolidated approach, requiring that

114 the brics report
even non-fi nancial subsidiaries in a banking group undergo super-vision and be subject to controls; (ii) regulatory capital: an 11 per cent capital requirement is demanded, compared to the 8 per cent recommended by the Basel Committee on Banking Supervision stan-dards; (iii) stability: fi nancial innovations are permitted only after an analysis of their impact on fi nancial stability; and (iv) transparency: all operations must be kept on balance, with respective risk requirements and provisions. Operations concerning over-the-counter derivatives must be registered at a clearing house. Regulators have full access to information on all such operations. Accounting Reports show that Brazil’s credit provisioning criteria were eff ective during the last international fi nancial crisis. Since 1999, regulation requires risk classifi cation on all credit operations, considering not only the eff ec-tive but also the expected loss. Moreover, regulation requires provi-sioning at the time the operation takes place, based on borrower and operation risks. Additionally, there is progressive minimum provi-sioning after 15 days of delinquency. Further enhancements, such as the write-off of disposed portfolios, are under consideration.
Public Debt Management
Brazil has frequently been mentioned by emerging markets as a refer-ence in terms of public debt management due to its successful recent experiences. It has managed to considerably minimize its fi nancing costs and risks, when, for example, it moved from a participation of more than 70 per cent of its debt linked to the exchange rate in 1994 to a modest share of 5.1 per cent in December 2010. Th e favourable macroeconomic environment over the past 10 years, a consequence of sound monetary and fi scal policies combined with the reduction

best practices 115
of external vulnerability, mainly by accumulation of international reserves, allowed the government to adopt good debt management practices, culminating in its assignment as an investment-grade economy in 2008. One of the main strategies responsible for such a change was the consistent replacement of exchange rate instruments by fi xed-rate and infl ation-linked debt since 2003. Th e pace of the substitution was intensifi ed after the adoption of capital gains tax exemption for public debt bonds held by foreign investors in 2006. As these inves-tors are less risk-averse and are used to investing in instruments with long-term maturities, their increasing presence in the domestic mar-ket helped to lengthen the maturity profi le of debt. Another sound practice adopted by Brazil is long-term debt planning through the defi nition of an optimal debt structure, a medium-term debt strategy and an annual borrowing plan (which has been released regularly since 2001). Finally, the eff orts of the Debt Management Offi ce to increase its transparency levels should be mentioned, making Brazil the fi rst country to achieve maximum score in Investor Relations and Data Transparency Practices at the Institute of International Finance (IIF). Regarding external debt, since 2006 the country no longer depends on external issuances as a source of funds, due to the considerably decreased need for external borrowing and the strong infl ow of dollars. Th is allowed the government to adopt several measures to improve the profi le of external debt and reduce its size, through measures that include prepayment of the IMF (2005) and the Paris Club (2006) debt, the recall of the Brady bonds and the introduction, in 2006, of a permanent programme to repurchase external debt bonds along the entire maturity curve. Nevertheless, the issuances in the external market continue, mainly in dollar and in Real, the
116 the brics report
Brazilian currency, whose yield curves are very useful as benchmarks to national companies’ issuances off shore. Th e external issuances in local currency are especially important since the currency risk is transferred to investors and helps to set a reference in the external market for a yield curve in domestic currency. In October 2010, Brazil issued US$ 650 million in local currency (R$ 1.1 billion), paying a yield of just 8.85 per cent and maturing in 2028.
Embraer
Embraer is currently the third-largest producer of civil aircraft in the world, only surpassed by Boeing and Airbus. Embraer was founded in 1969 by the Brazilian government as a mixed capital company, being ‘… the realisation of an old project of some Air Force military offi cers to constitute an aeronautical industry in the country’. Th e Aerospace Technical Center (CTA) of the Brazilian Air Force (FAB) had developed the Bandeirante aircraft, intended for civil and mili-tary use, and the company was initially created to produce it in series. With the creation of the company, its engineers, mostly from the Institute of Aeronautical Technology (ITA), but also from FAB and the CTA, began to develop other models of aircraft. Th e company was privatized and re-structured in 1994 with a focus on regional commercial jet planes (up to 120 passengers). Embraer, therefore, operates in a market space less occupied by the two giants of the aerospace sector, Boeing and Airbus, which are engaged mainly in the development and production of aircraft with capacity of over 120 passengers. During its 40 years of existence, the company has already manu-factured over 5,000 airplanes. Th e ERJ family models have been sold

best practices 117
to over 37 companies in 24 diff erent countries. Its current structure employs more than 24,000 people worldwide. In the period 2000–9, its net earnings were, on average, US$ 8.6 billion annually. Th e com-pany’s shares are traded as blue chips in Bovespa and are rated as investment-grade by both Moody’s and S&P.
Russia
Russia has undertaken major reforms in several sectors of the econo-my in the post-Soviet era. Th e Russian economy as a result grew by 5.3 per cent per annum during 1999–2009, following a period of stagnation in the 1990s. Th e rate of infl ation decreased from 84.4 per cent in 1998 to 8.8 per cent in 2009 and real average monthly wages increased by 7.4 per cent during the period 1999 to 2009. Th e growth has been accompanied by a rise in real incomes and a halving of the population living below the poverty line.
Stabilization Fund of the Russian Federation
Th e setting up of the Stabilization Fund of the Russian Federation in 2004 has helped Russia in several ways, including building up of international reserves, maintaining low public debt levels, and allow-ing fi scal space for expansionary policies during the fi nancial crisis. Th e Stabilization Fund of the Russian Federation could be drawn down during the crisis without signifi cant risk to the economy. As a result, the budget could swing from a surplus of 0.25 per cent of GDP in 2008 to a defi cit of 0.25 per cent of GDP in 2009 without major risk to external stability. Russia, as a result, emerged from

118 the brics report
the crisis with a low public debt ratio (around 7 per cent of GDP), unlike the situation in advanced economies. Th e Stabilization Fund of the Russian Federation was bifurcated in January 2008 to form the Reserve Fund (designed to weather and counter the eff ects of the fi nancial crisis) and the National Welfare Fund (that aided pension reform).
Labour Market
Supported by continued output growth, labour market conditions improved noticeably in 2010. Th e eff ect of seasonal unemployment appears to have been limited in 2010, suggesting robustness in the underlying recovery of the labour market. Unemployment fell from 9.2 per cent in January 2010 to 7.2 per cent in December 2010 (International Labor Organization defi nition), with the lowest level of unemployment registered in September and November 2010 at 6.6 per cent. With the decline in seasonal employment at the onset of the Russian winter, however, unemployment started to pick up, reaching 7.6 per cent in January 2011. But this fi gure is still signifi cantly lower than the 9.1 per cent rate registered in January 2010. Th is situation is refl ected in the relatively stable number of vacancies. Russia’s national poverty rate was broadly fl at in 2009 and contin-ued to fall in 2010, essentially because of a massive counter-cyclical stimulus, increases in pensions and wages, and unemployment that was much lower than expected. Both the unemployment and poverty rates increased sharply in early 2009; however, as the large increases in public sector wages and pensions and unemployment benefi ts kicked in, and as unemployment began to fall as fi rms shifted to labour hoarding, the national poverty rate fell from 13.4 per cent in

best practices 119
2008 to 13.2 per cent by the end of 2009. In 2010, the poverty rate was at 12.7 per cent, approximately 0.5 percentage point lower than in 2009 with about 0.7 million people moving out of poverty. Th e poverty rate is expected to decline in 2012 (10.0 per cent).
Tax Reforms
Tax reforms have boosted revenue collections of the Russian govern-ment. Most important has been the 13 per cent fl at tax on personal incomes. As a result, personal income tax collections registered a rise of 36.1 per cent between 2006 and 2007 due to better compliance. Th e lower and fl at tax slab off ers a useful lesson for other countries from the point of view of widening the tax base and increasing compliance.
Budgetary Reforms
Russia has undertaken budget reforms in stages over the period 2001–10. Th ese reforms signify a move towards a more transpar-ent budgetary framework. Th e emphasis has been on administrative decentralization via earmarking expenditure and revenue respon-sibilities to lower tiers of the government. Th e underlying non-oil defi cit of the federal government was projected to remain at around 9 per cent of GDP in 2010, above its pre-crisis level. Withdrawal of the fi scal stimulus and fi scal consolidation, therefore, remain an important priority. Th e government has also set explicit targets for lowering the budget defi cit to zero by 2015. Th e annual goals, based on a projected oil price of US$ 70 per barrel, have been a budget

120 the brics report
defi cit of 4 per cent of GDP in 2011, 3 per cent in 2012, 2 per cent in 2013, 1 per cent in 2014, and 0 per cent of GDP in 2015.
Pension Reforms
A major achievement of the Russian government has been pension reforms. Pensions were raised in 2009–10 through comprehensive pension reforms, which were part of the stimulus package. Th e move was especially relevant because the share of the aged in the total population has been signifi cant. Increasing pensioners’ income was one of the major elements of the anti-crisis policy in 2009. During the course of the year, pensions were increased four times; as a result, an increase by 25 per cent in real terms was achieved in 2009. Th is policy helped prevent deterioration of the pensioners’ standard of living, mitigated the social consequences of the acute phase of the crisis, and resulted in an increase in demand for goods and services, which supported the Russian economy. Starting from 1 January 2010, the so-called valourization of pensions, implying revision of the monetary value of pension rights acquired before 1 January 2002, has taken place. As a result, the value of the pensions for the cor-responding group of retirees was substantially increased. Moreover, in 2010, the new concept of ‘minimal level of citizens’ pension provi-sion’ was introduced, whereby starting from 1 January 2010, the sum of the pension and other social support measures for retirees would not be lower than the subsistence level for retirees. According to government estimates, the average level of old-age pensions in 2010 grew by 36 per cent, while their ratio to the average salary reached 40 per cent.
best practices 121
Monetary Policy Conditions
Over the period of reform, Russia has undergone a number of drastic changes related to the development of market mechanism in the economy and the fi nancial system. Th ese changes have increased the share of private sector in the economy, developed the banking system, created foreign exchange and securities markets, and considerably increased the role of monetary policy in the process of macroeco-nomic stabilization. From mid-2006, Russia terminated the provisions of the legis-lation ‘On Foreign Exchange Regulation and Foreign Exchange Control’, which had given the Russian government and the Bank of Russia the powers to set limits on foreign exchange operations by residents and non-residents related to capital fl ows. Th erefore, Russia completed the fi nal stage of liberalizing foreign currency legislation. With its current managed fl oating exchange rate regime, Russia is striving to make the mechanism of setting the exchange rate more fl exible. Russia has been able to overcome dollarization/foreign cur-rency dominance in the economy and make the national currency—the rouble—a reliable payment and settlement instrument to be used in international transactions. Strengthening of integration processes in CIS is a key factor in enhancing the role of corresponding countries, including Russia, in the global economy. In the EurAsEC framework, the treaty concern-ing the encouragement and protection of mutual investments has been concluded. It is expected to accelerate modernization of the member states’ economies and enhance the effi ciency of utilizing their productive potential. In the context of cooperation between Russia, Belarus, and Kazakhstan, the Common Economic Space is currently

122 the brics report
being formed. Its fi rst stage, that is, the Customs Union, is largely completed, with positive consequences including widening of mar-kets, strengthening old production links, and forming new ones.
India
Private Entrepreneurship
A major attribute of India’s business environment is the presence of home-grown private entrepreneurship, which has been playing a key role in taking the country forward on a higher growth trajectory. It is sometimes said that India is being driven by 45 million entrepre-neurs. Th ere are also a large number of private business conglomerates with diversifi ed business interests and international footprints. Th e acquisition of companies abroad in order to diversify into foreign markets has been one of the attributes of Indian business groups. Such outward foreign direct investment was of the order of US$ 18.8 billion in 2007–8, US $ 17.5 billion in 2008–9, and US$ 12 billion in 2009–10. Th is excludes the money raised abroad for acquisitions. Th e information technology (IT) sector that accounted for net receipts of US$ 48.2 billion in 2009–10 is almost entirely dominated by the private sector. Some of the names with a large global presence in this sector are Tata Consultancy Services, Wipro Technologies, Infosys, and HCL. Th e role of the private sector is set to increase with further liberalization of the Indian economy.
Innovations
Grassroots innovation and improvization have been other hallmarks of Indian entrepreneurship. Th e main attribute has been lowering

best practices 123
of costs to take advantage of economies of scale in a large domestic market. Such innovations are often an integral part of a supply chain, providing low-cost components to a larger production unit. Realizing the market potential, many Indian fi rms have joined the race for low-cost innovations. Tata Chemicals, for example, makes a water fi lter that requires no power and can give safe drinking water to a family of fi ve for a month for Rs 30 ($0.65). Researchers at the Indian Institute of Technology and the Indian Institute of Science produced a prototype for a $35 laptop in July 2010. A fi rm called Ayas Shilpa makes suspension bridges for a tenth of the price of con-ventional ones; in a country where countless villages are connected to the outside world only by perilous rope bridges, this is a major way forward. Indian fi rms are also devising new business models. HCL Technologies, for example, helps clients to improve their IT systems on the understanding that if they reap no benefi ts, they pay nothing.
Telecommunications
India’s telecom sector has been one of the success stories of the market-oriented reforms. Deregulation and liberalization of tele-communication laws and policies have prompted rapid growth of the sector. Th e total number of telephones increased from 494.07 million in August 2009 to 706.39 million in August 2010, showing an increase of 13.7 per cent and making India’s telecommunications network the second largest in the world. A characteristic feature has been the extremely rapid growth of cellular services combined with modest declines in fi xed lines. Wireless connections increased during the period from 456.74 million to 670.62 (14.8 per cent increase),

124 the brics report
while wire lines declined marginally from 37.3 million to 35.8 million (3.2 per cent decline). Th e rise in rural connectivity has been more impressive, with an increase from 150.83 million in August 2009 to 230.24 million in August 2010 (an increase of 14.7 per cent), with many attendant benefi ts for the farming community. As a result of the sharp rise in the number of connections, wireless density increased from 42.3 per cent in August 2009 (98.7 per cent urban and 18.4 per cent rural) to 59.6 per cent (134.1 per cent urban and 27.8 per cent rural) in August 2010.
Inclusive Growth: MGNREGA
A large-scale employment guarantee scheme under the Mahatma Gandhi National Rural Employment Guarantee Act (MGNREGA) was introduced in India in a phased manner from February 2006. Th e Scheme covers all the districts in the country and provides the option of guaranteed 100 days paid employment in a fi nancial year at the minimum prescribed wage to all adult members of a rural house-hold. MGNREGA has focussed on creating tangible assets, which include water conservation and water harvesting, drought proofi ng, micro and minor irrigation projects, fl ood control, and rural road connectivity. Assured employment and enhanced wage earning have led to improved living standards in rural areas. As a result of the Scheme, a number of states have reported a rise in minimum wages. Th ere has also been a fall in labour migration during lean periods. A total of 42.7 million household were provided employment during March 2009 and December 2009, and 2,007 million person days of employment was generated.

best practices 125
Right to Information
In order to promote transparency and accountability in administra-tion, the Right to Information Act was enacted in October 2005. Th e law empowers Indian citizens to seek information from a public authority, thus making the government and its functionaries more accountable and responsible through mandating a timely response to citizen’s requests for government information. Th e Act has now been in operation for over four years and has led to the empowerment of the common man including the poor and the underprivileged. In the political sphere, the law contributes to the ability of citi-zens to become aware of the activities of the government. It raises the level of political debate and leads to a more productive process of policy-making. In the economic sphere, transparency increases effi ciency by making the investment climate more conducive. In public administration, transparency improves the decision-making of public servants by making them more responsive and accountable to the public and reduces corruption by making it more diffi cult to hide illegal agreements and actions. It also improves legitimacy and trust in the government, allowing for more eff ective implementation of public policies.
Capital Account Liberalization
India has followed a calibrated approach to capital account liberaliza-tion. While there is full convertibility on the current account, the capital account is being opened in phases, in line with development requirements and fi nancial sector developments. An important

126 the brics report
achievement of the calibrated approach was that India could largely avoid the fallout of the Asian crisis of the late 1990s. Similarly, the country was less aff ected by the global crisis of 2008–9, with the growth rate moderating to 6.7 per cent. A major advantage of the approach is that the fl ow of ‘hot money’ opportunely seeking interest arbitrage has been limited as foreign fi nancial institu-tions are not allowed unrestricted access to fi xed interest rupee debt market.
External Debt Management
Successfully lowering the external debt burden has been an important achievement of the Indian government. Th e country faced a balance of payments crisis in 1991–2, when foreign exchange reserves fell to two weeks’ worth of imports, the debt–GDP ratio had risen to 39 per cent and the debt–service ratio had risen to 30 per cent. Concerted eff orts were then made to lower the external debt burden of the economy. First, liberalization of the economy was introduced in stages, which helped build the growth momentum; this, in turn, helped lower the debt–GDP ratio with a higher GDP denominator. Second, an External Debt Monitoring Unit was set up in the Ministry of Finance to monitor long- and short-term debt and bring out an annual status report on external debt to increase transparency and provide Management Information Service (MIS) inputs for debt management decisions. Th e External Commercial Borrowing (ECB) Policy that places all-in-cost and end-use restrictions on commercial borrowings from abroad, plays a key role in external debt management. It has helped

best practices 127
prevent the build-up of external debt to unsustainable levels and ensured that foreign debt fl ows were directed to priority sectors. Th e ECB Policy has also played an eff ective countercyclical role. Th is meant liberalization of the policy during downturns to attract higher capital fl ows and tightening during booms to discourage excessive fl ows. Th e Policy, therefore, has been an eff ective instru-ment for managing balance of payments in the changing global situation. Restrictions on ECB also minimized the risk of a balance sheet recession for Indian corporates during the recent global crisis, which could have arisen due to excessive borrowing in the pre-crisis period together with currency risks due to a fall in the value of the rupee.
Accounting and Audit Standards
Th e Indian fi nancial system has been evolving and has withstood testing times during the recent global fi nancial crisis. Indian account-ing standards are stringent. In some aspects, India has gone ahead of other countries in implementing additional regulatory safeguards with respect to, inter alia, countercyclical provisions and risk weights and safeguards for securitization. While depreciations in assets are taken into account, appreciations in such assets are ignored in accounting practices. Similarly, under securitization, the profi ts are not front-loaded, but distributed over the entire life of the asset. Th e inherent strengths that existed even prior to the crisis, as well as the reforms now being contemplated based on the recommendations of international standards-setting bodies, lend it resilience and have ensured that its stability has not been threatened.
128 the brics report
China
Attracting FDI
Several factors contribute to the successful and rapid development of a country, of which attracting and utilising FDI is one. Attracting foreign investment is an important part of China’s national policy of opening up and remarkable achievements have been made in this fi eld. By October 2010, a total of 704,000 foreign invested enterprises have been set up in China; a total of US$ 1.03 trillion of foreign investment has actually been used; 190 countries or regions have made investments in China; and 480 of the world’s top 500 enterprises have invested or done business in China. According to the 2010 World Investment Report by UNCTAD, China ranked sec-ond in the world in attracting FDI and it has ranked fi rst among developing countries for 18 years at a stretch. Foreign invested enterprises have been an important component of China’s national economy, evidenced by the fact that 21 per cent of tax revenue, 27 per cent of industrial output, 54 per cent of import and export, and about 45 million of employment are from such enterprises in 2010. Foreign investment has not only brought to resources to China but also advanced concepts and technological and managerial experi-ence as well as international professionals, all of which have had a profound impact on diff erent aspects of the Chinese economy and its society. Foreign investment has greatly boosted China’s economic reforms and speeded up China’s participation in economic globaliza-tion. Foreign investors have earned substantial returns from invest-ment in China and many foreign subsidiaries have become growth and profi t centres for their parent companies.

best practices 129
Th e objective of the Chinese government, while furthering open-ing up, is to continue to attract foreign investment in an active and eff ective manner. China intends to step up eff orts at reform and innovation, by expanding the horizons of investment, improving investment facilitation, as well as enhancing and improving the ser-vices provided to foreign investors in order to create a more open and optimal investment environment and improve the quality and level of foreign investment utilization on a continuous basis. After opening up the economy in 1978, China received substan-tial labour-intensive FDI. In the 1990s, through further opening up, China took eff ective measures to push its integration with neighbour-ing economies. Th is was long before worldwide trade and investment liberalization set in following the Uruguay Round of negotiations and helped the country to successfully avoid the Asian fi nancial crisis. China’s economic performance has been outstanding in the early 21st century with the country turning out to be the ‘hot spot’ of global FDI. With its huge foreign exchange reserves, robust fi nancial system and strong fi scal position, China also remained in a relatively stronger position vis-à-vis other countries on the face of the global fi nancial crisis. In attracting foreign investment, China pursues a self-dependent industrial and economic development model instead of relying entirely on multinationals. Foreign investors play an important role in China’s economy by boosting its economic growth. China has been adjusting the FDI policy framework in line with its level of economic development to give full play to the positive role of FDI. By tapping China’s comparative advantage in manufac-turing, the labour-intensive and export-oriented nature of FDI has also been successful in promoting China’s integration into the global economy. More importantly, FDI has brought market economy

130 the brics report
concepts and rules, the business philosophy of foreign enterprises, and managerial skills into the country. Such spill-over eff ects have led to market reforms and economic transformation in China, and enabled the local enterprises and industries to achieve a relatively advanced level of effi ciency within a short period.
Infrastructure Financing
Th e Chinese government has taken a number of steps to promote infrastructure development. Th e government’s role in infrastructure development has been defi ned and is confi ned to areas where the market cannot play a role. China, therefore, has been adjusting its investment structure by reducing investment in competitive sectors and increasing inputs into other sectors. Priority has been given to important sectors such as agriculture, forestry and water conserva-tion, projects relating to public well-being including aff ordable hous-ing for low-income groups, and areas of environmental protection like wastewater treatment. Th e roles and responsibilities of the central and local governments have been clearly defi ned. Th e central government, in addition to projects at the central level, is responsible for cross-regional and cross-river valley projects, as well as those having a greater impact on overall economic and social development. Other projects fall within the responsibility of local governments, with support from the central government, in terms of planning, guidance, and subsidy. Th e fi nancing mechanism for public infrastructure has been diver-sifi ed and improved over time. Direct investment by the government is in projects involving pure public goods, such as the treatment of major rivers. Subsidies or ‘substituting awards for subsidy’ are used

best practices 131
to encourage social funding of profi t-oriented projects such as waste-water treatment in urban areas. Th e Build-Operate-Transfer (BOT) mode is used for projects with yields potential such as expressways that can be built and operated by social funds. New infrastructure fi nancing methods that include interest subsidy are emerging. Such new sources of fi nancing include local bank loans from policy banks and/or commercial banks; investment by public, quasi-public, or local private enterprises; foreign direct investments and loans; grants or concessional loans from multilateral and bilateral agencies; hold-ing funds in trust; and bonds issued by the central government. Th e funds for infrastructure development have been well man-aged. First, performance budget management is implemented to urge the departments in charge of the projects to improve budget expenditure. Second, the treasury management system has been reformed to ensure that funds are used in a safe, timely, and eff ective manner. Th ird, supervision and regulation have been enhanced and mechanisms for budget compilation, implementation, and supervi-sion have been put in place. Investment and fi nancing reforms are promoted through system innovation. Th e investments in infrastructure, which used to be governmental activities, are now open to market participants; public–private partnerships (PPP) are promoted to encourage social capital into infrastructure investment and to open up incremental asset markets. Th e attractiveness of infrastructure investment has been enhanced by creating market-oriented projects.
Macro-management of the Financial Sector
Since the reforms and opening up in 1978 and against the backdrop of the gradual introduction of a socialist market economy, China’s

132 THE BRICS REPORT
financial macro-management has facilitated stable and healthy devel-opment of the national economy. The major approaches and experi-ences in this regard are elaborated in the following paragraphs. In China’s perception, financial macro-management should grad-ually give way to indirect management. Macro-management should follow the principles of the market economy and take initiatives to adapt to its requirements and should mainly rely on economic means, with legal and administrative instruments as supplementary tools. The market formation mechanism should be continuously optimized to gradually make use of price-based levers, like the inter-est rate, to guide the behaviour of the private sector. It is important to develop and optimize the financial market and let it exercise vari-ous functions including that of price discovery, resource allocation, and risk evaluation. Financial macro-management must be in accordance with domes-tic conditions. When the per capita national income is relatively low and the economy is yet to catch up, it is important to concentrate on development, reform, and employment, with monetary policy supporting these objectives. At the same time, when economic devel-opment and employment growth are taking place, maintaining eco-nomic stability becomes an indispensable target. Macro-management should, therefore, underscore its price stabilizing function through gradual optimization of monetary policy targets and by attaching increased importance to the application of price-based tools so as to adapt to the requirements of the development of the socialist market economy. Financial macro-management should be self-initiated, proactive and effective. With a gradual increase in economic aggregates and further advancement in the level of opening up, a lack of flexibility in the exchange rate mechanism could, to some extent, limit the
9780198085386 Brics Report_03_Ch-03.indd 1329780198085386 Brics Report_03_Ch-03.indd 132 26/03/12 10:26 AM26/03/12 10:26 AM

best practices 133
manoeuvrability of domestic interest rates and increase the diffi culties in money and credit management; it is also disadvantageous to main-tain a self-initiated and eff ective quantity management. Th erefore, it is necessary to increase the fl exibility of the exchange rate; promote exchange rate reform in a self-initiated, controllable, and gradual way; and strengthen the ability to manage the economy by means of money, credit, and interest rate management. Further, since there is always a time lag involved in monetary policy to have its desired eff ects, the monetary authority should be far-sighted, scientifi c, and dynamic in formulating and implementing policies. Th e coordination between monetary policy and other macro-policies such as fi scal and industrial policy should be strengthened. Th e complexity of macroeconomic operation determines that it is unrealistic to rely exclusively on monetary policy to solve all problems. Th e smooth implementation of monetary policy goes hand-in-hand with the coordination of other macro-policies including fi scal policy. Monetary policy concentrates more on short-term quantity management, while fi scal policy is more concerned with middle-to-long-term structural adjustment. Consequently, macro-management must make use of both monetary and fi scal policies in their own ways according to the conditions of the economy, and implement appropriate and well-targeted policy portfolios in order to obtain the best of results. Managing the relationship between fi nancial stability and mon-etary policy should be emphasized. A stable system provides an envi-ronment in which fi nancial macro-management plays its part. Along with continuous deepening and refi ning of the fi nancial market, the process of market integration and the development of industry and institution-wide fi nancial products require measures to avoid sys-temic risk. Th e central bank must play a greater role in maintaining

134 the brics report
the overall fi nancial system stability instead of concentrating only on the risks of individual fi nancial institutions or individual indus-tries. Th is requires the central bank to address fi nancial risks from a systemic perspective, build a macro-prudential policy framework, curb pro-cyclical fl uctuations in the fi nancial system, and promote policies that ensure sustainable support of the fi nancial system to the development of the economy. Th e central bank should also fulfi ll its responsibility as ‘lender of last resort’ according to law, maintain market confi dence and a complete and eff ective payment system, while ensuring the stable operation of the fi nancial system so as to guarantee a smooth operational environment for monetary policy.
Reform and Development of the Banking Industry
Since the reform and opening up of the economy, China’s banking industry has undergone major changes. First, a modern banking system has been established in the country. A service system has been preliminarily founded where big commercial banks are the main participants; policy fi nancing and commercial fi nancing are appropriately separated; diff erent types of fi nancial institutions with complementary functions cooperate and develop in a harmonized way; and multiple ways of fi nancing co-exist. Various fi nancial institutions have grown steadily, with the market share of small and medium-sized banking institutions rising steadily from 19.6 per cent in 1993 to 49.1 per cent in 2009. Meanwhile, a modern corporate governance structure has been established in banking institutions, the capacity and level of services have improved, a variety of fi nancial products have been introduced, and fi nancial services have moved

best practices 135
from deposits and loans at the beginning of reforms to diverse and tailored activities. Second, China continues to adhere to the policy of opening up the economy and learning from the experiences of foreign countries. China sticks to an opening strategy of self-orientation, opening up in a prudent and orderly manner without compromising independence, and learning from advanced foreign experiences so as to elevate the core competitiveness of the banking industry. Th e process of opening up extended from attracting funds and technology, in the beginning, to bringing in funds, intellectuals and systems, and achieving shareholding reform by introducing strategic investors at home and abroad to deepen the transformation of banking industry systems and mechanisms. Th ird, international infl uence and status of the Chinese banking industry has steadily grown. According to the July 2010 Bankers’ magazine, China has 84 banks among the top 1,000 banks in the world. At present, ICBC and CCB rank as the top two banks in the world in terms of market value with ICBC being the most profi table bank for two consecutive years. Fourth, China has spared no eff orts in introducing innovation in the banking industry. Ever since the reform and opening up 30 years ago, the country has been building a favourable environment for innovation and promoting innovation practices in every fi eld of banking. Based on national conditions, the banking industry carried out innovations in institutions, products and systems, opened new types of fi nancial institutions such as rural banks, micro-credit com-panies, automobile fi nance companies, money brokering companies, and developed business varieties including asset securitization, as well as domestic and overseas wealth management to meet the growing demand for fi nancial services.

136 the brics report
China has reinforced and improved macro surveillance and micro supervision to promote steady development of the banking indus-try. China strengthened and improved macro regulation to create a sound macroeconomic environment for the banking industry; reinforced micro supervision to consolidate the ‘fi rewall’ between credit and capital markets; and intensifi ed stockholder supervision, control over related parties, and management for tackling confl icts of interest. Under the segregated operations and augmented super-vision framework, China steadfastly promoted the pilot operation of comprehensive business, appropriately balancing regulation and fi nancial innovation and prudently promoting fi nancial innovation in the banking industry. Laws and regulations were established and perfected with fi nancial infrastructure constantly being improved. In this way, the framework of macro and micro prudential supervi-sion in China’s fi nancial industry gradually evolved and consistently improved. In the process of reform and development, China’s banking industry has accumulated rich experiences in the following areas. First, China persisted with the socialist market economy model and improved the quality of reforms. Th e reforms have extended from simple capital injection from the central government to spin-off bad loans, combining capital injection with transformation of bank ownership structure, corporate governance, and risk management systems. Reforms aim at enabling commercial banks in China to work under the principles of effi ciency, safety and liquidity with full autonomy, making them responsible for their operations, risks, prof-its, and losses. As a result of the reforms, China’s banking industry has been successfully transformed from being specialized banks to modern public banks.

best practices 137
Financial Market Developments
Since the beginning of reform and opening up, China’s fi nancial market has been transformed from a small and regional market to a large national market. During this process, with the scale of the mar-ket expanding, institutions achieving optimality and intermediary institutions and investors becoming mature, China’s fi nancial market evolved into a market that is in accordance with general international principles in terms of the legal system, trading rules, and the regula-tory system. Th e transformation has made signifi cant contributions to the process of economic reform as well as social and economic development. China’s experience of capital market development has diff ered from that in some advanced countries where markets evolved mostly on their own. China’s capital market has been promoted both by the government and the market—a route of market economy reform that combines the government’s supporting hand and the market’s self-evolution. In the beginning, due to the limits imposed by the environment and the design of market institutions, China’s capital market accumulated some deep-rooted structural problems. Th e approach has been to solve these problems and contradictions by deepening the reform process. In recent years, the securities regu-latory authority has started a series of important reforms aimed at strengthening market infrastructure, improving market quality and structure, and enhancing market effi ciency, which include, inter alia, non-tradeable share reform, comprehensive improvement in the quality of listed companies, reform of security company governance, deepening the share issuance system, reforms to promote the market-based fund industry and the development of institutional investors,

138 the brics report
and attempts to optimize the legal system in the capital market and quicken the pace of developing a multi-layered capital market. Th ese reforms have achieved positive results and China’s capital markets have undergone a complete transformation, with constant improve-ment in its socialist market economy structure, standardization, and internationalization. China’s capital market developments also exhibit some basic prin-ciples. First, it is necessary to treat development of the capital market as an essential national strategy, constantly deepening society’s under-standing of the importance of sound capital markets, and striving for coordination and consensus on various policies. Second, the devel-opment of the capital market should serve the national economy. In this context, it is important to ensure coordinated development of the capital market with the national economy and society. Th ird, the development of a socialist market economy has to be the focus of reform, and eff orts have to be made to encourage participants to move towards this objective. Fourth, endeavour must be made to strengthen the legal system in order to strengthen the capital market and, fi fth, opening up and enhancing the international competitive-ness of capital markets must be steadily promoted. China’s bond market, which started in the 1980s, focused on private investors and small-to-middle institutional investors and was based on strict regulation and government guidance. Th e market is geared to meet the fi nancing of the development needs of the real economy. It developed from OTC trading (1988–91), exchange-traded market(1992–2000) to inter-bank bond market (2001–until now). During that time, the lack of effi cient market disciplines caused relatively large risks in the market. In recent years, the process of reform and innovation in the Chinese bond market has quickened and the market has already become an important platform for invest-

best practices 139
ment, fi nancing and liquidity management for fi nancial institutions and fi rms. Th e main development experiences are the following: First, China has positioned institutional investors as the principal players in the inter-bank bond market and has gradually pushed for a multi-layered investor structure that takes market-makers as the core, the fi nancial institutions as the main part, and combines the participation of other investors as well. Second, China steadily pro-motes fi nancial product innovation. To provide tools for commercial banks to manage balance sheet and increase capital, products viz. commercial bank fi nancial bonds, junior bonds, and hybrid capital bonds have been successively launched; to broaden the enterprises’ fi nancing channel, the People’s Bank of China has introduced short-term fi nancing bonds and medium-term notes, derivatives viz. loan-backed securities, bond forwards, bond borrowing and lending, forward rate agreements, and RMB interest rate swaps. Th ird, China continuously develops the bond market infrastructure and optimizes the institutions of market-makers, bond settlement agency, currency brokerage, information disclosure, credit rating, and so on. Fourth, it prudently promotes the opening up of the bond market. Fifth, it is in the process of developing the exchange security market and establishing the interconnection with the inter-bank bond market. China’s money market has become an important channel for monetary policy transmission and infl uences aspects such as capi-tal adjustment and the market interest rate. Th e money market is composed mainly of sub-markets, such as the inter-bank borrowing market and repo market. Th e inter-bank borrowing market started in 1984. After undergo-ing development for 20 years, it has evolved into a unifi ed inter-bank market with a unifi ed inter-bank interest rate that is determined by market demand and supply. Its development experiences include the

140 the brics report
following: Th e fi rst has been the establishment of a nationally con-nected inter-bank borrowing network and the gradual formation of a national unifi ed inter-bank borrowing market. Th e second was to continuously enlarge the scope of market participants and increase trading at the national inter-bank borrowing market. Th e third was to gradually abolish limits on inter-bank interest rate and establish an interest rate formation mechanism that is determined by demand and supply in the market. Th e fourth was to standardize manage-ment of the inter-bank borrowing market and avoid market risks by means of mechanisms including inter-bank borrowing market access management, duration management, quota management, record management, and transparency management. It was important to simultaneously guide market participants about the risks inherent in commercialization and the credibility of counterparties. Th e fi fth was to continuously optimize the functions and services of the trading and information system. Th e repo market was started in 1991 and has been developed into a market the structure of which focuses on inter-bank bond market repurchase with the functions of fi nancing and price discovery gain-ing prominence. Th e repo market has off ered a satisfactory market environment for resource allocation and macro-management reform. Th e development experiences include the following: First, it has con-tinuously optimized the legal system that combines regulation, self-discipline, and market supervision, which has eff ectively restrained the tendency of market participants to break rules and/or default. Th e second has been to raise the level of safety of clients’ assets, reducing institutional risks, and guaranteeing stable operation of the repo market under low trading cost and low risk conditions through the proper design of a trading mechanism. Th e third has been to ceaselessly promote product innovation, enrich product lines, enlarge

best practices 141
the scope, and deepen the market, while raising market liquidity and operational effi ciency.
Development-oriented Poverty Reduction Programme
Th e Chinese government has always made poverty alleviation as an important goal and task of national development, and worked hard to enable everyone to enjoy the fruits of economic and social develop-ment. Since the mid-1980s, the Chinese government has organized a large-scale, well-planned rural development-oriented poverty reduc-tion programme, which has been incorporated into the Overall Plan of National Economic and Social Development. Th e government has formulated and implemented the National Seven-year Poverty Reduction Programme (1994–2000) and the Outline for Poverty Reduction and Development in China’s Rural Areas (2001–10), and earmarked special fi scal poverty reduction fund for the poor population and poor areas. Th rough the execution of the key anti-poverty measures such as ‘Village-based Poverty Reduction Project’, ‘Agricultural Industrialization’, ‘Labour Transferring Training’, and ‘Voluntary Resettlement’, China has achieved large-scale poverty reduction, with the population of the poor declining from 250 million in 1978 to 26.88 million in 2010 and poverty incidence going down from 30.7 per cent to 2.8 per cent during the same period. Massive poverty has been basically eliminated in rural areas and production and employment structures in poverty-striken areas have been opti-mized remarkably with signifi cant improvement in income, living standards, and development capacity of farmers. Th ese achievements have contributed enormously not only to the economic development of the nation as a whole, political stability, and social harmony but also to the undertaking of global poverty reduction.
142 the brics report
Signifi cant achievements of China in poverty reduction are the result of the comprehensive strategic framework. Apart from spe-cial poverty interventions, other supplementary policies include institutional reforms, economic growth, industrial restructuring, public service delivery, and social security. Th erefore, rural poverty reduction has been achieved by optimizing asset distribution, market improvement, increasing productivity, adjusting the economic struc-ture, promoting coordinated development among diff erent regions, between rural and urban areas and among industrial sectors, and advancing balanced economic and social progress, all of which have fundamentally altered the rural landscape. In 2011, given the new challenge to rural poverty reduction, the Chinese government has unveiled the Outline for Poverty Reduction and Development in China’s Rural Areas (2011–20). Th e Outline has set new goals for consolidating achievements already made, in solving the problems of food and clothing, accelerating the progress of poverty reduction, ameliorating the eco-system, enhancing devel-opment capacity, and narrowing development disparities. It aims to promote poverty reduction centreing on 14 extremely poor areas and consequently lays a solid foundation for the achievement of the national goal of building an all-around better-off society by 2020.
South Africa
Sound Macroeconomic Management
Successful fi scal adjustment was one of the major achievements of the post-Apartheid government. In the mid-1990s, a debt crisis was averted when the government took steps to reduce dissaving and

best practices 143
broaden the tax base through more effi cient tax collection. Strong revenue growth through this period allowed the government to con-solidate debt and tax relief for households and companies. Th e fi scal defi cit declined from almost 8 per cent of GDP in the early 1990s to a small budget surplus before the onset of the global crisis. Th e ratio of government debt to GDP declined sharply to a low of 27.1 per cent in 2008–9, from 49.5 per cent in 1995–6. Lower debt service costs created space for strong real growth in non-interest expenditure in the 2000s, which allowed the government to expand access to social services and step up infrastructure investment. Th e countercyclical fi scal stance adopted during the economic boom in 2006 created space for the government to sustain spending during the recession by increasing borrowing. South Africa‘s strong fi scal position meant the country could fi nance the R60 billion shortfall in tax revenue through additional borrowing in order to sustain existent spending on social grants, infrastructure investment, education, and health. In addition, the government extended the child support grant up to a child’s 18th birthday (previously only accessible until the age of 15). Th e government extended the expanded public works programme to support employment and increased the benefi t period for unemployment insurance from 6 to 9 months. South Africa will continue to manage public fi nances in a coun-tercyclical manner to support long-run fi scal sustainability. Th e nar-rowing of the consolidated government balance will continue over the medium-term expenditure framework. Th is will be done through a moderation in the growth of expenditure and a recovery in revenue in line with the economic cycle. Th e public sector will continue to support large-scale infrastructure projects to address transportation, water, and energy sector bottlenecks. Social income grants provide a safety net for the poor, while initiatives to support job creation will
144 the brics report
be intensifi ed. Th e ratio of debt to GDP is expected to stabilize in 2015–16 before declining. Th e 2011 Budget Review outlined a proposal for the adoption of fi scal guidelines to underpin the fi scal stance. Th ese would be based on three principles: (i) countercyclicality, (ii) long-term debt sustainability, and (iii) intergenerational equity. Monetary policy has operated under an infl ation-targeting regime since 2000. During this period, average headline infl ation has fallen from 9.9 per cent in the 1990s to 6.3 per cent in the period from 2005–10. Th e average level of headline CPI infl ation declined to 3.5 per cent in the second half of 2010, from 5.1 per cent in the fi rst half of 2010, notwithstanding substantial upward shocks to oil and commodity prices in 2007–8. Since the adoption of the infl ation-targeting framework, the aver-age level of infl ation and real interest rates has declined, growth in real GDP and fi xed investment has been higher and less volatile, while monetary policy has generally been countercyclical. Communication between SARB and the public has become more transparent, and the SARB has an active engagement with key sectors of society, includ-ing business and unions which has encouraged greater policy debate. Th e independence of SARB and its focus on the infl ation target has improved policy credibility and helped to reduce the infl ation risk premium in South Africa and appears to have helped contain infl a-tion expectations.
Public Debt Management and the Development of the Local Bond Market
Th e management of South Africa’s government debt has evolved over almost two decades, with a notable and continuous improve-

best practices 145
ment of the government debt management framework since 1994. South Africa has one of the most liquid local currency bond markets in the world with about 90 per cent of government debt denomi-nated in rand. As a risk benchmark, foreign currency denominated debt is limited to a maximum of 20 per cent of total debt. Th is has helped reduce the vulnerability of fi scal policy to fl uctuations in the exchange rate. External bond issuance by government has been pri-marily aimed at setting benchmarks for state-owned enterprises and private corporates, and at maintaining a presence in the key currency markets to diversify the country’s investor base. Prudent fi scal policy and active debt management helped to reduce debt service costs from a high of 5.7 per cent of GDP in 1998–9 to a low of 2.3 per cent in 2009–10. Active debt management entailed the consolidation of debt that was very costly for the government, limited issuance in off shore markets, and the introduction of more diverse local currency funding instruments—such as infl ation-linked bonds, fl oating rate notes, strips, and retail savings bonds—in order to deepen the investor base and enable the government to fund in all market conditions. Initiatives to consolidate debt have included switches and buy-backs in the domestic market where high coupon, illiquid bonds with smaller outstanding amounts were either bought back or switched into large, liquid benchmarks bonds with low coupons. Th is has helped to consolidate and smooth the bond portfolio to ensure that instruments are effi ciently priced, thus reducing funding costs for the government over a sustained period. Th e tradability of bonds in the secondary market has increased considerably, with annual turnover reaching a high of R28 trillion in 2008. Sound macroeconomic policies have contributed to the deepen-ing of South Africa’s capital markets. Th e responsibility for debt
146 the brics report
management was shifted from the South African Reserve Bank to the National Treasury early on to remove the inherent confl ict between monetary policy and debt management. Other initiatives that have contributed to domestic capital market development were the intro-duction of the primary dealer system in the late 1990s, setting of clear debt management objectives, and the publication of the govern-ment’s medium-term funding strategy in the National Budget. Active debt management has also helped to reduce South Africa’s external vulnerability by helping to sterilize the accumulation of offi cial foreign exchange reserves and lengthening the maturity profi le of the government’s debt portfolio by restructuring short-term foreign debt. Since 2006, South Africa has partnered with the OECD and regional debt managers to encourage the development of bond mar-kets on the African continent and mutually agreed best-practices. Th e Centre on African Debt Management and Bond Markets based in South Africa was established in July 2011. Th e Centre will, amongst others, focus on: (i) promoting policy dialogue among African debt managers; (ii) drafting and publishing an African Bond Market monitor and compiling debt data and statistics; (iii) sharing exem-plary practises in public debt management and the development of bond markets; (iv) engaging in capacity-building programmes to enhance skill levels; and (v) promoting the cooperation and coor-dination of the Centre with multilaterals, regional institutions, and other fi nancial institutions of complementary projects and activities.
Sound Institutions and Social Dialogue
According to the WEF’s 2010 Global Competitiveness Report, South Africa (54th overall) remains the highest-ranked country in
best practices 147
sub-Saharan Africa, and second in Africa behind Tunisia, due to its strong performance in the quality of its institutions. Th e protection provided to intellectual property ranks South Africa 27th in the world and 29th in terms of property rights. Th ere is strong accountability of private institutions, with South Africa ranking 3rd globally. Th is is underpinned by the success of insti-tutions and regulatory bodies such as the Competition Commission, Competition Tribunal, Financial Services Board, Registrars of Pension Funds and Medical Schemes, Securities Regulation Panel, and the new Companies and Intellectual Property Commission (CIPC). Since the 1990s, the multidisciplinary King Commission has produced a succession of increasingly stringent corporate governance standards—King 1, 2, and 3—that set out best practices in corpo-rate governance. Th eir recommendations have informed legislation including the New Companies Act and market regulation, with the Johannesburg Stock Exchange adopting many of the King standards as part of its listing requirements. Likewise, the strength of audit-ing and reporting standards is supported by legislation that limits ownership and management of audit fi rms to registered auditors whose qualifi cations and right to practise are assured by law and by the Independent Regulatory Board for Auditors (IRBA) instituted in terms of the Auditing Profession Act (Act 26 of 2005) and the South African Institute of Chartered Accountants (SAICA). Th ese bodies work closely with the Johannesburg Stock Exchange to ensure compliance with IFRS standards and the development of new stan-dards, such as the recently launched Integrated Reporting Standard Guidelines. Th is is now the principal annual report for all listed companies which fl ows from the latest King III Report. Th e National Economic Development and Labour Council (Nedlac) was established in 1995 to usher in a post-apartheid era

148 the brics report
of inclusive decision-making and consensus-seeking on major eco-nomic, social, and development policies between government, busi-ness, and labour.
Strong Financial Sector
Th e South African fi nancial sector did not experience the fi nancial upheaval seen in advanced economies, and thus the economy is in a favourable position to recover from the downturn and emerge stronger than before. Th e relative health of the fi nancial sector is emphasized by the 2010–11 WEF Global Competitiveness Report. South Africa ranked 6th out of 139 countries for the second year in a row in respect of soundness of banks for 2010 (up from 15th place in 2008), and 1st for regulation of securities exchanges (up from 2nd in 2009 and 5th in 2008). Th e policy components that protected the country from a fi nancial and subsequent sovereign crisis are elaborated in the following paragraphs.
• A sound framework for fi nancial regulation and well-regulated institutions. Th is ensured that potential risks were anticipated and appropriate action was taken to mitigate them. South African regulators have generally not followed a light-touch approach. Sustainable credit extension has been possible through eff ective legislation, such as the National Credit Act, strong regulatory action, and good risk management systems at banks. Further, to avoid complacency, additional work is being done to strengthen the regulatory framework, bearing in mind the lessons of the global fi nancial crisis. Th ese are discussed in a

best practices 149
recent document released by the National Treasury entitled ‘A Safer Financial Sector to Serve South Africa Better’.
• Appropriate and conservative risk management practices at domestic banks. Th e experience of the small banking crisis in 2002 and the adoption and implementation of the Basel II Capital Accord in 2008 have led to improved risk manage-ment practices and stronger crisis management arrangements at domestic banks. In addition, conservative practices at banks have ensured that far less securitization and derivatives trading has taken place relative to advanced markets.
• Limited exposure to foreign assets. Th e prudential regulation of foreign exposure as applied in the past decade, including lim-its on the extent of exposure to foreign assets by institutional investors and banks, has helped to limit overall foreign risk.
• Subsidiary structure and listing requirements. Registered banks have to be subsidiaries of the domestic or foreign parent company, so their assets and liabilities are ring-fenced even when the parent company is in distress. Th e listing requirement also ensures transparency, rigorous disclosure standards, and high standards of corporate governance, forcing banks to satisfy share-holders and stakeholders at all times.
Th e South African fi nancial system was protected by a broader set of prudent economic, fi scal, and fi nancial sector policies that insulated the economy from the worst of the global shocks. Th ese include: a robust countercyclical monetary policy framework capable of absorbing relatively large external shocks with minimum impact on the domestic economy; low private and public foreign indebtedness; countercyclical fi scal policy; a proactive approach to dealing with
150 the brics report
bank credit risks, including changes in capital adequacy requirements and conservative leverage ratios to curb excessive credit growth; and legislation to protect households from reckless lending practices (National Credit Act). Th ese elements are part of a comprehensive set of policies that will continue to ensure fi nancial stability and provide an excellent foundation to build on to increase the resilience of the fi nancial sector.
Expanded Public Works Programme
Th e expanded public works programme aims to increase employment opportunities for the most vulnerable. Focusing on infrastructure, social, environmental, and community projects administered by various departments, municipalities, and partner organizations, the programme has created about 1 million short-term jobs since Phase 2 began in April 2009. Th e programme empowers individuals by off er-ing learnerships, training programmes, mentorships, and other skill development certifi cations, in an attempt to create a skilled labour force to achieve a sustained reduction in unemployment. Key success factors have been the technical assistance provided to under-skilled municipalities to enable them to expand access. A target of 800,000 short-term jobs has been set for 2011–12.Th e budget for the pro-gramme is around R73 billion for the next three years.
Environmental and Climate Change Policies
Th e South African government has made a commitment to undertake initiatives as part of its response to climate change. Consequently,
best practices 151
South Africa has adopted targets for reducing the country’s carbon emissions. Conditional on the country receiving fi nancial assistance, South Africa plans to reduce its emissions by 34 per cent and 42 per cent by 2020 and 2025, respectively, relative to business as usual. Th e government is also responding to the challenge by placing a green economy at the centre of the New Growth Path. Th is builds on work undertaken on the National Climate Change Response Policy, the Green Economy strategy, the South African Renewable Initiative, the Energy Effi ciency Strategy, the Integrated Resource Plan, and the Integrated Policy Action Plan. Th rough these government policy initiatives, South Africa is tackling development issues innovatively while also considering the challenges of climate change. For instance, the Integrated Resource Plan departs from previous cost-based approaches to electricity gen-eration strategies and focuses on a balanced approach to designing such strategies. Both traditional and alternative electricity generation methods are being included in the Integrated Resource Plan.
Resource Plan
South African business has also taken up the climate change challenge, launching the Carbon Disclosure Project (CDP) as early as 2000. Th e CDP is a voluntary global private sector initiative that aims to encourage companies to measure and report their carbon emissions and integrate the cost of climate change into the assessment of their fi nancial health and business prospects. Since the introduction of the project in South Africa, the response rate of South African businesses has been increasing with each passing year. In South Africa, 74 of the 100 largest corporations on the Johannesburg Stock Exchange

152 the brics report
participated in CDP 2010 (up from 68 in 2009), 31 companies have adopted greenhouse gas reduction targets, and 22 fi rms have com-mitted to developing such targets. Carbon-intensive sectors, such as energy, industrials, and minerals, have the highest response rates for the CDP. Th e CDP response rate in South Africa is the fourth highest internationally, and this suggests that climate change remains suffi ciently high on the corporate agenda and South African compa-nies are willing and ready to deal with the challenges. South Africa has a well-developed policy and legislative frame-work for the conservation and sustainable use of biodiversity. It is one of the few countries in the world to have a Biodiversity Act and a National Biodiversity Institute. By 2008, South Africa had 19 marine-protected areas, covering almost 18 per cent of the South African coastline, declared under the Marine Living Resources Act of 1998. Th e government’s goal is to have at least 20 per cent of South Africa’s coastline declared as protected areas. South Africa hosted the Conference of Parties 17 (COP 17) in November and December 2011, an international event as important as the Kyoto Protocol. South Africa’s hosting of the negotiations indi-cates its commitment to addressing this global challenge.
Competition Policy
Th e South African Competition Commission was set up in 1999 under the Competition Act of 1998. Th e Commission is tasked with investigating anti-competitive conduct. It also assesses the impact of mergers and acquisitions on competition and takes appropriate action; monitors competition levels and market transparency in the economy; identifi es impediments to competition; and plays an

best practices 153
advocacy role in addressing these impediments. Th e Commission has prioritised its work in four sectors in order to maximize the benefi ts to consumers from its work. Th ese sectors are food, agro-processing and forestry, infrastructure and construction, intermediate industrial products, and fi nancial services. Major progress has been made as a result of the Commission’s sustained focus on its priorities. Th e total amount of penalties confi rmed or determined by the Competition Tribunal in 2009–10 was higher than in any previous year and close to R500 million. Th e 2011 Global Competition Review, which is primarily based on a survey of legal practitioners, recently awarded South Africa’s Competition Commission the accolade of ‘Agency of the Year in Asia-Pacifi c, Middle East & Africa’. Th e Commission was also short-listed in the category ‘Enforcement Matter of the Year’ for its innova-tive structured settlement with Pioneer Foods, which was concluded in November 2010. Separately, the 2010 WEF Global Competitiveness Report has ranked South Africa 40 out of 139 countries for goods market effi ciency. Th e Competition Commission is committed to increasing its enforcement capacity, particularly in the area of cartel investigations. To this end, the Commission has established a special investigative unit.
Industrial Policy
Th e South African government’s broad development strategy aims to promote and accelerate economic growth along a path that gener-ates sustainable, decent jobs in order to reduce poverty and extreme inequalities that characterize South African society and economy. Th e National Industrial Policy Framework (NIPF), adopted in 2007,

154 the brics report
is a central component of this strategy. Th e NIPF seeks to encourage value-added, labour-absorbing industrial production and diversify the economy away from its current over-reliance on traditional com-modities and non-tradeable services, thereby stimulating employment growth. Broader-based industrialization will assist in enhancing the participation of historically disadvantaged people and marginalized regions in the mainstream of the industrial economy. Th e implementation of industrial policy is set out in two Industrial Policy Action Plans (IPAP), namely, IPAP1 (2007/08) and IPAP2 (2010/11–2012/13). IPAP targets sectors of the economy with high potential for export growth, employment creation, and technological upgrading. In addition, IPAP2 outlines four major transversal inter-ventions: industrial fi nancing, competition policy, developmental trade policies, and public procurement.
Trade Policy
Tariff s are instruments of industrial policy and have implications for capital accumulation, technological change, productivity growth, and employment. South Africa has adopted a strategic approach to tariff reform that supports industrial and employment objectives. An evidence-based, case-by-case assessment will inform changes to tariff s. Tariff s on mature upstream input industries could be reduced or removed to lower the costs for downstream, labour-creating manufacturing. Tariff s on downstream industries with employment or value-addition potential could be retained or increased to ensure sustainability and job creation while observing international trade obligations in the WTO and other trade agreements.

best practices 155
Trade Strategy, including South–South Cooperation
South Africa’s trade strategy aims to consolidate links with key economies in the North, and build industrial complementarities with dynamic growing economies in the South to support the NIPF’s industrial development objectives and shift the structure of trade towards more diversifi ed, value-added exports. Given the widespread poverty, unemployment, and a host of other development challenges, global integration must not undermine domestic production or exac-erbate unemployment. South Africa sees enormous opportunities for ongoing engage-ment with BRICS countries to structure new kinds of trade and investment agreements that foster complementarities and coopera-tion in the industrial, agricultural, and service sectors and that avoid destructive competition. Appropriately structured preferential trade agreements (PTAs), procurement arrangements, sectoral cooperative agreements, alongside targeted investment and export promotion activities, can shape strategic integration among the BRICS. Such arrangements can encourage value added, sophisticated production and trade that embody higher levels of technology, support industrial upgrading, and place each of the BRICS on a long-term, sustainable economic development path. South Africa, together with its partners in the Southern African Customs Union (SACU), signed a PTA with Mercosur in 2009 and PTA negotiations with India are currently underway. In 2010, South Africa and China established a Comprehensive Strategic Partnership, which aims to promote value-added South African exports to China and increase inward investment by China in projects around mineral benefi ciation. Working groups have also been established to resolve
156 the brics report
non-tariff barriers with Brazil and India, which are often signifi cant barriers to higher levels of intra-South trade. South Africa is a strong proponent of multilateralism as the inter-government response to managing globalization and the deepen-ing interdependence of national economies. South Africa plays an active role in the WTO, both individually and collectively through its membership in key Southern coalitions: the Africa Group, G-20 and NAMA-11. South Africa will continue to press for a development outcome to the Doha Round to re-balance trade rules in favour of the development interests of developing countries. For South Africa, a development outcome is more important than an early conclusion of the trade round that does not deliver on the development mandate agreed on at Doha in 2001. Th e emerging deal at the Doha Round is particularly harsh for South Africa. While South Africa stands to gain very little or no additional market access for its agricultural exports due to the fl ex-ibility granted to industrial countries, it will be required to make the deepest and widest industrial tariff cuts of all other WTO Members. Th is is the result of South Africa’s peculiar tariff structure which is an outcome of the Uruguay Round, where it was required to undertake tariff reduction commitments as a developed country.
Regional Integration
Deeper regional integration in Africa and Southern Africa are vital for engaging more competitively with the world economy. South Africa’s continental trade agenda is focused on supporting Africa’s economic integration in line with the New Economic Programme for African Development (NEPAD), the African Union, and the Abuja

best practices 157
Treaty to establish the African Economic Community. South Africa is committed to promoting ‘developmental integration’ in Southern Africa, which combines trade integration with infrastructure devel-opment and sectoral policy co-ordination. Th ese interventions aim to build regional productive capacity and infrastructure, as experience has demonstrated that the main barriers to increasing intra-regional trade are often not tariff s. In particular, South Africa is expanding the role of its development fi nance institutions (DFIs) in supporting regional infrastructure development across Southern Africa. Consolidating regional economic integration among the Southern African Customs Union (SACU), the free trade area and integration agenda in the Southern African Development Community (SADC), East African Community and COMESA are vital in this respect.
Outward FDI and Internationalization of South African Companies
Several South African fi rms have expanded internationally and become major players in the global economy. During 2008, eight South African companies were among the top 100 non-fi nancial transnational corporations from the developing world, ranked by for-eign assets. Th e list included: MTN Group Limited (telecommunica-tions), Sasol Limited (chemicals), Sappi Limited (wood and paper products), Netcare Limited (other consumer services), Steinhoff International Holdings (other consumer goods), Gold Fields Limited (metal and metal products), Medi Clinic Corp. Limited (other con-sumer services), and Naspers Limited (other consumer services). South Africa is the only African country whose private sector has a strong corporate profi le and presence in the Chinese market, with

158 the brics report
investment valued at over US$ 600 million. Some South African fi rms have become market leaders in China, including SABMiller (breweries), Naspers (media), and Sasol (coal-to-liquid). South African fi rms are among the main investors in Africa. According to UNCTAD, South Africa was the largest emerging market investor in Africa between 2006 and 2008, with US$ 2.6 billion in average annual FDI fl ows more directly invested than by China. Th e share of African host countries in the outward stock of South African FDI increased from less than 5 per cent before 2000 to 22 per cent in 2008, reaching almost US$ 11 billion.1 Compared to Brazil, China and India, outward FDI from South Africa into Africa is more diversifi ed, with a strong presence in six sectors: mining, retail, construction and manufacturing, fi nancial services, telecom-munications, and tourism and leisure.
International Investment Treaty Policy
Th e South African government adopted a new investment policy framework in July 2010. Th e policy aims to modernise and strength-en South Africa’s investment regime by implementing a series of policy measures that will ensure South Africa remains open to for-eign investment, and provides adequate security and protection to all investors, while preserving the sovereign right of the South African government to pursue development public policy objectives. Th e new framework also aims to empower the domestic adjudication of investment disputes.
1 UNCTAD (2010). World Investment Report: Investing in a Low-carbon Economy. UNCTAD: New York and Geneva.

best practices 159
A core concern is that foreign investors’ claims against governments can bypass national courts and be brought directly to international arbitration. Experience shows that in international arbitration, mat-ters of vital national public policy are subjected to a process where arbitrators tend to focus on narrow commercial interests over broader societal or development considerations. Core provisions of Bilateral Investment Treaties (BITs), such as ‘expropriation’ and ‘standards of treatment’, are often ill-defi ned. Expansive interpretations provide the grounds for foreign investors to challenge any policy deemed to undermine their investment interests. In this way, BITs have limited the government’s right to regulate in the public interest.

Major Challenges
Introduction
In the past decade, the world has experienced signifi cant transforma-tions in geopolitical and economic terms, as also in the organization and distribution of production. For several reasons, countries such as Brazil, Russia, India, China, and South Africa (BRICS) have acquired a key role in the world economy as producers of goods and services, receivers and exporters of capital, and/or as consumer markets with large potential. Given their large population (more than 40 per cent of world population), resurgent middle class and huge share of land (nearly 30 per cent of global share) and natural resources, the BRICS form a signifi cant part of the world economy. Further, the recent recovery of BRICS economies from the global economic crisis points towards their robust macroeconomic fundamentals and the nature of the recovery shows the growing signifi cance of the BRICS in the new global order. Important features of BRICS economies include their large geo-graphical dimensions and the size of the population that represents
4

major challenges 161
an enormous potential consumer market, complemented by access to regional markets. Th e number of people at the middle income threshold in BRICS is expected to grow several times during the next decade. It is widely perceived that all the BRICS markets have great potential for establishing the most stabilizing of forces, that is, a pros-perous middle class. Th is middle-income group in each country is growing at varying rates but the future direction is clear: the middle class will both broaden and deepen, providing a solid base for the growth and development of these economies. Income inequality in Brazil and Russia is reducing rapidly and thus leading to a growing and vibrant middle class and the total percentage of South Africans in the middle class is projected to increase at a rapid pace. Russia, India, and Brazil are relatively more domestic demand-driven economies while China’s manufacturing success has boosted urban household spending. All fi ve countries are abundant in terms of workforce availability. Th is is signifi cant in the present context, where, with a few exceptions, most of the Western world has a declining population and a dwindling workforce. In some advanced countries, rapidly ageing societies and longer life-expectancies pose challenges in terms of the availability of work force while BRICS countries, particularly China, India, and Brazil, could gain from such opportunities.
Brazil
Brazil’s agricultural research has transformed the country into a major exporter; the use of bio-fuel for road and urban transport, and the emergence of Embraer as a high-technology aircraft manufacturer are major achievements. In the social sphere, Conditional Cash Transfers

162 the brics report
that target poverty and the success of the anti-AIDS policy provide useful lessons. Th e divergent challenges provide scope for coopera-tion and coordination in various socio-economic areas. For instance, in Brazil, macroeconomic stabilization is a key precondition for successful reforms and sustainable growth. Th e major challenges the Brazilian economy faces are (i) its tradeable goods sector is rather small in comparison to other EMEs like China; (ii) the saving and investment rates have to catch up with other BRICS economies like China and India; (iii) improvements are required in public sector management; (iv) the depth of the fi nancial sector has to be further enhanced; and (v) long-term fi nancing structure for the private sec-tor needs to be improved.
Russia
Russia’s major achievements include reforms during 1999–2009 that promoted economic growth, lowered infl ation, and led to a dramatic fall in the number of people living below the poverty line. Specifi c achievements include setting up of the Oil Stabilisation Fund that proved useful during the crisis. Apart from its vast natural resources, Russia has vital capability in high-technology sectors, both ‘tradi-tional’, where it already possesses some competitive edge (in nuclear and space technology and high-level programming), and ‘new’ (in nano- and bio-technology). Russia has made signifi cant advances in building technological know-how in science and high-technology for defence and spacecraft. However, accelerating the implementa-tion of structural reforms, particularly in effi cient and undercapital-ized natural monopolies, and strengthening the investment climate remain key challenges.

major challenges 163
India
India’s private entrepreneurship, which has been instrumental in the 8–9 per cent annual growth of the economy in recent years, can provide valuable lessons. Private initiative has been responsible for the excellence achieved in the information technology sector and the innovative streak that has led to improvization and production of low-cost goods for the mass Indian market. For India, the major chal-lenges are (i) diversifying its growth towards manufacturing while maintaining its service-led growth model, (ii) making the growth process more inclusive, (iii) improving physical infrastructure, (iv) developing the agriculture sector, and (v) delivering essential public services such as education and health to large parts of the popula-tion.
China
Th e best practices and institutions for China are those that have facil-itated a smooth transition to a robust economy that is economically wide open to the outside world. FDI and infrastructure fi nancing, inter alia, have been playing an important role in promoting economic growth. Th e cities/regions have been successful in attracting foreign investment by providing improved infrastructure and regulatory environment. China has experience in fi nancial macro-management. Th e reform and development of China’s banking industry and fi nan-cial market is an important driver of rapid and sustainable growth. Th e policy challenges for China are to sustain rapid and stable economic growth which is driven by exports and domestic demand in a more balanced way. To facilitate restructuring of the economy,
164 the brics report
fi nancial sector reforms are needed to improve the intermediation of China’s large private savings. Th e government also needs to raise social spending in the areas of education, healthcare, and pensions, which will serve to reduce precautionary saving and boost con-sumption over time. Th ere is also a need to improve the investment structure, advance reforms in healthcare, pension, and education systems, and provide more support to rural areas and less-developed regions.
South Africa
South Africa’s major strength lies in its record of responsible mac-roeconomic management, together with strong institutions, a deep and liquid local bond market, and a sophisticated and well-regulated banking sector. South Africa’s rich endowment of natural resources places it in a good position to benefi t from high commodity prices and increased investment in resources. With the most developed industrial and fi nancial capabilities on the African continent, South Africa role in the integration of policies, markets, fi nance, and infra-structure is vital to Africa’s economic development and realization of the continent’s potential as a growth pole in the global economy. Outwardly oriented South African companies are among the largest sources of FDI in Africa and the country’s development fi nancing institutions are playing an increasing role in the funding of regional infrastructure investment. Th e key challenge for South Africa is to achieve higher levels of inclusive growth that raise employment and reduce inequality. Low domestic savings, currency volatility, inadequate investment in productive sectors of the economy, skills shortages, and ineffi cient

major challenges 165
government services delivery are some of the other challenges. Policies proposed in the New Growth Path constitute the key means to address these challenges through a development state that places employment at the centre of the fi ght against inequality. Within a prudently managed macroeconomic framework, the government is prioritizing policy measures focused on the expansion of infra-structure networks, skill development, interventions to raise youth employment, industrial policy that promotes higher-value added exports, the development of rural economies, small enterprise pro-motion, green economy initiatives, and regional integration.
Challenges to the BRICS as a Group
In the years to come, it is expected that the BRICS will become large global suppliers of manufactured goods and services as well as major suppliers and consumers of commodities. Th us, the BRICS have the potential to evolve into a powerful economic bloc. In recent years, the BRICS have been taking advantage of their abundant population and resources and, on the whole, achieving steady economic growth. However, the trends in GDP indicate that the individual countries have diff erent paces and levels of economic growth. China has been maintaining its long-term high economic growth trajectory, while India and Russia have been moving towards sustained high growth. In contrast, Brazil and South Africa have shown sustainable but lower economic growth rates since the early 2000s, but have been making rapid strides along the path from crisis to stability and growth. For South Africa, the major challenges are the development of the socio-economic infrastructure and furthering the reforms process.

166 the brics report
Despite the resilience to the recent global crisis, there is a source of potential downward pressure on growth in the BRICS because of weak growth and the spillover eff ects of policy responses in advanced economies. While the infrastructure requirements of the BRICS economies are huge, public–private participation can help relax this constraint, provided that the institutional mechanism is sound enough for their optimal combination. In this context, strategic cross-sector reforms, resulting in improved policy as well as legal and institutional frameworks for greater private sector participation, anchored in good governance norms are required. A common challenge that the BRICS economies face is the need for institutional development without which sustainable growth cannot be ensured. Institutional development is still a long way off in most of these countries. At present, international investors may be bullish about the future potential of the BRICS economies as refl ected in AT Kearney’s FDI Confi dence Index and Global Retail Development Index, the remaining challenges should not be over-looked. Similarly, the credibility of the policy of reforms is crucial for the BRICS economies to make their growth processes more durable and development-oriented. In the BRICS countries, policy changes are needed to address both domestic and external challenges. China needs to take it as its priority tasks to transform the economic development pattern, expand domes-tic demand, and improve people’s well-being in advancing economic and social development. In case of Brazil, Russia, and South Africa, their current reliance on exports of natural resources such as oil and other primary commodities needs diversifi cation. Measures includ-ing industrial policy are required to improve the competitiveness of

major challenges 167
manufactures in order to make economic growth less vulnerable to adverse movements in commodity prices. An important distinctive aspect among the BRICS economies lies in their respective levels of social and infrastructure development. Brazil, India, and South Africa are still to catch up with the level of infrastructure and human capital achieved by Russia and China. At the same time, growing inequality remains a problem in some BRICS countries. Such factors may lead to divergence in the speed with which the BRICS economies catch up. In the next decade, the manner in which challenges such as high fi scal defi cits in the post-crisis period, high global uncertainty leading to weak demand for exports, trade protectionism in the wake of the global fi nancial crisis, intolerably high unemployment levels, poverty, and inadequate public health and education facilities are met would be crucial in determining the development trajectory of the BRICS economies. Environmental degradation and climate change are grave threats for sustaining high levels of growth in the BRICS economies. Th e BRICS countries could collaborate in the above areas, complement and learn from each other, optimize each other’s science and technol-ogy resources, and jointly address challenges in these areas. Th e weight of the BRICS in investment portfolios could rise sharply. Th e volatility in capital infl ows could pose threats to fi nan-cial stability and the balance of payments. Going forward, fi scal policy after the global fi nancial crisis war-rants a balance between supporting the recovery through sustained infrastructure investment and ensuring fi scal sustainability. Th e mon-etary policy stance has been appropriate and has to take into account the evolving global and domestic situation. More pressing are policies
168 the brics report
to engender higher economic growth. Th e various government initia-tives to enhance the competitiveness of selected industries can be usefully complemented by reforms to improve the eff ectiveness and effi ciency of labour and product markets. In a post-global crisis world largely shaped by fi nancial instability and weak growth in major economies, the BRICS countries have a remarkable opportunity to coordinate their economic policies and diplomatic strategies not only to enhance their position as a grouping in the international economic and fi nancial system, but also to be a stabilization factor for the world economy as a whole. Th e BRICS should increasingly harmonize and coordinate their policies with a view to sustaining their growth momentum and capacity to weather global turbulence. Th e benefi t of cooperation is immense not only for the BRICS but also for the global economy. A strategic agenda for forging closer links among the BRICS, as outlined in this joint report, may contribute to consolidating and expanding their roles in global aff airs.
BRICS Cooperation
In the BRICS economies, there exists huge opportunities to extend economic growth and development to the next level. In this regard, there is a possibility to increase cooperation among the BRICS to gain competitive advantages. Th is chapter looks at areas where greater cooperation among the BRICS economies could be explored. It is important to note that all the proposals laid out in this chapter might contribute to promote synergetic relationships among the BRICS economies, but their political and technical feasibility is yet to be determined while their implementation may require further deliberations. Th e areas of cooperation listed below should be seen as exploratory items to be included in further discussions and the agendas of future meetings between BRICS policymakers. Th e focus areas suggested are as follows:
(i) Intra-BRICS Trade and Investment Cooperation(ii) Cooperation in Infrastructure Financing(iii) Industrial Development and Cooperation(iv) Cooperation in Transportation
5
170 the brics report
(v) Cooperation in Food Security(vi) Cooperation in Technical Education(vii) Cooperation in Financial Market Development(viii) Cooperation in Research and Development(ix) Cooperation in Area of Culture and Tourism(x) Cooperation in International Issues(xi) Cooperation in Energy Security(xii) Cooperation to Build Eff ective Institutions (xiii) International Development Bank for Fostering South–South
Investment
(i) Intra-BRICS Trade and Investment Cooperation
Th ere is scope for considerable increase in intra-BRICS trade, leading to a rise in income and employment. To build trade and investment relations, BRICS countries should work together to identify niche areas, sectors, and markets that off er potential for trade and invest-ment expansion to bolster productive sectors for mutual benefi t, avoiding destructive competition. Th e BRICS banking sector could play an important role in pro-moting trade and investment through innovative trade fi nancing facilities, export credit arrangements, and countercyclical measures which ensure that trade fi nance does not get aff ected during business downturns, as was the case during the recent global crisis. Th is would require concerted action by the banking sector in BRICS countries with the BRICS central banks playing the anchor role in chalking out a strategy to strengthen cooperation in trade and investment. One means of promoting intra-BRICS trade is through invoic-ing and settlement of trade in domestic currencies. Exports and

brics cooperation 171
imports are subject to currency risk, because international trade transactions are mostly invoiced in major international curren-cies. Currency risk factors impede the growth of international trade, as exporters/importers are concerned about the implications of exchange rate fl uctuations, especially during times of high cur-rency volatility. A way forward could be to explore the prospects of invoicing of trade in domestic currencies, with settlement of transac-tions in major international currency equivalents. Th is would help mitigate the negative impact of currency volatility on trade and help promote the international use of BRICS currencies. In this regard, it is worth mentioning that the BRICS Development Banks are working out means of promoting fi nancial transactions in local currencies. China has already made a pioneering eff ort in this direction by invoicing some of its bilateral trade in Renminbi and promoting an inter-bank and off shore bond market (Hong Kong-based) for Renminbi. Th is would create investment opportunities and liquid-ity in the market, encouraging wider use of the Renminbi for trade invoicing and settlement. As far as Brazil is concerned, the Local Currency Payment System in Local Currency (SML acronym in Portuguese) with Argentina began to operate in October 2008. It is a unique system designed by both Central Banks, which carefully reviewed various international experiences in the area of payment systems, especially those of early intra-regional trade in Europe. Th e Central Banks of Brazil and Argentina are responsible for imple-mentation of this unique regional payments system. All individuals and companies are eligible to participate in the SML in transactions relating to trade in goods and services (such as freight and insur-ance), which are imports denominated either in Argentine pesos or exports in Brazilian Reals (BRL). Th e Central Bank of Brazil has been

172 the brics report
conducting studies on the feasibility of similar arrangements with other trading countries.
(ii) Cooperation in Infrastructure Financing
Some BRICS economies suff er from a ‘infrastructure defi cit’, espe-cially in the areas of transport and energy. Th is defi cit is a constraining factor in sustaining high growth rates in the long run. Th ere is also scope to explore ways to enhance coherence among BRICS countries in promoting infrastructure development at the regional level. To address the problem, there is scope for cooperation among BRICS in increasing the availability of infrastructure fi nancing. Th is could be through setting up BRICS infrastructure funds to mobilize retail and institutional investors. Tax benefi ts could also be provided for investment in infrastructure bonds, as is being done in India. While the infrastructure requirements in BRICS economies are huge, public–private participation can help relax this constraint, provided that the institutional mechanism is sound enough for their optimal combination. Private equity players could also be encouraged to invest in infrastructure projects. It is understood that many of the large global private equity funds have accumulated a huge cash corpus for lack of investment opportunities, especially due to the global crisis. Th rough favourable policies and tax incentives, some of this money could be encouraged to fl ow towards infrastructure sectors in BRICS economies. Besides, attempts could be made to address the problem of exces-sive capital fl ows to emerging market economies by directing some of these fl ows to designated infrastructure sectors. Th e key to such a move is a policy framework with tax incentives that is carefully
brics cooperation 173
thought through. Brazil has already initiated steps to direct the fl ow of capital into long-term corporate bonds by providing tax incentives. Th ere are also many infrastructure companies operating in the BRICS economies, with specialized knowledge of project develop-ment in emerging economy environments. Th ese may be encouraged to bid for road, railway, airport, and port projects in the BRICS, a measure that would help create a BRICS-wide infrastructure market.
(iii) Industrial Development and Cooperation
Sharing technology, expertise, and research in the industrial sector is another key area of cooperation among the BRICS. Exchanging experiences on policy measures that BRICS countries have under-taken to promote industrial development could be a valuable area of cooperation, including encouragement of industrial production networks amongst BRICS. Th ere are diverse areas where the BRICS could learn from the experiences of each other. In the fi rst place, BRICS economies boast of some of the largest private sector conglomerates in the emerging market economies. Many of these have been active players in the international market through collaboration and acquisitions abroad. Th ere is scope to learn from the experience of these countries to take the private sector forward in other BRICS and emerging economies. Th ere is also scope for drawing valuable lessons from the experience of encouraging private entrepreneurship in some countries which have excelled in the high-technology sector. Pooling of expertise and collaboration in such areas could contribute to an improvement in skills and technologies, leading to higher growth of the BRICS economies.

174 the brics report
(iv) Cooperation in Transportation
Th ere is room for cooperation in building eff ective and effi cient transport links among the BRICS via initiatives like the sharing of transport technologies. Countries in BRICS could also learn and share experiences of developing mass rapid transport system.
(v) Cooperation in Food Security
Th ere is scope for increased cooperation among the BRICS to pro-mote food security by raising agricultural productivity and output; promoting investments in the food supply chain; and developing a social safety net through conditional income transfer programmes for the poorest. More specifi cally, BRICS countries can strengthen food security cooperation via initiatives including the creation of basic agricultural information exchange system of BRICS countries; development of a general strategy for ensuring access to food for the most vulner-able section(s) of the population; undertaking measures to reduce the negative impact of climate change on food security, adapting agriculture to climate change; and enhancing agricultural technology cooperation and innovation as well as through promotion of trade and investment in agriculture. BRICS economies are major producers, consumers, and export-ers of agricultural, horticultural, and meat products. Th e necessary expertise and research capabilities are already available in BRICS economies to raise production through increasing yields and to extend cultivation to previously non-cultivable land. With its credibility well established, the Brazilian Agricultural Research Corporation
BRICS COOPERATION 175
(Embrapa) could play the anchor role in this respect. Arrangements to increase inter-agricultural trade among the BRICS could be mutu-ally beneficial, given their complementarity in this area, and hence should be explored. The BRICS countries could also envisage ways to promote food security and food production in Third World countries with a focus on famine-affected areas.
(vi) Cooperation in Technical Education
BRICS economies have some of the best engineering, architectural, medical, scientific, and management institutes that cater to the spe-cific requirements of emerging market economies. Their expertise lies in the fact that the faculty and students develop niche under-standing of emerging economy requirements and business condi-tions. Cooperation among BRICS institutions through skill transfer and shared curriculum, and student and faculty exchange would help the quality of BRICS technical education move up the value chain. Some of the institutions could also be encouraged to set up campuses in other BRICS countries on a reciprocal basis, if local laws and regulations permit.
(vii) Cooperation in Financial Market Development
The financial markets in BRICS are at different stages of develop-ment. There is considerable scope for the BRICS to learn from each other by exchanging experts and country experiences. A greater emphasis, however, has to be placed on a BRICS-wide corporate bond market, which still lacks depth and liquidity in
9780198085386 Brics Report_05_Ch-05.indd 1759780198085386 Brics Report_05_Ch-05.indd 175 26/03/12 10:32 AM26/03/12 10:32 AM
176 THE BRICS REPORT
some BRICS countries and has been the missing link in mobilizing resources for corporate investment. Many emerging sovereigns and corporations have been issuing international bonds on a regular basis. To create a BRICS-wide market for sovereign and corporate bonds, international and domes-tic bonds by BRICS sovereign, and corporate issuers that target the BRICS investor base could be explored. This will help create a niche BRICS bond market and forge closer links among sovereign/corporate borrowers and the investor community in the BRICS economies. It would also help widen and deepen the BRICS sov-ereign/corporate debt markets. The main advantage for the investor would be the diversification of the investor base and a greater choice of risk/return/maturity profiles. Key aspects like size, deepness, liquidity, fair pricing, pricing disclosure, clearing structure, regula-tion, taxation, investors base, hedging possibilities, transparency, and money market structure would need to be studied in detail for the purpose. It is difficult to identify similarities in each bond market specifici-cally and to share usable experience in order to enhance market infra-structure. Starting with the sovereigns, local markets are far diverse from the common external market environment (either US-Dollar denominated or the Euro bond markets). These markets are tagged with mainstream securities standards that fulfil investor expectations in terms of market functioning and overall segmentation across dif-ferent investor classes. Sovereign local markets, despite their size, may operate in disparate ways across nations. The corporate bond market is even more segmented. Public debt managers of BRICS could meet to exchange informa-tion on best practices and recent initiatives undertaken in the field of public debt management.
9780198085386 Brics Report_05_Ch-05.indd 1769780198085386 Brics Report_05_Ch-05.indd 176 26/03/12 10:32 AM26/03/12 10:32 AM
brics cooperation 177
(viii) Cooperation in Research and Development
BRICS countries can explore cooperation in the areas committed in the fi rst BRICS Senior Offi cial Meeting on Science, Technology and Innovation in 2011: exchanging of information on STI policies and programmes, promotion of technology transfer, new energy, renew-able energy and energy effi ciency, nanotechnology, basic research, medicine and biotechnology, as well as setting up of STI Working Group responsible for promoting and materializing cooperation. In order to improve cooperation among BRICS countries, there is a need to conduct research studies at the inter-government level in potential areas of cooperation. Th ese studies may be undertaken in existing research institutes by providing academic support. In this regard, the existing cooperation among BRICS think tank institutes could be emphasized, and the Sanya Action Plan suggestion could be implemented by 2012. Creation of BRICS institutes in certain specifi c areas could be considered with the purpose of strengthening research in areas of collective interest. Th ese institutes should not necessarily be set up from scratch. Th ey could be formed by agreements of existing government-sponsored organizations as well as private and academic research centres that conduct research in areas of international trade, capital markets, and environment studies (either academic or funded by government think tanks) in each BRICS country.
(ix) Cooperation in the Area of Culture and Tourism
Th ere is remarkable diversity in culture, language, history, economy, and institutions among the BRICS. To enhance knowledge and

178 the brics report
understanding of this diversity, cooperation could be extended to cultural exchange and tourism. In the area of tourism, joint initia-tives by offi cial tourism promotion agencies could be put in place to arouse interest in the private sector operators regarding the other BRICS countries. Th ese initiatives could also include information and educational exchanges with offi cial support, wherever required. Th e BRICS Bibliographic Catalogue, which contains works in many diff erent areas, such as history, literature, political science, and sociology of the BRICS countries, is an initiative which helps pro-mote knowledge of each country, and, in this respect, the catalogue could be distributed in schools and universities located in the BRICS countries.
(x) Cooperation in International Issues
Th e global economy continues to face uncertainty. Th e eurozone debt crisis, high fi scal and sovereign debt levels, and weak aggregate demand are aff ecting recovery prospects in the advanced economies, with attendant implications for EMEs. Th ese risks have created fresh challenges for the BRICS econo-mies, especially given the key role that the BRICS are expected to play in the post-crisis ‘new normal’ of the world economy. Th e BRICS should endeavour, therefore, to strengthen macro-prudential policies and supervision and address some of the causes of the global weaknesses. Th e BRICS could further cooperate among themselves in taking a coordinated position in several international organizations like the IMF, G-20, BIS, FSB, WTO, IOSCO, BCBS, etc. Given their size

brics cooperation 179
and role in the global economy, the coordinated approach could lead to better synchronization of policies and improved outcomes.
(xi) Cooperation in Energy Security
Th e BRICS economies need to work towards increasing energy secu-rity. Th is would include coordination in multilateral fora to achieve better supervision of long-term swap contracts to fi x the price of future oil supplies, cooperation in oil exploration and refi ning, increasing natural gas supply through pipelines and setting up liquefi ed natural gas (LNG) terminals, raising the share of renewable energy in energy consumption, and encouraging conservation. Research and coopera-tion in renewable energy sources like solar, wind, tidal, biomass, and hydro-electric power would be important areas of cooperation and would go a long way in increasing energy security among the BRICS and other emerging economies. Lessons could also be drawn from the bio-fuel industry in Brazil especially in the motor transport sector.
(xii) Cooperation to Build Eff ective Institutions
If one compares BRICS economies with the most advanced ones in terms of governance indicators, there is still a wide gap in governance eff ectiveness. Th e BRICS countries need to improve their governance and related institutional frameworks. Improvements in corporate governance, accounting standards, and the regulatory framework are essential to align standards in BRICS economies with the best international practices. Institutional soundness would enhance the

180 THE BRICS REPORT
capacity of the government to effectively formulate and implement sound policies.
(xiii) International Development Bank for Fostering
Investment among Emerging Markets and Developing
Countries
In order to safeguard against the emerging risks and uncertainties and to meet the challenges of development, it is critical for the BRICS countries, in association with other relevant partners, to have an establishment like an international development bank for fostering investment among emerging markets and developing countries. The issue is particularly significant in the context where global economic prospects remain fragile, contributing to instabilities in the finan-cial and investment flows across the economies amid varying risks and uncertainties, together with concerns on dangers arising from climatic and environmental changes. Such an institutional set-up may ensure a better allocation of hard-earned savings of develop-ing and emerging economies, while rebalancing savings and invest-ments within emerging and developing countries that would finance infrastructure and nurture higher growth in these economies. The proposal for the international development bank for fostering invest-ment among emerging markets and developing countries could also mobilize resources to help achieve their development goals.
9780198085386 Brics Report_05_Ch-05.indd 1809780198085386 Brics Report_05_Ch-05.indd 180 26/03/12 10:32 AM26/03/12 10:32 AM

FM.indd 2 12/14/11 3:09:15 PM

FM.indd 2 12/14/11 3:09:15 PM