Embed Size (px)
Citation preview

AD-A246 879 /7>
-VREDUCING
REQUIREMENTS
ERRORS THROUGH
THE USE OF COMPUTER-AIDED SOFTWAREENGINEERING (CASE) TOOLS DURING
REQUIREMENTS ANALYSIS
THESIS
Marvin E. Key, Jr., Captain, USAF
AFIT/GSS/ENG/91D-07
- . DEPARTMENT OF THE AIR FORCE 92-04819
AIR FORCE INSTITUTE OF TECHNOLOGY
Wright-Patterson Air Force Base, Ohio
92 2 25 14
AFIT/GSS/ENG/91D-07
REDUCING REQUIREMENTS ERRORS THROUGHTHE USE OF COMPUTER-AIDED SOFTWAREENGINEERING (CASE) TOOLS DURING
REQUIREMENTS ANALYSIS
THESIS
Marvin B. Key, Jr., Captain, USAF
AFIT/GSS/ENG/91D-07
Approved for public release; distribution unlimited.
The opinions and conclusions in this paper are those of theauthor and are not intended to represent the official
position of the DoD, USAF, or any other government agency.
Aocs.Ion For
DTIC TrAB I
Avhi1 and/or
" -Ai Cl~i

AFIT/GSS/ENG/91D-07
REDUCING REQUIREMENTS ERRORS THROUGH THE USE
OF COMPUTER-AIDED SOFTWARE ENGINEERING (CASE) TOOLS
DURING REQUIREMENTS ANALYSIS
THESIS
Presented to the Faculty of the School of Systems and
Logistics of the Air Force Institute of'Technology
Air University
In Partial Fulfillment of the
Requirements for the Degree of
Master of Science in Software Systems Management
Marvin B. Key, Jr., B.A.
Captain, USAF
December 1991
Approved for public release; distribution unlimited

Preface
This study was undertaken to learn if Computer-Aided
Software Engineering (CASE) tools for requirements analysis
were being used extensively in the United States Air Force
(USAF) and whether or not any cost savings or growth could
be associated with their use or non-use. The findings of
this study may impact CASE tool use in the USAF and can
serve as the foundation for future CASE tool studies.
During the course of completing this thesis, I received
guidance and assistance from many people. A thank you to
everyone who aided this effort. There are certain
individuals who deserve a special aknowledgment. A
tremendous THANK YOU goes to my advisor, Lt Col Patricia
Lawlis, whose insight, patience, and encouragement kept me
going throughout the proposal and thesis process. I would
also like to thank my reader, Dr. Freda Stohrer, for her
help in saying it in just the right manner and enabling me
to get my point across. Thanks also goes to Professor Dan
Reynolds for his assistance in setting up and reviewing all
of the statistics and making mathematics fun again.
Additionally, I would like to thank the Software Engineering
Professional Continuing Education staff and Capt Joe
Mattingly for their assistance in data colle-tion, without
which the study would have been impossible to complete. I
would also like to thank the members of GSS-91D for their
ii
ideas, support, and assistance throughout the entire
process. Last, but certainly not least, I would like to
extend my eternal love, appreciation, and thanks to my wife,
Kelly, and our children, David, Sarah, and Andrew, who
tolerated and endured my extended absences, odd hours, and
late nights in the basement office over the last 18 months.
God bless all.
Marvin B. Key, Jr.
iii

TABLE OF CONTENTS
Page
Pref ace........................ . .. ...... . . .. .. . ...
List of Figures......................xi
List of Tables......................xv
Abstract........................xvii
I. Introduction......................-1
Background.......................1-1
General Issue....................1-2
Specific Problem...................1-3%
Hypothesis and Investigative Questions ........ 1-3
Scope of Research..................1-4
II. Literature Review..................2-1
Introduction.....................2-1
Software Management Problems.............2-1
Benefits of CASE Tools................2-3
Air Force CASE Tool Evaluation Assistance .... 2-5
United States Air Force Studies...........2-9
Standard Systems Center Efforts ......... 2-9
Rome Air Development Center Efforts. ..... 2-10
Requirements Engineering Testbed . . . . 2-10
Direction of Future CASE Tool Development . . . . 2-12
iv

Page
Summary.......................2-14
III. Methodology.....................3-1
Introduction.....................3-1
Justification....................3-1
Instrument......................3-2
Population/Sample..................3-3
Data Collection Plan.................3-5
Statistical Tests . . . . . . . . . . . . . . . . 3 5
Limitations.....................3-5
Summary.......................3-6
IV. Data Analysis....................4-1
Introduction.....................4-1
Control Group Findings...............4-1
Frequency Distributions.............4-1
Rank....................4-2
Programming Experience...........4-2
Type of Systems Developed.........4-2
Number of Systems Being Developed ... 4-3
Cost of Systems Being Developed .... 4-3
System Lines of Code............4-3
CASE Tool Use by Organizations ....... 4-3
Personal CASE Tool Users..........4-4
Areas of CASE Tool Use...........4-4
V

Page
Initial CASE Tool Cost .... ......... 4-5
Recurring CASE Tool Costs .. .. ....... 4--6
First Exposure to CASE Tools ....... 4-6
Areas Lacking Enough Data forStatistical Significance .... ........ 4-7
Sample Group Findings ..... .............. 4-7
Frequency Distributions ... ........... . 4-8
Rank ......... .................. 4-8
Programming Experience .. ......... 4-8
Type of Systems Developed . ....... . 4-8
Number of Systems Being Developed 4-8
t Cost of Systems Being Developed .... 4-9
System Lines of Code ... .......... 4-9
CASE Tool Use By Organizations ...... .4-10
Personal CASE Tool Use ... ......... 4-10
Areas of CASE Tool Use ... ......... 4-11
First Exposure to CASE Tools ....... .. 4-11
Areas Lacking Enough Data forStatistical Significance .. ........ .. 4-12
Combined Analysis of Groups ... ........... 4-12
Frequency Distributions .... ........... 4-12
Rank ....... .................. 4-13
Programming Experience ... ......... 4-14
Number of Systems Being Developed . . . 4-14
Cost of Systems Being Developed . . . . 4-14
vi
Page
Systems Lines of Code ... ......... 4-15
CASE Tool Use by Organizations ...... .4-15
Personal CASE Tool Users .. ........ 4-16
Initial CASE Tool Cost ... ......... 4-16
Recurring CASE Tool Costs .. ....... 4-16
First Exposure to CASE Tools ....... .. 4-17
Experience with CASE Tools .. ....... .4-17
Errors Attributable to RequirementsAnalysis without CASE Tool Use ...... .4-17
Percentage of Total Errors Credited to
Requirements Analysis ... ......... 4-18
Errors Increased While Using CASE Tools 4-18
Productivity Increased Using CASE Tools 4-19
Development Costs Increased Using CASETools ...... ................. 4-19
Project Completion Time Increased UsingCASE Tools ..... ............... 4-19
Areas Still Lacking Enough Data forStatistical Significance .. ........ .. 4-20
Contingency Tables and Chi-SquareCalculations ...... ................ 4-20
Programming Experience ... ......... 4-21
Cost of Systems Being Developed .... 4-21
System Lines of Code .... .......... 4-22
CASE Tool Use by Organizations ...... .4-22
Personal CASE Tool Use ... ......... 4-22
First Exposure to CASE Tools ....... .. 4-22
vii

Page
Percentage of Errors Credited toRequirements Analysis without CASETools..................4-22
Areas of Uncertainty............4-22
Summary.......................4-23
V. Conclusions and Recommendations . .........
Introduction.....................5-1
Conclusions.....................5-1
Research Question #1..............5-1
Research Question #2..............5-i
Research Question #3..............5-2
Research Qu~stion #4..............5-2
Research Question #5..............5-3
Research Question #6..............5-3
Overall conclusions.................5-4
Recommendations for Future Research.........5-4
Summary.......................5-5
Appendix A: Initial Survey Package............A-1
Survey Approval Request..............A-i
Request Form...................A-1
Survey Cover Letter...............A-4
Privacy Act Form...............A-5
Proposed Survey Instrument...........A-6
viii

Page
Appendix B: Air Force Manpower and Personnel CenterResponse..................B-i
AFMPC/DPMYOS Letter, 20 May 91...........B-i
Appendix C: Final Survey Package.............C-1
Cover Letter.....................C-i
Privacy Act Statement................c-2
Final Survey Instrument..............C-3
Appendix D - Control Group Raw Data............D-1.
Appendix E - Frequency Distribution Charts of ControlGroup Responses..............E-i
Introduction.....................E-1
Frequency Distribution Charts.......... ... E-i
Appendix F - Sample Grovo Raw Data...........F-1
Appendix G - Frequency Distribution Charts of SampleGroup Responses .............. G-
Introduction.....................G-1
Frequency Distribution Charts...........G-1
Appendix H - Frequency Distribution Charts of All
Responses in Combination...........H-1
Introduction.....................H-1
Frequency Distribution Charts...........H-i
Appendix I - SAS Analysis of Data....... .. .. .. . ...
:1.x

Page
Introduction......................1
Tables and Chi-Square Calculations..........I-1
Bibliography......................BIB-i
VITA.........................VITA-i
x

List of Figures
Page
Figure E-1. Rank and Grade of Control Group ..... E-1
Figure E-2. Experience Levels of Control Group . . . . E-2
Figure E-3. Number of Systems in Development byControl Group Organizations . ....... E-2
Figure E-4. Cost of Development Systems in ControlGroup Organizations ... ........... E-3
Figure E-5. Average Lines of Code in DevelopmentSystems in Control Group Organizations E-3
Figure E-6. Determining Number of Control GroupOrganizations that Use CASE Tools . . .. E-4
Figure E-7. Determining Number of Control GroupRespondents that Use CASE Tools ..... E-4
Figure E-8. Determining Average Initial Costs of UsingCASE Tools in Control Group Organizations E-5
Figure E-9. Determining Average Recurring Costs ofCASE Tool Use in Control GroupOrganizations ..... .............. E-5
Figure E-10. Determining First Exposure to CASE Toolsin Control Group .... ............ E-6
Figure E-11. Determining CASE Tools Experience Levelof Control Group Respondents . ...... E-6
Figure E-12. Requirements Analysis Errors/KLOC ofControl Group Organizations Not UsingCASE Tools . . . . . . . . . . . . . . . E-7
Figure E-13. Percentage of Total Errors Crediteu toRequirements Analysis in Control GroupOrganizations Not Using CASE Tools . . . E-7
Figure E-14. Requirements Analysis Errors/KLOC ofControl Group Organizations Using CASETools ....... .................. E-8
xi

Page
Figure E-15. Percentage of Total Errors Credited toRequirements Analysis in Control GroupOrganizations Using CASE Tools ..... E-8
Figure E-16. Rating Whether Using CASE Tools IncreasedError Rates in Control Group . ...... E-9
Figure E-17. Rating Whether Using CASE Tools IncreasedProductivity in Control Group ....... E-9
Figure E-18. Rating Whether Using CASE Tools IncreasedDevelopment Costs in Control Group . . . E-10
Figure E-19. Rating Whether Using CASE Tools IncreasedTime to Complete Projects in ControlGroup ....... .................. E-10
Figure G-1. Rank and Grade of Sample Group ....... G-1
Figure G-2. Experience Levels of Sample Group . . . . G-2
Figure G-3. Number of Systems in Development by SampleGroup Organizations ..... ........... G-2
Figure G-4. Cost of Development Systems in SampleGroup Organizations ... ........... G-3
Figure G-5. Average Lines of Code in DevelopmentSystems in Sample Group Organizations G-3
Figure G-6. Determining Number of Sample GroupOrganizations that Use CASE Tools . . . . G-4
Figure G-7. Determining Number of Sample GroupRespondents that Use CASE Tools ..... G-4
Figure G-8. Determining Average Initial Costs of UsingCASE Tools in Sample Group Organizations G-5
Figure G-9. Determining Average Recurring Costs ofCASE Tool Use in Sample GroupOrganizations ..... .............. G-5
Figure G-10. Determining First Exposure to CASE Toolsin Sample Group .... ............. G-6
xii

Page
Figure G-11. Determining CASE Tool Experience Level ofSample Group Respondents .. ........ G-6
Figure G-12. Requirements Analysis Errors/KLOC ofSample Group Organizations Not Using CASETools ....... .................. G-7
Figure G-13. Percentage of Total Errors Credited toRequirements Analysis in Sample GroupOrganizations Not Using CASE Tools . . . G-7
Figure G-14. Requirements Analysis Errors/KLOC ofSample Group Organizations Using CASETools ......... .................. G-9
Figure G-15. Percentage of Total Errors Credited toRequirements Analysis in Sample GroupOrganizations Using CASE Tools ..... G-8
Figure G-16. Rating Whether Using CASE Tools IncreasedErrors Rates in Sample Group . ...... G-9
Figure G-17. Rating Whether Using CASE Tools IncreasedProductivity in Sample Group . ...... G-9
Figure G-18. Rating Whether Using CASE Tools IncreasedDevelopment Costs in Sample Group . . . . G-10
Figure G-19. Rating Whether Using CASE Tools IncreasedTime to Complete Projects in SampleGroup ........ .................. G-10
Figure H-i. Rank and Grade of All Respondents . . . . H-I
Figure H-2. Experience Levels of All Respondents . . . H-2
Figure H-3. Number of Systems in Development by AllSurveyed Organizations ... .......... H-2
Figure H-4. Cost of Development Systems in AllSurveyed Groups .... ............. H-3
Figure H-5. Average Lines of Code in DevelopmentSystems in All Surveyed Organizations H-3
Figure H-6. Determining Number of SurveyedOrganizations that Use Case Tools . . . . H-4
xiii

Page
Figure H-7. Determining Number of Total Respondentsthat Use CASE Tools ... ........... H-4
Figure H-8. Determining Average Initial Costs of UsingCASE Tools in All Surveyed Organizations H-5
Figure H-9. Determining Average Recurring Costs ofCASE Tool Use in All SurveyedOrganizations .... .............. H-5
Figure H-10. Determining First Exposure to CASE ToolsIn All Respondents ... ........... H-6
Figure H-11. Determining CASE Tool Experience Level ofAll Respondents .... ............. H-6
Figure H-12. Requirements Analysis Errors/KLOC of AllSurveyed Organizations Not Using CASE ToolsH-7
Figure H-13. Percentage of Total Errors Credited toRequirements Analysis in All SurveyedOrganizations Not Using CASE Tools . . . H-7
Figure H-14. Requirements Analysis Errors/KLOC of AllSurveyed Organizations Using CASE Tools H-8
Figure H-15. Percentage of Total Errors Credited toRequirements Analysis in All SurveyedOrganizations Using CASE Tools ...... H-8
Figure H-16. Rating Whether Using CASE Tools IncreasedError Rates in All SurveyedOrganizations ..... .............. H-9
Figure H-17. Rating Whether Using CASE Tools IncreasedProductivity in All SurveyedOrganizations ..... .............. H-9
Figure H-18. Rating Whether Using CASE Tools IncreasedDevelopment Costs in All SurveyedOrganizations ..... .............. H-10
Figure H-19. Rating Whether Using CASE Tools IncreasedTime to Complete Projects in All SurveyedOrganizations ..... .............. H-10
xiv

List of Tables
Page
Table 2-1. Sample Software Quality Attributes Listing 2-8
Table 4-1. Systems Under Development .. ......... 4-2
Table 4-2. Areas of CASE Tool Use ... .......... 4-5
Table 4-3. Areas of Impractical StatisticalEvaluation ...... ................ 4-7
Table 4-4. Systems Under Development .. ......... 4-9
Table 4-5. Areas of CASE Tool Use ... .......... 4-12
Table 4-6. Areas of Impractical StatisticalEvaluation ...... ................ 4-13
Table I-i. Rank/Grade of Respondents .. ......... 1-2
Table 1-2. Years of Experience of Respondents .... 1-3
Table 1-3. Number of Systems Under Development . ... 1-4
Table 1-4. Cost of Systems Under Development ..... . 1-5
Table I-5. Lines of Code in Systems Under Development 1-6
Table 1-6. Organizational Use of CASE Tools . ..... 1-7
Table 1-7. Personal Use of CASE Tools .. ........ 1-8
Table 1-8. Initial Cost of Using CASE Tools . ..... 1-9
Table 1-9. Recurring Cost of Using CASE Tools .... 1-10
Table 1-10. First Exposure to CASE Tools ... ....... I-l
Table I-ll. Length (Years) Using CASE Tools . ..... 1-12
Table 1-12. Errors/KLOC w/o Using CASE Tools ...... .1-13
Table 1-13. Percentage of Errors Credited to Req Analw/o CASE Tools ..... .............. 1-14
Table 1-14. Errors/KLOC Using CASE Tools .. ....... 1-15
xv

Page
Table 1-15. Percentage of Errors Credited to Req Analwith CASE Tools .... ............. 1-16
Table 1-16. Errors Increased with Using CASE Tools 1-17
Table 1-17. Productivity Increased with Using CASETools ......... .................. 1-18
Table 1-18. Development Costs Increased Using CASETools ....... .................. 1-19
Table 1-19. Project Completion Time Increased UsingCASE Tools ...... ................ 1-20
xvi

AFIT/GSS/ENG/91D-07
Abstract
This study investigated whether using CASE tools
in the requirements analysis phase of software development
reduced the software coding errors attributable to
requirements analysis. A survey of the population gathered
data as to the current practices and efforts in the use of
CASE tools. The data was gathered in two groups: a control
group and a sample group. The data was analyzed by group and
in various combinations to obtain a greater understanding
into the population trends and tendencies. The results of
the research indicate that the Air Force does not use CASE
tools to any great extent. Also, error and cost data are
not tracked in a meaningful way either. The conclusion
drawn from this research shows that CASE tool use is still
in its infancy and needs to begin rapid growth in order to
speed up developments and reduce costs with the constanty
shrinking budget. The major recommendation by the author is
to perform a more detailed study of the population to
determine exactly where CASE tools are being used and where
improvements need to be made.
xvii

REDUCING SOFTWARE ERRORS
THROUGH THE USE OF COMPUTER-AIDED
SOFTWARE ENGINEERING (CASE) TOOLS
DURING REQUIREMENTS ANALYSIS
I. Introduction
Background
Lt Cmdr John Richard Frost stated in his 1984 thesis at
the Naval Postgraduate School:
In the late sixties it was realized that theimportance of software was rapidly exceeding thatof the hardware on which it was implemented. Thiswas manifested by sharply escalating softwarecosts while the cost of hardware underwentdramatic decreases. The reduced cost of computersincreased the demand for them and hence theirnumbers and the number and variety of applicationsin which they were used also increased. There wasa growing demand for the ability to convertexisting applications software to make itexecutable on the newer, more powerful, and lessexpensive hardware. The complexity and size ofnew applications also increased significantly withcorresponding increases in the complexity and sizeof the software need to support them. This, inturn, led to a far greater demand for softwarethan the existing software industry could supply.(Frost, 1984:7)
Today, software users are demanding more power in lap-top
computers than the overall power of most early computers.
Software projects have become enormous and extremely
complex. "Simply put. the fundamental challenge facing
1-I

(Phillips, 1989:64). To assist the future software engineer
in managing this growing complexity, today's engineers are
creating automated tools to simplify the software management
and development process. These products are called
Computer-Aided Software Engineering (CASE) tools.
CASE tools can be used throughout the software
lifecycle from conception to retirement. The research
documented in this thesis centers on the use of CASE in the
requirements analysis phase.
General Issue
Analysis of a problem is never easy. Finding errors
early in the design process can save thousands, if not
millions, of dollars (Bergland and others, 1990:8). CASE
tools give engineers more freedom to try various methods of
problem analysis in a shorter period of time. With them,
engineers can also implement requirements changes faster and
with less cost.
The federal government, specifically the Department of
Defense (DoD), now needs, more than ever, to save money.
CASE tools can provide a great deal of savings now. As a
team of American Telephone and Telegraph (AT&T) software
engineers pointed out:
Our goal in applying new and existing technologiesis to mechanize much of the front-end process andthus reduce development costs and improve productquality (Bergland and others, 1990:7)
1-2
AT&T has become one of the leaders in CASE tool use in the
civilian community. DoD should embrace the ideas and
concepts of AT&T by implementing efforts to reduce cost and
speed up production. Software development will cost the
Department of Defense (DoD) over $30 billion in FY 91.
(Ferens, 1991:4) This cost translates to over ten percent
of the total DoD budget for the year. As software
acquisition grows, the DoD must find and use more cost
effective ways to develop new software.
Speci fic Problem
Software development includes requirements analysis,
design, coding, testing, and follow-on maintenance. This
research examined the requirements analysis phase of
software development. Specifically, the research, described
in this thesis, focused first on the problem of time and
money lost as a result of errors made during requirements
analysis conducted without the assistance of Computer-Aided
Software Engineering (CASE) tools and second on the effects
tool use can have in reducing these losses.
l1ypothesis and Investigative Questions
The hypothesis for the thesis research is that CASE
tool use during requirements analysis correlates directly to
a reduction of errors attributable to poor requirements
analysis, thereby reducing deficiency and/or error
1-3

correction in later stages of a project. This hypothesis
will be supported by answering the following questions:
1. What percentage of DoD software developers use CASE
tools during the requirements analysis phase of project
development? What percentage do not use CASE tools?
2. For what reasons did agencies choose to use CASE tools
or not to use CASE tools?
3. What was the project size (lines of code, cost)? Was
project size a factor in deciding whether or not to use CASE
tools on the project?
4. What were the initial costs of using the tools? Follow-
on or recurring costs?
5. What cost savings were found by using CASE tools over
not using CASE tools (including the recovery of the initial
costs)?
6. What errors were found? When? Did using CASE tools
reduce the number of errors?
Scope of Research
This thesis research covered the use of CASE tools
during the requirements analysis phase of a software
development project. Which agencies use CASE tools and why
users chose to use the tools were questions analyzed.
Agencies that chose not to use tools and their reasons or
lack thereof were examined. Whether project size and/or
cost plays a significant role in the choice to use or not to
1-4

use CASE tools was reviewed. A cost-benefit analysis on the
use of and non-use of CASE tools was performed. The
analysis included initial start-up costs, training,
recurring costs, savings from the use of tools, and recovery
of costs.
This analysis did not include the specific CASE tools
being used. To advocate one tool over another is not the
issue here. CASE tool use in later stages of the software
development process (i.e., design, coding, testing, and
maintenance) was not reviewed in any detail. These areas
were highlighted as necessary, however.
The next chapter reviews current literature on CASE
tools. The review concentrates on the major highlights of
CASE tool research and development. Chapter III reviews the
methodology used to perform the research (i.e., population
definition, data collection, etc.). Analysis of the
collected data is the focus of Chapter IV. Chapter V
summarizes findings and conclusions from the analysis.
Appendices A through I represent the survey instrument
development process and the data analysis calculations.
1-5

II. Literature Review
Introduction
Case tools are fast becoming the way to do business in
the software engineering field.
CASE techniques offer a unique opportunity todecrease the backlog of applications development.They also present an opportunity to increase thequality of systems being developed throughconsistent use of a standard methodologythroughout the life of the software. (Batt,1989:6)
Just as a :arpenter needs saws, hammers, drills, and planes,
the software engineer requires a tool box to make the job
easier and more creative. Soon, CASE tools will fill the
software engineer's toolbox. An understanding of the
requiremert fur CASE tools and their continued creation and
enhancement is needed before one can fully appreciate the
importance of CASE tools. This review is directed toward an
understanding of the software management problem, the
benefits derived from the use of CASE tools, USAF CASE tool
evaluation assistance, USAF CASE tool studies, and the
direction for future tool developments.
Software Manaqement Problems
A software engineer faces a myriad of obstacles and
challenges in managing current software projects.
Ccmplexity, requirements definition, and cost stand between
the engineer and successful completion of a project.
2-1
Today's complexity of software design is compares to
the complexity of building the Space Shuttle. Many software
projects "contain several million lines of code" (Bergland
and others, 1990:8). No longer will programs of 100 to
10,000 lines of code be adequate. In describing the tools
of software engineers, Barry Phillips states:
At the 1988 Design Automation Conference, AndyRappaport, president of Boston's TechnologyResearch Group, said that 30% of embedded systemsran over 75,000 lines of code - up from 14% in1985. What's more, the average size of programsthat run on internally developed target hardwarehas nearly tripled. (Phillips, 1989:65-66)
Also, learning how to develop the complex code can be an
education all by itself. Stuart Feil points out that:
... the original developer's tool kit for the OS/2operating system and its Presentations Manager GUIincluded 29 manuals, 130 disks and eight videocassettes. That's more than an evening's reading.(Feil, 1989:57)
Learning the OS/2 operating system is equivalent to an
advanced degree program.
As complex as software has become, software engineers
face other problems. Understanding the ideas of others is a
major stumbling block in requirements definition. AT&T
developers have found:
Traditionally, we have relied on natural-language(e.g. English) documentation as a communicationsmedium. However, when written in English,requirements are often ambiguous and open tomisinterpretation. (Bergland and others, 1990:9)
Human efforts in requirements translation lead to oversight
and costly re-engineering of many software projects.
2-2

High costs prohibit many new software projects or
updates to older software. Small firms do not have the
resources or funding needed to invest in a major software
build. Consequently, many small firms are forced to operate
with outdated software that is difficult to use and costly
to maintain; at times, they operate with no software at all.
Benefits of CASE Tools
Even though the software engineer faces many problems,
hope is on the horizon.
The combined effect of CASE tools and sounddevelopment principles should enable acceleratedsoftware development and lead to easing what hasbeen referred to as a "Software DevelopmentCrisis." (Batt, 1989:1)
CASE tools can help avoid the problems of today's software
projects in that the tools help do the job right the first
time. As part of a special Datamation/Price Waterhouse
opinion survey, Norman Statland comments:
The improvements will stem directly from thedecreased maintenance and increased productivitythat will accrue over the total life of a systemdeveloped with CASE tools. (Statland, 1989:32)
Benefits from CASE tool use also include improved up front
analysis, improved documentation, and increased
productivity.
Analysis of a problem is never an easy task. Finding
errors early in the design process saves thousands, if not
millions, of dollars (Bergland and others, 1990:8). With
CASE tools, engineers are given more freedom to try various
2-3
methods of problem analysis in a shorter period of time.
Engineers can also implement requirements changes quicker
and with less cost. An outcome of improved problem analysis
is detailed and accurate software documentation.
During a 1987 IEEE Conference on Software
Maintenance, a presenter was quoted as saying "... system
and project documentation are crucial for high quality
software development and maintenance" (Arthur and Krader,
1989:46). Proper software documentation improves accuracy
and decreases changes due to programmer error. Electronic
Design's Johna Till describes the tool AutoCode by saying
"With the new version, updated documentation can be
generated each time code is created" (Till, 1989:166).
Every time an engineer changes code, the changes are
automatically documented. The automated documentation keeps
paperwork up-to-date and reduces the guessing about what was
changed and why it was changed (Till, 1989:164). Improved
documentation speeds the production of actual software code.
Labor involved in actual software coding is one of the
highest expenses encountered in the development process.
With the use of CASE tools, best case reductions of over 99
percent in coding time have been found. A U.S. Department
of Justice attorney/advisor Lowell Denning estimates he
spent between 25 and 50 hours developing an introductory
screen without CASE tools. When he applied a CASE tool to
the same task, he reduced the development time to under
2-4

10 minutes (Feil, 1989:57). Reductions in development time
mean reductions in cost.
Air Force CASE Tool Evaluation Assistance
Many Air Force members are not aware of the valuable
help available when it comes to evaluating the potential of
perspective CASE tools. The Software Technology Support
Center (STSC), located at Hill AFB, Utah, has the mission
... to assist Air Force Software Development andSupport Activities (SDSAs) in the selection oftechnologies that improve the quality of theirsoftware products and increase the productivity oftheir efforts ( Grotzky and others, 1991:1).
The STSC consolidates Air Force support for selection and
evaluation of software environments, tools, and methods
(Grotzky and others, 1991:1). Because individual agencies
evaluate tools by different standards and do not share vital
data, agency software professionals do not look at similar
evaluations and thereby waste time and money. For these
reasons, the STSC developed a standard strategy called the
Test and Evaluation (T&E) Process to assist in consolidating
the evaluation process.
First, it gives software professionals theinformation required to make intelligent softwaretools selections. Second, it increases thecomparability, consistency, and repeatability ofsoftware tool evaluations. Third, it improves theefficiency of the software tool evaluation processthrough the reuse of prior evaluation guidelines,procedures, and data. Fourth, it facilitates thefeedback of customers requirements to softwaretool developers for future tool development(Grotzky and others, 1991:2).
2-5

Through this consolidation, all Air Force agencies can share
the information gained to reduce the cost of developing and
maintaining software and increase productivity.
In T&E process of the tool selection procedure, the
STSC set up six phases: analysis, assessment, evaluation
guidance, detailed evaluation, recommendation, and selection
(Grotzky and others, 1991:2-3). This sequence narrows the
field of tools being evaluated and improves the evaluation.
In the analysis phase, CASE tools available in one
domain are identified and a Long List of Tools is generated.
As a part of the analysis, characteristics (both quality and
functional) for the domain in question are identified.
Included in the identification are the Air Force essential
characteristics of support of real-time activities and
support of design teams (Grotzky and others, 1991:3, 16).
The tool is then classified into its particular domain(s)
(in this case, requirements analysis). Finally, a Short
List of tocls containing Air Force essential characteristics
is generated. The analysis phase of the process is
completed by STSC personnel with inputs from academia, Air
Force agencies, and industry (Grotzky and others, 1991:3).
As a part of the assessment phase, all of the identified
characteristics are reviewed to ensure that all of the
functional characteristics identified during analysis have
been met by the candidate tool. This assessment is
completed through a series of user interviews, informal
2-6

testing, documentation audits, and vendor surveys. Anyone
can assess a tool using STSC guidance. In using this form
of assessment, time and money can be saved. All assessments
are combined to build a prioritized list used in the
detailed evaluation phase (Grotzky and others, 1991:3).
The evaiuation guidance phase activities consist of
development of a test plan and characteristic evaluation
guidelines. These are incorporated in the "domain Test and
Evaluation Guideline (TEG)" (Grotzky and others, 1991:4).
The guidance is a coordinated effort by the STSC with inputs
from tool experts and users. The guidance put forth in
TEGs is used in the detailed evaluation phase as the
foundation for specific evaluation procedures (Grotzky and
others, 1991:4).
Quality, performance, and functionality are validated
during the detailed evaluation phase. A sample of the
quality attributes reviewed are found in Table 2-1 on Page
2-8. The functional characteristics examined include:
...information capture, methodology support, modelanalysis, requirements tracing, data repository,documentation, data import/export, and reusabilitysupport (Grotzky and others, 1991:13).
Development of tool-specific Test and Evaluation Procedures
(TEPs), executing the TEGs, recording results and updating
the characteristics, and furnishing a final report are among
the other activities performed in this phase. STSC-
supervised evaluators accomplish the detailed review. The
final report is compared to other reports during
2-7

recommendation and selection phases (Grotzky and others,
1991:4).
Table 2-1. Sample Software Quality Attributes Listing
Attributes Tool Products
Efficiency *
Integrity *
Reliability *
Survivability *
Usability *
Correctness *
Maintainability *
Verifiability
Expandability
Interoperability *
Reusability *
Transportability
(Grotzky and others, 1991:14)
Strengths and weaknesses are highlighted in the
evaluation phase. Activities include gathering customer-
defined weighting criteria, assigning characteristic weight
defaults, assessing the currency of the characteristic
listings, calculating tool scores based on the weightings,
adding the scores to the final reports, and producing a
comparison report based on information from the preceding
phases. This information is distributed at conferences, in
2-8

electronic media, tool reports, and in newsletters (Grotzky
and others, 1991:4).
Identifying and comparing tools that meet the needs of
a customer are produced in the selection phase. The final
selection of a tool is the responsibility of the customer.
The STSC is there as an advisor only.
As time has passed, the STSC has improved the T&G
process. At the core of the STSC's assistance process is
the Software Tool Evaluation Model (STEM) which includes:
a. Tool Domainb. Tool Characteristics
1) Air Force Essential Characteristics2) Default Weights
c. Test and Evaluation Guidelines (TEG)(Grotzky and others, 1991:6)
By using this model, the STSC and its customers can exchange
information. The exchange allows the customer to make a
better decision in tool selection and tool comparisons
because of the improved knowledge base (Grotzky and others,
1991:6). Improved knowledge at little or no cost cannot be
ignored.
United States Air Force Studies
The United States Air Force (USAF) has undertaken a
limited number of CASE tool feasibility studies. These
studies have been concentrated at a few strategic locations.
The Standard Systems Center (SSC) at Gunter AFB AL and Rome
Air Development Center (RADC) at Griffiss AFB NY are the
2-9

prime USAF locations for CASE tool initiatives. A review of
the major efforts at these sites follows.
Standard Systems Center Efforts. The SSC is the USAF
lead to provide an integrated CASE tool set. Within the
past six months, a Request for Proposal (RFP) for the
Integrated CASE (ICASE) tool set has been developed and is
scheduled for release in October 1991. The contract, when
awarded, is estimated to be worth as much as $25M. The RFP
for ICASE requests an integrated CASE tool set be provided
for Government use. The emphasis for the tool set is on
usability. Contract award for the ICASE contract is
scheduled for late 1991-early 1992 (Green, 1991:8).
Rome Air Development Center Efforts. RADC has a number
of studies on CASE tool feasibility ongoing. One such study
is the Requirements Engineering Testbed undertaken between
July 1985 and February 1986 (Anonymous, 1988:9).
Requirements Engineering Testbed. The purpose of
the study was "to define a ten-year research and development
program for RADC's Requirements Engineering Testbed (RET)"
(Anonymous, 1988:1). The primary goal behind the RET was to
provide the means by which Air Force users could test and
evaluate requirements for future systems. A secondary goal
was to promote new tool use by industry, as well as the Air
Force. RADC developed prototype tools for the user's
beginning capability. The prototype also aided in the
2-10

understanding and investigation of requirements and their
implications (Anonymous, 1988:1).
The problems which lead to the RET concept were
uncovered in an RADC-sponsored survey of mission and
acquisition specialists. From the survey, three major
problem areas surfaced:
(1) Requirements specifications were written forprocurers (acquisition engineers) and theirtechnical staffs. Thus mission users found themto be too technical and felt "shut out."
(2) Mission users and contractors found itdifficult to relate A-spec to B-spec (i.e. high-level system specification to softwarerequirements) because of the significant "gulf"between them.
(3) Contractors and mission users complained thattraceability could only be demonstrated manually,making it hard to assess requirements coverage.(Anonymous, 1988:5-6)
RADC studies deemed RET as a potential solution to the
problem. The complete RET model used two paths for optimal
results. The first path was to evolve tools and
methodologies like rapid prototyping for a quick benefit.
Path two was to explore high-risk formal requirements
language development (Anonymous, 1988:2).
The objective for the early testbed, in 1990, was to
provide a number of requirements engineering capabilities
via integrated tools. Meeting this objective would support
the first path needed for optimization. The target, for
1995, is to provide the integrated capability via a formal
2-11

requirements language. Doing this is part of path two
(Anonymous, 1988:17).
Work continues today to make the RET a viable step
toward solving the requirements definition problems faced by
the users and developers.
Direction of Future CASE Tool Development
With the creation of more and more CASE tools, the
future looks promising for improved software development.
Improved testing, industrialization of development, and
growing productivity through CASE tools await the future
software engineer.
Testing software will remain a difficult part of the
development cycle. To aid in reducing the difficulties
associated with testing, software developers need to look at
test-generation needs early in the design process. CASE
tools, such as T, are being used to automatically generate
test scenarios during coding. By developing and performing
the tests up front in the production process, the overall
result will be higher quality, lower costing projects
(Phillips, 1989:70-71).
Increased tool use should lead to an assembly line
approach of software development. Software factories, using
CASE tools, are being advocated as the future for software
engineering. In 1985, the Japanese software community began
the "Software Industrialized Generator and Maintenance Aids
(SIGMA) project" (Akima and Ooi, 1989:13). This project
2-12

will establish a specialized environment for software
engineering that will allow cheaper, faster, and larger
software projects to be produced. Through the use of CASE
tools, SIGMA will allow the mass production of software
without the time and expense of previous efforts (Akima and
Ooi, 1989:14). Industrialization allows for great
repositories of software which provide greater software
reuse possibilities. Also, the industrializaticn will make
the production and combining of CASE tools cheaper and
easier to use. Currently, as for any other new technoio y,
CASE tools are expensive. Many companies make tools which
are not readily compatible with another company's tools.
So, having a CASE toolkit has been impossible. But not in
the near future.
Increased productivity is another predicted outcome of
the CASE tool revolution. The Datamation/Price Waterhouse
opinion survey found the productivity prognosis bright over
the next five years.
Fifty-one percent of the organizations sampledpredict that CASE would spawn softwareproductivity jumps of up to 100% over the nextfive years. Productivity surges of up to 200% by1999 are foreseen by the 20% of the CASE userssurveyed. (Statland, 1989:33)
Productivity increases of this magnitude will make CASE
tools a part of every software engineer's development
process. Another forecast benefit of increased productivity
is the faster production and longer life of software
developed with CASE tools.
2-13

Fifty-four percent of the current CASE customersexpect to see much quicker software development by1993, as a result of the technology. The mostmarked difference between today and tomorrow comesin the maintenance area. A whopping 45% of thecompanies predict that within five years, longerprogram life would be the big plus of using CASEtools. (Statland, 1989:33)
Speeding up the delivery of and improving the
maintainability of new software would certainly reduce the
lifecycle costs dramatically. A new day in software
engineering is just around the corner.
Summary
CASE tools provide for improved software engineering
now and in the future. Currently, well-established methods
to manage the quality of the product are not beneficial
enough. Besides CASE tools, a well-defined software
engineering process must be in place for successful software
development. This process must be understood and practiced
by every member of the organization for quality and speed of
CASE tools to be realized. "Our goal in applying new and
existing technologies is to mechanize much of the front-end
process and thus reduce development costs and improve
product quality" (Bergland and others, 1990:7). Software
is the future and improving its quality while reducing costs
should be the objective of every software engineer.
As CASE tools become more prevalent in softwaredevelopment, further research is required toanswer how CASE will effect the products deliveredto the end-user. The end-user should be able tounderstand whether using CASE will produce ahigher quality .oftware product, whether the
2-14

product will be delivered in a timely manner, andmost important whethe: the product will solve hisbusiness needs and contribute to the corporatestrategy. (Batt, 1989:62)
No longer will customers tolerate the slow development of
the past, the discovery of errors after delivery, and the
unaffordable costs associated with software development
today. Using CASE tools will reduce, if not eliminate, many
of today's problems. Computer-Aided Software Engineering
tools may not "be the silver bullet that will save the
software industry," (Batt, 1989:2) But, when used w.-h a
well defined software engineering process, they are
definitely a future gold mine, not a passing fad.
2-15

III. Methodology
Introduction
The hypothesis underlying the research is that CASE
tool use during re airements analysis saves money and time
by reducing deficiency and/or error correction in later
stages of a project. Because data collection is vital to
any causal research, justification, instrumentation,
population and sample definitions, data collection plans,
statistical tests, and limitations were established from the
outset. A survey was determined to be the most appropriate
manner for gathering the data inexpensively from a large
population. A return of 50 percent of the surveys was
considered to be sufficient to provide an appropriate amount
of data for analysis (Emory, 1985:172-174). This chapter
addresses the aforementioned concerns.
Justification
CASE tool use was and still is an emerging technology
in software engineering. Only recently have CASE tool
studies, of any significant quantity, been initiated. Of
the published studies, the vast majority explored the
commercial marketplace. Government CASE tool studies are
virtually non-existent. The number of government agencies
using tools is growing, but many agencies remain skeptical
about CASE tools and their benefits. This research should
bridge a pnrtion of the believability gap.
3-1

Instrument
Surveying the population to obtain data was the most
expeditious way in which to collect data without direct
experimentation. Therefore, the survey instrument
development was vital from the start.
The survey originally contained 29 pertinent and
unbiased questions, all of which were designed to answer the
research questions supporting the hypothesis. These
questions were eventually pared down to 20 by elimn.ting
redundancy and by combining related questions.
The questions were reviewed by AFIT/EN software
engineering experts to ensure the questions were applicable
for survey use. Before sending the surveys for approval, a
validity check was performed to ensure that the survey
instrument would not invalidate the conclusions drawn on the
data collected. The questions and survey instrument were
reviewed by the AFIT/EN advisor and members of the Graduate
Software Systems Management Program at AFIT.
After instrument validation and advisor approval, the
draft instrument, contained in Appendix A, was sent to
AFIT/XP for approval. AFIT/XP then forwarded the survey
package to the USAF Manpower and Personnel Center for
approval. HQ AFMPC approved the survey with modifications
on 20 May 91. The approval letter, outlining the changes,
is contained in Appendix B. The final survey instrument
contained 22 questions. The final survey package, including
cover letter, the Privacy Act Statement, and the final
3-2

survey instrument, is presented in Appendix C.
Population/Sample
The population consists of United States Air Force
agencies and the personnel in those organizations who
develop software, along with a control group (selected from
the same population) of personnel being trained to develop
software using approved software engineering practices. The
population was selected through information gathered from
the General Services Administration's Federal Software
Management Support Center's database of government CASE tool
users, Air Force Communications Command's (AFCC) Computer
Systems Division (CSD), and the United States Air Force
(USAF) Software Technology Support Center (STSC). In this
group, a point-of-contact was identified in the various
agencies of the population. Through these points-of-
contact, mail surveys were distributed, using a judgmental
process, to persons managing software projects. These
people tended to work with a given project over more than
one phase of development and should have had a good
perspective on the effects, or lack thereof, that CASE tools
have had on a project.
The population, from which the sample and control
groups were selected, was approximately 20,000 (varies due
to changes in the development agencies). A sample size of
150 was determined to be adequate to obtain 67 responses.
The 67 responses were required to have a confidence interval
3-3

of 90 per cent plus or minus 10 per cent. This was derived
from the equation below:
n(z 2 )p(1-p)n = zIPIP
(N-1)(d 2)+(z2)p(1-p)
where
n = sample size
N = 20,000 (population size)
p = 0.5 (maximum sample size factor)
d = 0.1 (desired tolerance)
z = 1.645 (factor of assurance for 90percent confidence interval)
A judgment sampling of the agencies was taken. The
agencies surveyed include HQ Strategic Air Command, HQ
Tactical Air Command and subordinate units to be determined
by headquarters personnel, Air Force Communications Command
(AFCC) CSD, AFCC Command and Control Systems Center, Air
Force System Command's Aeronautical Systems Division, Air
Force Logistics Command's Air Logistics Centers in San
Antonio TX, Oklahoma City OK, and Sacramento CA, and Air
Force Space Command's Space and Warning Systems Center.
The control group consisted of students from two
resident Professional Continuing Education courses at AFIT.
The two courses were WCSE 471 - Software Engineering
Concepts and WCSE 472 - Specification of Software Systems.
These courses teach the skills needed to properly develop
requirements and software specifications. A knowledge of
software engineering practices, including the use of CASE
3-4

tools, was assumed by the researcher. The students were
surveyed on the first day of the class to minimize the bias
of knowledge gained during the course of study. A total of
six classes and 91 students were surveyed to develop the
control group database.
Data Collection Plan
Data collection consisted of mail surveys. The mail
survey focused on statistical data: costs, size, errors,
etc. This data was analyzed according to strict statistical
tests of categorical data. The tests include chi-squared
distribution, contingency tables, and frequency
distributions of the population and control group responses
to assess any relationships or differences (Devore,
1987:556-591). Tests were set up with the assistance of
AFIT/EN Math Department personnel. The results of the tests
and the conclusions drawn from these tests were reviewed by
AFIT/EN Math and Software personnel.
Statistical Tests
The statistical tests used to analyze the data included
frequency distribution analysis, chi-square distributions,
and contingency table comparison of the population and
control groups. The actual tests performed are described in
detail in Chapter 4.
Limitations
The survey was limited to Continental United States
3-5

(CONUS)-based USAF agencies only. Overseas USAF agencies
were not considered due to their limited software
development capabilities and missions. Limited time for
survey and analysis of data forced the elimination of non-
USAF agencies. Individual CASE tools were not identified
nor reviewed for their usability.
Summary
Justifying efforts is a common practice in research.
For the research presented in this thesis to succeed,
defining the population, sample, and control size were
critical. The researcher needed to know the what, how,
when, and where of the data and the data collection process
to develop useful questions and instrumentation. Using the
appropriate statistical tests made the research defendable
against scrutiny and review. The data analysis, including
the equations used, is documented in Chapter 4.
3-6

IV. Data Analysis
Introduction
In this chapter, the focus is on making sense of the
data gathered during the course of the research. To gain an
understanding of the data, both the control group and sample
data sets were statistically analyzed, singularly and in
combination. Appendices D and F contain the raw data on the
control and population samples, respectively. Appendices E,
G, H, and I contain the statistical analyses results
mentioned above. All analyses are based on meeting a 90
percent confidence interval.
Control Group Findings
Ninety-one cases were used in defining the control
group. Not all survey respondents completed every question.
The number of questions left unanswered caused the
confidence in the data to fall below a 90 percent confidence
level, making valid statistical analysis impractical. These
questions will be discussed as required.
Frequency Distributions. By taking frequency
distributions for each survey question, the validity of the
data (meeting the 90 percent confidence interval criteria)
can be assessed. Because respondents could provide more
than one answer, questions 3, 9, and 18 are not analyzed
with frequency distributions. Instead, the totals are
displayed in table format.
4-1

Rank. Ninety of 91 respondents answered the
question concerning rank. As Figure E-1 shows, a majority
of the respondents fell into the 01 to 03 and CS-10 to GS-12
categories. This characteristic is consistent with the
working levels of most Air Force units.
Programming Experience. In Figure E-2, 90 of 91
respondents answered the question concerning software
programming experience. The respondents were normally
distributed over the five categories. Three to 6 years of
experience was the most common (at 30.8 percent) response.
TYpe of Systems Developed. Respondents could
provide multiple answers about the type of systems developed
in their offices, depending on the mission of their
organization. 104 responses were obtained. Command and
control, avionics, management information, and mission
planning systems were the most widely developed software
systems.
Table 4-1. Systems Under Development
No Response 6
Command and Control 20
Intelligence 5
Avionics 17
Management Information 14
Other Embedded/Real-Time 19
Other 23
4-2

Number of Systems Being Developed. Figure E-3
shows that 5 of the 91 respondents did not answer the
question covering how systems their offices currently had
under development. A majority (34.1 percent) of the
surveyed offices develop 1 to 2 systems at present. Twenty-
one of the offices are developing 10 or more systems.
Seventeen offices have no systems development underway.
These offices develop software policy, provide maintenance,
or test software.
Cost of Systems Being Developed. As Figure E-4
shows, the clear majority of systems under development cost
$1 million or more. One fact stood out in the answers
concerning average cost of development: many people are not
aware of the costs of systems their offices are developing.
System Lines of Code. Again, the responses held
consistent with the vast majority of major systems
development. As shown in Figure E-5, 33 percent of the
systems being developed contained 100,000 or more lines of
code.
Up until this point in the analysis, the results were
used to provide an insight into the respondents'
backgrounds, their organizations (in general), and system
development activities. From this point on, the focus will
be on CASE tool use by personnel and organizations.
CASE Tool Use by Organizations. Sixteen of the 91
people, compared in Figure E-6, surveyed did not respond as
4-3
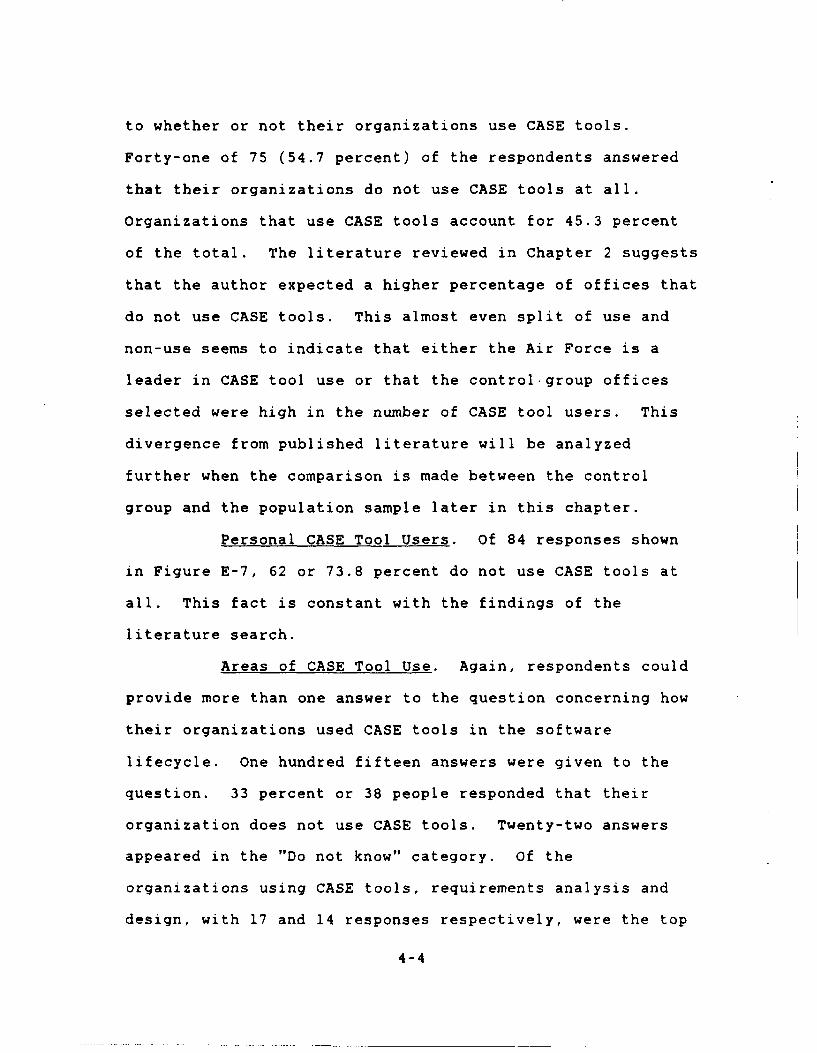
to whether or not their organizations use CASE tools.
Forty-one of 75 (54.7 percent) of the respondents answered
that their organizations do not use CASE tools at all.
Organizations that use CASE tools account for 45.3 percent
of the total. The literature reviewed in Chapter 2 suggests
that the author expected a higher percentage of offices that
do not use CASE tools. This almost even split of use and
non-use seems to indicate that either the Air Force is a
leader in CASE tool use or that the control-group offices
selected were high in the number of CASE tool users. This
divergence from published literature will be analyzed
further when the comparison is made between the control
group and the population sample later in this chapter.
Personal CASE Tool Users. Of 84 responses shown
in Figure E-7, 62 or 73.8 percent do not use CASE tools at
all. This fact is constant with the findings of the
literature search.
Areas of CASE Tool Use. Again, respondents could
provide more than one answer to the question concerning how
their organizations used CASE tools in the software
lifecycle. One hundred fifteen answers were given to the
question. 33 percent or 38 people responded that their
organization does not use CASE tools. Twenty-two answers
appeared in the "Do not know" category. Of the
organizations using CASE tools, requirements analysis and
design, with 17 and 14 responses respectively, were the top
4-4

areas of use. This is steady with the findings of the
literature reviewed. As Chapter 2 points out, lower CASE
tools are just being developed for coding, testing, and
maintenance. The upper CASE tools for requirements analysis
and design are being used regularly by software development
organizations (Bartow and Key, 1991:3-4). Twenty-three
persons did not respond at all to the question. This number
was not included in the 115 mentioned earlier in the
paragraph.
Table 4-2. Areas of CASE Tool Use
No Response 23
Requirements Analysis 17
Design 14
Coding 8
Testing 9
Maintenance 7
None 38
Do Not Know 22
Requirements analysis garnered only 17 total responses.
This low number indicates that the probability exists that
CASE tool use for requirements analysis in the USAF is low,
as was expected by the author.
Initial CASE Tool Cost. Figure E-8 shows the
breakout of responses received concerning initial costs of
4-5

CASE tool use. Forty-three people, or 47.3 percent of the
responses, indicated that the initial costs of CASE tool use
were unknown. Only 13 respondents could provide a genuine
categorical answer. Of the 15 responses in the $0-999
category, 12 answers could be traced back to where the
respondents had signified that their organization did not
use CASE tools. Also, the 20 "no" responses could be
attributed to no organizational use of CASE tools.
Recurring CASE Tool Costs. The numbers and
relationships described above are almost repeatable in this
section. The distribution in Figure E-9 shows that of the
22 "no" responses and 17 "$0-999" category responses, all
but 3 of the 39 were due to no organizational use of CASE
tools. Four of the 12 persons who could identify initial
cost categories did not know the recurring cost of CASE tool
use. 48.4 percent, or 48, of the respondents did not answer
for either because they lacked of knowledge or did not use
CASE tools.
First Exposure to CASE Tools. Nineteen persons
gave no response concerning their first exposure to CASE
tools. The remaining 72 responses displayed in Figure E-10,
broke out in this fashion: the majority learned from
magazines/journals and the job, 23 and 21 respectively; 16
persons first learned of CASE tools in school; the remaining
12 persons were first introduced to CASE tools from other
sources.
4-6

Areas Lacking Enough Data for Statistical
Significance. As presented in Figures E-21 through E-19, a
lack of response, indicated in the "no" response categories,
by the control group made statistical evaluation of areas
identified in Table 4-3 impractical. Respondents gave no
response primarily because of organization non-use of CASE
tools. Another reason for no answer was that the questions
were ignored.
Table 4-3. Areas of Impractical Statistical Evaluation
CASE Tool Experience Levels
Requirements Analysis Errors/KLOC without CASE Tool Use
Total Error Percentage Attributable to RequirementsAnalysis without CASE Tool Use
Requirements Analysis Errors/KLOC with CASE Tool Use
Total Error Percentage Attributable to RequirementsAnalysis with CASE Tool Use
CASE Tool Use Increased Requirements Analysis Error Rates
CASE Tool Use Increased Productivity
CASE Tool Use Increased Development Costs
CASE Tool Use Increased Project Completion Time
Sample Group Findings
The sample group was defined by 67 total responses. Again,
not all respondents completed every question. Questions
which are statistically insignificant (well below a 90
percent confidence interval) are identified and the
4-7

implications discussed.
Frequency Distributions. As was the case with the
control group, the sample group responses -were reviewed
through the use of frequency distribution charts. This
review was undertaken to insure the validity of the data
being analyzed and to gain an insight into the tendencies of
the sample group.
Rank. All 67 respondents provided answers
-oncerning rank. Figure G-1 shows that 37 (55.2 percent) of
the respondents were in the 01-03 category. The
concentration of the response is consistent with that of the
control group.
Programming Experience. As with rank, responses
were received from all 67 persons concerning their
programming experience. Seventeen respondents had software
experience levels of 10 or more years. 67.8 percent (46
persons) had at least 3 years experience. The distribution
of responses in contained in Figure G-2.
Type of Systems-Developed. Eighty responses were
obtained to this multiple answer category. As Table 4-4 on
the next page shows, management information and command and
control systems were the systems found to be under
development most often.
Number of Systems Being Developed. Figure G-3
indicates that all of the sample group answered the question
pertaining to the number of systems under development. 55.2
4-8

Table 4-4. Systems Under Development
No response 5
Command and Control 19
Intelligence 10
Avionics 11
Management Information 22
Other Embedded/Real-Time 6
Other 7
percent of the respondents indicated that their office had 1
to 2 systems in development at the present time. 15 offices
surveyed have no systems under development. Once again,
these offices develop software policy, provide maintenance,
or test software.
Cost of Systems Being Developed. As was the case
with the control group, the cost of a majority of the
systems under development in the sample group is over $1
million (19 responses). In Figure G-4, one can see that 13
persons marked that their costs are $0-999. This fact
strongly suggests that two of the offices in the previous
category do develop systems . However these offices are
between development projects.
System Lines of Code. In the lines of code
category, 66 of 67 persons responded with respect to system
lines of code (LOC) for development projects. Although this
is lower than the 90 percent confidence interval, meaningful
4-9

conclusions can be drawn from the data. Twenty-nine
respondents, or 43.3 percent, indicated that their projects
produced 10,000 to 99,999 LOC, as depicted in Figure G-5.
This ranked first in this category as compared to the
control group category where systems of over 1 million LOC
were more prevalent.
As in the previous section, the preceding six
paragraphs provided a background into the survey
respondents. The remainder of this section is targeted at
gaining an insight into CASE tool use in the sample group.
CASE Tool Use By Organizations. Figure G-6
exhibits the results of the survey responses on case tool
use by organizations. As with the control group, the
respondents in the sample group indicated that more than 50
percent of the surveyed organizations use CASE tools. Again
this percentage was greater than my initial supposition had
anticipated the percentage to be. The 52.2 percent of
organizations that use CASE tools is even higher than the
control group's 45.3 percent. The use of CASE tools in
United States Air Force software development organizations
is escalating or the offices surveyed had a higher CASE use
rate as was indicated in the control group on page 4-4.
Personal CASE Tool Use. Of the 67 persons
responding in this category (Figure G-7), 48 persons (71.6
percent) do not personally use CASE tools. This is
consistent with the control group's 73.8 percent lack of
4-10

personal CASE tool use.
Areas of CASE Tool Use. The respondents could
provide multiple answers pertaining to where their
organizations used CASE tools in the software development
lifecycle. A total of 139 answers were received in this
category. 32 persons responded that their organization did
not use CASE tools. 8 persons failed to answer the question
and 6 did not know where CASE tools were used in their
organizations. Of the remaining 21 respondents, they
accounted for the 93 remaining answers in the category.
Looking at this factor, one can find the indication that
when an organization uses CASE tools, tools are used in more
than one part of the software development lifecycle. The
breakout of all responses in this category can be seen in
Table 4-5 on the next page. Requirements analysis received
only 16 responses in the sample group. From this total, it
is clear that CASE tool use in the area of requirements
analysis is low in the USAF.
First Exposure to CASE Tools. 63 of 67 survey
respondents answered the question concerning their first
exposure to CASE tools. Again, this level is less thai, the
90 percent confidence interval, but significant enough to
provide a meaningful trend. Of the 63 responses in this
category, job and school represented 67.1 percent (45 total)
of the answers. This is different than the control group
where job and magazines and journals took the majority
4-11

Table 4-5. Areas of CASE Tool Use
No Response 9
Requirements Analysis 16
Design 20
Coding 14
Testing 8
Maintenance 16
None 32
Do Not Know 6
responses were analyzed using frequency distribution charts.
This combining of data allowed a better view of the software
requirements/development population as a whole and opened to
share. Figure G-10 presents the sample group responses.
Areas Lacking EnouQh Data for Statistical
Sianificance. The number of respondents who failed to
respond ( tabulated under "no response" ) made a number of
categories made statistical analysis meaningless. Figures
G-8, G-9, and G-11 to G-19 exhibit the results of the survey
responses. Table 4-6, on page 4-13, shows the categories
where meaningful statistical analysis is unrealistic.
Combined Analysis of Groups
Frequency Distributions. Combining the control group
and sample group data to look at the population as a whole
is the purpose of this section of the chapter. 158 survey
4-12

Table 4-6. Areas of Impractical Statistical Evaluation
Initial Cost of CASE Tool Use
Recurring Cost of CASE Tool Use
Length Person Has Used CASE Tools
Requirements Analysis Errors/KLOC without CASE Tool Use
Total Error Percentage Attributable to RequirementsAnalysis without CASE Tool Use
Requirements Analysis Error/KLOC with CASE Tool Use
Total Error Percentage Attributable to RequirementsAnalysis with CASE Tool Use
CASE Tool Use Increased Requirements Analysis Error Rates
CASE Tool Use Increased Productivity
CASE Tool Use Increased Development Costs
CASE Tool Use Increased Project Completion Times
analysis, many areas in which it was previously impractical
to do so. Questions 3, 9, and 18 will not De reviewed in
this section because reviewing them would be repetitious.
With this data combination, 17 of 19 areas of review can be
analyzed to the needed population understanding.
Rank. As Figure G-1 shows, the 01 to 03 category
was the area in which most respondents fell over any other
category. Sixty-seven, or 42.4 percent, of the respondents
were in this category. GS-10 to GS-12 was the second
highest area of respondents with 29.7 percent (47
respondents) marking this category. With the majority of
the respondents and the majority of Air Force software
4-13

personnel working levels in these two categories, it can be
determined that the survey was distributed to the
appropriate people. In the rank and grade data, no
anomalies were found.
Programming Experience. In reviewing the
experience data, the area of 3 to 6 years received the
highest response rate. This is consistent with the
experience levels of the categories focused on in the rank
data and was consistent with the author's expected findings.
In looking at Figure H-2, one can note the almost perfect
normal distribution of the responses in the chart.
Number of Systems Being Developed. In a majority
of the respondents' offices, there are only 1 to 2 systems
being developed at survey completion time. In Figure H-3,
one can notice that 68 responses were received in this area
as compared to the next highest response area which was no
systems under development. Only 33.5 percent of the
respondents indicted that their organizations had 3 or more
systems in development at the time of survey completion.
The number of large software development organizations in
the Air Force is not as high as the 50 percent the author
anticipated during this effort.
Cost of Systems Being Developed. Ninety-one of
the 158 responses (Figure H-4) indicated that the systems
under development in their organizations had costs of over
$100K. Of these 91, 61 persons marked that system costs
4-14
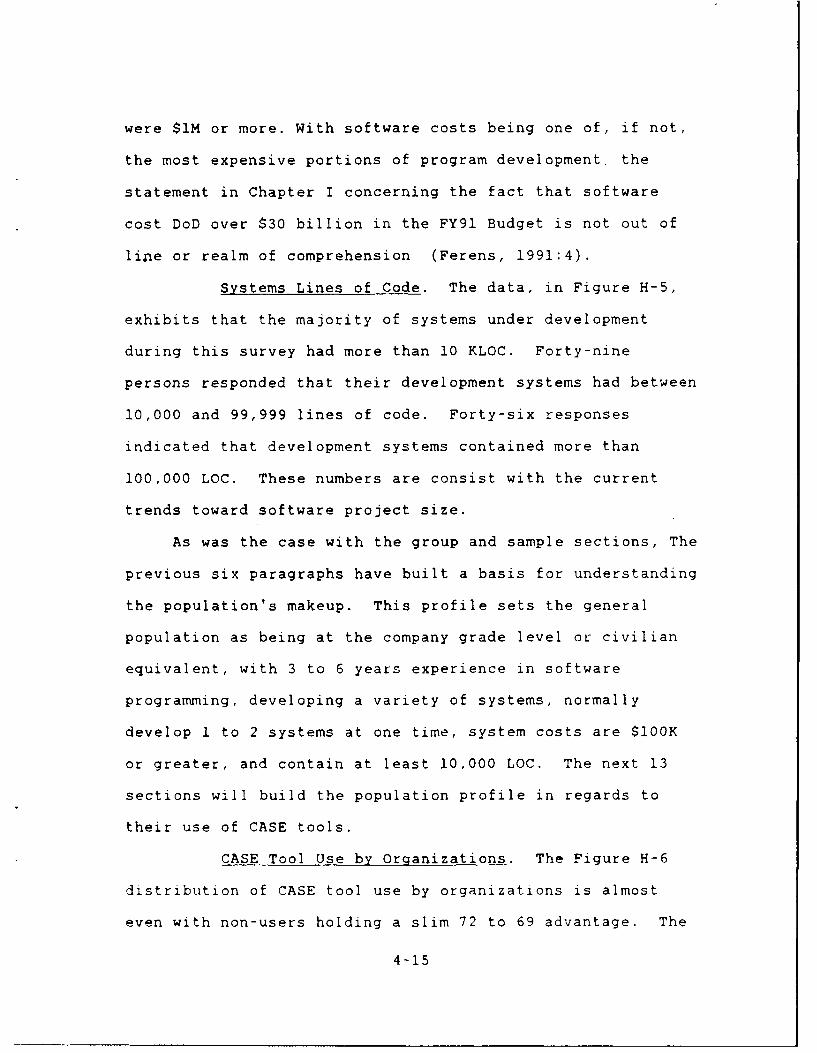
were $1M or more. With software costs being one of, if not,
the most expensive portions of program development the
statement in Chapter I concerning the fact that software
cost DoD over $30 billion in the FY91 Budget is not out of
line or realm of comprehension (Ferens, 1991:4).
Systems Lines of Code. The data, in Figure H-5,
exhibits that the majority of systems under development
during this survey had more than 10 KLOC. Forty-nine
persons responded that their development systems had between
10,000 and 99,999 lines of code. Forty-six responses
indicated that development systems contained more than
100,000 LOC. These numbers are consist with the current
trends toward software project size.
As was the case with the group and sample sections, The
previous six paragraphs have built a basis for understanding
the population's makeup. This profile sets the general
population as being at the company grade level or civilian
equivalent, with 3 to 6 years experience in software
programming, developing a variety of systems, normally
develop 1 to 2 systems at one time, system costs are $100K
or greater, and contain at least 10,000 LOC. The next 13
sections will build the population profile in regards to
their use of CASE tools.
CASE Tool Use by Organizations. The Figure H-6
distribution of CASE tool use by organizations is almost
even with non-users holding a slim 72 to 69 advantage. The
4-15

author, through reading, experience, and research, expected
only 25 percent of the organizations to use CASE tools.
This trend is considered significant because Air Force
organizations are using or have the ability to use CASE
tools in their software lifecycle.
Personal CASE Tool Users. The trend exhibited in
Figure H-7 signifies that even though the organizations are
using CASE tools, the individuals are not doing so. Sixty-
nine percent (109 respondents) marked that they do not use
CASE tools. This fact, in connection with the previous
paragraph, lends credence to the assumption that
organizations have the tools available but the people are
not using them. Reasons for not using the tools could be:
too difficult to learn or understand; being set in one's
ways; afraid of using tools; no encouragement to use tools.
Initial CASE Tool Cost. Seventy-seven persons, or
48.7 percent, responded that they did not know the costs
associated with the acquisition of CASE tools for their
organizations. This high percentage, seen in Figure H-8, is
indicative of the fact that the organizations surveyed
either do not keep records of the costs or that the costs
are not known throughout the organization.
Recurring CASE Tool Costs. As was the situation
described in reference to initial cost, the same can be said
about the recurring CASE tool costs. Figure H-9 portrays
the identical responses and percentages for those persons
4-16

not knowing the costs. The reasons behind this trend are
the same ones stated previously.
First Exposure to CASE Tools. The persons
surveyed had a wide range of ways in which they were exposed
to CASE tools. On the job garnered 45 responses while
school and magazines and journals gained 37 and 34 responses
respectively. Figure H-10 displays the data. Other sources
were marked by 17 persons without any indications as to what
those sources could be. With this information, one can
extrapolate that CASE tools are becoming of increasing
interest to the software community on the whole.
Experience with CASE Tools. When the control and
sample groups were examined individually, this area of the
survey could not be reviewed because of the number of no
responses. However, by combining the data, an assessment of
the population's experience using CASE tools can be
inferred. With this data combination, Figure H-11 presents
the fact that experience levels for those surveyed is less
than 1 year. This factor is a result of the newness of CASE
tool technology.
Errors Attributable to Requirements Analysis
without CASE Tool Use. In this area, the 158 respondents
had a wide range of answers. But as shown in Figure H-12,
no response answers lead the pack with 82 (51.9 percent)
total. A majority of the no response answers are tracked to
organizations that do not use CASE tools. Of the remaining
4-17

responses, 31 persons indicated that less than 10
errors/KLOC were traceable to requirements analysis (RA), 20
indicated that 10 to 25 errors/KLOC were traceable to RA, 12
indicated that 26 to 50 errors/KLOC traceable to RA, 10
indicated that 51 to 100 errors/KLOC traceable to RA, and 3
indicated that over 100 errors/KLOC were traceable to RA.
Many comments from respondents indicated that their
organizations do not track errors to specific areas. These
comments demonstrate that Air Force software development
organizations need to track errors closer to find trends and
begin to eliminate problem areas.
Percentage of Total Errors Credited to
Requirements Analysis. As in the previous data set, no
responses from organizations not using CASE tools took the
majority share of responses. In Figure H-13, the percentage
of total errors credited to requirements analysis varied
form less than 5 percent to over 50 percent. This data set
suffers the same lack of error tracking problems that the
previous data set encountered.
In the next four paragraphs, insights into the
population's views of CASE tools were examined. The opinions
of the population surveyed can be expanded to the entire Ar
Force software development arena.
Errors Increased While Using CASE Tools.
Excluding the 78 "no" responses, the majority of the answers
(33 total) indicate that the population neither agree or
4-18

disagrees that error rates increased when CASE tools were
used in software development. Forty-three persons responded
that they either disagreed or strongly disagreed with the
statement as seen in Figure H-16. These disagreement leads
to the conclusion that the population understands the
purpose of CASE tools.
Productivity Increased Using CASE Tools. Forty
persons responded that they agreed or strongly agreed that
CASE tools increased productivity. Another 40 had no
opinion one way or another concerning the statement. In
Figure H-17, 76 answers are shown to have been no responses.
Development Costs Increased Using CASE Tools.
Figure H-18 displays the breakout of answers in this area of
analysis. Seventy-nine "no" responses can be found.
Twenty-five persons indicated they disagreed with the
statement. However, 52 persons indicated that they agree or
had no opinion that overall development costs increased
using CASE tools. This is opposite of the intended purpose
of CASE tools to lower development costs. Many respondents
did comment that their opinions were based on the first or
only project completed in their organization to use CASE
tools.
Project Completion Time Increased Using CASE
Tools. The opposite of the intended purpose of CASE tools
is displayed in this area of inquiry. In Figure H-19, "no"
responses tallied 79, disagreed tallied 33, and 44 agreed or
4-19

had no opinion that using CASE tools increased project
completion time. CASE tools are designed to reduce the time
needed to complete projects. A number of respondents stated
that the increased completion time was a result of learning
to use the tools or not knowing how to use the tools at all.
With the result in the last two areas, it is clear that more
education is needed into the purpose of CASE tools.
Areas Still Lacking Enough Data for Statistical
Significance. The areas of errors/KLOC while using CASE
tools and percentage of total errors credited to
requirements analysis using CASE tools, even afteL
combination of data from the two groups, did not have enough
data to be analyzed. The lack of response resulted from a
lack of data tracked in these areas, newness of CASE tools
to organizations, and non-tool use.
Contingency Tables and Chi-Square Calculations. The
contingency tables and Chi-Square calculations completed in
Appendix I are explained in this section. The tables and
calculations were completed using the SAS Statistical
program on the AFIT computer cluster. The conclusions drawn
from these statistics were confirmed with AFIT/EN
statistical experts. The formula and reasoning behind the
Chi-Square is as follows:
J Ell
4-20

Null hypothesis: The two variables are independent.
Alternative hypothesis: The two variables are dependent.
Rejection region: Reject H0 if Chi-Square exceeds the
tabulated critical value for a equals
alpha and df =(r-1)(c-1), where
r = number of rows in the table
c = the number of columns in the table (Ott, 1977:294-298).
The definition for independence is:
Two variables that have been categorized in a two-way table are independent if the probability thata measurement is classified into a given cell ofthe table is equal to the probability of beingclassified into that column. This must be truefor all cells of the table (Ott, 1977:295)
Independent is stating that the two groups are not related
in any way. Dependent is just the opposite; the control and
sample groups are related. Cells are possible responses.
The observed and expected cell counts and calculations for
each data source are contained in Appendix I, Tables I-i
through 1-19.
Proqramming Experience. The Chi-Square value
calculated for experience was 4.935. This number is less
than the critical value of 9.23635. Therefore, we accept
the null hypothesis that the control and sample groups are
independent.
Cost of Systems Being Developed. The Chi-Square
value is 26.415. Since this is greater than the critical
value of 9.23635, we reject the null hypothesis and
4-21

determine that the control and sample groups are dependent.
The cell values, or observations, have to muh variance too
to be acceptable.
System Lines of Code. The Chi-Square value of
14.856 is greater than the critical value of 9.23635.
Therefore, we reject the null hypothesis and can determine
that the control and sample groups are dependent.
CASE Tool Use by Organizations. The critical
value of 4.60517 is less than the Chi-Square value of
13.797. The null hypothesis is rejected and the control and
sample groups are deemed to be dependent.
Personal CASE Tool Use. The values for the
critical and Chi-Square number-1 are the same as the
organizational data. Therefoce, the same conclusions and
reasoning applies to this data.
First Exposure to CASE Tools. The Chi-Square
value for this data is 13.027. This exceeds the critical
value of 7.77944. The null hypothesis is rejected and the
control and sample groups are determined to be dependent.
Percentage of Errors Credited to Requirements
Analysis without CASE Tools. The critical value of 9.23635
is exceeded by the Chi-Square value of 23.499. Therefore,
the cell counts vary too much to be accurate and the null
hypothesis is rejected. Thus the control and sample groups
are dependent.
Areas of Uncertainty. The 11 areas not discussed
4-22

above had problems in the application of the Chi-Square
distribution. In all cases, cell counts less than 5 in at
least 30 percent of the cells made the validity of the Chi-
Square calculations questionable.
Summary
A great deal of data was collected and analyzed during
the course of this work. In many cases, the data lacked the
necessary numbers for a good insight into the population.
Answers were missing in many categories. On the whole,
however, the data did give us enough information to
determine if we can answer the research questions listed in
Chapter I. Chapter V will provide those answers and make
the conclusions and recommendations that have occurred as a
result of this research.
4-23

V. Conclusions and Recommendations
Introduction
This chapter wraps up the research into CASE tool use
in requirements analysis reducing software errors associated
with requirements analysis. Conclusions and answers to the
research questions, along with recommendations for future
research into this area, are provided.
Conclusions
Research Question #1. The question was: What
percentage of DoD software developers use CASE tools during
the requirements analysis phase of project development?
What percentage do not use CASE tools?
The data analyzed in Chapter IV indicates that the
majority of software developers do not use CASE tools in the
requirements analysis phase of project development. This is
consistent with the findings in the literature review. The
Air Force is just beginning to enter the CASE tool arena in
the requirements analysis area. Within the next 10 years,
one should see a dramatic increase in the number of CASE
tools users in all phases of software development; not just
requirements analysis.
Research Question #2. The question was: For what
reasons did agencies choose to use CASE tools or not to use
CASE tools?
5-1

The data reviewed indicated that the population was
still uncertain of using CASE tools. Many organizations did
not use the tools because of the expense involved, the lack
of understanding into how the tools worked or could help,
lack of training of personnel, or the total rejection of the
CASE tool ideas. Education into the benefits of CASE tools
is needed throughout the Air Force. The Software
Engineering Professional Continuing Education is a leading
effort in the education and more efforts like this are
needed to increase the CASE tool awareness of software
developers.
Research Question #3. The question was: What was the
project size (lines of code, Cost)? Was projec, siA a
factor in deciding whether or not to use CASE tools on the
Project?
The data analyzed portrayed that most software
development projects are of a significant size. This
coupled with the organizational and personal CASE tool use
levels leads one to conclude that the size of a project was
not a factor in determining whether or not to use CASE
tools. Personal or organizational preferences tend to be
the driving factor on CASE tool use.
Research Question #4. The question was: What were the
initial costs of using the tools? Follow-on or recurring
costs?
5-2

Not knowing the data was the significant finding in
this area. Organizations that use CASE tools do not
routinely track the costs of using the tools or do not give
the information out to everyone in the organization. A
better way of obtaining the data for future research efforts
must be found. Whether the budget offices are surveyed or
the data is requested in a different manner is up to future
researchers.
Research Question #5. The question was: What cost
savings were found by using CASE tools over not using CASE
tools (including the recovery of the initial costs)?
The conclusions drawn in this area are simple. Not
enough data is being tracked to make any assertions one way
or another in regards to costs. With the tightening of the
budget expected over the next few years, organizations need
to find areas in which they can track costs in order to
reduce them. Tracking of the costs of errors and the phase
of development in which they occurred will enable managers
to better understand where problem areas are. Knowing where
the problems are is the first step in reducing the costs of
errors.
Research Question #6. The question was: What errors
were found? When? Did using CASE tools reduce the number of
errors?
The results in this area are the same as the results
5-3

for research question #5. Not enough data is being tracked
to ascertain any significant findings in this area. The
opinion of the population is one that using CASE tools will
reduce errors, but so far the opinions have not been heeded
or acted upon.
Overall Conclusions
The software development organizations throughout the
Air Force are just getting on the CASE tool bandwagon. The
effects of CASE tools on projects has yet to be realized.
Efforts are underway to increase the use and awareness of
CASE tools. The upcoming release of the ICASE request for
proposal is a giant step toward getting CASE tools into the
hands of the developers. These integrated tools will enable
the developers to engineer projects with greater ease and
accuracy. These factors should manifest an overall savings
in time and money needed to develop and maintain software.
The Air Force Institute of Technology's Software Engineering
Professional Continuing Education program provides
developers the opportunity to learn the current methods and
practices of the ever-changing, ever-growing profession of
software engineering. By keeping up with the changes in the
software world, costs can be saved and even avoided.
Recommendations for Future Research
An enormous amount of possible research endeavors in
the area of CASE tools remain. With the Air Force just
5-4

releasing the RFP for an integrated CASE tool set, the case
study possibilities are numerous. Also, there are
possibilities for a more detailed analysis of the Air Force
as a whole using descriptive statistics.
The case study approach has two immediate
possibilities. First, review of a completed software
project, where CASE tools were used in a part of the
development, can be undertaken. This study could provide
insight into the effectiveness of early CASE tools, how and
where they were used, and lessons learned by the developing
organization. Second, tracking a new system being developed
using the new ICASE toolkit is a long range project. This4
study could provide feedback to the practicality of the
ICASE product and its implementation.
In completing a more detailed analysis of the Air
Force, one would need to build a much more thorough survey
instrument to obtain the required exacting data. By
collecting this type of data, more precise quantitative
statistics can be derived. With greater precision, one can
draw more specific conclusions about the Air Force
population as a whole and as various subgroups.
Summary
The thesis was undertaken in an effort to try and
provide insight and understanding into the current use of
CASE tools in the requirements analysis phase of software
5-5

development. Expectations were ones that the Air Force did
not have great efforts into this area of tool use, that data
tracking in these areas was lacking, and that improvements
were needed in all areas related to CASE tools. The
findings of the research supported the expectations of the
author. Much work still remains in the CASE tool arena. In
fact, the work is only beginning. CASE tools can and will
make tremendous differences in future software development
projects or efforts.
5-6

Appendix A: Initial Survey Package
Survey Approval Request
This appendix contains the information sent to HQ AFMPC
to request approval to distribute a survey.
Request Form
REQUEST FOR APPROVAL OF SURVEY
AFIT/GSS/ENG/91D-7Capt M. B. Key, Jr.
1. TITLE OF PLANNED SURVEY.
Computer-Aided Software Engineering (CASE) Tool UseSurvey
2. NAME AND ADDRESS OF INDIVIDUAL REQUESTING APPROVAL.
AFIT Survey Control Officer
AFIT/XPCapt Frisco-Foy (DSN 785-4219)Wright-Patterson AFB 45433-6583
3. STATEMENT OF SURVEY PROBLEM, SURVEY PURPOSE, PREFERRED
ADMINISTRATION TIME FRAME, AND JUSTIFICATION.
a. SURVEY PROBLEM.
Software projects have become enormous and extremelycomplex. To assist the future software engineer inmanaging this growing complexity, today's engineersare creating automated tools to simplify thesoftware management and development process. Theseproducts are called Computer-Aided SoftwareEngineering (CASE) tools. To be effective, CASEtools must be used from the beginning of thesoftware development process. No research has beenconducted to determine the impacts of using thesetools during requirements analysis for Air Forcesoftware development projects.
b. SURVEY PURPOSE.
The intent of this questionnaire is to gathersufficient data to determine whether using CASE
A-i

tools during requirements analysis reduces errors inthe overall development cycle and, ultimately, savemoney.
c. PREFERRED ADMINISTRATION TIME FRAME.
As soon as practical. Survey data must be collectedby 10 July 1990 for meaningful analysis.
d. JUSTIFICATION FOR SURVEY.
The information collected will aid in the analysisof CASE tools use during requirements analysis inthe Air Force. This research effort is also arequirement of the Master of Science thesis at theAir Force Institute of Technology.
4. HYPOTHESIS TO BE TESTED BY THE SURVEY.
CASE tool use during requirements analysis correlatesdirectly to a reduction of errors attributable to poorrequirements analysis resulting in a reduction ofdeficiency and/or error corrections in later stages of aproject.
5. POPULATION TO BE SURVEYED.
a. DESCRIPTION OF POPULATION TO INCLUDE MILITARY ANDCIVILIAN EMPLOYMENT STATUS AND BY WHOM EMPLOYED.
Software project managers and programmers (of allranks and grades) at all CONUS USAF softwaredevelopment organizations.
b. SIZE OF POPULATION.
Approximately 20,000.
6. DESCRIPTION AND SIZE OF SAMPLE SELECTED.
a. SAMPLE DESCRIPTION.
The sample will consist of individuals (bothmilitary and civilian) who work directly on USAFsoftware development projects.
b. SIZE OF SAMPLE AND IF INDIVIDUAL RESPONDEES AREKNOWN OR NOT KNOWN.
Sample size will be 600. The names of theindividual respondents are unknown.
A-2

7. METHOD OF SELECTION OF THE SAMPLE.
Simple random sample.
8. METHOD OF CONDUCTING THE SURVEY.
Questionnaires will be distributed to subjects throughtheir parent organization. Completed questionnaireswill be individually return mailed.
9. DESCRIPTION OF THE STATISTICAL ANALYSIS PLAN OR OTHERMETHOD OF EVALUATION.
Analysis of variances, testing of means, correlation ofpopulations, and basic averages and percentages.
10. METHOD OF TABULATING SURVEY RESULTS.
Computer tabulation of answer sheets and manual codingof write-in responses into categories and histogramanalysis and reporting.
11. USE AND DISPOSITION OF RESULTS.
The survey results will be basic inputs to a publishedAir Force Institute of Technology, School of Systemsand Logistics, student thesis. The results may bereleased to the public and the Air Force Human ResourcesLaboratory in compliance with AFR 12-30.
12. COMMAND APPROVAL CONTACT POINT.
Capt Brad AyersHq AFCC/PGSSScott AFB IIDSN 576-3642
13. Copy of the proposed survey questionnaire, includingPrivacy Act Statement, is attached.
A-3

Survey Cover Letter
LSG (Capt Key, DSN 785-8989)
CASE Tool Use Survey
USAF Software Managers and Developers
1. Please take the time to complete the attachedquestionnaire.
2. The survey measures Computer-Aided Software Engineering(CASE) tool use during the requirements analysis activitiesof software development in USAF software developmentagencies. The data gathered will become part of an AFITresearch project and may influence approaches torequirements analysis in future software projects. Yourindividual responses will be combined with others and willnot be attributed to you personally.
3. Your participation is completely voluntary, but wecertainly appreciate your help. For further information,contact Lt Col Lawlis at DSN 785-6027 or Capt Key at DSN785-8989.
JOHN W. SHISHOFF, Lt Col, USAF 4 AtchDirector, Graduate Programs 1. Privacy Act StatementSchool of Systems and Logistics 2. Questionnaire
3. Computer Answer Sheet4. Return Envelope
A-4

Privacy Act Form
PRIVACY ACT STATEMENT
In accordance with paragraph 8, AFR 12-35, the followinginformation is provided as required by the Privacy Act of1974:
a. Authority
(1) 10 U.S.C. 301, Departmental Regulations;and/cr
(2) 10 U.S.C. 8012, Secretary of the Air Force,Powers, Duties, Delegation by Compensation;and/or
(3) EO 9397, 22 Nov 43, Numbering System forFederal Accounts Relating to IndividualPersons; and/or
(4) DOD Instruction 1100.13, 17 Apr 68, Surveysof Department of Defense Personnel; and/or
(5) AFR 30-23, 22 Sep 76, Air Force PersonnelSurvey Program.
b. Principal Purposes. The survey is being conductedto collect information to be used in research aimedat illuminating and providing inputs to thesolution of problems of interest to the Air Forceand/or DOD.
c. Routine Uses. The survey data will be converted toinformation for use in research of managementrelated problems. Results of the research, basedon the data provided, will be included in writtenmaster's theses and may also be included inpublished articles, reports, or texts.Distribution of the results of the research, basedon the survey data, whether in written form orpresented orally, will be unlimited.
d. Participation in this survey is entirely voluntary.
e. No adverse action of any kind may be taken againstalhy individual who elects not to participate in anyor all of this survey.
A-5

Proposed Survey Instrument
Computer-Aided Software Engineering (CASE) Tool Use Survey
It is estimated that the United States Air Force (USAF)encountered $30 billion in software-related costs in FY1990. Of this amount, software development and maintenanceaccounted for about 80% of the total estimate. Cheaper andmore efficient ways of working with software must bedeveloped and used in order to reduce the skyrocketingdevelopment and maintenance expenditures.
CASE tools for requirements anal.sis are an importantpart of the CASE family. CASE tool use can improve theaccuracy and traceability of requirements throughout thesoftware development lifecycle. A proper requirementsanalysis can save thousands, if not millions of dollarsannually.
This survey is being sent to all CONUS USAF softwaredevelopment organizations. The survey is also being givento Professional Continuing Education students who attendcourses at the Air Force Institute of Technology. Pleaseanswer the questions based on your organization and theprograms that you are responsible for.
An, comments, suggestions, and explanations arewelcomed and encouraged. All inputs wxil be considered inthe final report. Address all inquiries to Capt Marvin Key,AFIT/LSG, Wright-Patterson AFB OH 45433 (DSN 785-8989).
Survey Completion
This survey contains 20 questions. For questions 1-16,circle the appropriate answer. For questions 17-20, writeyour answer after each question. Accompanying the survey,you will find a computer answer sheet. Please mark youranswers on the computer answer sheet after completing thesurvey.
A-6
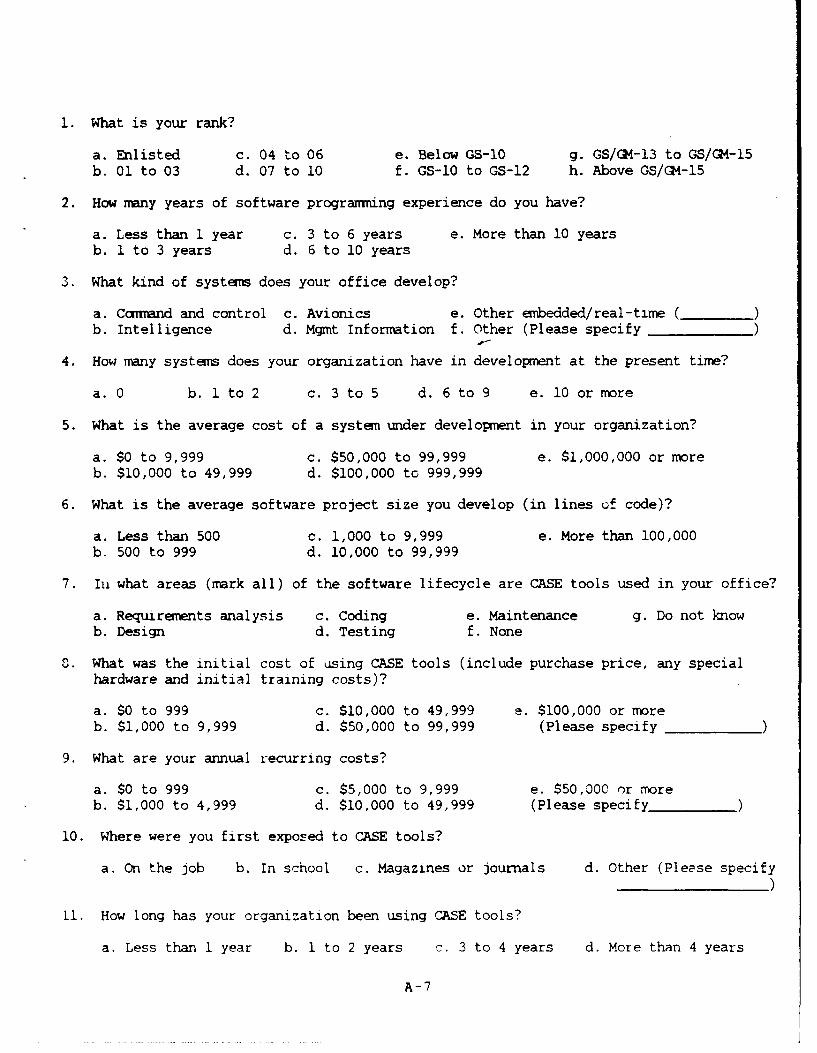
1. What is your rank?
a. Enlisted c. 04 to 06 e. Below GS-10 g. GS/GM-13 to GS/G4-15b. 01 to 03 d. 07 to 10 f. GS-10 to GS-12 h. Above GS/GM-15
2. How many years of software programming experience do you have?
a. Less than 1 year c. 3 to 6 years e. More than 10 yearsb. 1 to 3 years d. 6 to 10 years
3. What kind of systems does your office develop?
a. C mand and control c. Avionics e. Other embedded/real-time ( )
b. Intelligence d. Mgmt Information f. Other (Please specify )
4. How many systems does your organization have in development at the present time?
a. 0 b. 1 to 2 c. 3 to 5 d. 6 to 9 e. 10 or more
5. What is the average cost of a system under development in your organization?
a. $0 to 9,999 c. $50,000 to 99,999 e. $1,000,000 or moreb. $10,000 to 49,999 d. $100,000 to 999,999
6. What is the average software project size you develop (in lines of code)?
a. Less than 500 c. 1,000 to 9,999 e. More than 100,000b. 500 to 999 d. 10,000 to 99,999
7. In what areas (mark all) of the software lifecycle are CASE tools used in your office?
a. Requirements analysis c. Coding e. Maintenance g. Do not knowb. Design d. Testing f. None
0. What was the initial cost of using CASE tools (include purchase price, any specialhardware and initial training costs)?
a. $0 to 999 c. $10,000 to 49,999 e. $100,000 or moreb. $1,000 to 9,999 d. $50,000 to 99,999 (Please specify
9. What are your annual recurring costs?
a. $0 to 999 c. $5,000 to 9,999 e. $50,OOC or moreb. $1,000 to 4,999 d. $10,000 to 49,999 (Please specify
10. Where were you first exposed to CASE tools?
a. On the job b. In school c. Magazines or journals d. Other (Please specify
11. How long has your organization been using CASE tools?
a. Less than 1 year b. 1 to 2 years c. 3 to 4 years d. More than 4 years
A-7

12. Or your projects that do/did NOT use CASE tools, how many errors per thousand linesof code (KLOC) can be traced back to problems with requirements analysis (pleaseprovide as accurate a number as possible)?
a. Less than 10 errors/KLOC c. 26 to 50 errors/KLOC e. More than 100 errors/KLOCb. 10 to 25 errors/KLOC d. 51 to 100 errors/KLOC (Please specify _)
13. What percentage of total errors did requirements definition error account for in theprojects listed above?
a. Less than 5% c. 10 to 25% e. More than 50%b. 5 to 10% d. 25 to 50% (Please specify
14. On your projects that do/did use CASE tools, How many errors per thousand lines ofcode can be traced back to problem with requirements analysis (please provide asaccurate a number as possible for each project)?
a. Less than 10 errors/KLOC c. 26 to 50 errors/KLOC e. More than 100 errors/KLOCb. 10 to 25 errors/KLOC d. 51 to 100 errors/KLOC (Please specify _)
15. What percentage of total errors did requirements definition error account for in theprojects listed above?
a. Less than 5% c. 10 to 25% e. More than 50%b. 5 to 10% d. 25 to 50% (Please specify)
16. If used, why were CASE tools selected to be used for requirementsanalysis?
a. Tools made task easier d. Done as a test caseb. Analysis more accurate e. Not usedc. Directed to use tools f. Other (Please specify
Respond to the next four statements using the following scale:
Strongly disagree Disagree Neither Agree Strongly agree
A B C D E
17. Errors increased after using CASE tools.
18. Productivity increased when using CASE tools.
19. By using CASE tools, overall development costs increased.
20. Using CASE tools, time to complete the projects increased.
A-8

Appendix B: Air Force Manpower and Personnel Center Response
AFMPC/DPMYOS Letter, 20 May 91
DEPARTMENT OF THE AIR FORCE
HCAOOUARTENG AIR FORCE MILITARY PERSONNEL CENTERRANDOLPH AIR FORCE SASSTX 7180.-S0I
.- 01 DPI1YOS 'IM jj
s-- Survey Approval (Your Ltr, I May 1991)
AFIT/XPX
1. Capt Key's survey, "Computer-Aided Software Engineering(CASE) Tool Use," is approved, contingent upon the changes listedbelow. The Survey Control Number (USAF SCN) 91-32, and theexpiration date of 30 September 1991 must appear on the cover ofthe survey. Please have Capt Key forward a copy of the correctedsurvey to this office prior to administration.
2. The major changes apply to the population definition, sampleselection, and scope of the survey. The defined population needsto be much more select in order to get a sample of personnel whomight conceivably know what CASE tools are and who may have usedthem. The sample required for a 90%±l0 confidence interval, theallowable interval for thesis students, Is 67 for any populationover 6041. Capt key is authorized to survey 150 people. Thescope of the survey as currently written, i.e., from anorganizational perspective, would probably only be known by verysenior managers. Therefore, most of the rewording of thequestions is to help the individual relate their own experienceto CASE tools. Capt Key also needs to have very specificinstructions to the offices distributing the surveys in order toget a meaningful sample.
3. Changes to the survey instrument are:
a. In the cover letter, take out the instruction to include
name, rank, etc., on the answer sheet.
b. On the general instruction page, take out the first twoparagraphs. The survey respondent doesn't require thisinformation in order to complete the survey. Also, therespondent should be instructed to complete the survey using theanswer sheet. To complete the survey and then transfer responsesto tle answer shoot is not necessary.
c. On question 1, delete option 'd' because we do notrecommend surveying general officers. Also, enlisted personnelmay take offense at only having one response option. Recommend
grade group (El-E3, E4-E6, E7-E9) options be used for enlisted
personnel.
d. On question 4, change stem to read, "How many systems areyou developing at the present time?"
e. On question 5, change the stem to read, "What is theaverage cost of systems you develop?"
B-I

f. On question 6, change the stem to read, "What is the
average software project size you develop?"
g. After question 6, add two questions:
(1.) Does your organization use CASE tools? A. Yes B.No
(2.) Do you use CASE tools? A. Yes B. No
h. On question 7, change the stem to read, "in what area- ofthe software lifecycle do you use CASE tools?"
i. On questions 8 and 9, add response options for "I don'tknow."
j. On question ii, change stem to read, "How long have youbeen using CASE tools?"
k. On questions 12 and 14, insert the word "your" prior tothe word "projects."
I. At the end of the survey, tell the respondents how toreturn the survey.
4. If Capt Key has any questions about this review or therequired changes, he may contact Capt Burgess at DSN 487-5680.Again, please have Capt Key send us a copy of the final surveyprior tojdministration.
CHARLES H. HAMILTIOkN GM-13Chief, Personnel Survey Branch
B-2

After reviewing the comments and suggests from AFMPC/DPMYOS,
changes were made to the original survey instrument. The
final instrument is included in Appendix C.
B-3

Appendix C: Final Survey Package
Cover Letter
LSG (Capt Key, DSN 785-8989)
CASE Tool Use Survey
USAF Software Managers and Developers
1. Please take the time to complete the attachedquestionnaire.
2. Persons completing the questionnaire should be in aposition of managing one or more software developmentprojects, managing a subsystem of a larger project, ordeveloping specifications and code. The project can be anin-house development or a contracted effort. Alldevelopment efforts will be considered. Also, allexperience levels will be covered by the survey instrument.
3. The survey measures Computer-Aided Software Engineering(CASE) tool use during the requirements analysis activitiesof software development in USAF software developmentagencies. The data gathered will become part of an 7.FITresearch project and may influence approaches torequirements analysis in future software projects. Yourindividual responses will be combined with others and willnot be attributed to you personally.
4. Your participation is completely voluntary, but wecertainly appreciate your help. For further information,contact Lt Col Lawlis at DSN 785-6027 or Capt Key at DSN785-8989.
JOHN W. SHISHOFF, Lt Col, USAF 4 AtchDirector, Graduate Programs 1. Privacy Act StatementSchool of Systems and Logistics 2. Questionnaire
3. Computer Answer Sheet4. Return Envelope
C-I

Privacy Act Statement
PRIVACY ACT STATEMENT
In accordance with paragraph 8, AFR 12-35, the followinginformation is provided as required by the Privacy Act of1974:
a. Authority
(1) 10 U.S.C. 301, Departmental Regulations;and/or
(2) 10 U.S.C. 8012, Secretary of the Air Force,Powers, Duties, Delegation by Compensation;and/or
(3) EO 9397, 22 Nov 43, Numbering System forFederal Accounts Relating to IndividualPersons; and/or
(4) DOD Instruction 1100.13, 17 Apr 68, Surveysof Department of Defense Personnel; and/or
(5) AFR 30-23, 22 Sep 76, Air Force PersonnelSurvey Program.
b. Principal Purposes. The survey is being conductedto collect information to be used in research aimedat illuminating and providing inputs to thesolution of problems of interest to the Air Forceand/or DOD.
c. Routine Uses. The survey data will be converted toinformation for use in research of managementrelated problems. Results of the research, basedon the data provided, will be included in writtenmaster's theses and may also be included inpublished articles, reports, or texts.Distribution of the results of the research, basedon the survey data, whether in written form orpresented orally, will be unlimited.
d. Participation in this survey is entirely voluntary.
e. No adverse action of any kind may be taken againstany individual who elects not to participate in anyor all of this survey.
C-2

Final Survey Instrument
Computer-Aided Software Engineering (CASE) Tool Use Survey
This survey is being sent to all CONUS USAF softwaredevelopment organizations. The survey is also being givento Professional Continuing Education students who attendcourses at the Air Force Institute of Technology. Pleaseanswer the questions based on your organization and theprograms that you are responsible for.
Any comments, suggestions, and explanations arewelcomed and encouraged. All inputs will be considered inthe final report. Address all inquiries to Capt Marvin Key,AFIT/LSG, Wright-Patterson AFB OH 45433 (DSN 785-8989).
Survey Completion
This survey contains 22 questions. For questions 1-18,circle the appropriate answer. For questions 19-22, writeyour answer for each question in the blank preceding eachquestion. Accompanying the survey, you will find a computeranswer sheet. Please write your computer answer sheetnumber in the space provided after the last question (thenumber can be found on the lower right hand corner of thefront page of the answer sheet). Then, using a #2 pencil,please mark your answers on the computer answer sheet
If you have any comments, please include them in the spaceprovided after the Computer Answer Sheet number on page 4 ofthe questionnaire.
C-3

1. What is your rank?
a. El to E3 d. 01 to 03 g. GS-10 to GS-12b. E4 to E6 e. 04 to 06 h. GS/GM-13 to GS/GM-15c. E7 to E9 f. Below GS-10 i. Above GS/G4-15
2. How many years of software progranTming experience do you have?
a. Less than 1 year c. 3 to 6 years e. More than 10 yearsb. 1 to 3 years d. 6 to 10 years
3. What kind of systems does your office develop?
a. Comand and control c. Avionics e. Other embedded/real-time ( )
b. Intelligence d. Mgmt Informtion f. Other (Please specify )
4. How many systems are you developing at the present time?
a. 0 b. 1 to 2 c. 3 to 5 d. 6 to 9 e. 10 or more
5. What is the average cost of system you develop?
a. $0 to 9,999 c. $50,000 to 99,999 e. $1,000,000 or moreb. $10,000 to 49,999 d. $100,000 to 999,999
6. What is the average software project size you develop (in lines of code)?
a. Less than 500 c. 1,000 to 9,999 e. More than 100,000b. 500 to 999 d. 10,000 to 99,999
7. Does your organization use CASE tools?
a. Yes b. No
8. Do you use CASE tools?
a. Yes b. No
9. In what areas of the software lifecycle do you use CASE tools (mark all)?
a. Requirements analysis c. Coding e. Maintenance g. Do not knowb. Design d. Testing f. None
10. What was the initial cost of using CASE tools (include purchase price, any specialhardware and initial training costs)?
a. $0 to 999 d. $50,000 to 99,999b. $1,000 to 9,999 e. $100,000 or more (Please specify )
c. $10,000 to 49,999 f. Do not know
C-4

II. What are your annual recurring costs?
a. $0 to 999 d. $10,000 to 49,999b. $1,000 to 4,999 e. $50,000 or more (Please specifyc. $5,000 to 9,999 f. Do not know
12. Where were you first exposed to CASE tools?
a. on the job b. In school c. Magazines or journals d. Other (Please specify
13. How long have you been using CASE tools?
a. Less than 1 year b. 1 to 2 years c. 3 to 4 years d. More than 4 years
14. On your projects that do/did NOT use CASE tools, how many errors per thousand linesof code (KLOC) can be traced back to problers with requirements analysis (pleaseprovide as accurate a numiber as possible)?
a. Less than 10 errors/KLOC c. 26 to 50 errors/KLOC e. More than 100 errors/KLOCb. 10 to 25 errors/KLOC d. 51 to 100 errors/KLOC (Please specify _)
15. What percentage of total errors did requirements definition error account for in theprojects listed above?
a. Less than 5% c. 10 to 25% e. More than 50%b. 5 to 10% d. 25 to 50% (Please specify )
16. On your projects that do/did use CASE tools, How many errors per thousand lines ofcode can be traced back to problems with requirements analysis (please provide asaccurate a number as possible for each project)?
a. Less than 10 errors/KLOC c. 26 to 50 errors/KLOC e. More than 100 errors/KLOCb. 10 to 25 errors/KLOC d. 51 to 100 errors/KLOC (Please specify _)
17. What percentage of total errors did requirements definition error account for in theprojects listed above?
a. Less than 5% c. 10 to 25% e. More than 50%b. 5 to 10% d. 25 to 50% (Please specify )
18. If used, why were CASE tools selected to be used for requirementsanalysis?
a. Tools made task easier d. Done as a test caseb. Analysis more accurate e. Not usedc. Directed to use tools f. Other (Please specify__
C-5
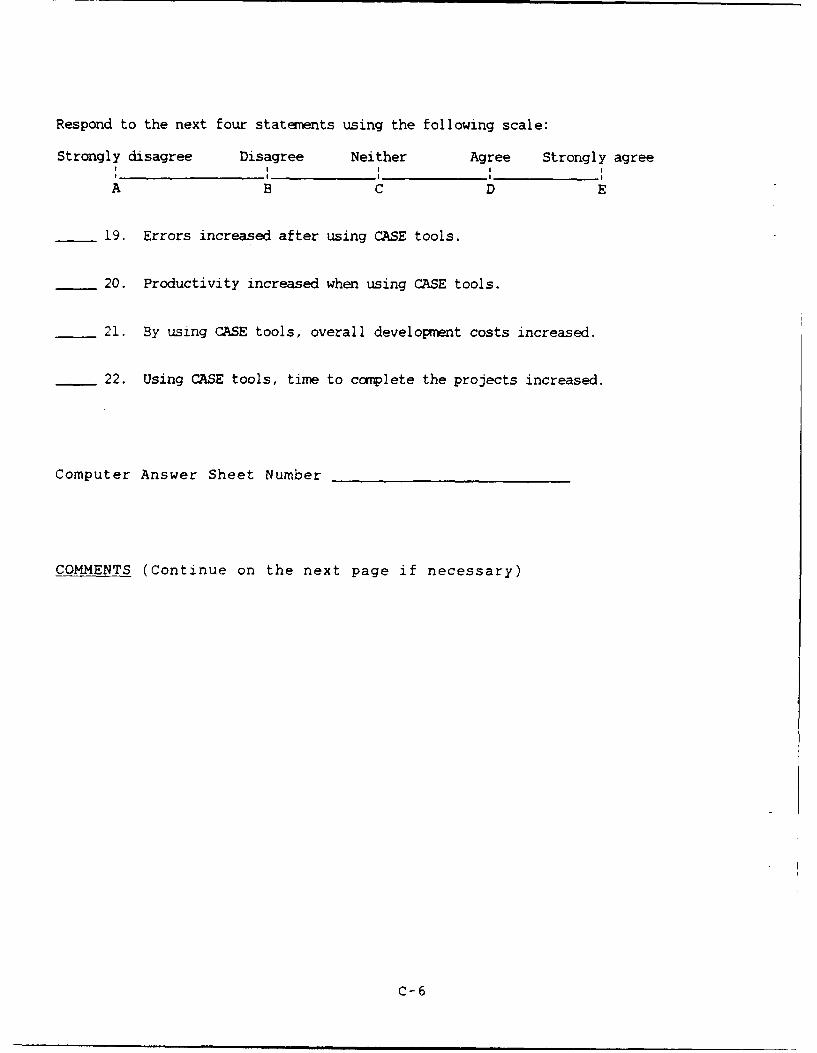
Respond to the next four statements using the following scale:
Strongly disagree Disagree Neither Agree Strongly agreeI i
A B C D E
19. Errors increased after using CASE tools.
20. Productivity increased when using CASE tools.
21. By using CASE tools, overall development costs increased.
22. Using CASE tools, time to complete the projects increased.
Computer Answer Sheet Number
COMMENTS (Continue on the next page if necessary)
C-6

RETURN INSTRUCTIONS
Once you have filled in the computer answer sheet, insert the questionnaireand answer sheet in the return envelope and place the envelope in the mail.
Thank you for your time and assistance.
C-7

Appendix D - Control Group Raw Data
The following raw data was obtained from the computer
answer sheets filled out when the surveys were completed.
The data contains 91 cases.
DBCBEDBBFAAB
GA BDABBFFFCA
DAFAAABBFAF A E
GCFEE
HBCBECABEFFDA D
GCCCDEBBF FC AA
GAEA BBFF
GDEADDAB FFAADDCC BDCB
GDDBECABGFFB ABABECCCC
GDEBEDBBF AA BDCB
HCACEEBBFDFDD AAEDD
GACEDEABFFEAACCBDBBDBB
HE CEDBBG C
GBACEEBBFAFC E
GBCBBEABEFFCA ADCC
FBEBEEAB FFAA CBDDD
GDDBEEAB FFABD CCDCC
HCEEEEAB FFD ACCCC
GCFBEDBB F C AA AE
HE AAABBFAAA E
D-l

GD BEDBB F C AE
H CCB EE BBGF FC
DCAEDEBBFFFCA
DCFA ABBG FD
HEDEDEBBFFFC E
GBFAAA BBGAADA
GCEBEEBBFFFDABA ADBB
HA BAABBGFAAAAA
FD ADCBBFFFBA BDBB
GCDB AB DFC C
DC BEEAA DFAC ADCB
DBEBDCBBGFFD
HC BEDAA ECCA E D
DAACE BBGFFD
DBABEDBBFAADAAD CCCC
GD C DBBFFFC
GCEC DBBGFFC
GAFA BB FF
GACC E EAAB FF AC
HDFCCDI3BFFF D
DBACDCAA CBBB DADAC
DCACDCAA CBAB DBCBB
DCAA AA CAABBCBCEBCBB
H CDECDB BFF FC
DABBAABBFAAA E
D-2

DCACECAAGFFAACC
HECEEDAA FFAD BDCB
GDDECEABGDAAB E
GDDECDAABBAACBCAAEBDBD
HEF
DBDECCABGFFABCD CDBDBB
CCAC FDAB B FFAA
DCABDCBBFAkC AA E
GDFEBBBBF C BA
DCCCEEABi'D AAEDDDBCDBC
H-ECEEE4AB FFCD
GBECEEBBF AAAB CCCC
GAFBEDBBF
GEDACEBBFAABAEA ECCCC
DCABEEAAAFFBD ABDBiI
DDCAAABBFAAAA E
DCCEEEAB FFB
GBFCED GFFB FCCCC
DDCDDD F AAAA
E
DBFAAA G
DA E D G
G EA BBC BB FAACA
DLIAEEE G B
DAEEE(*ABGFFDIJCBCCCC'-DD
D-3

DC EEEABGFFBBDC D DDDC
DA EEEA EBCB ACBB
GCFAAEBBFAABAAAAAE
DCCBEE GFFB
GDEAEDBBFFF
HE EEEAA CC A ABDB
GACBE AA FF
GDBEEDBBFAAB E
GBF F
GD BB F AA ECCCC
GEEA B F AA
HEFA B FAADABD E
DAEBEE G B E
HDF G C
EDF
DCAACCABCFFCA
GCEBEEBBEDA A ABDBB
GD BCCABGFFCA D
DBFBDEABFFEBA
EEAEDDABFFDDABDADECCCC
DCFBEABBFAFBAAA
D-4

Appendix E - Frequency Distribution Charts of Control Group
Responses
Introduction
The following frequency distribution charts represent
the answers provided by the control group. Of the 22
questions, questions 3, 9, and 18 were not graphed using a
frequency distribution because respondents could provide
multiple answers to these questions. Tables of the answers
to these three questions can be found in Tables 4-1 through
4-3 in Chapter IV.
Frequency Distribution Charts
30-
25-
~20-
RankAradr of Respondents
Figure E-1. Rank and Grade of Control Group
E-1

25
0-WDreponse It 3 6 tao
(3 3to6 > 10Years of Experience
Figure E-2. Experience Levels of Control Group
35-
M_
0 0Norsponse Ieo 6to 9
0 3 t.5 10 or..,.Siptems under Development
Figure E-3. Number of Systems in Development by ControlGroup Organizations
E-2

0
10
Ih respmue ,000-49,9 =0,00-Mi9s990-9,9M9 50,000-99,99 ) Ia,0000
Costs of Syjstem
Figure E-4. Cost of Development Systems in ControlGroup Organizations
20
0E-

45
B0
a-rt~jw ysN
UraiatnUe lCSEld
Orgrcanization that Us CASE Tools
Figure E-6. Determining Number of Control Grouporespndetins that Use CASE Tools
E-

35-
30
2520. sau t0399S WO-9SU o is
10-
0.lb resmw 1,9'M4-,998 000 ,9 Oo not bias
a-996 1,00-9,99 >10, 000Inuiia MR Tool Cost (in dollars)
Figure E-8. Determining Average Recuring Costs of CsECATools in Control Group Organizations
45-

20
No response School OtherJob flagaze*aurnal
First Exposure Io CAM( Tools
Figure E-10. Determining First Exposure to CASE Toolsin Control Group
35
20
No respormw I to? 2(I3 to 4
Years Using CME ToolIs
Figure E-11. Determining CASE Tools Experience Level ofControl Group Respondents
E-6
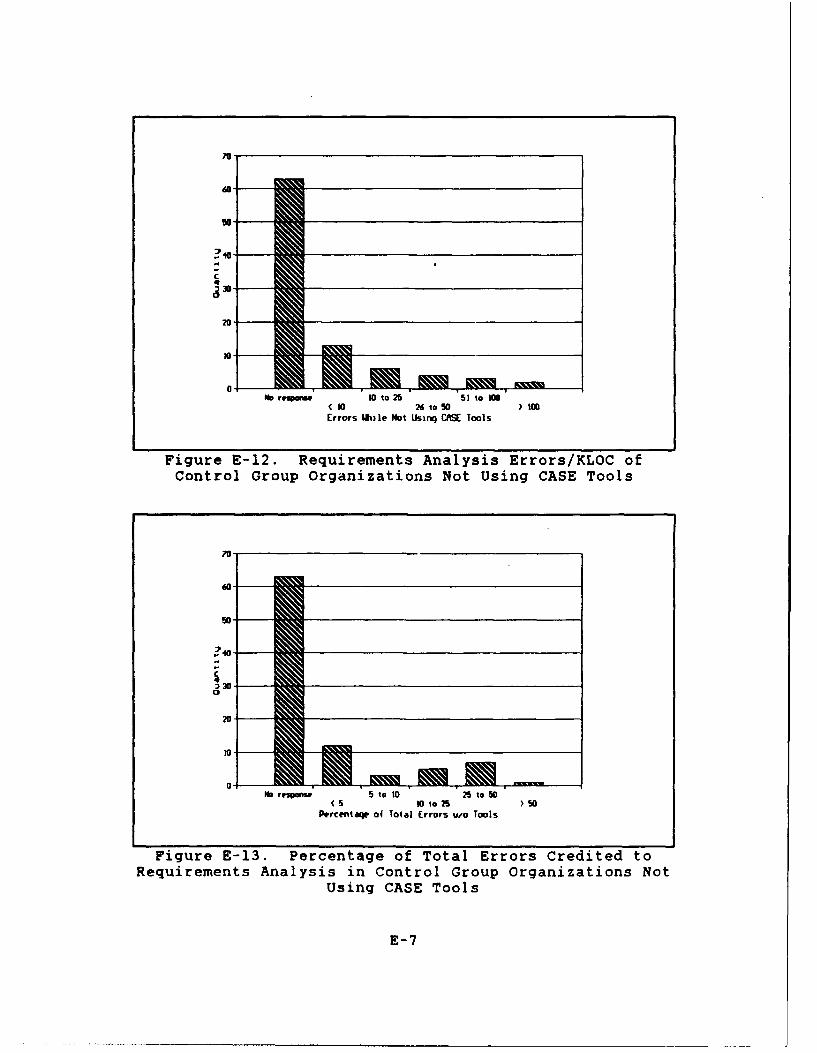
70
50-
0
thrsponse 1 Itoa25 51to 10i 26 to50 )100
Errors Ilile Not Using CAME Tools
Figure E-12. Requirements Analysis Errors/KLOC ofControl Group Organizations Not Using CASE Tools
70
?0-
Pb response 51010 2 ~ to50( 5 1too25 > so
Percentage of Total Errors uwo Tools
Figure E-13. Percentage of Total Errors Credited toRequirements Analysis in Control Group Organizations Not
Using CASE Tools
E-7

70-
do-
No response 10to 25 S1 o 10(10 26 toS 90100Errors/CLOC Wile Using CAGE Tools
Figure E-14. Requirements Analysis Errors/KLOC ofControl Group Organizations Using CASE Tools
do.
:3
ay30
20-
10-
It~epN s "w"; 510 25 teo5
( S I to 2S so5Percmntage of Total Errors ,3th Tools
Figure E-15. Percentage of Total Errors Credited toRequirements Analysis in Control Group organizations
Using CASE Tools
E-8

c
1b respauei Disagree ApeStrongly di"a Obatw.' Strongly agreeErrors Increased lf ter U~sing MA Tools
Figure E-16. Rating Whether Using CASE Tools IncreasedError Rates in Control Group
0-Pb respons;01we Awe@
Strongly disaq Obithvv Strongly agreeProductivity~ Increased Usinq CASE Tools
Figure E-17. Rating Whether Using CASE Tools IncreasedProductivity in Control Group
E-9

0
20
lresporu. OnsaQ*e qiStranqly disa Us t Strwmqla Wee
Orvelopme; t Costs Increased Using Tools
Figure E-18. Rating Whether Using CASE Tools IncreasedDevelopment Costs in Control Group
605
10-1

Appendix F - Sample Group Raw Data
The following raw data was obtained from the computer
answer sheets filled out when the surveys were completed.
The data contains 67 cases.
DBDBCDAB FFA
DADAAAABCBBBAB AD BDCB
DE AEEBBFAAAA ECCCC
DBCAEDAAECCDA DBCCC
DB DEEAB FFAA CBDCB
DDBADCBBFFFBAC E
DAABACABFFFBABCACECDDD
DEAAACBBFAABAAAAAECCCC
DBFAAAAA AABB ACECA
DBFBABBBFFFBACB E
DCABDDBBF BADD E
DEDBAEAA BABBBDCDCBCCD
DCEBCDBBF FBABB F
DDABEEAA CFAAEEDE AEBE
ECBCEEBBBFFFBA E
EBCBEEAA EEADCDACBAEBB
EBABDDAA CACB ECCDB
BBFBCCAA FFABBBAAABCCC
DDAAEDABGFFBAAAAAECCBB
GDACBCBBF D AB
CEADACBBFFFC AAAAECCCC
F-1
DDDCDDABBFFBB C CEBDBB
DEBACCABFFFCAAAABECCCC
DEBCCCBBFFFCAAAAAE
DCCAACBBFFF
DCABDEAA FFBB ABCCC
HEEAEEBB A BDBA
DCBBBDBBF B BB E
GA BBBAAEFAACBCAAD
HECBEEAA FFBDDDBC BDBB
DCABCDBBFFFBACCCCCBDDD
GCBBEDBBFAAABDDDDAADBC
BDDCDEBBFBACAAAAAECCCC
GCEBEDBBFFFAABB AEB
CC CEEAB FFAC C C
IDDAB CAA BABB BACCC
I CABABAA BAABRAAAECDCB
GAFBCCBBFAABA ECCCC
HECBDDAAEDFBA D A
GEFAAABBGAFDAABAAECCCC
DDEBDCBBFAA AA AE
HECCEDAA EFCD CECC
BADBCDBB FFA AAAA A
B AD BDDB BGF DAAB BBBEC CCC
GD BCDBBFABCABEBEECDDC
GBDBEEBBF D DD E
F-2

HEDBDDAA CCDADC DBDCC
DDDCCCAA FAABBBAA ADDB
DCABCDABFFFABDC CECCCC
DADBBDAB DDAABAAAABCDD
GCCBBBABFFCBA
GEBCDDAA FFCAAAAAEBDBB
DDBCACBBFFFBAAAAAEECBB
DDBCDDABFFFCA
I EFBBDCBBFFFCABBCECCCC
DDDAAABBF E
CADBBDBBFADC ECCCC
DBDCEEAB AEAC AADCB
DEBBDDAA FFADCDAC BEAB
HEDBDDAA CCCBCBBBEBDBB
DCABEEBBFFFB CCCC
DBCBFEBBF AA E
DAADEDABAFEAACCBBDBCBB
DCABCDABFFFABDC CECCCC
BADBDDBBGFDAABBBBECCCC
DDAAEDABGFFBAAAAAECCBB
DEAAACBBFAABAAAAAECCCC
F-3

Appendix G - Frequency Distribution Charts of Sample Group
Responses
Introduction
The following frequency distribution charts represent
the answers provided by the sample group. Of the 22
questions, questions 3, 9, and 18 were not graphed using a
frequency distribution because respondents could provide
multiple answers to these questions. Tables of the answers
to these three questions can be found in Tables 4-4 through
4-6 in Chapter IV.
Frt=jency Distribution Charts
40
35
30-
25
720-
150
10-
No r.spanse E4-E6 01-03 ( GS10 GSAM13-GS/M 15C1-L3 E?-9 04-06 GS1O-GS 12 ) GS/M15
Pank/Grade of Pespondent
Figure G-1. Rank and Grade of Sample Group
G-I

0gbr.Itou 1~3 6to 10
(I 3to 6Years of Experiemec
Figure G-2. Experience Levels of Sample Group
25
20-
I
5-
0.Noresponse I to2 to 9
0 3to 5 10 or rwSstm under Orwopent
Figure G-3. Number of Systems in Development by SampleGroup Organizations
G-2

20
12
0.
0- N. Vvw.; Jb0D-49,999 MlOG 0-SU,0890-s m9 50, 000-99,s9 M 1,o,o
Costs 04 Symmus
Figure G-4. Cost of Development Systems in Sample GroupOrgani zat ions
3B
20-
4
ND r5wu I'-999 10,00>-9 00 9
Linn' of Co*.
Figure G-5. Average Lines of code in DevelopmentSystems in Sample Group Organizations

21-
?21
.
10-
Orqmaliaton Use of CAM Tools
Figure G-6. Determining Number of Sample GroupOrganizations that Use CASE Tools
40-
020-
10
No rnpe "DUS,
Personal the of CASE Tools
Figure G-7. Determining Number of Sample GroupRespondents that Use CASE Tools
G-4

25.
8-9" 10,0-49, 99 > 100,000In I ial CA%( Tool Cost (int dollars)
Figure G-8. Determining Average Initial Costs of UsingCASE Tools in Sample Group Organizations
0
?0
ND respue 1,00-4,919 I0,w-49,U Do not buu0 -rn1 5,00D-9,9" ) S0,00Recurrinq CASE Tool Cast (in dollars)
Figure G-9. Determining Average Recurring Costs of CASETool Use in Sample Group Organizations
G-5

5
No resporw Wcool Olthrjob flaqaurrarnals
First Exposuire to Cfff Tools
Figure G-10. Determining First Exposure to CASE Toolsin Sample Group
0-A
(1 3 to4Years Using CASE Tools
Figure G-11. Determining CASE Tool Experience Level ofSample Group Respondents
G-6

20-
0.
DID IWOMu 10 to 25 51 to
(1 26 to 50 )100Errors While Not Using CASE Tools
Figure G-12. Requirements Analysis Errors/KLOC ofSample Group Organizations Not Using CASE Tools
Noreqwue 5to 10 25 to 50(S 10) 550
Percentage of Total Errors iwo Tools
Figure G-13. Percentage of Total Errors Credited toRequirements Analysis in Sample Group Organizations Not
Using CASE Tools
G-7

30
2 r5-we1t255t~
?(0 2-o0)J
0
ND respau. 10to2 5 3to100< 1026to~ )0
Pcraq fTtlErrorsAO uuthUsnqCA Tools
Figure G-1. Pecientaent ofToalyi Errors/O eidoReurmnsAyi nSample Group Organizations UigCS ol
2G-8

25
010
Strongly disaq lbi thes Strongly agreeErrorsXIIredAferasid~ng CASE 7ools
Figure G-16. Rating Whether Using CASE Tools IncreasedErrouctivtys in Sample Group
10-9

00
Da
Strongly~ dasaq Obi tter Strongly agreDewricpment ICosts Increased Using Tools
Figure G-18. Rating Whether Using CASE Tools IncreasedDevelopment Costs in Sample Group
0.Ob response Disagree.ge
Strongly diat lbs tto Strongly agreeCo"Ilelion Times Increaseck! wTacis
Figure G-19. Rating Whether Using CASE Tools IncreasedTime to Complete Projects in Sample Group
G-10

Appendix H - Frequency Distribution Charts of All Responses
in Combination
Introduction
The following frequency distribution charts represent
the answers provided by both the control group and the
sample group. Of the 22 questions, questions 3, 9, and 18
were not graphed using a frequency distribution because
respondents could provide multiple answers to these
questions. Tables of the answers to these three questions
can be found in Tables 4-7 through 4-9 in Chapter IV.
Frequency Distribution Charts
30-I
dOM
20
Ob respmnw (446 01-0 (f SIO Sfl3-SSA1l5E -(3 17-CS 01-0)6 SSIO-SS12 > 6S'fi15
Ran*/Gradp of Ospondmnts
Figure H-i. Rank and Grade of All Respondents
H-1

46
30
25
:5
0
No respon I to3 6to 0(1 3 o6 )10
Years o4 [mperiernce
Figure H-2. Experience Levels of All Respondents
70
60-
0
20
No respose to 2 6 Id 90 3 to 5 10 or mare
Smste.s uder Oevelopwt
Figure H-3. Number of Systems in Development by AllSurveyed Organizations
H-2

70
?0-
0-NO r-spouu 10, 000-"9,N99 100, 00()999, 9;8
o-9, 9" 50,(XIO-S999 1,0010,000Costs ol Slysteos
Figure H-4. Cost of Development Systems in All SurveyedGroups
40
H-T

60
0
aNo resa ~ No
YesOrqaizalion Use of CISC Tools
Figure H-6. Determining Number of SurveyedOrganizations that Use Case Tools
120
20-
0.No respons No
YesPersonal Use of MAS Tools
Figure H-7. Determining Number of Total Respondentsthat Use CASE Tools
H-4

3
jb rrvmis; Ii, i-S, 968 50, 0C-9B, 999 Eo not biouG-9"n I,US-4S,sm ) too,000
Initial CASE Tool Cost (in dollars)
Figure H-8. Determining Average initial Costs of UsingCASE Tools in All Surveyed Organizations
3*
0
30
No response i,99-4,999 iO,000-4S99 Do not bim.0-999 S,mO-9,99 > 50, misRecurring CASE Tool Cost .(in dollars)
Figure H-9. Determining Average Recurring Costs of CASETool Use in All Surveyed organizations
H-5
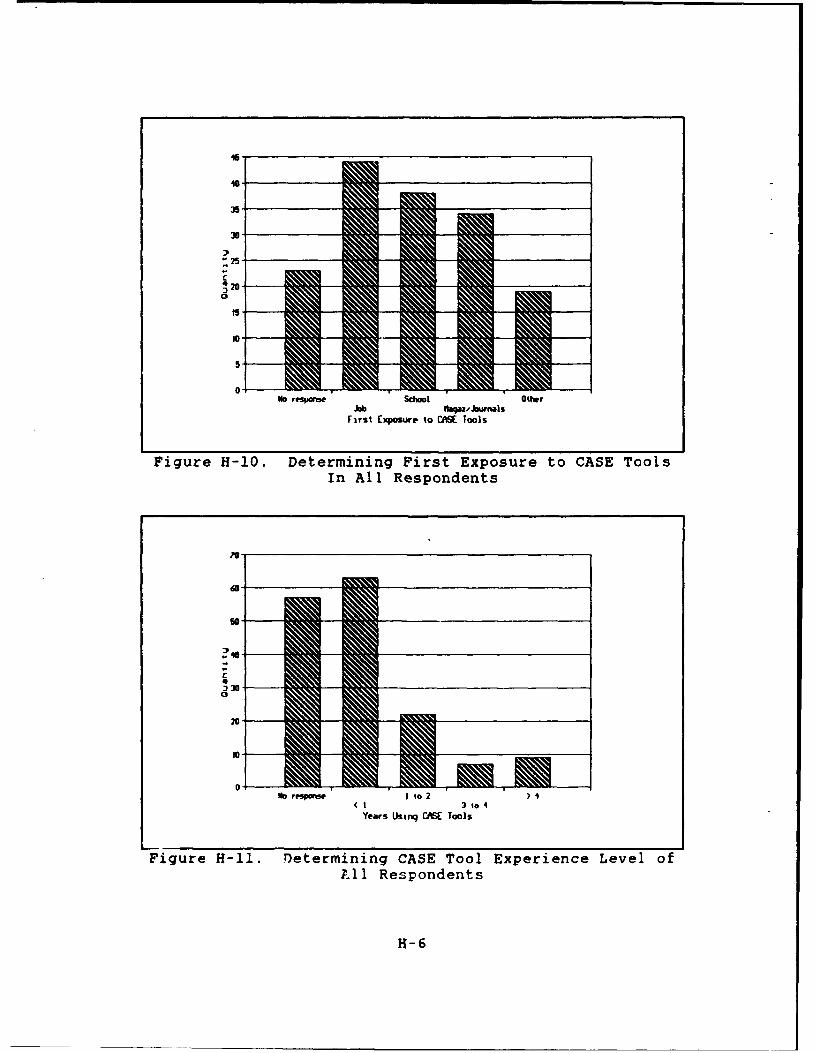
45
30
No.s25 dao ti
0No response 110 Ohe
YFrs Upstq to M Tools
Figure H-10. D)etermining CAs TooloExprie Leve CSTofInAll Respondents
WH-

Ibrpns 10to 25 51 to 100(10 26 to50 > 100Errors While Not Using CfaS Tools
Figure H-12. Requirements Analysis Errors/KLOC of AllSurveyed organizations Not Using CASE Tools
Prrcenawq of Total tvrors uwo Tools
Figure H-13. Percentage of Total Errors Credited toRequirements Analysis in All Surveyed Organizations Not
Using CASE Tools
H-7

60a
*a ruesp 10to 25 5110 30(U 26 to 5
ErrorsvtG.C While Usung CASE Tools
Figure H-14. Requirements Analysis Errors/KLOC of AllSurveyed Organizations Using CASE Tools
40
0-Ibrsu. to la 25150
(5 101025 sPevcentaW of Total Errors Uilh Tools
Figure H-15. Percentage of Total Errors Credited toRequirements Analysis in All Surveyed organizations
Using CASE Tools
H-8

0-
c
Error Rates in All Surveyed organizations
ND rC u Disagree Are£ir"1ql dioaq Meatlw Stru~iq a"wProduictivity Increased Lkinq CASE Tools
Figure H-17. Rating Whether Using CASE Tools IncreasedProductivity in All Surveyed Organizations
H-9

0
60
50 rwmeOsare qe
40aq- ia uaw tmm~ .
30
Striqlq4 disag 140111ey Strongly agre0eopmetiw t i t ncreased Uigools
Figure H-18. Rating Whether Us~ing CASE Tools IncreasedTimelopmete Pojts in All Surveyed Organizations
70-1

Appendix I - SAS Analysis of Data
Introduction
The following tables are X x 2 contingency tables. The
X represents the number of possible responses to the
particular survey plus one. The one represents the
possibility of having a response answer. The 2 in the
formula represents the number of groups surveyed; the
control group and the sample group. Also included in these
tables are the Chi-Square calculations for each factor. The
description and explanation of these tables, factors, and
calculations are explained and analyzed in Chapter IV.
Tables and Chi-Square Calculation*
Beginning on the next page, nineteen contingency tables
(including Chi-Square calculations) are displayed.
Questions 3, 9, and 18 were not included in the tables or
Chi-Square calculations because of the respondents' ability
to provide multiple answers to these specific questions.
These tables and calculations were generated using the SAS
Statistical program. 19 individual programs were created
using the data compiled in Appendices E, G, and H as the
inputs. Copies of these programs are not included in this
document, but can be provided upon request.
I-i

Table I-1. Rank/Grade of Respondents
TABLE OF GRADE BY GROUPGRADE GROUP
FrequencyPercent
Row PctCal Pct 1CONT :8AMPLE Total---- --- --------------
<0a10 3 1 41.91 0.64 2.55
75.00 25.003.33 1.49
> G 15 0 3 30.00 1.91 1.910.00 100.000.00 4.48
-- - ----- -------------
R2H4-6 0 5 50.00 3.18 3.180.00 100.000.00 7.46
3N7-9 0 3 30.00 1 1.91 1 .910.00 100.000.00 4.48
0810-12 38 9 4724.20 5.73 29.9480.85 19.1542.22 13.43
--------------------.
0813-15 16 6 2210.19 3 . 2 14 .0172.73 27.2717.78 8.96
-- - -- -- ---------- -----01-3 31 37 68
19.75 23.57 43.3145.59 54.41 134.44 55.22
04-6 0 3 30.00 1.91 1 .910.00 100.000.00 4.48
-- -- 4.- ------- -------
0F4-6 2 0 21.27 0.00 1 27
100.00 0.002.22 0.00
-,-------------
Total 90 67 15757.32 42.68 100.00
RANK/GRADE OF RESPONDERNTS
8TATISTIC8 FOR TABLE OF GRADE BY GROUP
Statistic 0? Value Prob
Chi -Square 8 37.402 0.000Likelihood Ratio Chi-8quare 8 44.341 0.000Kanta l-Haensa3l Chi-8quare L 0.240 0.624Chi Coefficient 0.488Conti nqency Coefficient 0.439Cgamor , a V 0.488Sample S e 157
WARNING: 67% ot the cells have expected counts lessthan 5. Chi -Square may not be a valid test.
1-2

Table 1-2. Years of Experience of Respondents
TABLE OF TEARS BY GROUP
YEARS GROUP
FrequencyPercent
Row PctCol Pct ICONT :SAMPLE Total-- - - - *4 -- -- #----- -----
1-3YRB 15 1 269.49 6.96 16.46
57.69 42.31 116.48 16.42
- ------------------
3-6YR8 28 15 4317.72 9.49 27 .2265.12 34.8830.77 22.39
-- -- 4.- ------------ 4.
6- 10YR5 20 14 3412.66 8.86 21.5258.82 41.18 121.98 20.90
<IYR 15 10 259.49 6.33 1 15 .82
60.00 40.00 16.4S 14.93
-- -- 4.- ------------ 4.
>10YRS 12 17 297.59 10.76 18.3541.38 58.62L 3 1 25.37
-- --- - ---- 4-------
N R 0 16 3 0.00 0 .63S .0 0 .00
1.10 0.00----------------
Total 91 67 15857.59 42.41 100.00
YEARS OF EXPERIENCE OF RESPONDENT8
STATISTICS FOR TABLE OF YEARS BY GROUP
Statistic DF Value Prob
Chi- Square 5 4.935 0.424Likelihood Ratio Chi-Square 5 5.274 0.383Mantel-Haonazol Chi-Square 1 1.605 0.205
1-3

Table 1-3. Number of Systems Under Development
TABLE OF NUKSYS BY GROUP
NUMBYS GROUP
Frequency!PercentRow PctCal Pct CONT !SAMPLE Total-- - -- - -- ------ ------
08Y8 1 7 15 3210.76 1 9.49 20 .2553.13 t 46.8818.68 22.39
-- - - - -+ - ----- ------
1-28Y8 3i 37 6819.62 23.42 43 0445.59 54.4134.07 55.22
S---------------1 08 Y 21 1 0 21
13.29 0.00 13 29100.00 0 .0023.08 0.00 1
- - - - - ------- ------- +
3-5818 1 16 12 2810.13 7.59 17 7257.14 42.8617.58 17.91
- - - - - -------- ----- 4.
6-98Y8 1 3 1 40 .63 1. 90 2 53
25.00 75.001 .10 4 .48
NR 5 0 53.16 0.00 3 16
100.00 0.005.49 0.00
Total 91 67 15857.59 42.41 100.00
NUMBER OF SYSTEMS UNDER DEVELOPMENT
STATISTICS FOR TABLE OF NUM#81 BY GROUP
Statistic DF Value Prob
Chbi - Square 5 25.161 0.000Likelihood Ratio Chi-Square 5 34.659 0.000Mantel -Haenszel Chi-Square 1 3.587 0.058Fisher's Exact Test (2-Tail) 7. 12E-06Phi Coetticient 0.399Coat i ngency Coef t iciant 0 .37 1Cramer's V 0.3998amp Ie 8 iz = 158
WARNING: 33% at the cells have expected counts lessthan 5. Chi-Square may not be a valid test.
1-4

Table 1-4. Cost of Systems Under Development
TABLE OF COST BY GROUP
COST GROUP
Frequency:Espected 1PercentRow PctCol Pct CONT !SAMPLE Total-- - - -- - -------------
IM 42 19 6135,133 1 25.86726.58 1 12.03 38.6168.85 31.1546.15 28.36
-- -- - -4 -------------.
49.9K 3 8 116.3354 4.6646 1
1.90 5.06 6.9627.27 72 .73
3. 30 11 .94S---------------.
9. 9K 8 13 1 2112.095 8.9051
5.06 8.23 13 2938.10 61.908.79 19.40
99.9K 7 12 1910.943 8.057
4.43 7.59 12 0336.64 63.167.69 17.91
999.9K 15 15 3017.278 12.722
9.49 9.49 18 9950.00 50.0016.48 1 22.39
-- -- 4.- ------------- ,
WR 16 0 169.2152 6.7848 110.13 0.00 10.13
100.00 0.0017.58 0.00
Tota1 91 67 15857.59 42.41 100.00
COST OF SYSTEMS UNDER DEVELOPMENT
STATI8TICS FOR TABLE OF COST BY GROUP
Statistic DF Value Prob
Chi-Square 5 26.415 0.000Likelihood Ratio Chi-Square 5 32.303 0.000Mantel Haensz9l Chi-Square 1 0 016 0.899Phi Coef f i c i ent 0 409Contingency Coefficient 0.378Cramer's V 0.409Sample Size 7 158
1-5

Table 1-5. Lines of Code in Systems Under Development
TABLE OF LOC BY GROUP
LOC GROUP
FrequencyExpectedPercent
Row PctCol Pct CONT !SAMPLE Total
.999K 4 4 84.6076 3.3924
2.53 2.53 5 .0650.00 50.004.40 5.97
IM 30 15 4525.918 19.082 18.99 9.49 28 4866.67 33.3332.97 22.39
9.9K 14 14 2816.127 11.873
8.86 8.86 17 7250.00 50.0015.38 20.90
99.9K 21 29 5028.797 21.203
13.29 18.35 31 6542 .00 58 .0023 .08 43. 28
- - - - -- - - - - - - - - - -
>500 10 1 4 148.0633 5.9367
6.33 2.53 8 8671.43 28.5710.99 5.97
NR 12 1 137.4873 5.5127
7.59 0.63 8 2392.31 7.6913.19 1.49
Total 91 67 15857.59 42.41 100.00
LINES OF CODE IN SYSTEMS UNDER DEVELOPMENT
STATISTICS FOR TABLE OF LOC BY GROUP
atatiatic DF Value Prob
Chi - Squar a 5 14 856 0 .011Lik lihood Ratio Chi-Square 5 16 350 0.006Mantel -Haenazel Chi-Square 1 0 661 0 416Phi Coe ficient 0 307Continq*ncy Coefficient 0 293Ccamer ' V 0 307$ample Siue = 158
1-6

Table 1-6. Organizational Use of CASE Tools
TABLE OF ORGUSE BY GROUP
ORG IS GROUP
Frequency,EzpectedPercentRow PctCol Pct ICONT SAMPLE I Total-- - - - - -4 ------ ------.
NO 41 32 7342.044 30.956
i 25.95 20.25 1 46.2056.16 43.8445.05 47.76
NR 16 0 169.21 52 6.784810.13 1 0.00 1 10.13
100.0a0 0.0 0S 17.58 0.00
YES 34 35 6939.741 29. 5921.52 22.15 43.6749.28 50.72 137.36 52.24
- - - - - - - -------- -----
Total 91 67 15857.59 42.41 100.00
STTISTICS FOR TABLE OF ORGUSE BY GROUP
Statistic DF Value Prob
Chi -Square 2 1 .797 0.00LLikelihood Ratio Chi-Square 2 19.648 0.000Mant el -Haenszel Chi- Square 1 0 632 0 .426Phi Coe f f icient 0 296Contingency Coet ficient 0 283Cramer's V 0.296sample size = 158
1-7
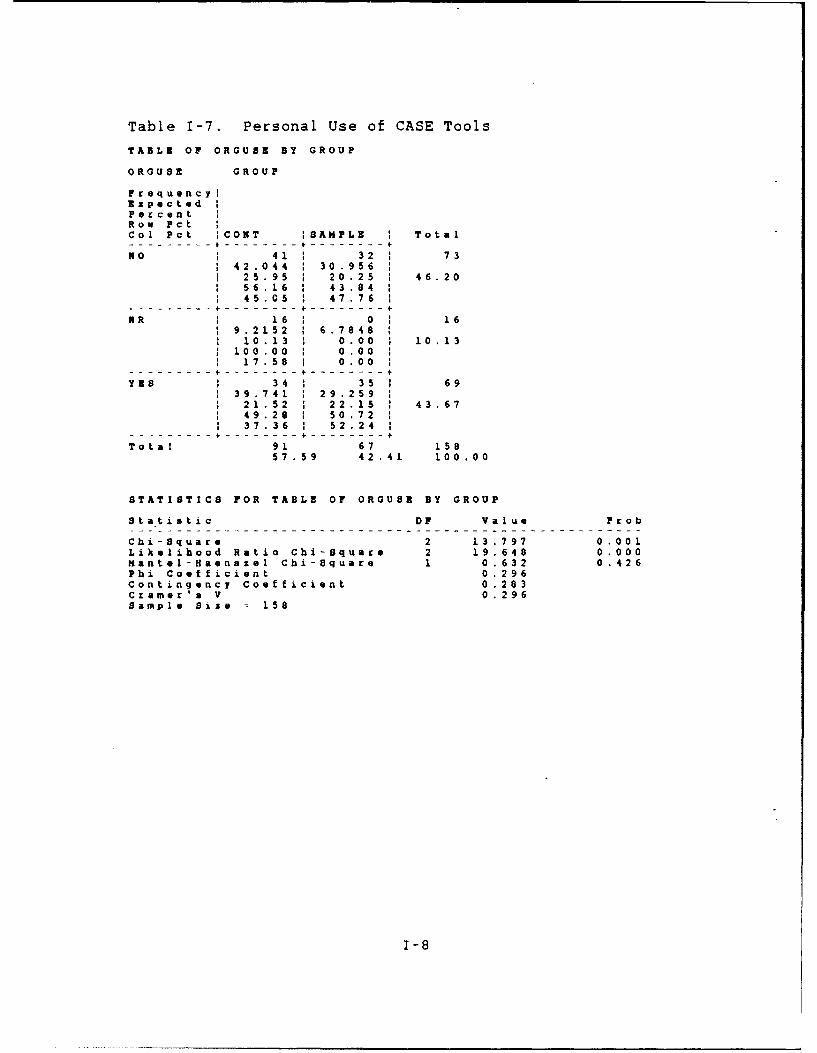
Table 1-7. Personal Use of CASE Tools
TABLE OF ORGUSE BY GROUP
ORGUES GROUP
Frequency
ExpectedPercentRow PctCol Pct CONT ;SAMPLE I Totml-- - - - - ------- -----.
NO 41 32 7342.044 1 30.956 25.95 20.25 1 46.2056.16 43.84 45.05 47.76
-- -- 4-.------------4.
NR 16 0 161 9.2152 6.78481 10.13 0.00 i 10.13100.00 0.0017.58 0.00
-- -- 4.- ------------ 4.
YES 34 35 6939.741 : 29.25921.52 22.15 1 43.6749.28 50.72
37.36 52.24 1--- -- -- 4. ----------- 4.
Tota1 91 67 15857.59 42.41 100.00
STATISTICS FOR TABLE OF ORGUSE BY GROUP
Statistic DF Va I ue Pr ob
Chi - Square 2 1 3 .797 0 .001Likelihood Ratio Chi-Square 2 19.648 0.000Mant l -Hans ze 1 Chi -Square 1 0 .632 0 . 426Phi Coefficient 0.296Contingency Coa ficient 0 283C ramr ' s V 0 296Sample Size 158
1-8

Table 1-8. Initial Cost of Using CASE Tools
TABLE Or INITCOST BY GROUP
INITCOST GROUP
FrequoncylExpectedPercentRow PctCol Pct CONT !SAMPLE Total-- -- - -4 --------------
.999K 15 1i 261 14.975 11.025
9.49 6.96 16 4657.69 42.3116.48 16.42
S---.----------4.100K 2 2 4
2.3038 1 1.6962 1.27 1.27 1 2 53
50.00 50.002 . 20 2 . 99
----------------------.
49.9K 4 5 95.1835 3.8165
2.53 3.16 5 7044.44 55.56
4.40 7.46-- -- - -4 -------------.
9.9K 1 4 52.8797 2 .1203
0.63 2.53 3 1620.00 8 80.00
1 .10 5. 97 1-- -- - -4 -------------.
99.9K 6 1 2 84.6076 3.3924
3.80 1 1.27 5 0675.00 25.006.59 2.99
-- -- - -4 ------------ 4.
NOTKNO" 43 1 34 7744.348 32.65227.22 21.52 48 7355.84 44.1647.25 50.75
MR 20 9 1 2916.703 12 .29712.66 5.70 1 18 3568.97 1 31.03 121.98 13.43
-- -- - -4 -------------.
Total 91 67 15857.59 42.41 100.00
INITIAL COST OF USING CASE TOOLS
STATISTICS FOR TABLE OF IMITCOST 1Y GROUP
Statistic DF Value Prob
Chi-Squa re 6 6 .249 0.396Likelihood Ratio Chi-Square 6 6.423 0.378Mantel -Haenuael Chi-Square 1 0.630 0.427Phi Coefficient 0.199Continqency Coefficient 0.195Cramer's V n.199Sample Sise = 158
WARMING: 50% of the cells have expected counts lessthan 5. Chi-Square may nut be a valid test.
1-9

Table 1-9. Recurring Cost of Using CASE Tools
TABLE OF RECCOST BY GROUP
RECCOST GROUP
FrequencyExpectedPercentRow PctCol Pct CONT ;SAMPLE Total-- - - - - -------------.999K 17 13 30
17.278 1 2.722 10.76 8.23 19 9956.67 43.3318.68 19.40 1
-- -- - -4 ------------.
4.9K 3 3 63.4557 2.5443
1.90 1.90 3 8050 .00 50 .00
3 .30 4 4. 48-- -- 4-.------------4.
49.9K 1 4 52.8797 2. 1203
0.63 2.53 3 1620.00 80.001.10 5.97
-- -- - -- -------------.
50K 2 1 3 1 52.8797 2. 1203 1
1.27 1.90 3 1640.00 60.002.20 1 4.48 1
-- -- - -4 -------------.
9.9K 2 ' 4 63.4557 2.5443 1
1.27 2.53 3 8033.33 66.672.20 5.97
-- -- 4.- ------------ 4.NOTREOW 44 ' 33 77
44.348 1 32.65227.85 20.89 48 7357.14 1 42.86 148.35 49.25
-- -- - -- --------------
MR 22 7 1 2916.703 1 12.297 113.92 4.43 18.35
i 75.86 24.1424.18 10.45
-- -- - -4 -------------.
Total 91 67 15857.59 42.41 100.00
RECURRING COST OF USING CASE TOOLS
STATISTICS FOR TABLE OF RECCOST BY GROUP
Statistic DF Value Prob------------------------------------------------------
Chi- Square 6 9.094 0.168Likelihood Ratio Chi-Square 6 9.408 0. 152Mantel-Haenozel Chi-Square 1 1.636 0.201Phi Coofficient 0 240Contingency Coef ficient 0 233Cramer's V 0.240Sample Size = 158
WARRING: 57% of the cells have expected counts legthan S. Chi-Square may not be a valid test.
I-10

Table 1-10. First Exposure to CASE Tools
TABLE OF EXPOSE BY GROUP
EXPOSE GROUP
Frequency;ExpectedPercent
Row PctCol Pct :CONT 1SAMPLE Total-- -- - -4. - -----------.
JOB 21 23 1 4425.342 18. 65813.29 14.56 27.8547.73 1 52.2723.08 34.33
- 4-.--------------4.
MAG/JOUR 23 11 3419.582 14.41814.56 6.96 21.5267.65 32.3525.27 16.42 1
-- -- - -4 -------------.
NR 19 1 4 1 2313.247 9.753212.03 1 2.53 1 14.5682.61 1 17.39
20.88 5.97-- -- - -4 -------------.
OTHER 12 7 1910.943 8.057
7.59 4.43 12.0363.16 36.8413.19 10.45
SCHOOL 16 1 22 3821.886 16.11410.13 13.92 1 24.0542.11 57.89 17.58 32.84
-- - - -- - - -----------.
Total 91 67 158
57.59 42.41 100.00
FIRST EXPOSURE TO CASE TOOLS
STATISTICS FOR TABLE OF EXPOSE BY GROUP
Statiatic DF Value Prob
Chi- Square 4 13 .027 0 .011Likelihood Ratio Chi-Square 4 13.673 0.008Mantel-Haenszel Chi-Square 1 0.321 0.571Phi Coefficient 0.287Contingency Coefficient 0.276Cramer's V 0.287Sample Size = 158
1-l1

Table I-l. Length (Years) Using CASE Tools
TABLE OF LENGTH BY GROUP
LENGTH GROUP
FrequencyExpectedPercentRow PctCal Pct ICONT !SAMPLE 1 Total
S4.-- -- ------------ 4.
1-2YRS 8 14 221 12.671 9.3291
5.06 8.86 13.9236.36 63.648.79 20.90
# ----------------
3-4YRS 3 4 74.0316 2.9684
1.90 2.53 4.4342.86 57.14 3.30 5.97
--- -- -- -- ------------ +
<1YR i 31 32 6336.285 26.715 19.62 20.25 39.8749.21 50.7934.07 47.76
>4YRS 5 1 4 91 5.1835 ; 3.8165
3.16 1 2.53 5.70
i 55.56 44.445.49 5.97
NR 44 13 5732.829 24,171 I
1 27.85 8.23 1 36.0877.19 22.81
1 48.35 1 19.40- -- --. . .- .---- ..----- .Total 91 67 158
57.59 42.41 100.00
LENGTH (YEARS) USING CASE TOOLS
STATISTICS FOR TABLE OF LENGTH BY GROUP
Statistic DF Value Prob
Chi - Square 4 15 .477 0.004Likelihood Ratio Chi-Square 4 16.076 0.003Mantel-Haensza l Chi-Square 1 14.391 0.000Phi Coefficient 0.313Contingency Coefficient 0.299Cramer's V 0.313Sample Size = 158
WARNIAG: 30% at the cells have expected counts lessthan 5. Chi-Square may not be a valid test.
1-12

Table 1-12. Errors/KLOC w/o Using CASE Tools
TABLE OF NUMKLOC BY GROUP
NMUNKLOC GROUP
Frequency;ExpectedPercent
Row PctCol Pct CONT :SAMPLE i Total-- - - - 4 -- ------ ----- I.
10-25 Z 6 1 4 2011.519 8.481
3.80 8.86 12 .6630.00 70.006.59 1 20.90 1
-------------- 4f.
26-503 4 7 1 116.3354 4.6646
2. 53 4. 43 6 9636.36 63.64 1
4. 40 10. 45 1--- -- -- -- ------ ------.
51-1002 3 7 105.7595 4.2405
1.90 4.43 6.3330.00 70.003.30 10.45
<10! 13 18 3117.854 13.146
8.23 11.39 19 6241.94 1 58.0614.29 26.87
>1002 2 1 31.7278 1.2722
1.27 0.63 1.9066.67 33.33 2.20 1.49
NR 63 20 8347.804 35.196
I 39.87 12.66 52.5375.90 24.1069. 23 29. 85
-- -- 4.- ------------ 4.
Total 91 67 15857.59 42.41 100 .00
IRRORS/KLOC "/0 USING CASE TOOLS
8TATIST[CS FOR TABLE OF NUMKLOC BY GROUP
statist ic DF Value Prob
Chi -Square 5 25.989 0.000Likelihood Ratio Chi-Square 5 26.655 0.000antel-Hoensiel Chi-Square 1 22.8.65 0.000
Phi Coefficient 0.406Contingency Coetficient 0.376Cramer's V 0.406sample size = 158
WARPING: 33% ot the calls have expected counts loethan S. Chi -Square may not be a valid test.
1-13

Table 1-13. Percentage of Errors Credited to Req Anal w/oCASE Tools
TABLE OF PERERR BY GROUP
PERERR GROUP
Frequency;EzpectedPor cont
Row PctCol Pct ICONT !SAMPLE I Total-- -- - -- ------ 4.------
10-259 5 8 1 137.4873 5.5127
3.16 5.06 1 8 2338.46 61.545.49 1 11.9 4
25-503 7 18 158.6392 6.3608
4.43 5.06 9 49i 46.67 53.33
7.69 11.94
5-103 3 12 158.6392 6.3608
1.90 7.59 9 4920.00 80.003.30 17.91
'53 12 : 15 27
155.551 11.449 7.59 9.49 17 09
44.44 55.5613.19 22.39
>503 1 2 31 1.7278 1 1.2722
0.63 1.27 1 .9033.33 66.671.10 2.99
NR 63 22 8548.956 36.044 39.87 13.92 53.8074.12 25.8869.23 1 32.84
Total1 91 67 15857.59 42.41 100.00
PERCENTAGE OF ERRORS CREDITED TO REQ ANAL N/O CASE TOOLS
STATISTICS FOR TABLE OF PERERR BY GROUP
Statiatic DF Value Prob
Chi - Square 5 23.499 0.000Likelihood Ratio Chi -square 5 24.187 0.000Mantel Haenaael Chi-Square 1 16.054 0.000Phi Coe ti c ient 0 . 386Contingency Coefficient 0.360Cramer' s V 0.386sample sio 150
1-14

Table 1-14. Errors/KLOC Using CASE Tools
TABLE OF NUNKLOC BY GROUP
RUNKLOC GROUP
FrequencyExpectedPercent
Row PctCol Pct 'CONT ISAMPLE Total-- - -- --- - -----------
10-25Z 2 7 ; 95.1835 3.8165 1
1.27 4.43 1 5.7022.22 77.782.20 10.45
----------------
26-501 2 1 3 52.8797 2.1203
1.27 1.90 3.1640.00 60.002.20 4.48
4.------------
51-100z 1 2 31.7278 1.2722
0.63 1.27 1.9033.33 66.671.10 2.99 1
<103 5 20 251 14.399 10.601 1
3.16 12.66 15.8220.00 80.00 5.49 29.85 1
--- -- -- -- ------------.
NR 81 35 11666.81 49.19
51.27 22.15 73.4269.83 30.1789.01 i 52.24 1
-- -- - -4 -------------.
Total 91 67 15857.59 42.41 100.00
ERRORS/KLOC USING CASE TOOLS
STATISTICS FOR TABLZ OF NUKKLOC BY GROUP
statistic DF Value Prob......................................................
Chi-Square 4 27.542 0.000Likelihood Ratio Chi-Square 4 28.213 0.000Mantel-Haenaxel Chi-Square 1 15.257 0.000Phi Coefficient 0.418Contingency Coefficient 0.385Cramer 's V 0 .418Sample oilse = 158
WARNING: 50e of the celia have expected counts lessthan 5. Chi-Square may not be a valid test.
1-15

Table 1-15. Percentage of Errors Credited to Req Anal withCASE Tools
TABLE OF PERERR BY GROUP
PERERR GROUP
F requancyExpectedPercentRow Pct
Col Pct ICONT SAMPLE Total-- -- 4.- ------------.
10-253 4 : 9 137.4873 5.5127
2.53 5.70 8. 2330 .77 69.23
4. 40 13. 43 ;------------- 4-
25-503 4 3 74.0316 2.9684
2.53 1.90 4 4357.14 42.86
4.40 4.48
5-10 1 5 63.4557 2.5443
0.63 3.16 3 .8016.67 83.33
1.10 7.46-- -- - -4 ------------.
'52 4 17 : 211 12.095 1 8.9051
2.53 10.76 13 .2919.05 80.95
4. 40 1 25. 37
>503 0 2 21.1519 0.8481
0.00 1.27 1 .270.00 100.000.00 2.99 1
NR 78 ; 31 1 10962.778 46.22249.37 19.62 68.9971.56 28.4485.71 46.27
Total 91 67 15857.59 42.41 100.00
PERCENTAGE OF ERRORS CREDITED TO REQ ANAL WITH CASE TOOLS
STATISTICS FOR TABLE OF PERERR BY GROUP
statistic DF Value Prob......................................................
Chi-Square 5 32.142 0.000Likelihood Ratio Chi-Square 5 33.749 0.000Mantel-Haonssel Chi-Squate 1 17.109 0.000Phi Coo eficient 0 451Continqency Coetficient 0.411Cramer's V 0.451Sample Size = 158
WARNING: 50% o! the cells have expected counts lessthan 5. Chi-Square may not be a valid test.
1-16

Table 1-16. Errors Increased with Using CASE Tools
TABLE OF COMMENT BY GROUP
COMMENT GROUP
FrequencyExpectedPercent
Row PctCol Pct CONT :SAMPLE Total
AGREE 2 1 0 1 21.15L9 0.8481
1.27 0.00 1.27100.00 0.00
2.20 0.00----------------
DISAGREE 11 16 1 2715.551 11.449 ;
6.96 1 10.13 17.0940.74 59.2612.09 23.88 1
-- -- - -4 -------------.
NEITHER 10 23 331 19.006 13.994
6.33 1 4.56 20 8930.30 69.7010.99 34.33
NR 60 20 046.076 33.924
1 37.97 I 12.66 50 6375 .00 25.0065 .93 1 29. 85
STRAGREE 1 0 I 10.5759 1 0.4241
0.00 I 0.63 0 630.00 100 .000.00 1 1.49
STRDISAG ' 8 1 7 158. 6392 6 . 3608
5.06 1 4.43 9 4953.33 46.67
8.79 1 10.45
Total 91 67 15857.59 42.41 100.00
ERRORS INCREASED WITH USING CASE TOOLS
STATISTICS FOR TABLE OF COMMENT BY GROUP
statistic DF Value Prob
Chi-Square 5 26.070 0.000Likelihood Ratio Chi-Square 5 27,690 0.000Mantel-Raenouel Chi-square 1 3.908 0.049Phi Coef f icient 0 406Cont inqency Coef f icient 0 376Cramer 's V 0.406sample Sill = 158
WARNING: 33% of the cells have expected counts lesthan S. Chi-Square may not be a valid test.
1-17

Table 1-17. Productivity Increased with Using CASE Tools
TABLE OF COMMENT BY GROUP
COMMENT GROUP
Frequency;ExpectedPercent
Row PctCol Pct ?CONT :SAMPLE Total
AGREE 18 15 3319.006 13.99411.39 9.49 20.8954.55 45.4519.78 22.39
DISAGREE 1 0 10.5759 0.4241 1
0.63 0.00 0 63100.00 0.00
1.10 0.00--------------------------- 4-
NEITHER 13 27 401 23.038 1 16.962
8.23 17.09 25 3232.50 67.5014.29 1 40.30 1----------------------------
NR 59 18 7744.348 32.65237.34 11.39 48 7376.62 23.3864.94 26.87
- 4-- - -- ------------ 4-
STRAGREE 0 6 63.4557 2.5443
0.00 3 80 3 800.00 100.000.00 8.96
-- - -- 4-- ------------ 4-
STRDISAG 0 1 10.5759 0.4241
0.00 0.63 0 630 .00 100 .000.00 1.49
- -4 - - - - --- - --
Total 91 67 15857.59 42.41 100.00
PRODUCTIVITY INCREASED WITH USING CASE TOOLS
STATISTICS FOR TABLE OF COMMENT BY GROUP
statistic DF Value Prob
Chi-Square 5 32.099 0.000Likelihood Ratio Chi-Square 5 35.710 0.000antel-Maenssel Chi-square 1 0.983 0.321
Phi Coet f ici ent 0 .451Contingency Coefficient 0.411Cramer ' s V 0. 451Sample size = 158
WARNING: 50% of the cells have expected counts lesthan 5. Chi-Square may not be a valid test.
1-18

Table 1-18. Development Costs Increased Using CASE Tools
TABLE OF COMMENT BY GROUP
COMMENT GROUP
Frequency!ExpectedPeceont
Row Pctcol Pct CONT :SAMPLE Total
----------4.-----4.-- - -
AGREE 5 6 116.3354 4.6646
3.16 3.80 6.9645.45 54.555.49 8.96
-- -- - -4 -------------
DISAGREE 11 13 2413.823 10.177
6.96 8.23 15.1945.83 54.1712.09 19.40
-- -- 4.- ------------ 4.
NEITHER 14 27 4123.614 1 17.386
8.86 17.09 25.9534.15 65.8515.38 1 40.30
NR 60 20 8046.076 33.924 37.97 12.66 50.6375.00 25.00 165.93 29.85
STRDISAG 1 1 1 1 21.1519 0.8481 1
0 . 63 0 . 63 I 1.2750.00 50.00 1
1.10 1.49 -- -- - -4 ------------- +
Total 91 67 15857.59 42.41 100.00
DEVELOPMENT COSTS INCREASED WITH USING CASE TOOLS
STATISTICS FOR TABLE OF COMMENT BY GROUP
Statistic DF Value Prob
Chi - Square 4 21 .224 0 .000Likelihood Ratio Chi-square 4 21.722 0.000Mantel -Haenszel Chi-Square 1 10.121 0.001Phi Coe ficient 0 .367Contingency Coefficient 0.344Cramer's V 0.367Sample size = 158
WARNING: 30% of the cells have expected counts lessthan 5. Chi-Squace may not be a valid test.
1-19

Table 1-19. Project Completion Time Increased Using CASE
Tools
TABLE OF COMMENT BY GROUP
COMMENT GROUP
FrequencyExpec'tedPercent
Row PctCol Pct 'CONT ;SAMPLE Total
---- 4.--------------------4.
AGREE 4 4 84.6076 3.3924
2.53 2.53 5.0650.00 50.004.40 5.97
-- -- - -- ------------ 4.
DISAGREE 14 18 3218.43 13.578.86 11.39 20.25
43.75 56.2515.38 26.87
-- - - - -4. ------ ----- 4.
NEITHER 13 23 3620.734 1 15.266
8.23 14.56 22.7836.11 63.8914.29 34.33
NR 60 20 801 46.076 33.924
37.97 12.66 50.63i 75.00 25.00
65.93 29.85
8TRDISAG 0 2 21.1519 0.8481 1
0.00 1.27 1.270.00 100.000.00 2.99
Total 91 67 15857.59 42.41 100.00
PROJECT COMPLETION TIME INCREASED WITH USING CASE TOOLS
STATISTIC8 FOR TABLE OF COMMENT BY GROUP
Statistic DF Value Prob------------------------------------------------------
Chi - Square 4 22 .143 0.000Likelihood Ratio Chi-Square 4 23.359 0.000Mantl- Haenasel Chi-Squaa 1 8 435 0.004Phi Coa f icient 0 374Contingency Coefficient 0.351Cramer 's V 0. 37 4Sample Sie a. 158
WARNING: 40% of the cells have expected counts lessthan 5. Chi-Square may not be a valid test.
1-20

Bibli ography
Akima, Noboru and Fisatke Ooi. "Industrializing SoftwareDevelopment: A Japanese Approach," IEEE Software, 6:13-21 (March 1989).
Arthur, J. D. and K. T. Stevens. "Assessing the Adequacy ofDocumentation Throagh Document Quality Indicators,"1989 IEEE Conference on Software Maintenanec.Washington DC: IEEE Computer Society Press, 1989.
Bartow, Capt Jules A. and Capt Marvin B. Key, Jr. Review CfAutomated Configuration Management in a Front End CASETool. [MGT 626 Project Report. School of Systems andLogistics, Air Force Institute of Technology (AU),Wright-Patterson AFB OH, September 1991.
Batt, Gary Thomas. CASE Technology and the SystemsDevelopment Life Cycle: A Proposed Integration of CASETools with DoD STD-2167A. MS Thesis, NavalPostgraduate School, Monterey CA, March 1989 (AD-A207844).
Bergland, C. David and others. "Improving the Front End ofthe Software Development Process for Large-ScaleSystems," AT&T Technical Joairnal, 69:7-21 (March/April1990).
Devore, Jay L. Probability and Statistics for Engineeringand the Sciences. Monterey CA: Biooks/Cole PublishingCompany, 1987.
Emory, C. William. Business Research Methods. Homewood 11.:Richard D. Irwin, Inc, 1985.
Feil, Stuart. "Tools of the Trade," Datamation, 35:57- 60
(September 1989).
Ferens, Daniel K. IMGT 676 Software Cost Estimation LectureNotes. Air Force Institute of Technology (AU), Wright-Patterson AFB OH. Spring 1991.
Frost, Lt Cmdr John Rirhard.Principles of SoftwareEngineering Environment Design. MS Thesis, NavalPostgraduate School, Monterey CA, June 1984
(AD-A150352).
Green, Robert. "%F Readies RFP for DoD CASE Tools."Government Computer News, 10:8 (Septem;,er 1991).
BIB-I

Grotzky, John and others. Requireminnts Analysis & DesignTool Report, 1991. Technical Report. SoftwareTechnology Support Center, Ogden ALC/TISAC (AFLC), HillAFB UT, 1991.
Ott, Lyman. An Introduction to Statistical Methods and DataAnalysis. Belmont CA. Wadsworth Publishing Company,Inc, 1977.
Phillips, Barry. "Software and CASE," Electronic Design,37:64-74 (January 1989).
RADC System/Software Requirements Fngineeering TestbedResearch & Development Program. Technical Report RADC-TR-88-75. Rome Air Development Center (AFSC), Griffis4FB NY, 1988.
Statland, Norman. "Payoffs Down the Pike: A Case Study,"Datamation, 35:32-33+ (April 1989).
Thomas, Tan. "PCTE Interfaces: Supvorting Tools in SoftwareEngineering Environments," IEEE Software, 6:15-23(November 1989).
Till, Johna. "CASE Tool Automatically Documents Code."Electronic Design, 37:164-166 (April 1989).
BIB-2

VITA
Captain Marvin B. Key, Jr. was born on 18 Jan 1960 in
Troy, North Carolina. After graduation from Scotland High
School in Laurinburg, North Carolina, in 1978, he graduated
from St. Andrews Presbyterian College in Laurinburg, North
Carolina in May 1982 with a Bachelor of Arts in Mathematics.
Captain Key entered the United States Air Force in June
1985. Upon graduation from Officer Training School in
September 1985, Captain Key was assigned to Headquarters Air
Force Space Command, Deputy Chief of Staff for Plans,
Missile Warning Directorate, Command, Control, and
Communications Division as deputy Command Manager of
facilities for the Communications System Segment Replacement
program. There, he was responsible for the planning and
preparation of the NORAD Cheyenne Mountain communications
subsystem installation. In December 1986, Captain Key was
assigned as Command Manager for the Ground Wave Emergency
Network where he was responsible for the acquisition of a
vital communications link between Cheyenne Mountain and its
sensor sites. In May 1990, Captain Key entered the Software
Systems Management Program in the School of Systems and
Logistics, Air Force Institute of Technology. Captain Key
is married to the former Kelly LeMaster of Petersburg VA.
They have three children: David, Sarah, and Andrew.
Permanent Address: 1005 Turnpike RoadLaurinburg, North Carolina 28352
VITA-1

REPOT DOUMETATIN PAE 1 Form ApprovedREPOT DCUMETATON PGE0MB No 0704-088
gathe ng ird iihti , q The j V3 ne .aed d ,j 1--et-: - n t rmtofl S nd conm ents - qad,,,n thS Durde n eti te Zr .5, trS r ,s >9 t ,' S
ccilecton )t nf-r atcO r I niq suggtest r : recu 'SQ th,s 5 : ! i -n e uar es Ser,ies Sredorate 'or nfr'raton O,'ra'.ors InC 4.D. tS S " 'J P'srOa,,% Hq',- iv Sufte 1204 -,,,qon. v A 22202 4302 wa t - I t j', qe entn etird -ud ! P Ir or Reducton Pspect (0704 0'88), Plasn-g tn -C ;0503
1. AGENCY USE ONLY (Leave blank) 2 REPORT DATE 3. REPORT TYPE AND DATES COVERED
I' Th-ig4. TITLE AND SUBTITLE 5. FUNDING NUMBERS
REDUCING REQUIREETS ERRORS THROUGH THE USE OFCWPTER-AIDED SOF'NARE ENGINEERING (CASE) TOOLSDURING REXX IRPNTS ANALYSIS6. AUTHOR(S)
Marvin B. Key, Jr., Capt, USAF
7. PERFORMING ORGANIZATION NAME(S) AND ADDRESS(ES) 8. PERFORMING ORGANIZATIONREPORT NUMBER
Air Force Institute of Technology, WPAFB OH 45433-6583 AFIT/GSS/ENG/91D-07
9. SPONSORING ,'MONITORING AGENCY NAME(S) AND ADDRESS(ES) 10. SPONSORING, MONITORINGAGENCY REPORT NUMBER
11. cUPPLEMENTARY NOTES
12a. DISTRIBUTION AVAILABILITY STATEMENT 12b. DISTRIBUTION CODE
Approved for public release; distribution unlimited
13. ABSTRACT (Maximum 200 words)
This study investigated whether using CASE tools in the requirenents analysisphase of software development reduced the software coding errors attributable torequirements analysis. A survey of the population gathered data as to the currentpractices and efforts in the use of CASE tools. The data was gathered in twogroups: a control group and a sample group. The data was analyzed by group and invarious combinations to obtain a greater understanding into the population trendsand tendencies. The results of the research indicate that the Air Force does notuse CASE tools to any great extent. Also, error "and cost data are not tracked ina meaningful way either. The conclusion drawn from this research shows that CASEtool use is still in its infancy and needs to begin rapid growth in order to speedup developments and reduce rosts with the constantly shrinking budget. The majorrecommendation by the author is to perform a more detailed study of the populationto determine exactly where CASE tools are being used and where improvements needto be made.
14. SUBJECT TERMS 15. NUMBER OF PAGES
Software Engineering, Systems Engineering, Systems Design, 154Computer Programs 16. PRICE CODE
17. SECURITY CLASSIFICATION 18. SECURITY CLASSIFICATION 19. SECURITY CLASSIFICATION 20. LIMITATION OF ABSTRACTOF REPORT1 OF THIS PAGE1 OF ABSTRACT
Unclassified Unclassified Unclassified ULNSN 7520 0 280-5500 S*a-cla'ci -''rm '98 Ri-v . 892

AFIT Control Number AFIT/GSS/ENG/91D-07
AFIT RESEARCH ASSESSMENT
The purpose of this questionnaire is to determine the potential for cur-rent and future applications of AFIT thesis research. Pleasc returncompleted questionnaires to: AFIT/LSC, Wright-Patterson AFB OH45433-6583.
1. Did this research contribute to a current research project?
a. Yes b. No
2. Do you believe this research topic is significant enough that it wouldhave been researched (or contracted) by your organization or anotheragency if AFIT had not researched it?
a. Yes b. No
3. The benefits of AFIT research can often be expressed by the equivalentvalue that your agency received by virtue of AFIT performing the research.Please estimate what this research would have cost in terms of manpowerand/or dollars if it had been accomplished under contract or if it hadbeen done in-house.
Man Years $
4. Often it is not possible to attach equivalent dollar values toresearch, although the results of the research may, in fact, be important.Whether or not you were able to establish an equivalent value for thisresearch (3 above), what is your estimate of its significance?
a. Highly b. Significant c. Slightly d. Of NoSi gni ficant Significant Significance
5. Comments
Name and Grade Organization
Position or Title Address


![Control charts[1]](https://img.pdfslide.us/doc/110x75/559b746a1a28ab744f8b4634/control-charts1-559c077e1e7b6.jpg)