Embed Size (px)
Citation preview
DISASTER RESILIENCE FRAMEWORK
25% Draft for Hoboken, NJ, Workshop
9. Water and Wastewater Sector
Introduction 9.1.
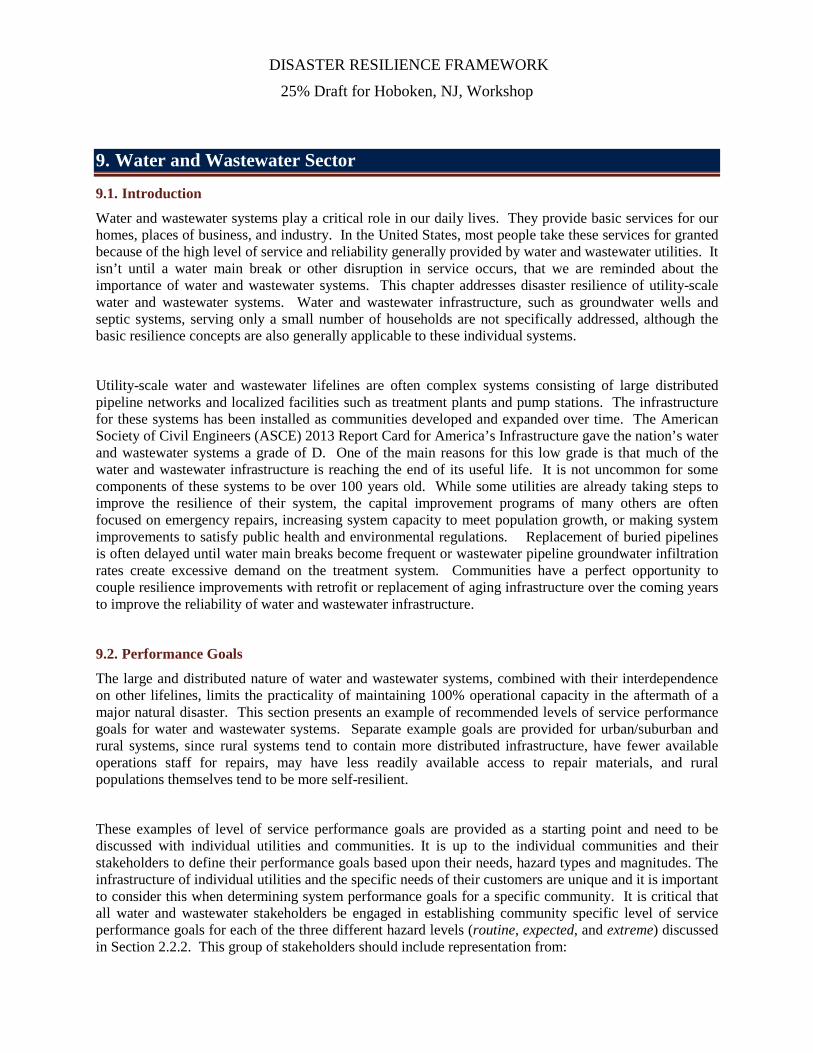
Water and wastewater systems play a critical role in our daily lives. They provide basic services for our homes, places of business, and industry. In the United States, most people take these services for granted because of the high level of service and reliability generally provided by water and wastewater utilities. It isn’t until a water main break or other disruption in service occurs, that we are reminded about the importance of water and wastewater systems. This chapter addresses disaster resilience of utility-scale water and wastewater systems. Water and wastewater infrastructure, such as groundwater wells and septic systems, serving only a small number of households are not specifically addressed, although the basic resilience concepts are also generally applicable to these individual systems.
Utility-scale water and wastewater lifelines are often complex systems consisting of large distributed pipeline networks and localized facilities such as treatment plants and pump stations. The infrastructure for these systems has been installed as communities developed and expanded over time. The American Society of Civil Engineers (ASCE) 2013 Report Card for America’s Infrastructure gave the nation’s water and wastewater systems a grade of D. One of the main reasons for this low grade is that much of the water and wastewater infrastructure is reaching the end of its useful life. It is not uncommon for some components of these systems to be over 100 years old. While some utilities are already taking steps to improve the resilience of their system, the capital improvement programs of many others are often focused on emergency repairs, increasing system capacity to meet population growth, or making system improvements to satisfy public health and environmental regulations. Replacement of buried pipelines is often delayed until water main breaks become frequent or wastewater pipeline groundwater infiltration rates create excessive demand on the treatment system. Communities have a perfect opportunity to couple resilience improvements with retrofit or replacement of aging infrastructure over the coming years to improve the reliability of water and wastewater infrastructure.
Performance Goals 9.2.
The large and distributed nature of water and wastewater systems, combined with their interdependence on other lifelines, limits the practicality of maintaining 100% operational capacity in the aftermath of a major natural disaster. This section presents an example of recommended levels of service performance goals for water and wastewater systems. Separate example goals are provided for urban/suburban and rural systems, since rural systems tend to contain more distributed infrastructure, have fewer available operations staff for repairs, may have less readily available access to repair materials, and rural populations themselves tend to be more self-resilient.
These examples of level of service performance goals are provided as a starting point and need to be discussed with individual utilities and communities. It is up to the individual communities and their stakeholders to define their performance goals based upon their needs, hazard types and magnitudes. The infrastructure of individual utilities and the specific needs of their customers are unique and it is important to consider this when determining system performance goals for a specific community. It is critical that all water and wastewater stakeholders be engaged in establishing community specific level of service performance goals for each of the three different hazard levels (routine, expected, and extreme) discussed in Section 2.2.2. This group of stakeholders should include representation from:
DISASTER RESILIENCE FRAMEWORK
25% Draft for Hoboken, NJ, Workshop
• Residential customers
• Business customers
• Industrial customers (if applicable)
• Water wholesale customers (if applicable)
• Hospital customers (if applicable)
• Fire fighters
• Local government officials
• Local emergency management officials
• Drinking water regulators (Health Authority, etc.)
• Wastewater regulators (Dept. of Environmental Quality, Environmental Protection Agency, etc.)
• Water and wastewater utility operators and engineers
• Consulting engineers
• Interdependent lifelines (power, liquid fuel, transportation, etc.)
The process of establishing performance goals involves a discussion amongst the various stakeholders about their expectations for the availability of water and wastewater systems during the post-disaster response and recover phases for different hazard levels (e.g., routine, expected, and extreme). The typically assumed expectation of the general public is that for routine disasters there would be little, if any, interruption of service for water and wastewater systems. A dialogue is required between utilities and customers in order to determine the appropriate level of service performance goals for expected and extreme events. There may be certain elements in a system that are so critical to the public safety that they need to be designed to remain operational after an extreme event. For example, the failure of a water supply impoundment dam would present a significant life-safety hazard to downstream residents, and should be designed for an extreme event. Interdependencies of water and wastewater systems with other lifelines also need to be considered when developing performance goals. For instance, the availability of a reliable supply of liquid fuel impacts how long systems can be run on backup emergency generators and also impacts the vehicles and equipment needed by repair crews. Delivery of liquid fuels is in turn dependent on the status of the highway and bridge transportation network.
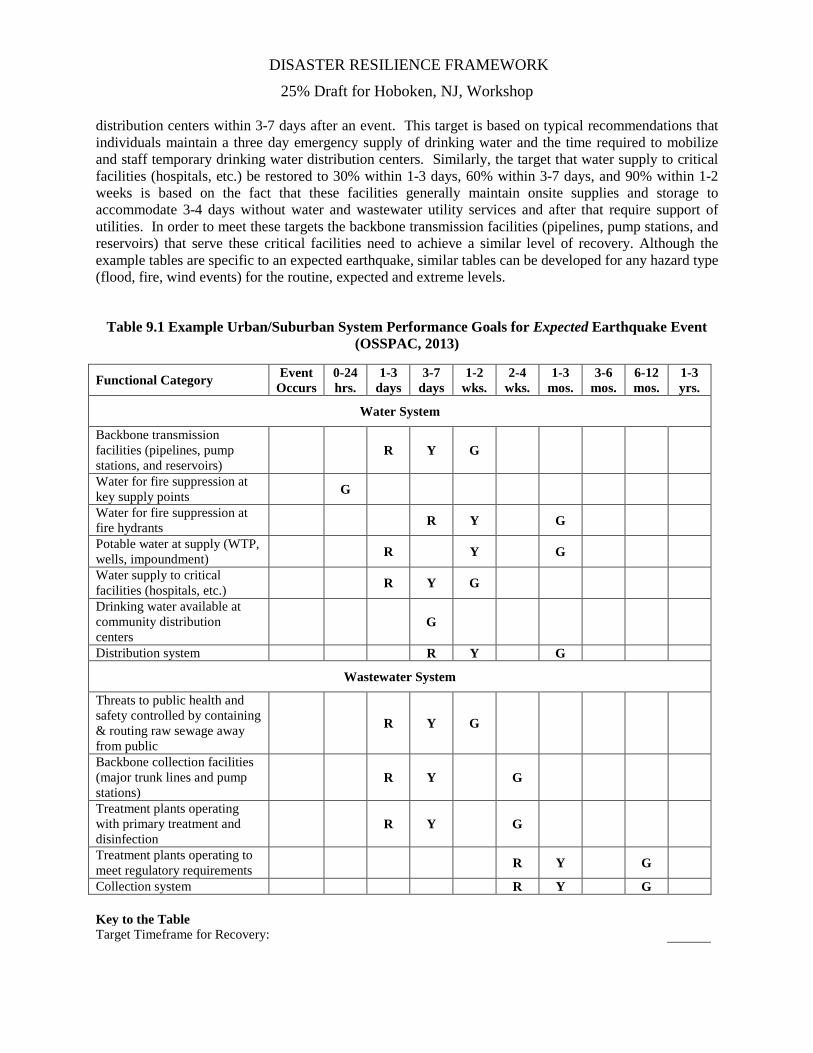
Tables 9.1 and 9.2 provide example water and wastewater system performance goals for post-disaster response and recovery for an expected earthquake event. The performance goals are broken down into functional categories (i.e. water for fire suppression at key supply points, treatment plants operating to meet regulatory requirements, etc.) and further broken down into target timelines to restore the functional categories to 30%, 60%, and 90% operational status. It is assumed that the financial burden associated with upgrading all components of an entire system to be more disaster resilient would overwhelm the short-term capital improvement budgets of most utilities. Therefore, performance goals should be established around the concept of a hardened backbone system. This backbone network should be capable of supplying key health and safety related community needs shortly after a disaster, while more extensive repairs are being completed on the remainder of the system. Performance goals, in the example tables, were established based on a balance of societal needs and realistic expectations of system performance. For example, Table 9.1 indicates that drinking water should be available at community
DISASTER RESILIENCE FRAMEWORK
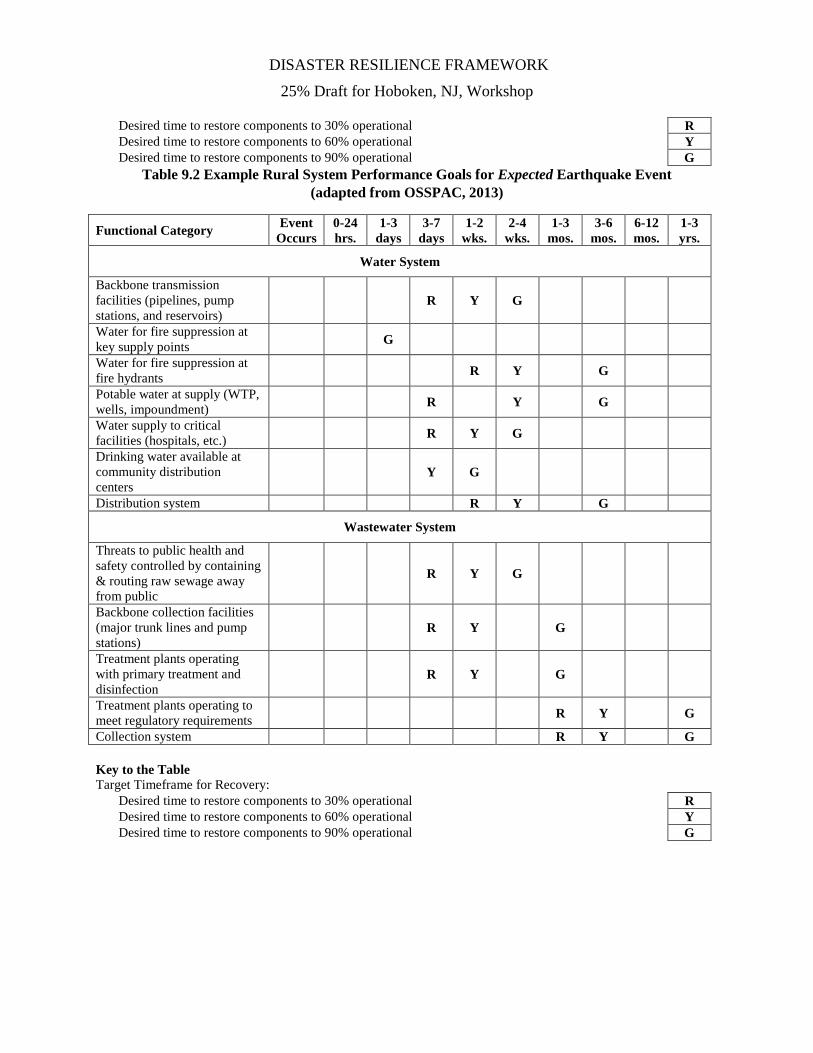
25% Draft for Hoboken, NJ, Workshop distribution centers within 3-7 days after an event. This target is based on typical recommendations that individuals maintain a three day emergency supply of drinking water and the time required to mobilize and staff temporary drinking water distribution centers. Similarly, the target that water supply to critical facilities (hospitals, etc.) be restored to 30% within 1-3 days, 60% within 3-7 days, and 90% within 1-2 weeks is based on the fact that these facilities generally maintain onsite supplies and storage to accommodate 3-4 days without water and wastewater utility services and after that require support of utilities. In order to meet these targets the backbone transmission facilities (pipelines, pump stations, and reservoirs) that serve these critical facilities need to achieve a similar level of recovery. Although the example tables are specific to an expected earthquake, similar tables can be developed for any hazard type (flood, fire, wind events) for the routine, expected and extreme levels.
Table 9.1 Example Urban/Suburban System Performance Goals for Expected Earthquake Event (OSSPAC, 2013)
Functional Category Event Occurs
0-24 hrs.
1-3 days
3-7 days
1-2 wks.
2-4 wks.
1-3 mos.
3-6 mos.
6-12 mos.
1-3 yrs.
Water System
Backbone transmission facilities (pipelines, pump stations, and reservoirs)
R Y G
Water for fire suppression at key supply points G
Water for fire suppression at fire hydrants R Y G
Potable water at supply (WTP, wells, impoundment) R Y G
Water supply to critical facilities (hospitals, etc.) R Y G
Drinking water available at community distribution centers
G
Distribution system R Y G
Wastewater System
Threats to public health and safety controlled by containing & routing raw sewage away from public
R Y G
Backbone collection facilities (major trunk lines and pump stations)
R Y G
Treatment plants operating with primary treatment and disinfection
R Y G
Treatment plants operating to meet regulatory requirements R Y G
Collection system R Y G Key to the Table Target Timeframe for Recovery:
DISASTER RESILIENCE FRAMEWORK
25% Draft for Hoboken, NJ, Workshop
Desired time to restore components to 30% operational R Desired time to restore components to 60% operational Y Desired time to restore components to 90% operational G
Table 9.2 Example Rural System Performance Goals for Expected Earthquake Event (adapted from OSSPAC, 2013)
Functional Category Event
Occurs 0-24 hrs.
1-3 days
3-7 days
1-2 wks.
2-4 wks.
1-3 mos.
3-6 mos.
6-12 mos.
1-3 yrs.
Water System
Backbone transmission facilities (pipelines, pump stations, and reservoirs)
R Y G
Water for fire suppression at key supply points G
Water for fire suppression at fire hydrants R Y G
Potable water at supply (WTP, wells, impoundment) R Y G
Water supply to critical facilities (hospitals, etc.) R Y G
Drinking water available at community distribution centers
Y G
Distribution system R Y G
Wastewater System
Threats to public health and safety controlled by containing & routing raw sewage away from public
R Y G
Backbone collection facilities (major trunk lines and pump stations)
R Y G
Treatment plants operating with primary treatment and disinfection
R Y G
Treatment plants operating to meet regulatory requirements R Y G
Collection system R Y G Key to the Table Target Timeframe for Recovery:
Desired time to restore components to 30% operational R Desired time to restore components to 60% operational Y Desired time to restore components to 90% operational G
DISASTER RESILIENCE FRAMEWORK
25% Draft for Hoboken, NJ, Workshop
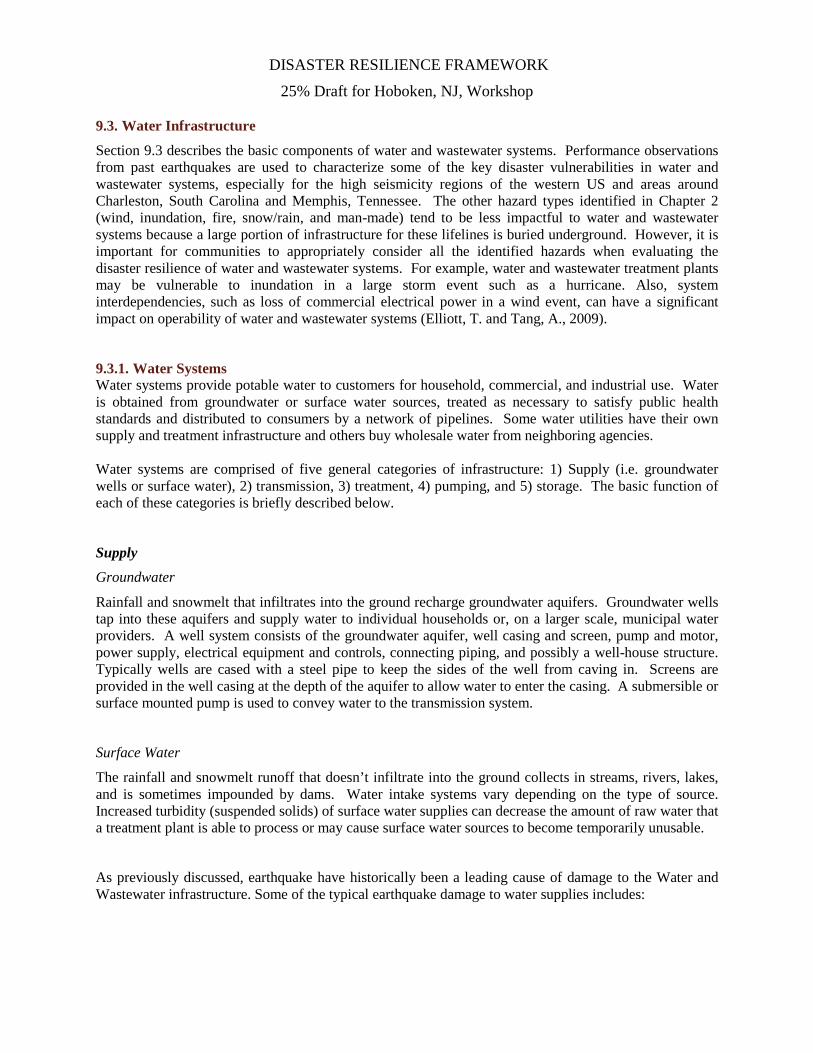
Water Infrastructure 9.3.
Section 9.3 describes the basic components of water and wastewater systems. Performance observations from past earthquakes are used to characterize some of the key disaster vulnerabilities in water and wastewater systems, especially for the high seismicity regions of the western US and areas around Charleston, South Carolina and Memphis, Tennessee. The other hazard types identified in Chapter 2 (wind, inundation, fire, snow/rain, and man-made) tend to be less impactful to water and wastewater systems because a large portion of infrastructure for these lifelines is buried underground. However, it is important for communities to appropriately consider all the identified hazards when evaluating the disaster resilience of water and wastewater systems. For example, water and wastewater treatment plants may be vulnerable to inundation in a large storm event such as a hurricane. Also, system interdependencies, such as loss of commercial electrical power in a wind event, can have a significant impact on operability of water and wastewater systems (Elliott, T. and Tang, A., 2009).
9.3.1. Water Systems Water systems provide potable water to customers for household, commercial, and industrial use. Water is obtained from groundwater or surface water sources, treated as necessary to satisfy public health standards and distributed to consumers by a network of pipelines. Some water utilities have their own supply and treatment infrastructure and others buy wholesale water from neighboring agencies. Water systems are comprised of five general categories of infrastructure: 1) Supply (i.e. groundwater wells or surface water), 2) transmission, 3) treatment, 4) pumping, and 5) storage. The basic function of each of these categories is briefly described below.
Supply
Groundwater
Rainfall and snowmelt that infiltrates into the ground recharge groundwater aquifers. Groundwater wells tap into these aquifers and supply water to individual households or, on a larger scale, municipal water providers. A well system consists of the groundwater aquifer, well casing and screen, pump and motor, power supply, electrical equipment and controls, connecting piping, and possibly a well-house structure. Typically wells are cased with a steel pipe to keep the sides of the well from caving in. Screens are provided in the well casing at the depth of the aquifer to allow water to enter the casing. A submersible or surface mounted pump is used to convey water to the transmission system.
Surface Water
The rainfall and snowmelt runoff that doesn’t infiltrate into the ground collects in streams, rivers, lakes, and is sometimes impounded by dams. Water intake systems vary depending on the type of source. Increased turbidity (suspended solids) of surface water supplies can decrease the amount of raw water that a treatment plant is able to process or may cause surface water sources to become temporarily unusable.
As previously discussed, earthquake have historically been a leading cause of damage to the Water and Wastewater infrastructure. Some of the typical earthquake damage to water supplies includes:
DISASTER RESILIENCE FRAMEWORK
25% Draft for Hoboken, NJ, Workshop
• Well casing and well discharge piping has been damaged by earthquake induced permanent ground displacement. The force of this moving ground has bent well casings and bent and broken well discharge piping.
• In the 1971 San Fernando earthquake in Southern California, the Lower San Fernando Dam experienced a landslide and near failure that lowered the crest of the dam about 30 ft and put 80,000 people at significant risk while the impounded water level was being lowered. These types of dam failures are very rare, but present a very significant life-safety risk to anyone downstream of a dam. Dams are an example of critical infrastructure components that need to be designed to withstand very rare extreme events.
• In the 2008 Wenchuan China earthquake, many landslides occurred in the mountainous region. These landslides increase the turbidity of local waterways and can lead to water quality and treatment issues if these waterways are used as the raw water source for drinking water systems. The natural landslide dams that formed when these debris flows blocked rivers have the potential to disrupt surface water supplies. (These landslide dams also present a threat to upstream communities due to flooding from impounded water and a significant life-safety hazard to downstream communities when they fail during an aftershock or are overtopped and breached suddenly.)
• In the 2011 Tohoku earthquake in Japan the tsunami resulted in inundation of several fresh water intake facilities with sea water. These water intakes were unusable for a long period of time due to the high concentration of salts in the water (Miyajima, 2012).
Transmission
Water system transmission and distribution pipelines are a significant asset class for water utilities. Large water utilities may have a network consisting of thousands of miles of pipelines. Typically these pipelines operate under pressure and are buried 2 ½ to 6 feet or deeper underground, making them difficult to inspect and expensive and disruptive to repair. Pipeline material and joint type significantly influence the performance of a pipeline when it is located in an area subjected to permanent ground deformation occurring in an earthquake or landslide. Table 9.3 provides a summary of commonly in-place and currently used pipeline materials and joint types, along with their applicable American Water Works Association (AWWA) standard. Materials and joint types with no designated standard are no longer manufactured, but represent a significant portion of the installed pipelines in the US.
Transmission Pipelines
Large diameter (> 12-in.) transmission pipelines typically carry raw water from a source to the treatment plant and treated water to storage facilities and various sectors of a community before the pipelines branch out into smaller diameter distribution pipelines. Transmission pipelines can be thought of as the backbone of the pipeline system.
Distribution Pipelines
Smaller diameter (d 12-in.) distribution pipelines carry treated water from transmission pipelines to neighborhoods and industrial areas. For some smaller utilities, major transmission lines may also fall in this diameter range. Service connections branch off of distribution pipelines to supply individual customers. The portion of the service connection before the water meter is typically maintained by the water utility and the portion after the water meter is the responsibility of the individual customer.
DISASTER RESILIENCE FRAMEWORK
25% Draft for Hoboken, NJ, Workshop
Typical earthquake damage to water pipelines includes:
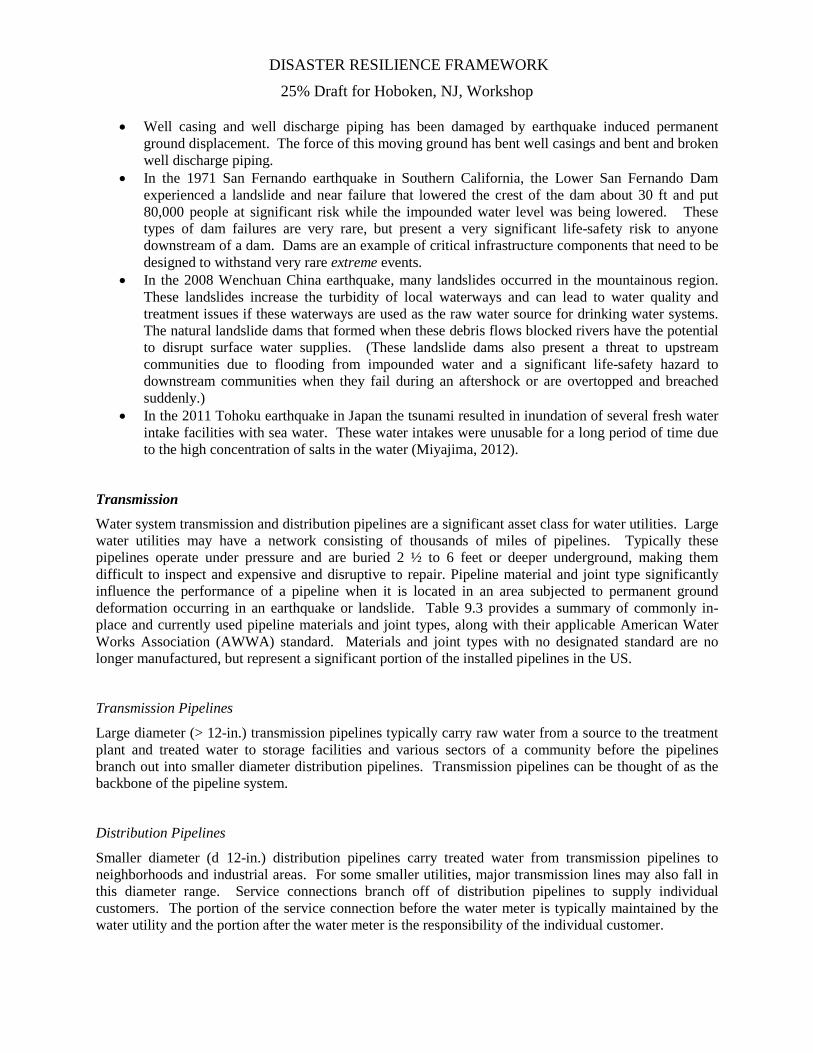
• Breaks and leaks in buried water pipelines are one of the largest earthquake damage mechanisms in water systems. The term leak commonly refers to relatively minor damage to a pipe barrel or joint that results in minor to moderate water loss, but does not significantly impair the function of the distribution system. The term break commonly refers to major damage to a pipe barrel or joint that results in major water loss that may cause loss of pressure in a particular zone or nearby tanks to completely drain. Pipeline leaks and breaks often cause collateral damage to adjacent infrastructure. Figure 9.1 shows the geyser from a water pipeline break in the 2011 Christchurch earthquake in New Zealand and the damage it caused to the roadway. A major contributing cause of pipeline breaks and leaks is due to liquefaction induced permanent ground displacement. Large strains develop in pipelines at the movement boundaries between areas that did and did not experience permanent ground displacement. Another location of potential damage from permanent ground displacement is where pipelines cross active faults. Pipelines have failed in past earthquakes at fault crossings that were not explicitly designed for the expected fault movement.
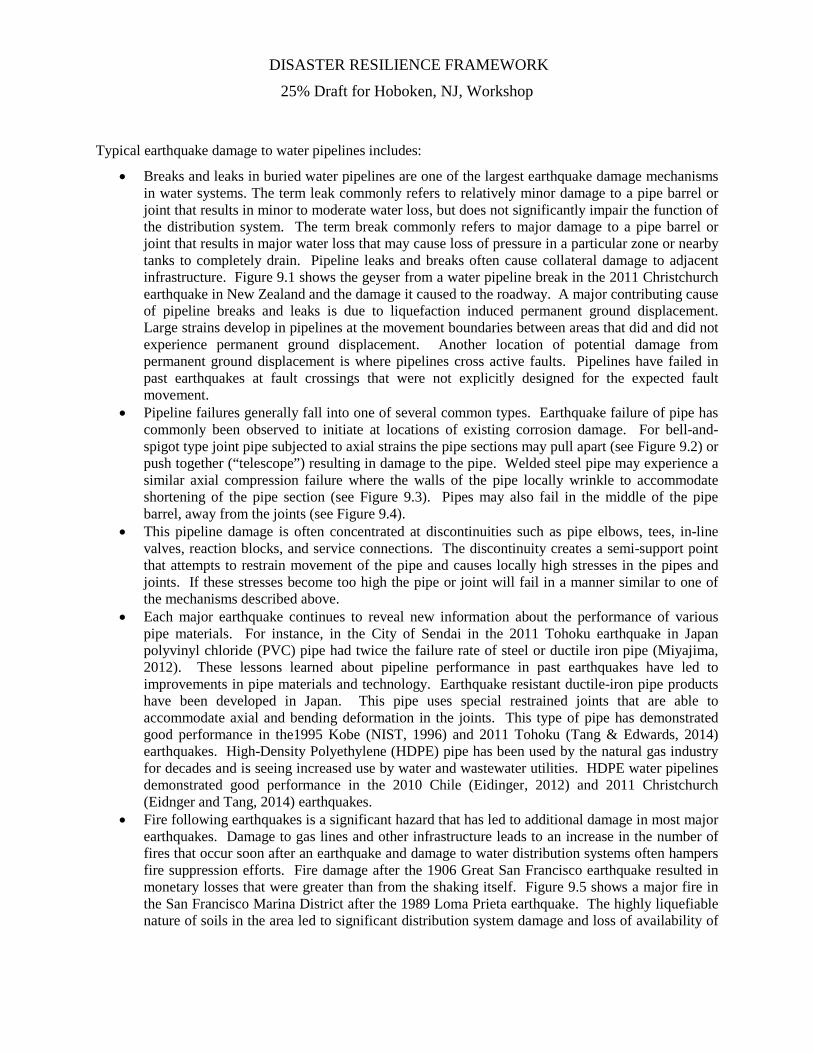
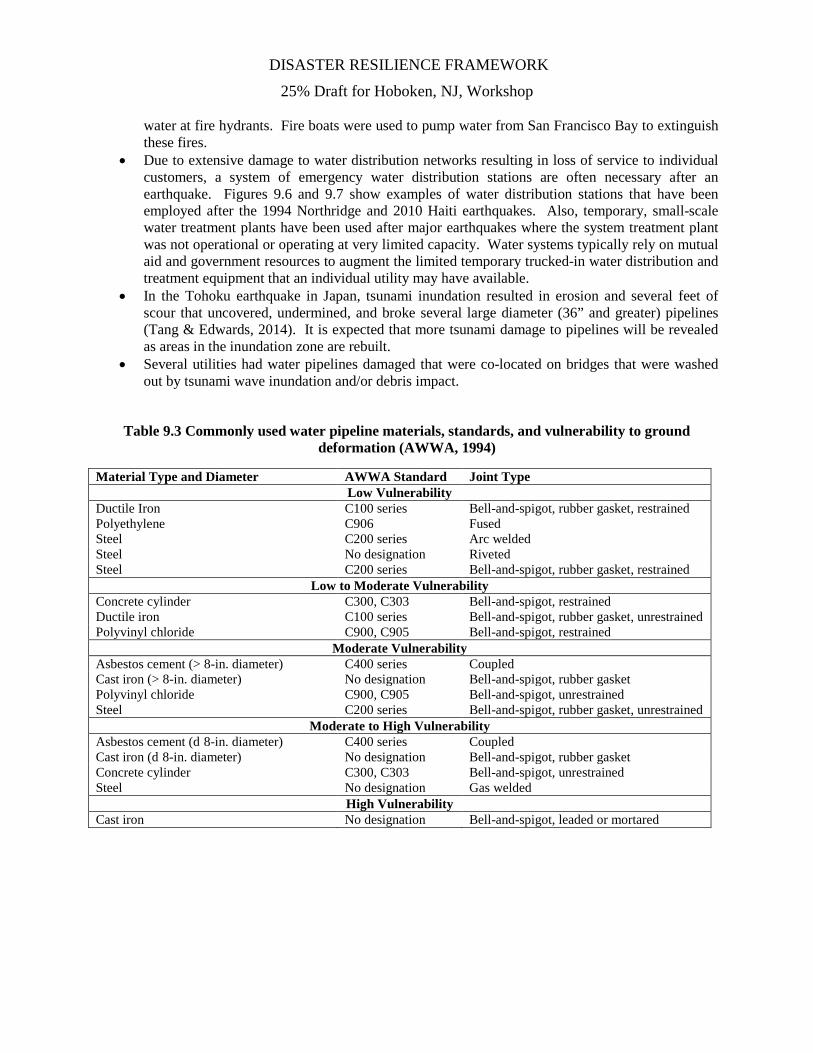
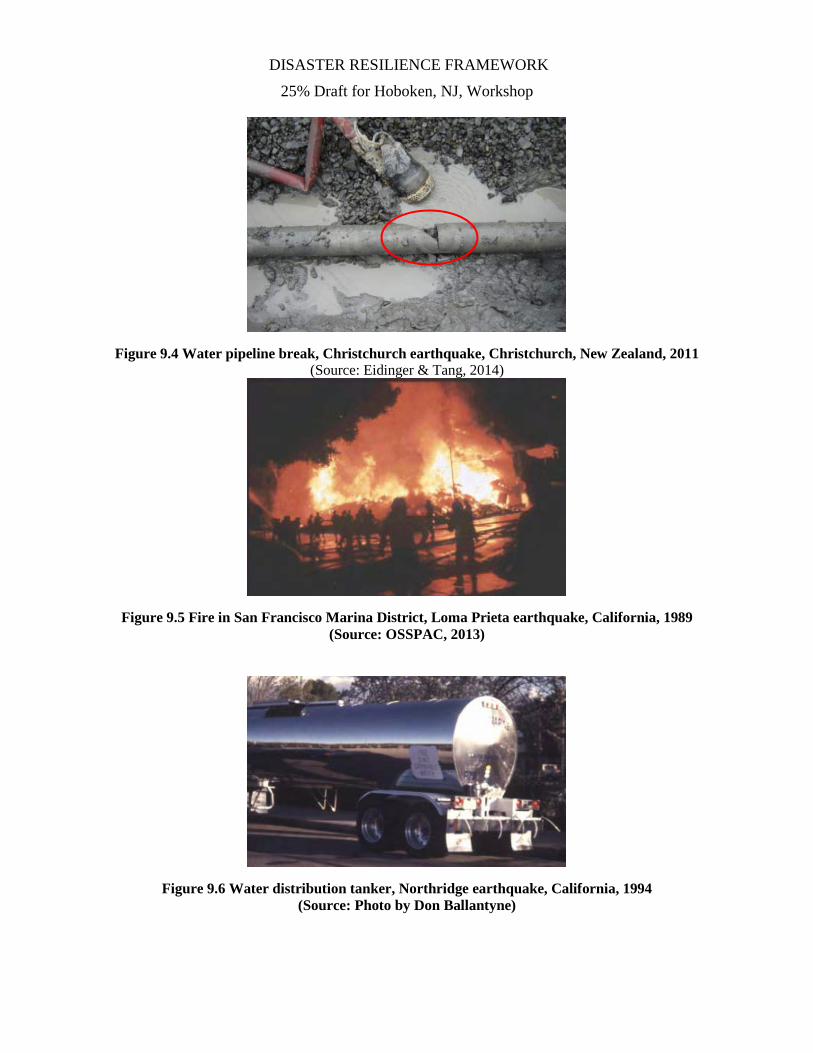
• Pipeline failures generally fall into one of several common types. Earthquake failure of pipe has commonly been observed to initiate at locations of existing corrosion damage. For bell-and-spigot type joint pipe subjected to axial strains the pipe sections may pull apart (see Figure 9.2) or push together (“telescope”) resulting in damage to the pipe. Welded steel pipe may experience a similar axial compression failure where the walls of the pipe locally wrinkle to accommodate shortening of the pipe section (see Figure 9.3). Pipes may also fail in the middle of the pipe barrel, away from the joints (see Figure 9.4).
• This pipeline damage is often concentrated at discontinuities such as pipe elbows, tees, in-line valves, reaction blocks, and service connections. The discontinuity creates a semi-support point that attempts to restrain movement of the pipe and causes locally high stresses in the pipes and joints. If these stresses become too high the pipe or joint will fail in a manner similar to one of the mechanisms described above.
• Each major earthquake continues to reveal new information about the performance of various pipe materials. For instance, in the City of Sendai in the 2011 Tohoku earthquake in Japan polyvinyl chloride (PVC) pipe had twice the failure rate of steel or ductile iron pipe (Miyajima, 2012). These lessons learned about pipeline performance in past earthquakes have led to improvements in pipe materials and technology. Earthquake resistant ductile-iron pipe products have been developed in Japan. This pipe uses special restrained joints that are able to accommodate axial and bending deformation in the joints. This type of pipe has demonstrated good performance in the1995 Kobe (NIST, 1996) and 2011 Tohoku (Tang & Edwards, 2014) earthquakes. High-Density Polyethylene (HDPE) pipe has been used by the natural gas industry for decades and is seeing increased use by water and wastewater utilities. HDPE water pipelines demonstrated good performance in the 2010 Chile (Eidinger, 2012) and 2011 Christchurch (Eidnger and Tang, 2014) earthquakes.
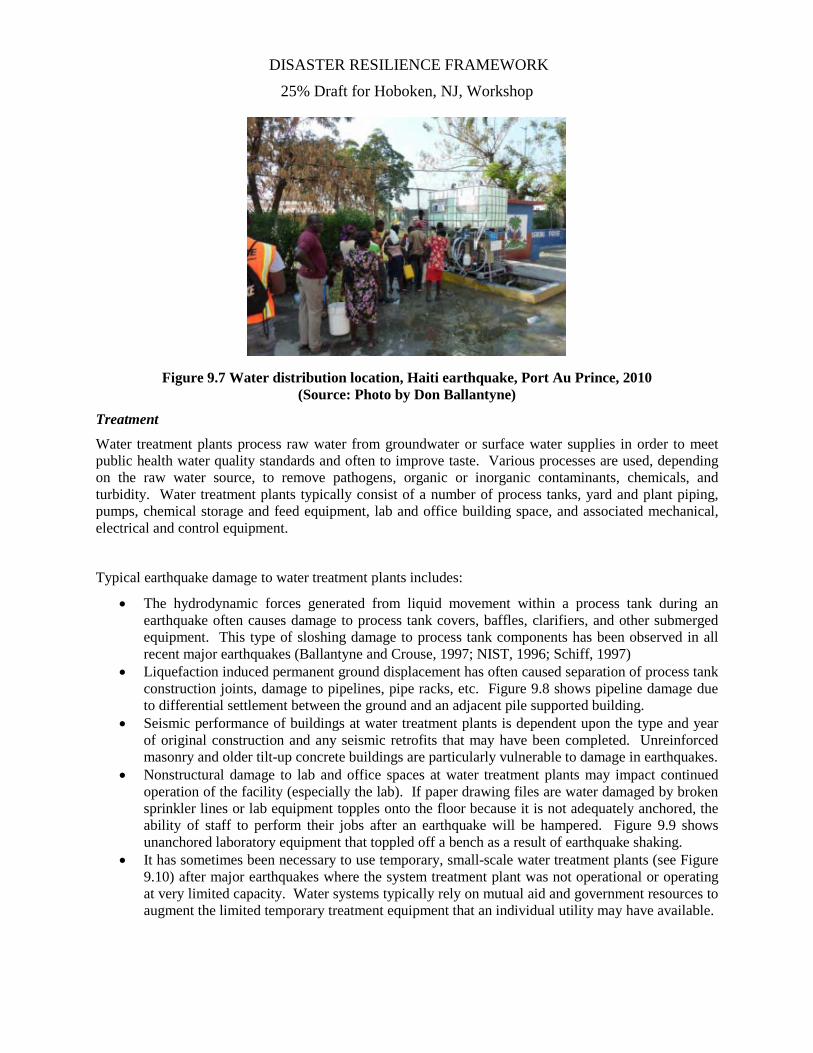
• Fire following earthquakes is a significant hazard that has led to additional damage in most major earthquakes. Damage to gas lines and other infrastructure leads to an increase in the number of fires that occur soon after an earthquake and damage to water distribution systems often hampers fire suppression efforts. Fire damage after the 1906 Great San Francisco earthquake resulted in monetary losses that were greater than from the shaking itself. Figure 9.5 shows a major fire in the San Francisco Marina District after the 1989 Loma Prieta earthquake. The highly liquefiable nature of soils in the area led to significant distribution system damage and loss of availability of
DISASTER RESILIENCE FRAMEWORK
25% Draft for Hoboken, NJ, Workshop
water at fire hydrants. Fire boats were used to pump water from San Francisco Bay to extinguish these fires.
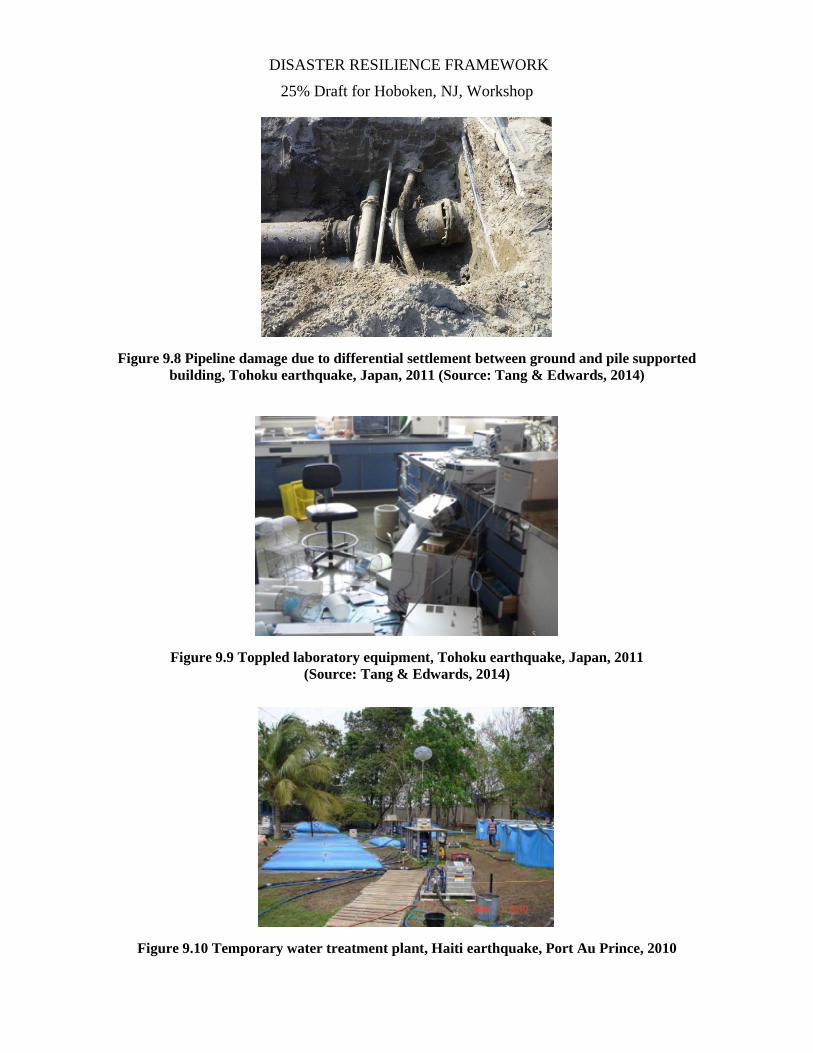
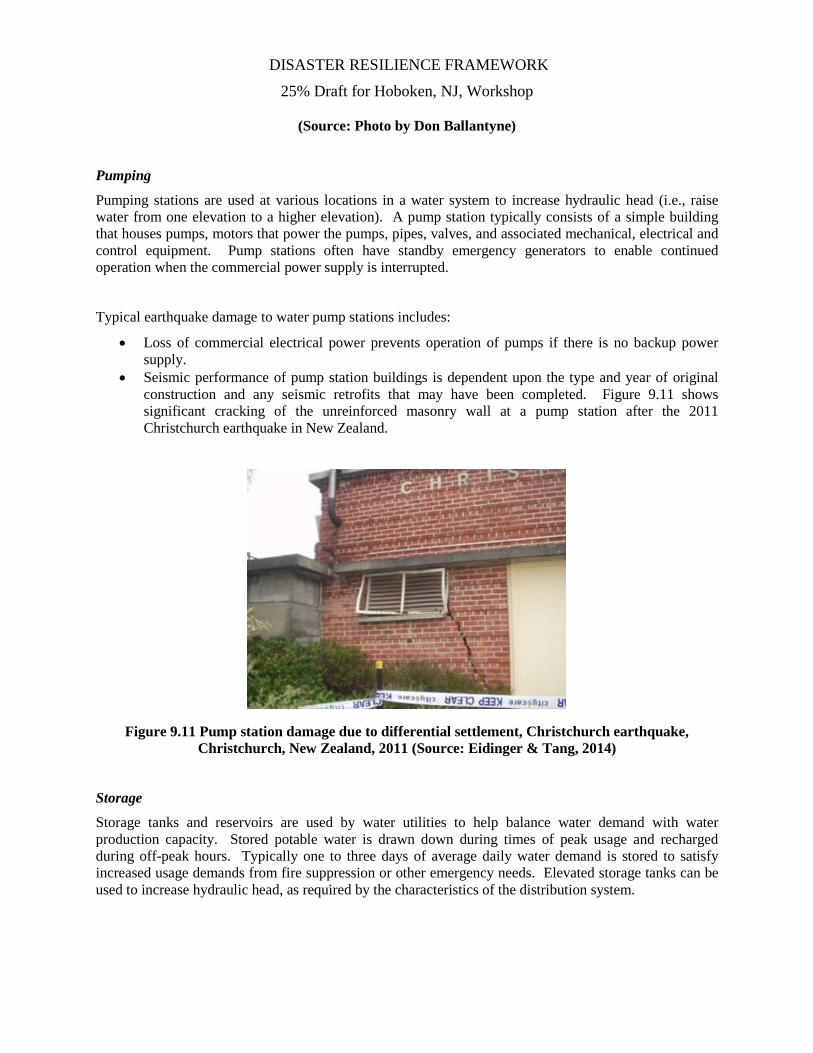
• Due to extensive damage to water distribution networks resulting in loss of service to individual customers, a system of emergency water distribution stations are often necessary after an earthquake. Figures 9.6 and 9.7 show examples of water distribution stations that have been employed after the 1994 Northridge and 2010 Haiti earthquakes. Also, temporary, small-scale water treatment plants have been used after major earthquakes where the system treatment plant was not operational or operating at very limited capacity. Water systems typically rely on mutual aid and government resources to augment the limited temporary trucked-in water distribution and treatment equipment that an individual utility may have available.
• In the Tohoku earthquake in Japan, tsunami inundation resulted in erosion and several feet of scour that uncovered, undermined, and broke several large diameter (36” and greater) pipelines (Tang & Edwards, 2014). It is expected that more tsunami damage to pipelines will be revealed as areas in the inundation zone are rebuilt.
• Several utilities had water pipelines damaged that were co-located on bridges that were washed out by tsunami wave inundation and/or debris impact.
Table 9.3 Commonly used water pipeline materials, standards, and vulnerability to ground deformation (AWWA, 1994)
Material Type and Diameter AWWA Standard Joint Type Low Vulnerability
Ductile Iron C100 series Bell-and-spigot, rubber gasket, restrained Polyethylene C906 Fused Steel C200 series Arc welded Steel No designation Riveted Steel C200 series Bell-and-spigot, rubber gasket, restrained
Low to Moderate Vulnerability Concrete cylinder C300, C303 Bell-and-spigot, restrained Ductile iron C100 series Bell-and-spigot, rubber gasket, unrestrained Polyvinyl chloride C900, C905 Bell-and-spigot, restrained
Moderate Vulnerability Asbestos cement (> 8-in. diameter) C400 series Coupled Cast iron (> 8-in. diameter) No designation Bell-and-spigot, rubber gasket Polyvinyl chloride C900, C905 Bell-and-spigot, unrestrained Steel C200 series Bell-and-spigot, rubber gasket, unrestrained
Moderate to High Vulnerability Asbestos cement (d 8-in. diameter) C400 series Coupled Cast iron (d 8-in. diameter) No designation Bell-and-spigot, rubber gasket Concrete cylinder C300, C303 Bell-and-spigot, unrestrained Steel No designation Gas welded
High Vulnerability Cast iron No designation Bell-and-spigot, leaded or mortared
DISASTER RESILIENCE FRAMEWORK
25% Draft for Hoboken, NJ, Workshop
Figure 9.1 Water pipeline break, Christchurch earthquake, Christchurch, New Zealand, 2011 (Source: Eidinger & Tang, 2014)
Figure 9.2 Pipeline separated, Great Hyogoken-Nanbu earthquake, Kobe, Japan, 1995 (Source: OSSPAC, 2013)
Figure 9.3 Welded steel pipe compression failure, San Fernando earthquake, California, 1971 (Source: OSSPAC, 2013)
DISASTER RESILIENCE FRAMEWORK
25% Draft for Hoboken, NJ, Workshop
Figure 9.4 Water pipeline break, Christchurch earthquake, Christchurch, New Zealand, 2011 (Source: Eidinger & Tang, 2014)
Figure 9.5 Fire in San Francisco Marina District, Loma Prieta earthquake, California, 1989 (Source: OSSPAC, 2013)
Figure 9.6 Water distribution tanker, Northridge earthquake, California, 1994 (Source: Photo by Don Ballantyne)
DISASTER RESILIENCE FRAMEWORK
25% Draft for Hoboken, NJ, Workshop
Figure 9.7 Water distribution location, Haiti earthquake, Port Au Prince, 2010 (Source: Photo by Don Ballantyne)
Treatment
Water treatment plants process raw water from groundwater or surface water supplies in order to meet public health water quality standards and often to improve taste. Various processes are used, depending on the raw water source, to remove pathogens, organic or inorganic contaminants, chemicals, and turbidity. Water treatment plants typically consist of a number of process tanks, yard and plant piping, pumps, chemical storage and feed equipment, lab and office building space, and associated mechanical, electrical and control equipment.
Typical earthquake damage to water treatment plants includes:
• The hydrodynamic forces generated from liquid movement within a process tank during an earthquake often causes damage to process tank covers, baffles, clarifiers, and other submerged equipment. This type of sloshing damage to process tank components has been observed in all recent major earthquakes (Ballantyne and Crouse, 1997; NIST, 1996; Schiff, 1997)
• Liquefaction induced permanent ground displacement has often caused separation of process tank construction joints, damage to pipelines, pipe racks, etc. Figure 9.8 shows pipeline damage due to differential settlement between the ground and an adjacent pile supported building.
• Seismic performance of buildings at water treatment plants is dependent upon the type and year of original construction and any seismic retrofits that may have been completed. Unreinforced masonry and older tilt-up concrete buildings are particularly vulnerable to damage in earthquakes.
• Nonstructural damage to lab and office spaces at water treatment plants may impact continued operation of the facility (especially the lab). If paper drawing files are water damaged by broken sprinkler lines or lab equipment topples onto the floor because it is not adequately anchored, the ability of staff to perform their jobs after an earthquake will be hampered. Figure 9.9 shows unanchored laboratory equipment that toppled off a bench as a result of earthquake shaking.
• It has sometimes been necessary to use temporary, small-scale water treatment plants (see Figure 9.10) after major earthquakes where the system treatment plant was not operational or operating at very limited capacity. Water systems typically rely on mutual aid and government resources to augment the limited temporary treatment equipment that an individual utility may have available.
DISASTER RESILIENCE FRAMEWORK
25% Draft for Hoboken, NJ, Workshop
Figure 9.8 Pipeline damage due to differential settlement between ground and pile supported building, Tohoku earthquake, Japan, 2011 (Source: Tang & Edwards, 2014)
Figure 9.9 Toppled laboratory equipment, Tohoku earthquake, Japan, 2011 (Source: Tang & Edwards, 2014)
Figure 9.10 Temporary water treatment plant, Haiti earthquake, Port Au Prince, 2010
DISASTER RESILIENCE FRAMEWORK
25% Draft for Hoboken, NJ, Workshop
(Source: Photo by Don Ballantyne)
Pumping
Pumping stations are used at various locations in a water system to increase hydraulic head (i.e., raise water from one elevation to a higher elevation). A pump station typically consists of a simple building that houses pumps, motors that power the pumps, pipes, valves, and associated mechanical, electrical and control equipment. Pump stations often have standby emergency generators to enable continued operation when the commercial power supply is interrupted.
Typical earthquake damage to water pump stations includes:
• Loss of commercial electrical power prevents operation of pumps if there is no backup power supply.
• Seismic performance of pump station buildings is dependent upon the type and year of original construction and any seismic retrofits that may have been completed. Figure 9.11 shows significant cracking of the unreinforced masonry wall at a pump station after the 2011 Christchurch earthquake in New Zealand.
Figure 9.11 Pump station damage due to differential settlement, Christchurch earthquake, Christchurch, New Zealand, 2011 (Source: Eidinger & Tang, 2014)
Storage
Storage tanks and reservoirs are used by water utilities to help balance water demand with water production capacity. Stored potable water is drawn down during times of peak usage and recharged during off-peak hours. Typically one to three days of average daily water demand is stored to satisfy increased usage demands from fire suppression or other emergency needs. Elevated storage tanks can be used to increase hydraulic head, as required by the characteristics of the distribution system.
DISASTER RESILIENCE FRAMEWORK
25% Draft for Hoboken, NJ, Workshop Modern utility-scale storage tanks and reservoirs are constructed of steel or concrete. Typical construction types and their associated design standard are indicated in Table 9.4. Potable water in-ground reservoirs are often concrete lined earthen structures. Security concerns require the reservoirs to be covered, typically with a concrete, metal, or wood roof supported by intermediate columns.
Typical earthquake damage to water storage tanks and reservoirs includes:
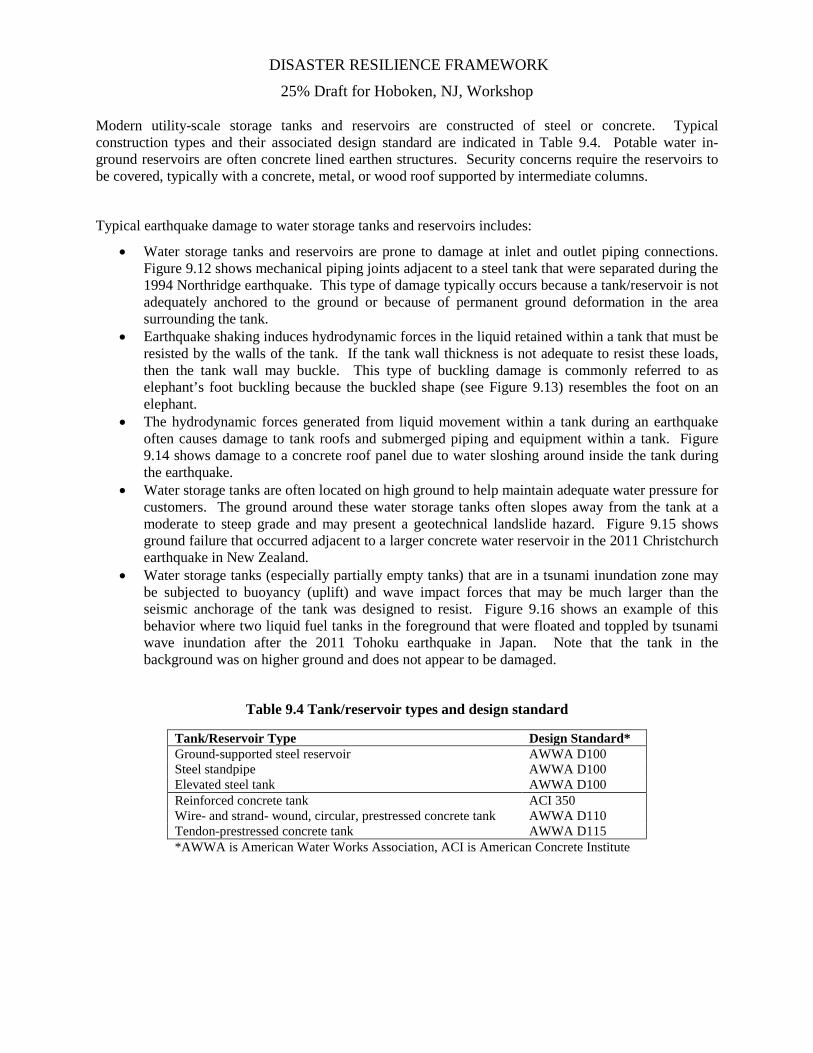
• Water storage tanks and reservoirs are prone to damage at inlet and outlet piping connections. Figure 9.12 shows mechanical piping joints adjacent to a steel tank that were separated during the 1994 Northridge earthquake. This type of damage typically occurs because a tank/reservoir is not adequately anchored to the ground or because of permanent ground deformation in the area surrounding the tank.
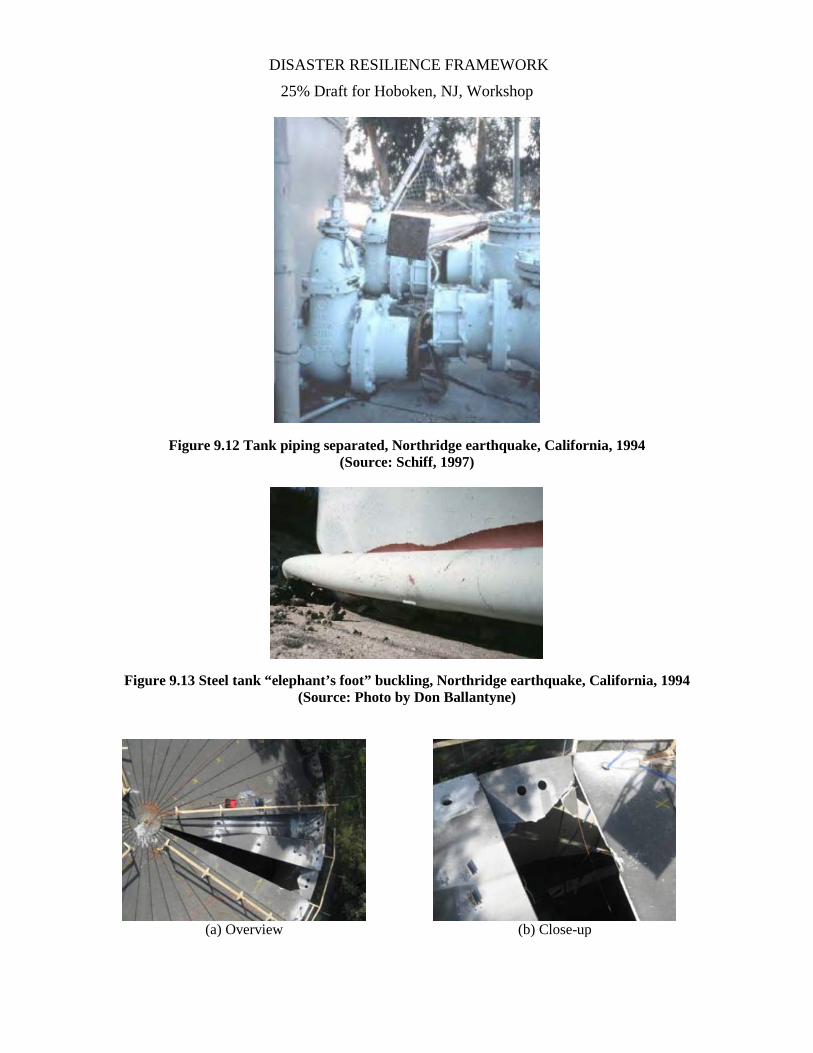
• Earthquake shaking induces hydrodynamic forces in the liquid retained within a tank that must be resisted by the walls of the tank. If the tank wall thickness is not adequate to resist these loads, then the tank wall may buckle. This type of buckling damage is commonly referred to as elephant’s foot buckling because the buckled shape (see Figure 9.13) resembles the foot on an elephant.
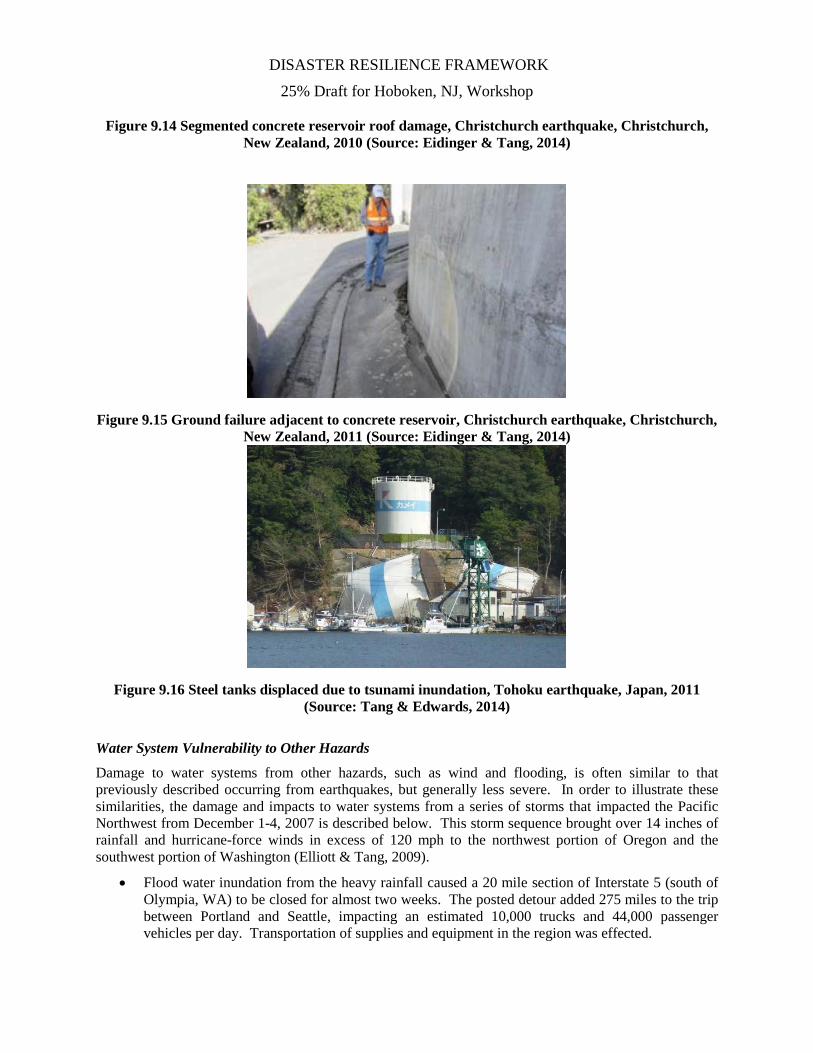
• The hydrodynamic forces generated from liquid movement within a tank during an earthquake often causes damage to tank roofs and submerged piping and equipment within a tank. Figure 9.14 shows damage to a concrete roof panel due to water sloshing around inside the tank during the earthquake.
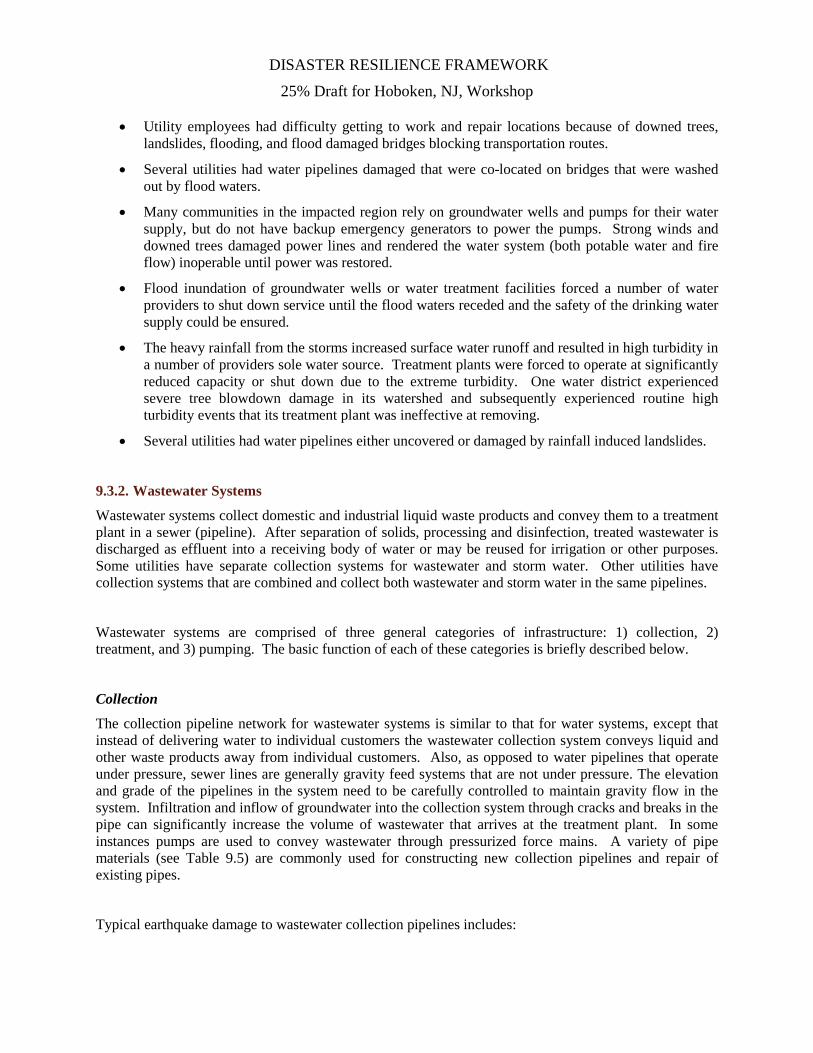
• Water storage tanks are often located on high ground to help maintain adequate water pressure for customers. The ground around these water storage tanks often slopes away from the tank at a moderate to steep grade and may present a geotechnical landslide hazard. Figure 9.15 shows ground failure that occurred adjacent to a larger concrete water reservoir in the 2011 Christchurch earthquake in New Zealand.
• Water storage tanks (especially partially empty tanks) that are in a tsunami inundation zone may be subjected to buoyancy (uplift) and wave impact forces that may be much larger than the seismic anchorage of the tank was designed to resist. Figure 9.16 shows an example of this behavior where two liquid fuel tanks in the foreground that were floated and toppled by tsunami wave inundation after the 2011 Tohoku earthquake in Japan. Note that the tank in the background was on higher ground and does not appear to be damaged.
Table 9.4 Tank/reservoir types and design standard
Tank/Reservoir Type Design Standard* Ground-supported steel reservoir AWWA D100 Steel standpipe AWWA D100 Elevated steel tank AWWA D100 Reinforced concrete tank ACI 350 Wire- and strand- wound, circular, prestressed concrete tank AWWA D110 Tendon-prestressed concrete tank AWWA D115 *AWWA is American Water Works Association, ACI is American Concrete Institute
DISASTER RESILIENCE FRAMEWORK
25% Draft for Hoboken, NJ, Workshop
Figure 9.12 Tank piping separated, Northridge earthquake, California, 1994 (Source: Schiff, 1997)
Figure 9.13 Steel tank “elephant’s foot” buckling, Northridge earthquake, California, 1994 (Source: Photo by Don Ballantyne)
(a) Overview (b) Close-up
DISASTER RESILIENCE FRAMEWORK
25% Draft for Hoboken, NJ, Workshop
Figure 9.14 Segmented concrete reservoir roof damage, Christchurch earthquake, Christchurch, New Zealand, 2010 (Source: Eidinger & Tang, 2014)
Figure 9.15 Ground failure adjacent to concrete reservoir, Christchurch earthquake, Christchurch, New Zealand, 2011 (Source: Eidinger & Tang, 2014)
Figure 9.16 Steel tanks displaced due to tsunami inundation, Tohoku earthquake, Japan, 2011 (Source: Tang & Edwards, 2014)
Water System Vulnerability to Other Hazards
Damage to water systems from other hazards, such as wind and flooding, is often similar to that previously described occurring from earthquakes, but generally less severe. In order to illustrate these similarities, the damage and impacts to water systems from a series of storms that impacted the Pacific Northwest from December 1-4, 2007 is described below. This storm sequence brought over 14 inches of rainfall and hurricane-force winds in excess of 120 mph to the northwest portion of Oregon and the southwest portion of Washington (Elliott & Tang, 2009).
• Flood water inundation from the heavy rainfall caused a 20 mile section of Interstate 5 (south of Olympia, WA) to be closed for almost two weeks. The posted detour added 275 miles to the trip between Portland and Seattle, impacting an estimated 10,000 trucks and 44,000 passenger vehicles per day. Transportation of supplies and equipment in the region was effected.
DISASTER RESILIENCE FRAMEWORK
25% Draft for Hoboken, NJ, Workshop
• Utility employees had difficulty getting to work and repair locations because of downed trees, landslides, flooding, and flood damaged bridges blocking transportation routes.
• Several utilities had water pipelines damaged that were co-located on bridges that were washed out by flood waters.
• Many communities in the impacted region rely on groundwater wells and pumps for their water supply, but do not have backup emergency generators to power the pumps. Strong winds and downed trees damaged power lines and rendered the water system (both potable water and fire flow) inoperable until power was restored.
• Flood inundation of groundwater wells or water treatment facilities forced a number of water providers to shut down service until the flood waters receded and the safety of the drinking water supply could be ensured.
• The heavy rainfall from the storms increased surface water runoff and resulted in high turbidity in a number of providers sole water source. Treatment plants were forced to operate at significantly reduced capacity or shut down due to the extreme turbidity. One water district experienced severe tree blowdown damage in its watershed and subsequently experienced routine high turbidity events that its treatment plant was ineffective at removing.
• Several utilities had water pipelines either uncovered or damaged by rainfall induced landslides.
9.3.2. Wastewater Systems
Wastewater systems collect domestic and industrial liquid waste products and convey them to a treatment plant in a sewer (pipeline). After separation of solids, processing and disinfection, treated wastewater is discharged as effluent into a receiving body of water or may be reused for irrigation or other purposes. Some utilities have separate collection systems for wastewater and storm water. Other utilities have collection systems that are combined and collect both wastewater and storm water in the same pipelines.
Wastewater systems are comprised of three general categories of infrastructure: 1) collection, 2) treatment, and 3) pumping. The basic function of each of these categories is briefly described below.
Collection
The collection pipeline network for wastewater systems is similar to that for water systems, except that instead of delivering water to individual customers the wastewater collection system conveys liquid and other waste products away from individual customers. Also, as opposed to water pipelines that operate under pressure, sewer lines are generally gravity feed systems that are not under pressure. The elevation and grade of the pipelines in the system need to be carefully controlled to maintain gravity flow in the system. Infiltration and inflow of groundwater into the collection system through cracks and breaks in the pipe can significantly increase the volume of wastewater that arrives at the treatment plant. In some instances pumps are used to convey wastewater through pressurized force mains. A variety of pipe materials (see Table 9.5) are commonly used for constructing new collection pipelines and repair of existing pipes.
Typical earthquake damage to wastewater collection pipelines includes:
DISASTER RESILIENCE FRAMEWORK
25% Draft for Hoboken, NJ, Workshop
• Liquefaction induced permanent ground displacement causes breaks and collapses of sewer pipelines. Observations from past earthquakes have indicated that approximately one sewer pipe collapse occurs for every 10 breaks and leaks in water pipelines (OSSPAC, 2013).
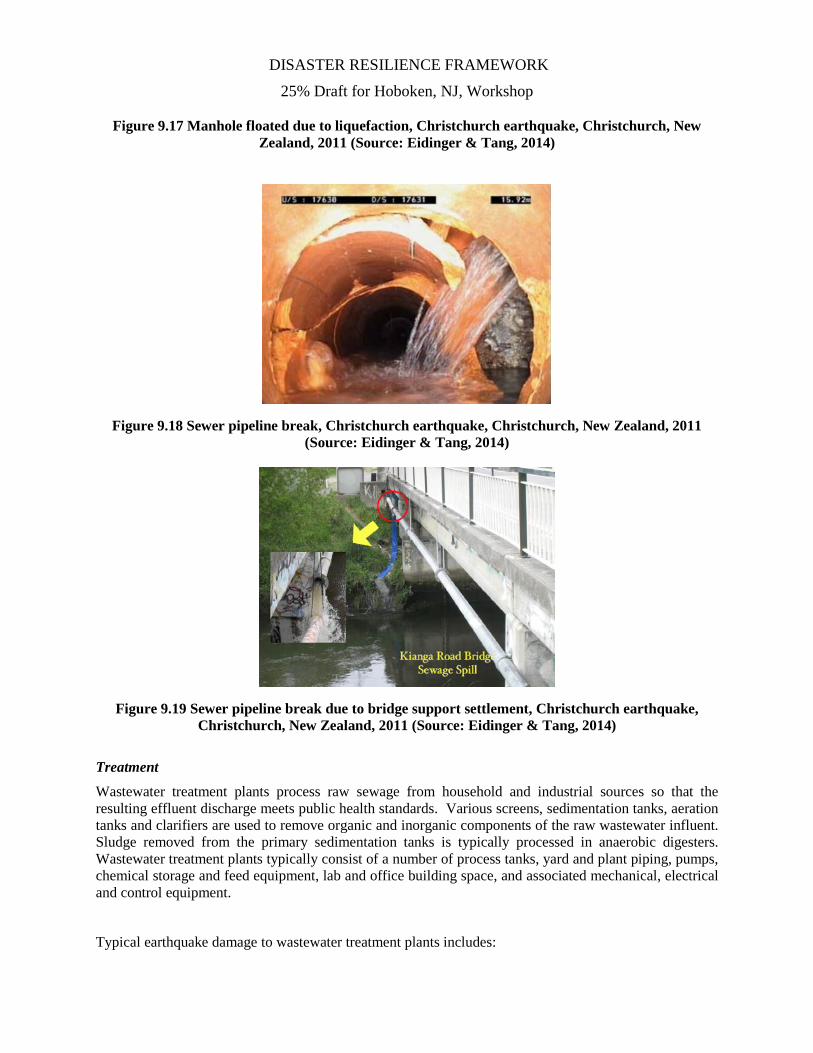
• Liquefaction often induces floating of manholes and sewer pipelines (see Figure 9.17). These changes in pipeline and structure invert elevations can cause disruption to the collection system gravity flow.
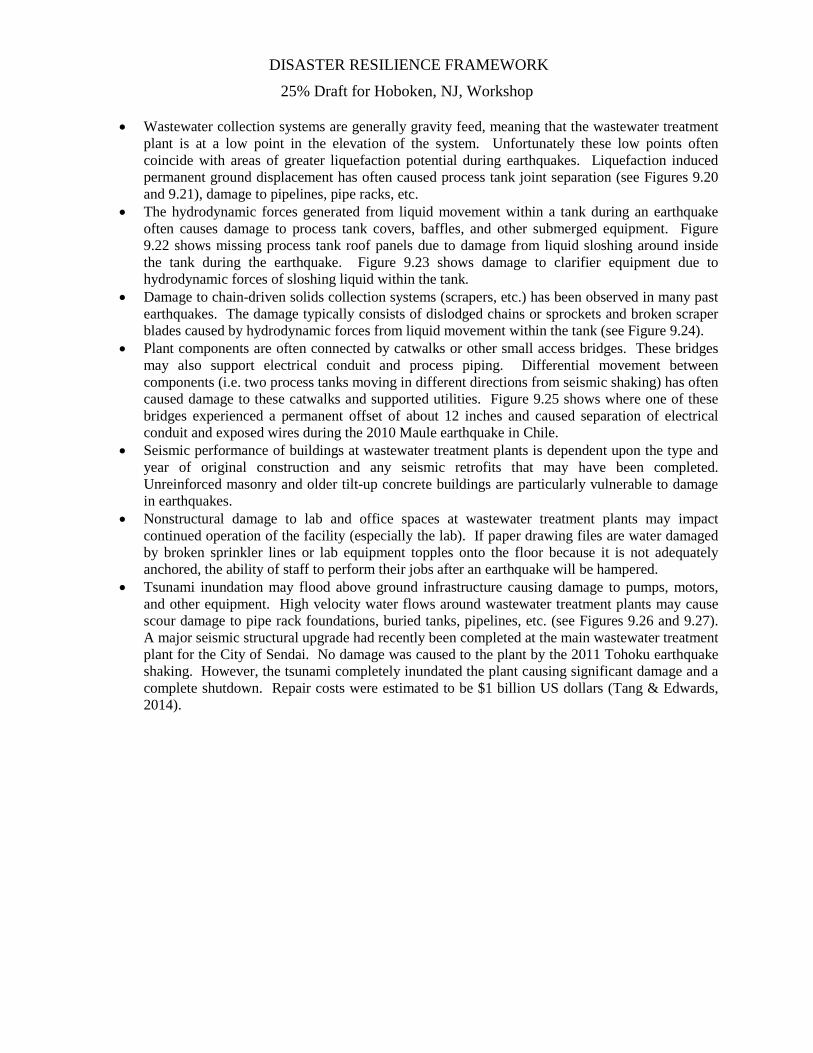
• Even if sewer pipelines do not completely collapse during an earthquake, cracked and broken sections of pipe have led to significant increases in infiltration and inflow rates (see Figure 9.18). This increased flow rate has created excess demand on the already reduced capacity of wastewater treatment plants after past earthquakes.
• Sometimes wastewater pipelines are co-located on bridges at river or other crossings. If not properly designed, relative movement between the bridge and surrounding soil could result in damage to the supported pipelines. Figure 9.19 show a sewer pipeline attached to a bridge. The pipeline was damage by differential settlement between adjacent bridge supports, resulting in discharge of raw wastewater directly to the river.
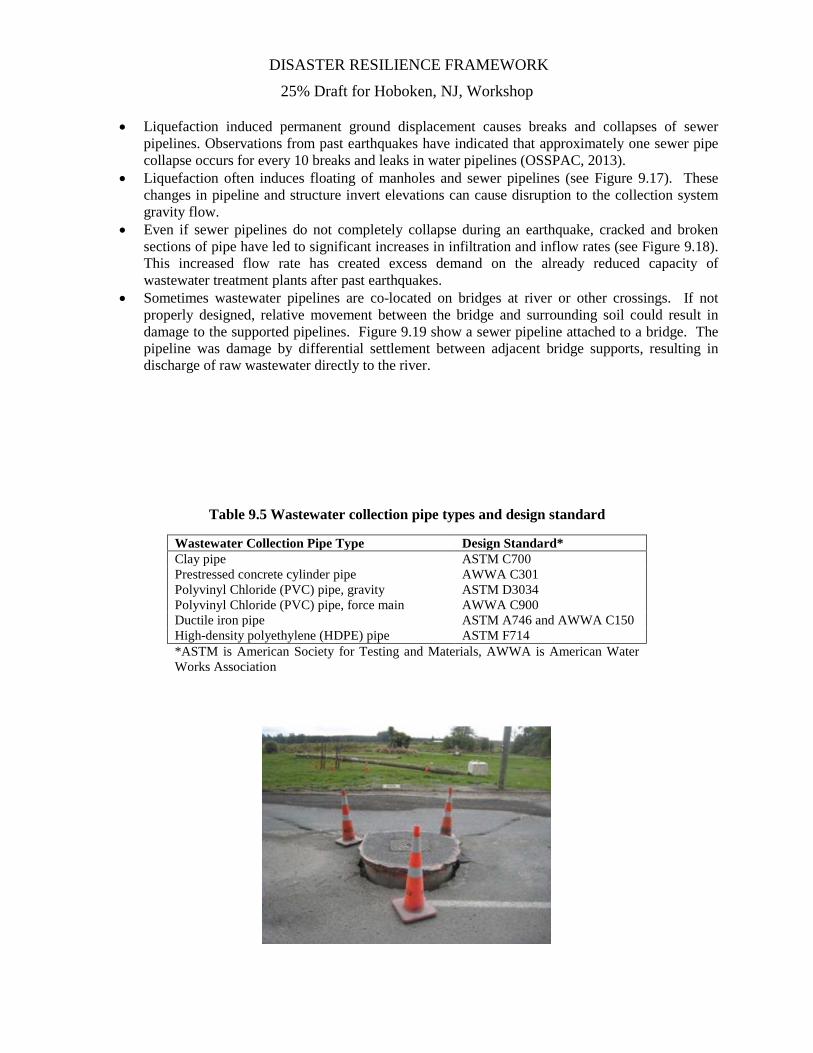
Table 9.5 Wastewater collection pipe types and design standard
Wastewater Collection Pipe Type Design Standard* Clay pipe ASTM C700 Prestressed concrete cylinder pipe AWWA C301 Polyvinyl Chloride (PVC) pipe, gravity ASTM D3034 Polyvinyl Chloride (PVC) pipe, force main AWWA C900 Ductile iron pipe ASTM A746 and AWWA C150 High-density polyethylene (HDPE) pipe ASTM F714 *ASTM is American Society for Testing and Materials, AWWA is American Water Works Association
DISASTER RESILIENCE FRAMEWORK
25% Draft for Hoboken, NJ, Workshop
Figure 9.17 Manhole floated due to liquefaction, Christchurch earthquake, Christchurch, New Zealand, 2011 (Source: Eidinger & Tang, 2014)
Figure 9.18 Sewer pipeline break, Christchurch earthquake, Christchurch, New Zealand, 2011 (Source: Eidinger & Tang, 2014)
Figure 9.19 Sewer pipeline break due to bridge support settlement, Christchurch earthquake, Christchurch, New Zealand, 2011 (Source: Eidinger & Tang, 2014)
Treatment
Wastewater treatment plants process raw sewage from household and industrial sources so that the resulting effluent discharge meets public health standards. Various screens, sedimentation tanks, aeration tanks and clarifiers are used to remove organic and inorganic components of the raw wastewater influent. Sludge removed from the primary sedimentation tanks is typically processed in anaerobic digesters. Wastewater treatment plants typically consist of a number of process tanks, yard and plant piping, pumps, chemical storage and feed equipment, lab and office building space, and associated mechanical, electrical and control equipment.
Typical earthquake damage to wastewater treatment plants includes:
DISASTER RESILIENCE FRAMEWORK
25% Draft for Hoboken, NJ, Workshop
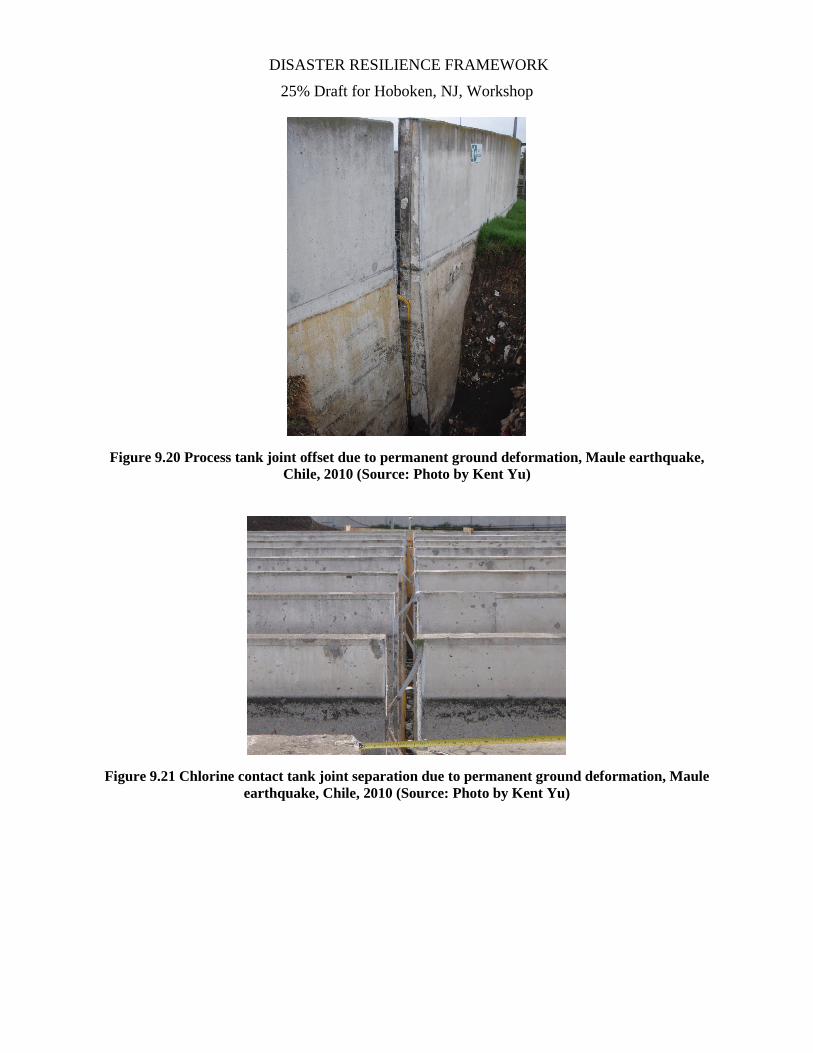
• Wastewater collection systems are generally gravity feed, meaning that the wastewater treatment plant is at a low point in the elevation of the system. Unfortunately these low points often coincide with areas of greater liquefaction potential during earthquakes. Liquefaction induced permanent ground displacement has often caused process tank joint separation (see Figures 9.20 and 9.21), damage to pipelines, pipe racks, etc.
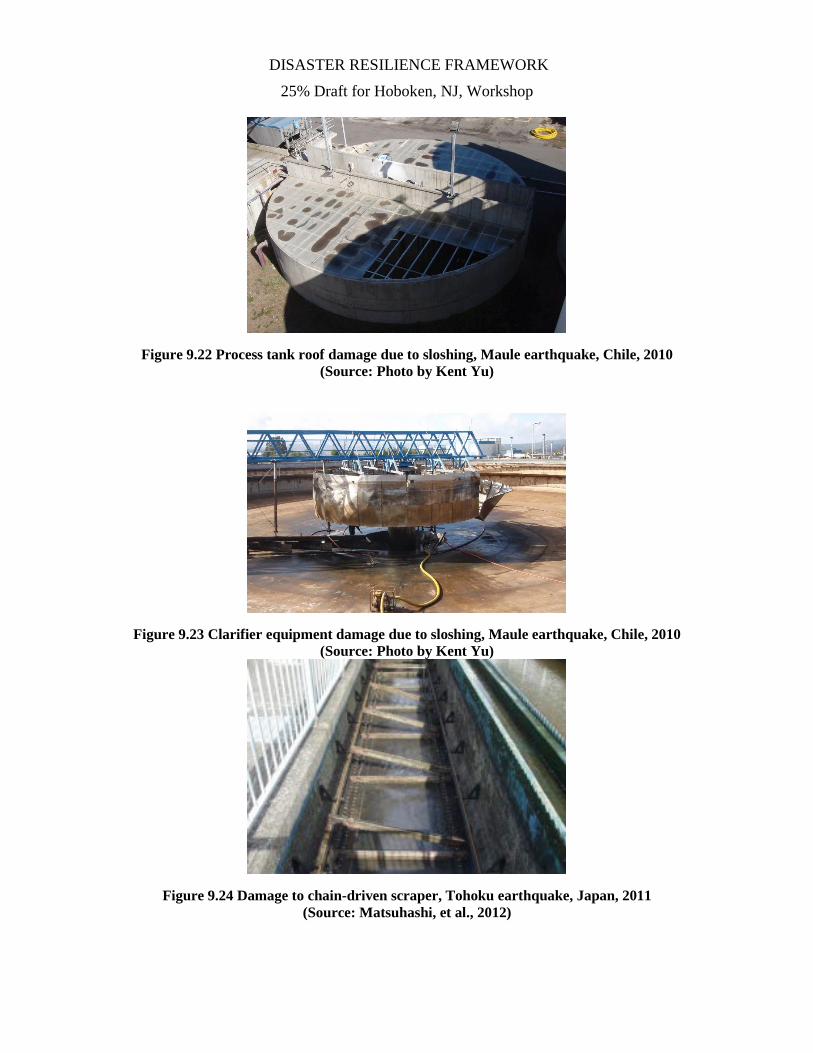
• The hydrodynamic forces generated from liquid movement within a tank during an earthquake often causes damage to process tank covers, baffles, and other submerged equipment. Figure 9.22 shows missing process tank roof panels due to damage from liquid sloshing around inside the tank during the earthquake. Figure 9.23 shows damage to clarifier equipment due to hydrodynamic forces of sloshing liquid within the tank.
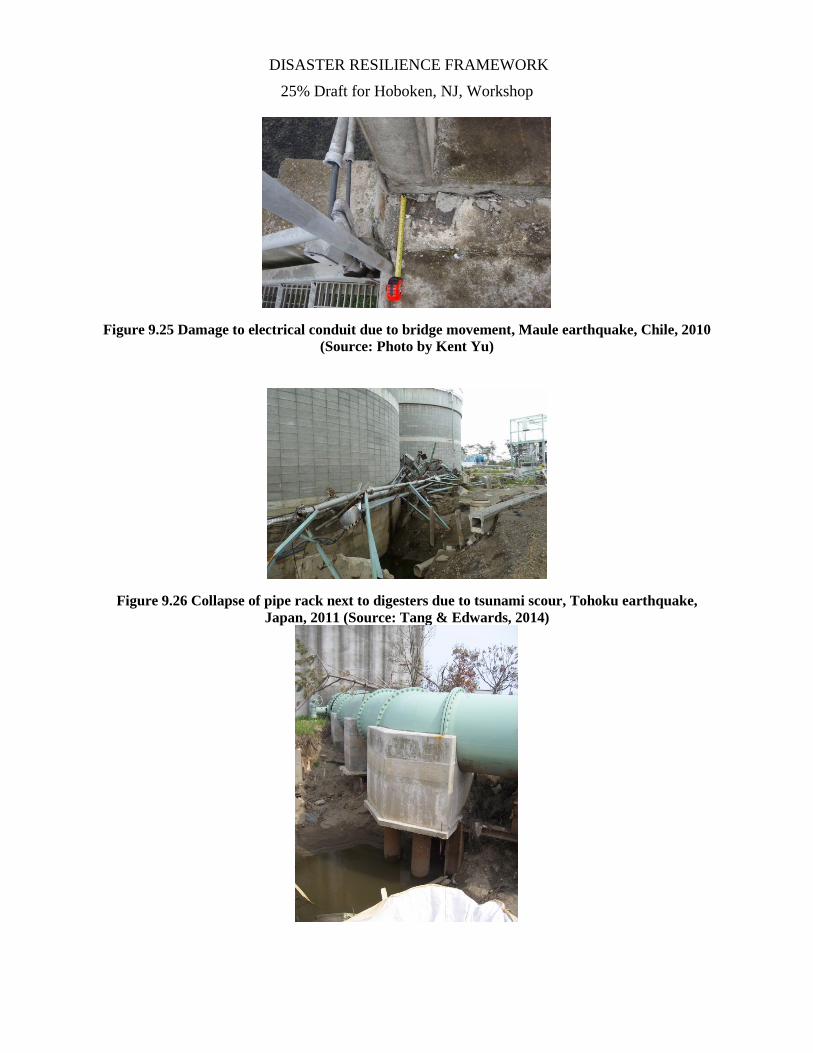
• Damage to chain-driven solids collection systems (scrapers, etc.) has been observed in many past earthquakes. The damage typically consists of dislodged chains or sprockets and broken scraper blades caused by hydrodynamic forces from liquid movement within the tank (see Figure 9.24).
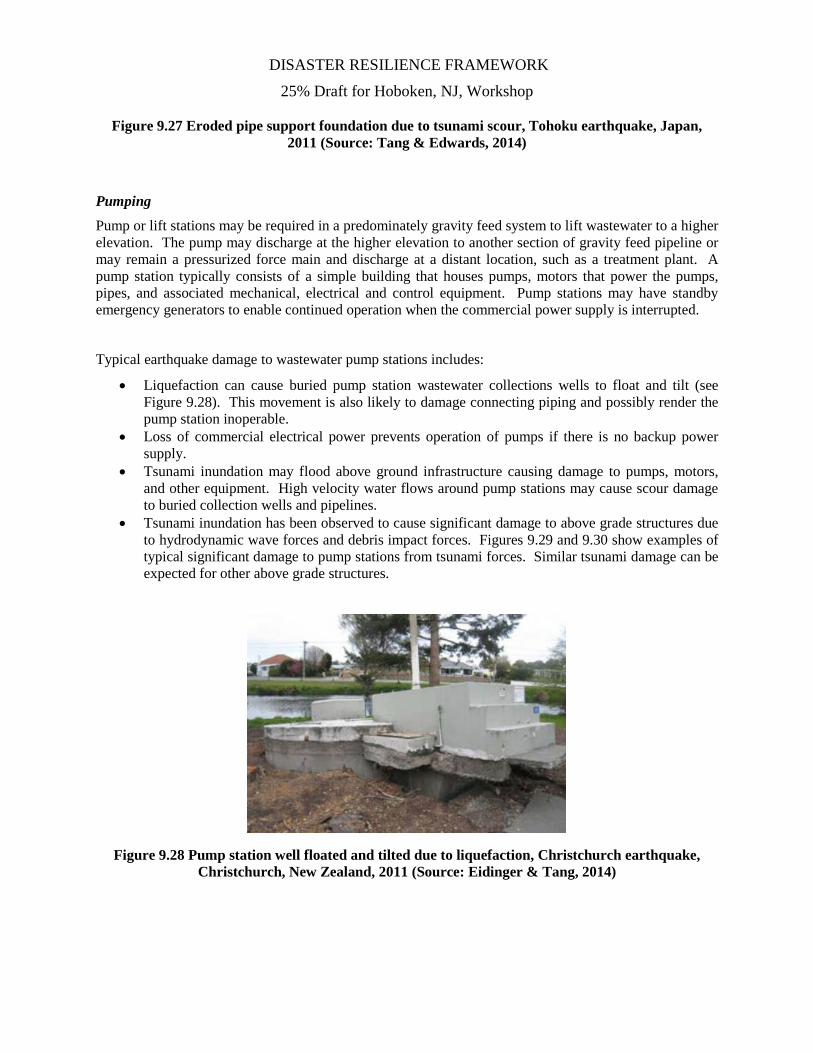
• Plant components are often connected by catwalks or other small access bridges. These bridges may also support electrical conduit and process piping. Differential movement between components (i.e. two process tanks moving in different directions from seismic shaking) has often caused damage to these catwalks and supported utilities. Figure 9.25 shows where one of these bridges experienced a permanent offset of about 12 inches and caused separation of electrical conduit and exposed wires during the 2010 Maule earthquake in Chile.
• Seismic performance of buildings at wastewater treatment plants is dependent upon the type and year of original construction and any seismic retrofits that may have been completed. Unreinforced masonry and older tilt-up concrete buildings are particularly vulnerable to damage in earthquakes.
• Nonstructural damage to lab and office spaces at wastewater treatment plants may impact continued operation of the facility (especially the lab). If paper drawing files are water damaged by broken sprinkler lines or lab equipment topples onto the floor because it is not adequately anchored, the ability of staff to perform their jobs after an earthquake will be hampered.
• Tsunami inundation may flood above ground infrastructure causing damage to pumps, motors, and other equipment. High velocity water flows around wastewater treatment plants may cause scour damage to pipe rack foundations, buried tanks, pipelines, etc. (see Figures 9.26 and 9.27). A major seismic structural upgrade had recently been completed at the main wastewater treatment plant for the City of Sendai. No damage was caused to the plant by the 2011 Tohoku earthquake shaking. However, the tsunami completely inundated the plant causing significant damage and a complete shutdown. Repair costs were estimated to be $1 billion US dollars (Tang & Edwards, 2014).
DISASTER RESILIENCE FRAMEWORK
25% Draft for Hoboken, NJ, Workshop
Figure 9.20 Process tank joint offset due to permanent ground deformation, Maule earthquake, Chile, 2010 (Source: Photo by Kent Yu)
Figure 9.21 Chlorine contact tank joint separation due to permanent ground deformation, Maule earthquake, Chile, 2010 (Source: Photo by Kent Yu)
DISASTER RESILIENCE FRAMEWORK
25% Draft for Hoboken, NJ, Workshop
Figure 9.22 Process tank roof damage due to sloshing, Maule earthquake, Chile, 2010 (Source: Photo by Kent Yu)
Figure 9.23 Clarifier equipment damage due to sloshing, Maule earthquake, Chile, 2010 (Source: Photo by Kent Yu)
Figure 9.24 Damage to chain-driven scraper, Tohoku earthquake, Japan, 2011 (Source: Matsuhashi, et al., 2012)
DISASTER RESILIENCE FRAMEWORK
25% Draft for Hoboken, NJ, Workshop
Figure 9.25 Damage to electrical conduit due to bridge movement, Maule earthquake, Chile, 2010 (Source: Photo by Kent Yu)
Figure 9.26 Collapse of pipe rack next to digesters due to tsunami scour, Tohoku earthquake, Japan, 2011 (Source: Tang & Edwards, 2014)
DISASTER RESILIENCE FRAMEWORK
25% Draft for Hoboken, NJ, Workshop
Figure 9.27 Eroded pipe support foundation due to tsunami scour, Tohoku earthquake, Japan, 2011 (Source: Tang & Edwards, 2014)
Pumping
Pump or lift stations may be required in a predominately gravity feed system to lift wastewater to a higher elevation. The pump may discharge at the higher elevation to another section of gravity feed pipeline or may remain a pressurized force main and discharge at a distant location, such as a treatment plant. A pump station typically consists of a simple building that houses pumps, motors that power the pumps, pipes, and associated mechanical, electrical and control equipment. Pump stations may have standby emergency generators to enable continued operation when the commercial power supply is interrupted.
Typical earthquake damage to wastewater pump stations includes:
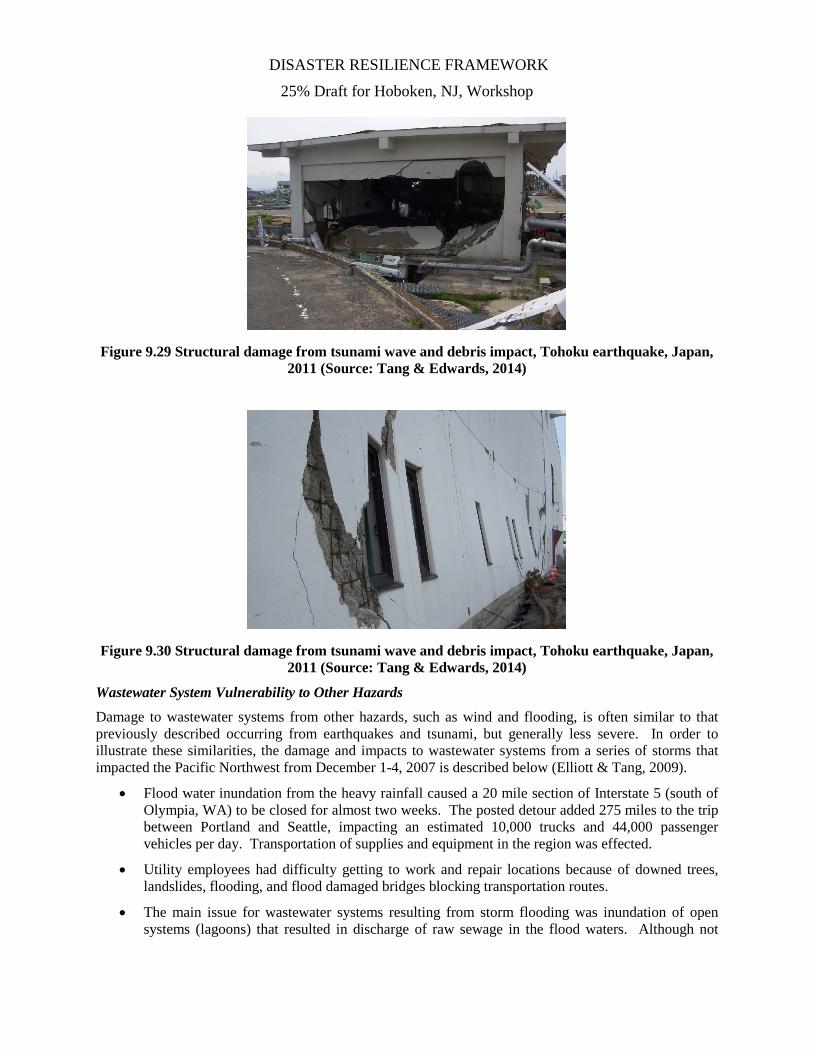
• Liquefaction can cause buried pump station wastewater collections wells to float and tilt (see Figure 9.28). This movement is also likely to damage connecting piping and possibly render the pump station inoperable.
• Loss of commercial electrical power prevents operation of pumps if there is no backup power supply.
• Tsunami inundation may flood above ground infrastructure causing damage to pumps, motors, and other equipment. High velocity water flows around pump stations may cause scour damage to buried collection wells and pipelines.
• Tsunami inundation has been observed to cause significant damage to above grade structures due to hydrodynamic wave forces and debris impact forces. Figures 9.29 and 9.30 show examples of typical significant damage to pump stations from tsunami forces. Similar tsunami damage can be expected for other above grade structures.
Figure 9.28 Pump station well floated and tilted due to liquefaction, Christchurch earthquake, Christchurch, New Zealand, 2011 (Source: Eidinger & Tang, 2014)
DISASTER RESILIENCE FRAMEWORK
25% Draft for Hoboken, NJ, Workshop
Figure 9.29 Structural damage from tsunami wave and debris impact, Tohoku earthquake, Japan, 2011 (Source: Tang & Edwards, 2014)
Figure 9.30 Structural damage from tsunami wave and debris impact, Tohoku earthquake, Japan, 2011 (Source: Tang & Edwards, 2014)
Wastewater System Vulnerability to Other Hazards
Damage to wastewater systems from other hazards, such as wind and flooding, is often similar to that previously described occurring from earthquakes and tsunami, but generally less severe. In order to illustrate these similarities, the damage and impacts to wastewater systems from a series of storms that impacted the Pacific Northwest from December 1-4, 2007 is described below (Elliott & Tang, 2009).
• Flood water inundation from the heavy rainfall caused a 20 mile section of Interstate 5 (south of Olympia, WA) to be closed for almost two weeks. The posted detour added 275 miles to the trip between Portland and Seattle, impacting an estimated 10,000 trucks and 44,000 passenger vehicles per day. Transportation of supplies and equipment in the region was effected.
• Utility employees had difficulty getting to work and repair locations because of downed trees, landslides, flooding, and flood damaged bridges blocking transportation routes.
• The main issue for wastewater systems resulting from storm flooding was inundation of open systems (lagoons) that resulted in discharge of raw sewage in the flood waters. Although not
DISASTER RESILIENCE FRAMEWORK
25% Draft for Hoboken, NJ, Workshop
observed in this storm, process equipment (pumps, chemical feed systems, etc.) can be damaged if flood waters inundate wastewater treatment plant buildings and pump stations.
• Strong winds and downed trees damaged power lines and cut off power to wastewater lift stations and treatment plants throughout the region. Many of these facilities did not have emergency backup generators and were inoperable until commercial electrical power was restored. The City of Astoria, Oregon had recently completed installation of emergency generators at all five of its pump stations. They performed as designed after power was lost during the storm allowing the pump stations to remain fully operational.
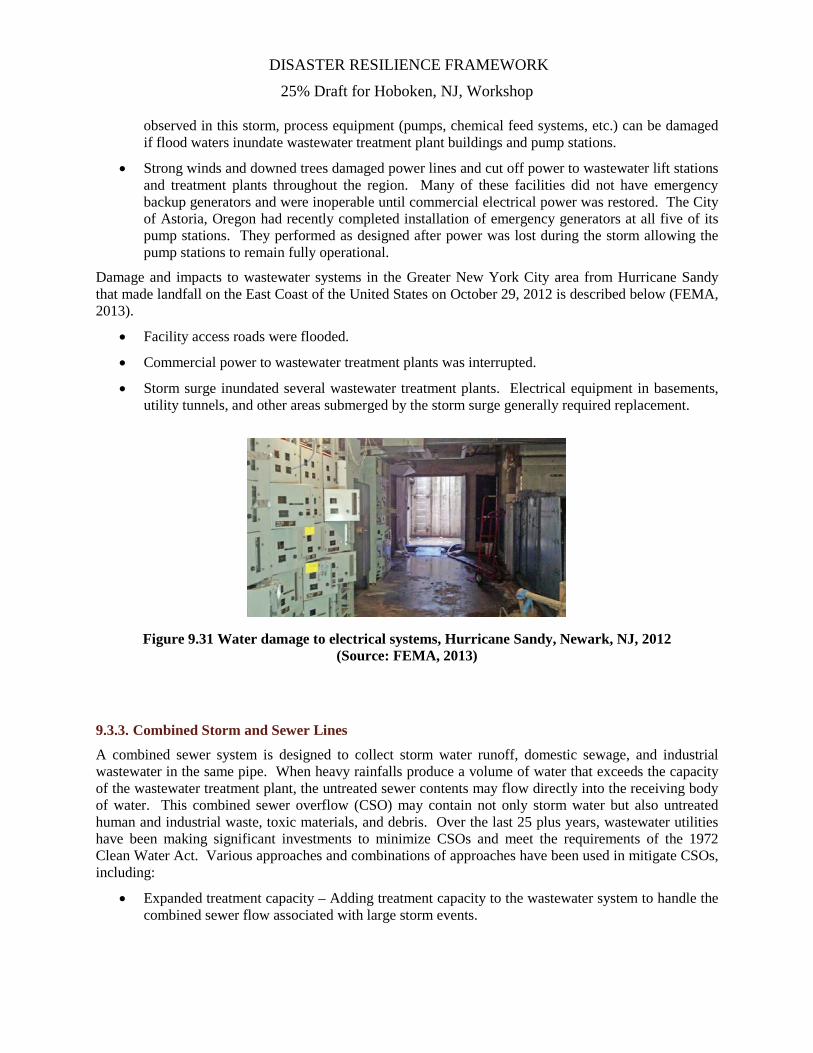
Damage and impacts to wastewater systems in the Greater New York City area from Hurricane Sandy that made landfall on the East Coast of the United States on October 29, 2012 is described below (FEMA, 2013).
• Facility access roads were flooded.
• Commercial power to wastewater treatment plants was interrupted.
• Storm surge inundated several wastewater treatment plants. Electrical equipment in basements, utility tunnels, and other areas submerged by the storm surge generally required replacement.
Figure 9.31 Water damage to electrical systems, Hurricane Sandy, Newark, NJ, 2012 (Source: FEMA, 2013)
9.3.3. Combined Storm and Sewer Lines
A combined sewer system is designed to collect storm water runoff, domestic sewage, and industrial wastewater in the same pipe. When heavy rainfalls produce a volume of water that exceeds the capacity of the wastewater treatment plant, the untreated sewer contents may flow directly into the receiving body of water. This combined sewer overflow (CSO) may contain not only storm water but also untreated human and industrial waste, toxic materials, and debris. Over the last 25 plus years, wastewater utilities have been making significant investments to minimize CSOs and meet the requirements of the 1972 Clean Water Act. Various approaches and combinations of approaches have been used in mitigate CSOs, including:
• Expanded treatment capacity – Adding treatment capacity to the wastewater system to handle the combined sewer flow associated with large storm events.
DISASTER RESILIENCE FRAMEWORK
25% Draft for Hoboken, NJ, Workshop
• Sewer separation – Adding a second separate piping system to decouple the sanitary and storm water collection systems.
• CSO storage – Adding storage capacity (typically one or more tunnels) to collect and store the combined sewer flow associated with large storm events. After the storm event the stored wastewater is then pumped to the wastewater treatment plant for processing as capacity is available.
• Screening and disinfection – Facilities are added to enable the flows to be treated with sodium hypochlorite for disinfection and solids greater than about ¼ inch are removed with a series of screens. Solids are directed to the wastewater treatment plant for processing and the treated water effluent is directed to the receiving body of water.
Regulatory Environment 9.4.
Water and wastewater utilities are subject to numerous rules and regulations that are generally intended to protect public health and safety and protect the environment. These regulatory requirements are administered by Federal, State, and Local governmental agencies.
9.4.1. Federal
Environmental Protection Agency (EPA)
• Safe Drinking Water Act
o Contaminant Level Limits – EPA sets limits on the levels of certain chemical and microbial contaminants in drinking water.
o Underground Injection Control (UIC) – EPA is responsible for regulating the construction, operation, permitting, and closure of injection wells that place fluids underground for storage or disposal.
• Clean Water Act
o Analytical Methods – EPA publishes laboratory test procedures for use by industry and municipalities to analyze the chemical, physical, and biological components of wastewater.
o Effluent Limitations Guidelines – EPA establishes regulations for industrial wastewater discharges to surface waters and publicly owned treatment works.
o National Pollutant Discharge Elimination System (NPDES) – EPA controls water pollution by regulating point sources of pollutant discharge through the NPDES permit system.
9.4.2. State
State Drinking Water Programs (such as Oregon Health Authority, Drinking Water Services)
• Ensure that water systems meet Safe Drinking Water Act standards. They make sure water systems test for contaminants, review plans for water system improvements, conduct on-site inspections and sanitary surveys, provide training and technical assistance, and take action against water systems not meeting standards.
DISASTER RESILIENCE FRAMEWORK
25% Draft for Hoboken, NJ, Workshop State Water Quality Programs (such as Oregon Department of Environmental Quality, Water Quality Division)
• Ensure that water systems meet water quality standards. They develop and implement water quality standards, regulate sewage treatments systems and industrial dischargers, collect and evaluate water quality data, provide training and technical assistance, and take action against wastewater systems not meeting standards.
9.4.3. Local
Individual municipalities or utility districts may also elect to impose regulatory standards that are in excess of Federal and State standards. In practice this is seldom done due to the increased cost to customers associated with meeting higher than minimum regulatory standards.
Standards and Codes 9.5.
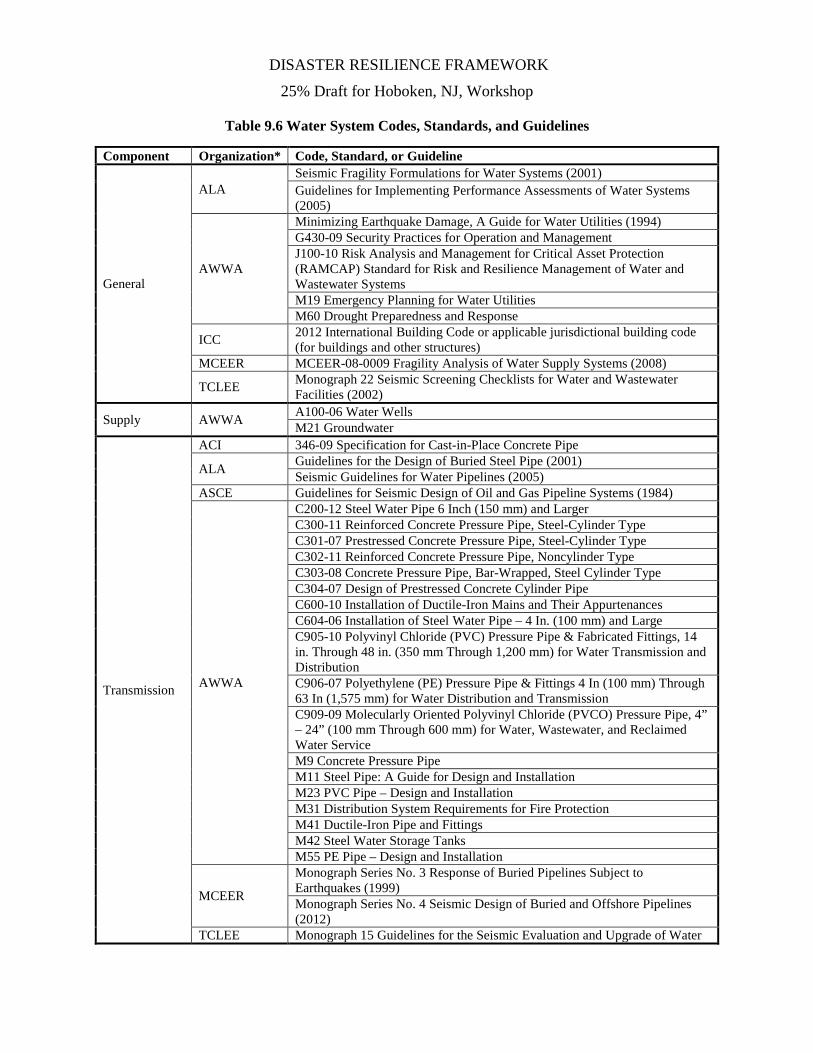
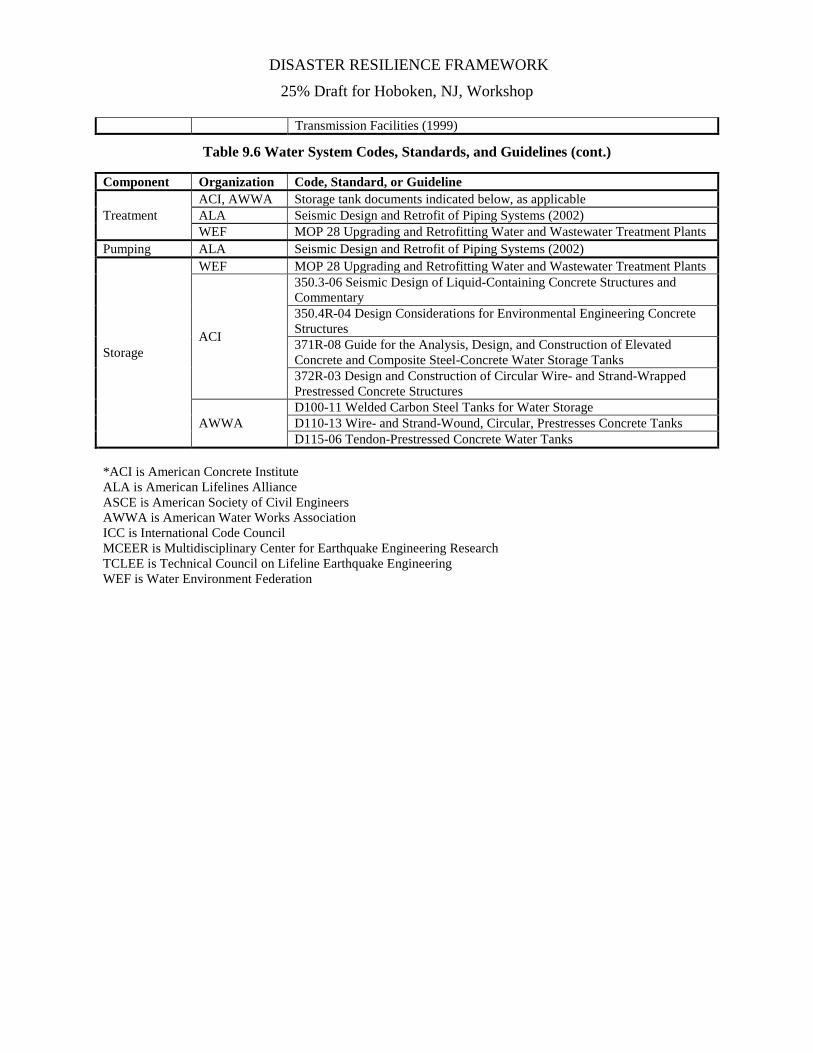
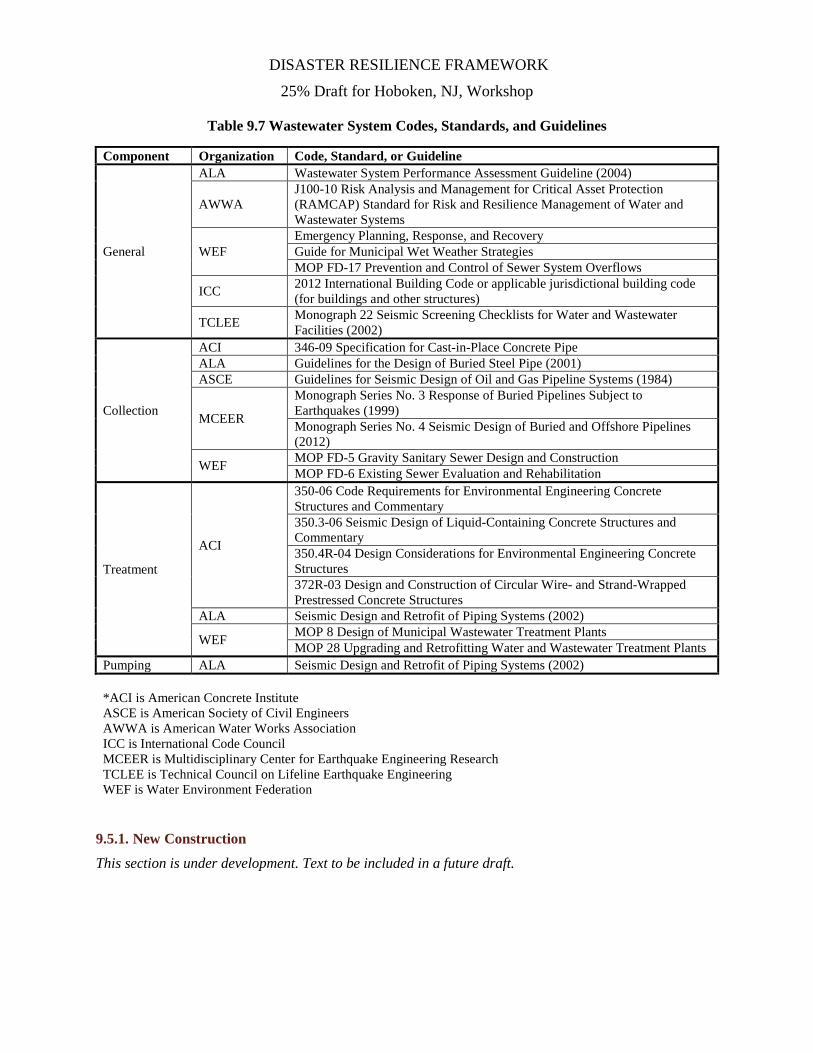
Codes, standards, and guidelines are used by the industry to establish minimum acceptable criteria for design, assessment and construction. Table 9.6 summarizes available codes, standards, and guidelines for design, assessment, and retrofit of various components of water systems. Table 9.7 provides a similar summary for wastewater systems.
One shortcoming is that these codes and standards do not take into account the differences in expected lifespan of the infrastructure when defining the design hazard level. Pipelines and other components of water and wastewater systems often have a service lifespan of 100 years, compared with the typical service lifespan of 50 years for buildings. Therefore, the implied level of reliability of a pipeline designed for a particular hazard level (i.e. 500 year return period earthquake) will be less than that of a building designed for the same hazard level due to the longer expected service life of the pipeline (i.e. a pipeline in the ground for 100 years is more likely to experience the design earthquake than one in the ground for 50 years).
DISASTER RESILIENCE FRAMEWORK
25% Draft for Hoboken, NJ, Workshop
Table 9.6 Water System Codes, Standards, and Guidelines
Component Organization* Code, Standard, or Guideline
General
ALA Seismic Fragility Formulations for Water Systems (2001) Guidelines for Implementing Performance Assessments of Water Systems (2005)
AWWA
Minimizing Earthquake Damage, A Guide for Water Utilities (1994) G430-09 Security Practices for Operation and Management J100-10 Risk Analysis and Management for Critical Asset Protection (RAMCAP) Standard for Risk and Resilience Management of Water and Wastewater Systems M19 Emergency Planning for Water Utilities M60 Drought Preparedness and Response
ICC 2012 International Building Code or applicable jurisdictional building code (for buildings and other structures)
MCEER MCEER-08-0009 Fragility Analysis of Water Supply Systems (2008)
TCLEE Monograph 22 Seismic Screening Checklists for Water and Wastewater Facilities (2002)
Supply AWWA A100-06 Water Wells M21 Groundwater
Transmission
ACI 346-09 Specification for Cast-in-Place Concrete Pipe
ALA Guidelines for the Design of Buried Steel Pipe (2001) Seismic Guidelines for Water Pipelines (2005)
ASCE Guidelines for Seismic Design of Oil and Gas Pipeline Systems (1984)
AWWA
C200-12 Steel Water Pipe 6 Inch (150 mm) and Larger C300-11 Reinforced Concrete Pressure Pipe, Steel-Cylinder Type C301-07 Prestressed Concrete Pressure Pipe, Steel-Cylinder Type C302-11 Reinforced Concrete Pressure Pipe, Noncylinder Type C303-08 Concrete Pressure Pipe, Bar-Wrapped, Steel Cylinder Type C304-07 Design of Prestressed Concrete Cylinder Pipe C600-10 Installation of Ductile-Iron Mains and Their Appurtenances C604-06 Installation of Steel Water Pipe – 4 In. (100 mm) and Large C905-10 Polyvinyl Chloride (PVC) Pressure Pipe & Fabricated Fittings, 14 in. Through 48 in. (350 mm Through 1,200 mm) for Water Transmission and Distribution C906-07 Polyethylene (PE) Pressure Pipe & Fittings 4 In (100 mm) Through 63 In (1,575 mm) for Water Distribution and Transmission C909-09 Molecularly Oriented Polyvinyl Chloride (PVCO) Pressure Pipe, 4” – 24” (100 mm Through 600 mm) for Water, Wastewater, and Reclaimed Water Service M9 Concrete Pressure Pipe M11 Steel Pipe: A Guide for Design and Installation M23 PVC Pipe – Design and Installation M31 Distribution System Requirements for Fire Protection M41 Ductile-Iron Pipe and Fittings M42 Steel Water Storage Tanks M55 PE Pipe – Design and Installation
MCEER
Monograph Series No. 3 Response of Buried Pipelines Subject to Earthquakes (1999) Monograph Series No. 4 Seismic Design of Buried and Offshore Pipelines (2012)
TCLEE Monograph 15 Guidelines for the Seismic Evaluation and Upgrade of Water
DISASTER RESILIENCE FRAMEWORK
25% Draft for Hoboken, NJ, Workshop
Transmission Facilities (1999)
Table 9.6 Water System Codes, Standards, and Guidelines (cont.)
Component Organization Code, Standard, or Guideline
Treatment ACI, AWWA Storage tank documents indicated below, as applicable ALA Seismic Design and Retrofit of Piping Systems (2002) WEF MOP 28 Upgrading and Retrofitting Water and Wastewater Treatment Plants
Pumping ALA Seismic Design and Retrofit of Piping Systems (2002)
Storage
WEF MOP 28 Upgrading and Retrofitting Water and Wastewater Treatment Plants
ACI
350.3-06 Seismic Design of Liquid-Containing Concrete Structures and Commentary 350.4R-04 Design Considerations for Environmental Engineering Concrete Structures 371R-08 Guide for the Analysis, Design, and Construction of Elevated Concrete and Composite Steel-Concrete Water Storage Tanks 372R-03 Design and Construction of Circular Wire- and Strand-Wrapped Prestressed Concrete Structures
AWWA D100-11 Welded Carbon Steel Tanks for Water Storage D110-13 Wire- and Strand-Wound, Circular, Prestresses Concrete Tanks D115-06 Tendon-Prestressed Concrete Water Tanks
*ACI is American Concrete Institute ALA is American Lifelines Alliance ASCE is American Society of Civil Engineers AWWA is American Water Works Association ICC is International Code Council MCEER is Multidisciplinary Center for Earthquake Engineering Research TCLEE is Technical Council on Lifeline Earthquake Engineering WEF is Water Environment Federation
DISASTER RESILIENCE FRAMEWORK
25% Draft for Hoboken, NJ, Workshop
Table 9.7 Wastewater System Codes, Standards, and Guidelines
Component Organization Code, Standard, or Guideline
General
ALA Wastewater System Performance Assessment Guideline (2004)
AWWA J100-10 Risk Analysis and Management for Critical Asset Protection (RAMCAP) Standard for Risk and Resilience Management of Water and Wastewater Systems
WEF Emergency Planning, Response, and Recovery Guide for Municipal Wet Weather Strategies MOP FD-17 Prevention and Control of Sewer System Overflows
ICC 2012 International Building Code or applicable jurisdictional building code (for buildings and other structures)
TCLEE Monograph 22 Seismic Screening Checklists for Water and Wastewater Facilities (2002)
Collection
ACI 346-09 Specification for Cast-in-Place Concrete Pipe ALA Guidelines for the Design of Buried Steel Pipe (2001) ASCE Guidelines for Seismic Design of Oil and Gas Pipeline Systems (1984)
MCEER
Monograph Series No. 3 Response of Buried Pipelines Subject to Earthquakes (1999) Monograph Series No. 4 Seismic Design of Buried and Offshore Pipelines (2012)
WEF MOP FD-5 Gravity Sanitary Sewer Design and Construction MOP FD-6 Existing Sewer Evaluation and Rehabilitation
Treatment
ACI
350-06 Code Requirements for Environmental Engineering Concrete Structures and Commentary 350.3-06 Seismic Design of Liquid-Containing Concrete Structures and Commentary 350.4R-04 Design Considerations for Environmental Engineering Concrete Structures 372R-03 Design and Construction of Circular Wire- and Strand-Wrapped Prestressed Concrete Structures
ALA Seismic Design and Retrofit of Piping Systems (2002)
WEF MOP 8 Design of Municipal Wastewater Treatment Plants MOP 28 Upgrading and Retrofitting Water and Wastewater Treatment Plants
Pumping ALA Seismic Design and Retrofit of Piping Systems (2002) *ACI is American Concrete Institute ASCE is American Society of Civil Engineers AWWA is American Water Works Association ICC is International Code Council MCEER is Multidisciplinary Center for Earthquake Engineering Research TCLEE is Technical Council on Lifeline Earthquake Engineering WEF is Water Environment Federation
9.5.1. New Construction
This section is under development. Text to be included in a future draft.
DISASTER RESILIENCE FRAMEWORK
25% Draft for Hoboken, NJ, Workshop 9.5.1.1. Performance Levels
The design of new above ground structures (i.e. treatment plant office and lab buildings, pump stations, process tanks, water storage tanks and reservoirs, etc.) is typically governed by the local building code, or design standards that prescribe a similar wind and seismic hazard as the local building code. Design loads are prescribed by a consensus-based standard, Minimum Design Loads for Buildings and Other Structures (ASCE, 2010). This standard uses the concept of Risk Category to increase the design force level for important structures. Typical buildings are assigned to Risk Category II. Water and wastewater treatment facilities are assigned to Risk Category III, because failure of these facilities can cause disruption to civilian life and potential public health risks. Water storage facilities and pump stations required to maintain water pressure for fire suppression are assigned to the highest category, Risk Category IV. It is the intent of the building code that structures designed as Risk Category III or IV should remain operational or require only minor repairs to be put back into operation following a design level (expected) wind or seismic event. By designing for this performance target for the expected level event it is assumed that water and wastewater systems would remain operational under a routine level event and may experience moderate to major damage during an extreme level event.
For the design of new underground pipelines there is a lack of a standard unifying code for water and wastewater systems. This is especially true for seismic design of buried water and wastewater pipelines or buried pipelines that may be impacted by landslides induced by flooding. Often the Chief Engineer of a particular utility is responsible for establishing the design practices for their agency. While these agency specific design practices are generally based on industry recommendations, the variability in the standards used by different utilities results in variability between different utilities in the intended system reliability for natural and man-made hazards.
Some utilities have developed their own standards to specifically address significant local hazards. For example, the San Francisco Public Utilities Commission (SFPUC) has developed its own internal standard that outlines level of service performance goals following a major Bay Area earthquake and specific requirements for design and retrofit of above ground and underground infrastructure. The SFPUC Engineering Standard General Seismic Requirements for Design of New Facilities and Upgrade of Existing Facilities (SFPUC, 2006) establishes design criteria that in many cases are more stringent than building codes and/ or industry standards, but are intended to ensure that the SFPUC is able to achieve its basic level of service performance goal of delivering winter day demand to their wholesale customers within 24 hours after a major earthquake.
9.5.1.2. Hazard Levels
This section is under development. Text to be included in a future draft.
9.5.1.3. Recovery Levels
The performance level implied by codes and standards for new construction provides an indication of the recovery level (timeframe) expected for individual system components. The timeframe required for a water or wastewater system to return to normal operating status following a major disaster is highly dependent on the recovery time for individual components of the system and on the specific characteristics of that system (type and number of components, age of construction, system redundancy, etc.). For instance, if a pump is damaged by an earthquake and will take six months to repair, but a redundant pump is undamaged, the system recovery time is not impacted by the six month repair time.
DISASTER RESILIENCE FRAMEWORK
25% Draft for Hoboken, NJ, Workshop Estimating system recovery times for a specific hazard requires in-depth engineering and operational knowledge of the system.
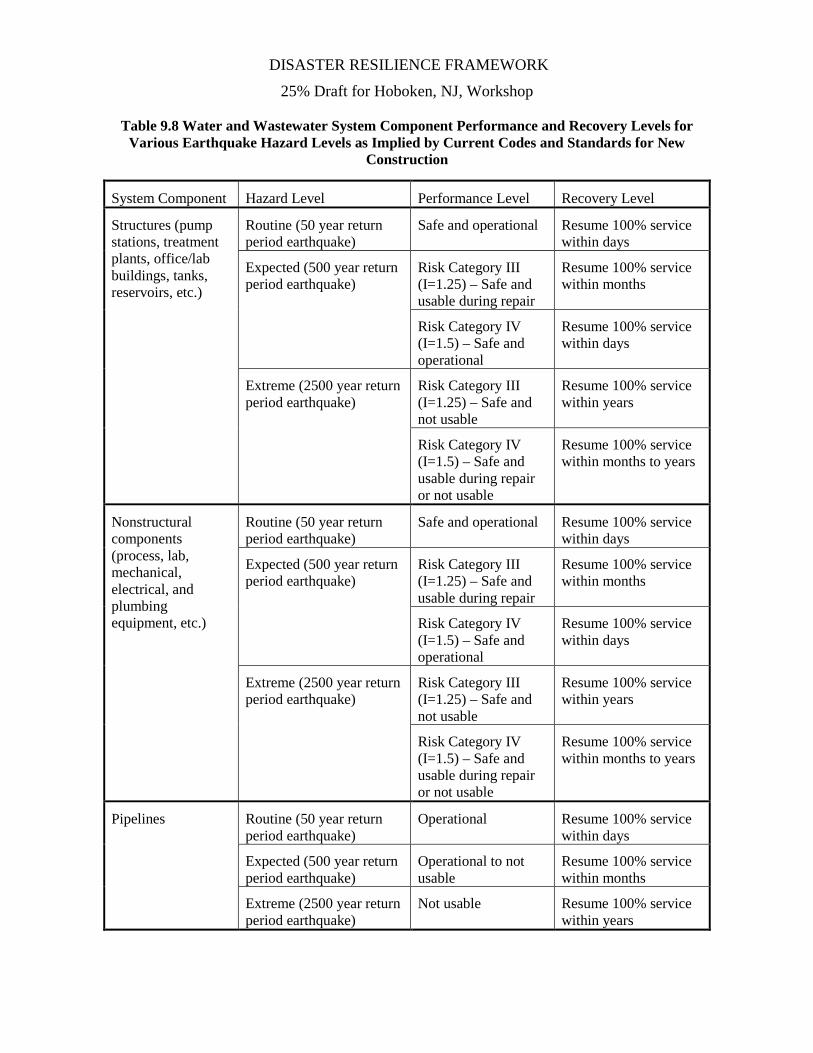
Table 9.8 summarizes water and wastewater system component performance and recovery levels for various earthquake hazard levels as implied by current codes and standards for new construction. Predicted recovery times are based on individual system components.
9.5.2. Existing Construction
This section is under development. Text to be included in a future draft.
9.5.2.1. Performance Levels
The expected seismic performance of water and wastewater system components is dependent on the hazard level and codes and standards used in original design. System components built prior to the mid-1970’s are generally expected to perform poorly in earthquakes, because design codes and standards used at that time lacked the detailing requirements that reflect our current understanding of earthquake behavior of structures. System components built after the early 2000’s are generally expected to perform similar to new construction as described above. Performance of system components built between the mid-1970’s and early 2000’s is dependent on the code edition and seismic hazard used in design. Structures that satisfy the benchmark building criteria of ASCE 41-13 (ASCE, 2013), and where there has not been a significant increase in seismicity, are generally expected to perform similar to new construction as described above. The expected performance of nonstructural components should be evaluated on a case-by-case basis, as engineers have only recently started to pay close attention to seismic design and construction of nonstructural components. The expected performance of pipelines should be evaluated on a system-by-system basis because the performance of pipelines is dependent on pipe type, joint type, and earthquake ground movement parameters.
9.5.2.2. Hazard Levels
The design seismic hazard level has been refined over time as the engineering and seismology communities understanding of the seismicity of the United States has improved. A significant portion of water and wastewater system components in the high seismicity regions of the western and central United States were designed and constructed considering a significantly lower seismic hazard than used by current codes and standards.
9.5.2.3. Recovery Levels
In general the recovery timeframe for system components will decrease for newer construction or retrofit. The Oregon Resilience Plan (OSSPAC, 2013) estimated the restoration time for pre-1975 structures to be 18 months to 3 years, 1975-1993 structures to be 3 to 6 months and 1994-present structures to be 1-3 months.
DISASTER RESILIENCE FRAMEWORK
25% Draft for Hoboken, NJ, Workshop
Table 9.8 Water and Wastewater System Component Performance and Recovery Levels for Various Earthquake Hazard Levels as Implied by Current Codes and Standards for New
Construction
System Component Hazard Level Performance Level Recovery Level
Structures (pump stations, treatment plants, office/lab buildings, tanks, reservoirs, etc.)
Routine (50 year return period earthquake)
Safe and operational Resume 100% service within days
Expected (500 year return period earthquake)
Risk Category III (I=1.25) – Safe and usable during repair
Resume 100% service within months
Risk Category IV (I=1.5) – Safe and operational
Resume 100% service within days
Extreme (2500 year return period earthquake)
Risk Category III (I=1.25) – Safe and not usable
Resume 100% service within years
Risk Category IV (I=1.5) – Safe and usable during repair or not usable
Resume 100% service within months to years
Nonstructural components (process, lab, mechanical, electrical, and plumbing equipment, etc.)
Routine (50 year return period earthquake)
Safe and operational Resume 100% service within days
Expected (500 year return period earthquake)
Risk Category III (I=1.25) – Safe and usable during repair
Resume 100% service within months
Risk Category IV (I=1.5) – Safe and operational
Resume 100% service within days
Extreme (2500 year return period earthquake)
Risk Category III (I=1.25) – Safe and not usable
Resume 100% service within years
Risk Category IV (I=1.5) – Safe and usable during repair or not usable
Resume 100% service within months to years
Pipelines Routine (50 year return period earthquake)
Operational Resume 100% service within days
Expected (500 year return period earthquake)
Operational to not usable
Resume 100% service within months
Extreme (2500 year return period earthquake)
Not usable Resume 100% service within years
DISASTER RESILIENCE FRAMEWORK
25% Draft for Hoboken, NJ, Workshop
Resilience Needs 9.6.
This section is under development. Text to be included in a future draft.
9.6.1. Standards and Codes
Section 9.3 described the basic components of water and wastewater systems and observations of where these systems have failed in past disasters. System performance is also highly dependent on the current condition of the system and standards used in its design. This information about the past disaster performance of similar systems, combined with knowledge of the current condition and original design standards of the system, helps a utility to estimate the expected level of service that they would be able to provide after a major disaster. There is likely to be a gap in the level of service that a system would provide if a major disaster occurred today versus the performance goals established by the community. It is likely that the capital expenditure required to close this performance gap far exceeds the short-term capital improvement project budgets of the utility. However, the resilience of any system can be improved incrementally over time by appropriately considering design criteria to reduce the impact of natural and man-made hazards in design of new and upgrade of existing infrastructure.
In order to estimate the level of service that a water or wastewater system would provide after a given scenario disaster, an assessment of the expected damage to the system and restoration times is required. For instance, the Oregon Resilience Plan indicates that the current estimated time to restore water and wastewater services after an expected level earthquake in the Willamette Valley (including Portland, Salem, and Eugene) is from one month to one year and along the Oregon Coast is from one to three years. Comparing these restoration estimates with a community’s level of service goals provides an indication of the resilience gap (OSSPAC, 2013).
The level of detail of this assessment can take one of three basic forms: Tier 1 - a high level assessment of performance by persons knowledgeable about the system and anticipated hazard (chief engineer, operations manager, etc.); Tier 2 - a more refined assessment based on typical system inventory (i.e. pipe type, length and soil type) using generalized component fragilities; or Tier 3 - a detailed assessment of all components in a system, specific component fragilities, and the intra-dependencies of system components. It is recommended that in order to appropriately characterize the current disaster resilience of water and wastewater systems each service provider should undergo a Tier 1 assessment, and if potential resilience vulnerabilities are identified a more refined Tier 2 or 3 assessment.
AWWA J100-10 Risk Analysis and Management for Critical Asset Protection (RAMCAP) Standard for Risk and Resilience Management of Water and Wastewater Systems (AWWA, 2010) provides one tool for conducting multi-hazard system resilience assessments. HAZUS-MH is a multi-hazard (flood, earthquake, and hurricane) loss estimation tool that has been developed by the Federal Emergency Management Agency for use in pre-disaster mitigation, emergency preparedness, and response and recovery planning (FEMA, 2012). Communities can use these tools to characterize their hazard exposure, estimate losses to the water and wastewater systems, and using this loss data estimate repair costs and duration. An example Tier 1 plus resilience assessment procedure for water systems, used in developing the Oregon Resilience Plan, is outlined below. It is recommended that these different resilience assessment tools be evaluated and refined into one consistent methodology prior to implementation of nationwide resilience assessments.
DISASTER RESILIENCE FRAMEWORK
25% Draft for Hoboken, NJ, Workshop
Tier 1 Plus Resilience Assessment, using a seismic hazard as an example:
1. Identify the appropriate earthquake hazard level
For buried pipelines:
2. Compile an inventory of system pipelines including pipe material, joint type, and length.
3. Superimpose the pipeline distribution system onto maps of the scenario hazard (peak ground acceleration, liquefaction potential, and landslide potential).
4. Use empirical relationships developed by the American Lifelines Alliance (ALA) to predict the number of breaks and leaks in the distribution system.
5. Estimate the time required to repair the predicted number of breaks and leaks based on historical crew productivity data. Modify this repair time, as appropriate, based on discussions of the expected damage states of interdependent lifelines (transportation, liquid fuel, etc.).
For above ground infrastructure:
6. Compile an inventory of system components (tanks, pump stations, treatment plants, etc.) including type of construction, date of original construction and any subsequent retrofits.
7. Based on observations from past earthquakes, the seismic hazard prescribed by the building code at the time of original construction or retrofit, and the professional judgment of engineers knowledgeable in the seismic performance of water systems estimate the level of damage predicted for the above ground water system components.
8. Estimate the time required to repair the predicted damage to above ground infrastructure. Modify this repair time, as appropriate, based on discussions of the expected damage states of interdependent lifelines (transportation, liquid fuel, etc.)
For the system:
9. Based on the repair times for buried pipelines and above ground infrastructure estimated in steps 5 and 8, determine the expected repair time for the system.
10. Compare this estimate of repair time for the system to the performance goals established by the community to determine the resilience gap.
It is important to note that the recovery time for utilities who purchase water from wholesale suppliers is highly dependent on the recovery time of the supplying utility. Wholesale water suppliers should work with their customers to assess the expected damage and restorations times from the source to the final individual customers.
Good design references are available for seismic design of water pipelines. However, there is no nationally adopted design standard that requires utilities to consider seismic design for their pipeline installations. The US water and wastewater industries needs to develop and adopt design standards for new pipelines and retrofit standards for existing pipelines.
DISASTER RESILIENCE FRAMEWORK
25% Draft for Hoboken, NJ, Workshop 9.6.2. Practice and Research Needs
Current Research
• The Los Angeles Department of Water and Power (LADWP) and the Portland Water Bureau (PWB) are conducting demonstration projects with Kubota earthquake-resistant ductile iron pipe (ERDIP). This type of pipe has been used successfully in Japan for 40 years and recent earthquakes have demonstrated its superb performance with no documented breaks or leaks. LADWP and PWB have installed this pipe in two locations in order to become familiar with design and installation of ERDIP, evaluate field installation procedures, and enable a first-hand evaluation on the use of ERDIP to improve the resilience of the LADWP and PWB water distribution systems.
• Researchers are conducting large-scale experiments to fill gaps in the knowledge database on seismic performance of newer pipeline materials like restrained joint polyvinyl chloride.
• Academic researchers (O’Rourke, 2014) are also beginning to investigate the next generation of disaster resilient pipelines. Hybrid pipelines like FlexSteel®, a steel reinforced and polyethylene lined pipe, are being evaluated for resistance to earthquakes and other disasters.
Future Development Needs
• Benefit cost analysis is a useful method to provide economic justification for resilience improvement projects. However, most current tools do not adequately consider indirect economic losses. It is recommended that a tool be developed that explicitly considers indirect economic losses. This will allow communities to make informed decisions regarding the economic benefit of various resilience improvement project options and provide utilities with another means to justify the benefits of capital improvement expenditures.
• Seismic design of buried infrastructure is highly dependent on the geotechnical engineering predictions of peak ground displacement. Refinements to these peak ground displacement prediction models based on data gathered in recent earthquakes would be helpful in prioritizing areas for retrofit of existing pipelines or installation of new pipelines that are more tolerant of ground movement.
• Gravity sewer systems are intolerant of shifts in vertical alignment due to permanent ground deformation and liquefaction. It is recommended that research be conducted on how to design sewer pipelines to be more resistant to the effects of permanent ground deformation and liquefaction.
Summary and Recommendations 9.7.
Water and wastewater systems play a critical role in our daily lives. They provide basic services for our homes, places of business, and industry. Utility-scale water and wastewater lifelines are often complex systems consisting of large distributed pipeline networks and localized facilities such as treatment plants and pump stations. The large and distributed nature of water and wastewater systems, combined with their interdependence on other lifelines, limits the practicality of maintaining 100% operational capacity in the aftermath of a major natural disaster. This chapter has described the basic components of water and wastewater systems, common weak links of these systems in major disasters, current design codes and standards, and a process by which communities can establish performance goals for their water and wastewater systems as well as evaluate their current level of disaster resilience. The following are recommendations to help communities, regions, states, and the nation improve the disaster resilience of water and wastewater systems.
DISASTER RESILIENCE FRAMEWORK
25% Draft for Hoboken, NJ, Workshop
Hardened Backbone: Performance goals can be established around the concept of a hardened backbone system. A backbone network should be capable of supplying key health and safety related community needs shortly after a disaster, while more extensive repairs are being completed on the remainder of the system.
Implementing Innovative Technologies: The US water and wastewater industry should be encouraged to adopt promising new technologies into practice. Newer developments, such as earthquake resistant ductile iron pipe joints have demonstrated successful seismic performance in Japan and should be considered for implementation in US practice.
Interdependencies: Communities should critically review co-located lifelines for impacts on resilience. For example, failure of a bridge supporting a water pipeline could results in failure of the pipe or failure of pipe supported by a bridge may result in major leaks causing scour of the soil around the bridge abutment and potential failure of the bridge.
Water Quality Impacts: Communities should consider potential adverse water source quality impacts of a disaster. Runoff following wildfire has the potential to increase surface water source turbidity and render the water source unusable for drinking water. Man-made hazards, flooding, and earthquake events have the potential to generate fuel spills from storage tanks, releases of untreated wastewater and other adverse impacts for source water quality.
Capital Improvement Planning and Asset Management: Utilities should be encouraged to consider disaster resilience in establishing priorities for capital improvement projects and asset management. It may not be economical to complete a project from a disaster resilience perspective alone. But the incremental cost of considering disaster resilience in planned retrofit and replacement projects is very minor compared to the added resilience benefit. Using this phased approach to resilience improvement projects will greatly improve the resilience of a community’s water and wastewater infrastructure over a period of years, while minimizing the financial burden of these improvements.
Facility Site Planning: Utilities should be encouraged to consider disaster resilience in site planning for new facilities and prior to significant capital improvement projects at existing facilities. New facilities should not be located in disaster prone locations, such as floodplain or tsunami inundation zones. Additionally, it may not be a wise economic investment to complete multi-hazard resilience upgrades to facilities in these disaster prone locations unless the locational hazard is also addressed.
Redundancy: The City of Sendai, Japan had installed 21 buried water tanks after the 1995 Kobe earthquake. These tanks included earthquake shutoff valves that would close automatically when strong ground shaking was detected in order to prevent the tank from draining due to damage elsewhere in the system. The water saved in these tanks could then be used as a source of potable water immediately after the earthquake. The majority of these tanks and earthquake values performed well in the 2011 Tohoku earthquake and were able to serve as a water source for the local community after the earthquake. However, two of the tanks were in the tsunami inundation zone and therefore, not usable as a potable
DISASTER RESILIENCE FRAMEWORK
25% Draft for Hoboken, NJ, Workshop source after the earthquake and tsunami (Tang & Edwards, 2014). US utilities should consider various options, such as these added storage tanks, to improve system redundancy.
Redundancy: Redundant systems are inherently more resilient. In Japan, many water utilities are implementing loop transmission main systems to increase system redundancy. Water and wastewater utilities should evaluate this loop system approach, addition of isolation valves, and other methods to improve system redundancy. This is especially important for backbone system pipelines that serve critical locations (hospitals, large industrial customers, etc.) and need to be robust and redundant.
Consequence-based planning: When conducting precovery planning (pre-disaster and recovery) it is recommended that a consequence-based approach be adopted. By thoroughly considering the downstream physical, societal, and economic impacts of a given action from a disaster resilience perspective the optimum decision can be reached.
Scenario Development: When developing design and assessment standards for disaster resilience it is important to consider the appropriate hazard level. A system could be designed to remain operational after an extremely rare event, but the economic cost of system upgrades and required new infrastructure would be prohibitively costly. However, the system should be designed to have enough resilience to remain operational after a minor, semi-frequently occurring disaster (i.e. 50-year return period earthquake). Scenario development and consequence-based planning should be closely linked. The components of a system where the consequence of failure is much higher should be designed for a less frequently occurring (more extreme) disaster. It is recommended that water and wastewater backbone components be designed or retrofit to be operational after an extreme level event.
Rating System: The water and wastewater industry should be encouraged to develop a disaster resiliency rating system to track how utilities are performing with respect to improvements in system resilience.
Disaster Response Plan: Utilities should be encouraged to create or update their disaster response plans based on response and recovery goals established by the community. Community-wide training events should be conducted to exercise these plans and work out issues prior to implementing them in an actual disaster.
The Water and Wastewater Agency Response Network (WARN) is an established intrastate contractual relationship for sharing resources necessary to respond to a disaster. The WARN system is currently limited to intrastate mutual aid. However, disasters such as a potential Cascadia Subduction Zone earthquake in the Pacific Northwest have the potential to significantly impact multistate regions and overwhelm local resources. It is recommended that the WARN system be expanded to facilitate easier sharing of resources across state lines.
Regulatory Compliance: Communities should work with regulatory agencies before a disaster to establish acceptable practices and operational standards for use during the disaster response phase. The planning should address questions like, will it be acceptable to discharge raw sewage to receiving bodies of water?
DISASTER RESILIENCE FRAMEWORK
25% Draft for Hoboken, NJ, Workshop
Temporary Sanitary Services: Communities should work with utilities and public health agencies to identify before the event who will be responsible for temporary sanitation services (portable toilets).
Temporary Water Supply: Communities should work with utilities to plan for water supply at key distribution points for firefighting and distribution of emergency drinking water. This may require installation of valves and hydrants prior to the event to improve access after the event.
Emergency Kit: It should be recommended that community members and employers maintain emergency kits with water and personal sanitation supplies that are adequate for the expected duration of interruption in service.
Business Continuity Plan: Utilities should develop business continuity plans that include on-call contracts or agreements with contractors, consultants, and essential suppliers (fuel, equipment, repair materials, process chemicals, etc.). Utilities should evaluate if current emergency response contingency funds are adequate for the level of damage predicted by an analysis of the system for the disaster scenarios adopted by the community and modify funding levels as appropriate.
DISASTER RESILIENCE FRAMEWORK
25% Draft for Hoboken, NJ, Workshop REFERENCES
ASCE. (2010). Minimun Design Loads for Buildings and Other Structures. Reston, VA: American
Society of Civil Engineers. ASCE. (2013). Seismic Evaluation and Rehabilitation of Existing Buildings. Reston, VA: American
Society of Civil Engineers. AWWA. (1994). Minimizing Earthquake Damage, A Guide for Water Utilities. Denver, CO: American
Water Works Association. Ballantyne, D., & Crouse, C. (1997). Reliability and Restoration of Water Supply Systems for Fire
Suppression and Drinking Following Earthquakes. Gaithersburg, MD: National Institute of Standards and Technology.
Bruneau, M., Chang, S., Euguchi, R., Lee, G., O’Rourke, T., Reinhorn, A., Shinozuka, M., Tierney, K.,
Wallace, W., and von Winterfelt, D. (2003). A Framework to Quantitatively Assess and Enhance the Seismic Resilience of Communities, Earthquake Spectra, Vol. 19, No. 4, 733-752.
Eidinger, J. (2012). Performance of Water Systems during the Maule Mw 8.8 Earthquake 27 February
2010. Earthquake Spectra, Vol. 28, No. S1, S605-S620. Eidinger, J., & Tang, A. (2014). Christchurch, New Zealand Earthqake Sequence of Mw 7.1 September
04, 2010 Mw 6.3 February 22, 2011 Mw 6.0 June 13, 2011: Lifeline Performance. Reston, VA: American Society of Civil Engineers.
Elliott, T., & Tang, A. (2009). Pacific Northwest Storms of December 1-4, 2007 Lifeline Performance.
Reston, VA: American Society of Civil Engineers. FEMA. (2012). Hazus-MH 2.1 User Manual. Washington, DC: Federal Emergency Management Agency. FEMA. (2013). Mitigation Assessment Team Report Hurricane Sandy in New Jersey and New York
Building Performance Observations, Recommendations, and Technical Guidance . Washington, DC: Federal Emergency Management Agency.
Matsuhashi, M., Fukatani, W., Yokota, T., Ozaki, M., & Horie, N. (2012). The Damage of Sewage
Treatment Systems Caused by the Great East Japan Earthquake. International Symposium on Engineering Lessons Learned from the 2011 Great East Japan Earthquake, Tokyo, Japan.
Miyajima, M. (2012). Damage to Water Supply System Induced by the 2011 Great East Japan
Earthquake. International Symposium on Engineering Lessons Learned from the 2011 Great East Japan Earthquake, Tokyo, Japan.
NIST. (1996). The January 17, 1995 Hyogoken-Nanbu (Kobe) Earthquake: Performance of Structures,
Lifelines, and Fire Protection Systems. Gaithersburg, MD: National Institute of Standards and Technology.
DISASTER RESILIENCE FRAMEWORK
25% Draft for Hoboken, NJ, Workshop O’Rourke, T. (2014). Resilient Lifeline Systems, ASCE TCLEE LeVal Lund Lecture, April 2, 2014,
California Institute of Technology, Pasadena, CA. OSSPAC. (2013). The Oregon Resilience Plan, Reducing Risk and Improving Recovery for the Next
Cascadia Earthquake and Tsunami. Salem, OR: Oregon Seismic Safety Policy Advisory Commission.
SFPUC. (2006). General Seismic Requirements for Design of New Facilities and Upgrade of Existing
Facilities. San Francisco, CA: San Francisco Public Utilities Commission. Schiff, A. (1997). Northridge Earthquake: Lifeline Performance and Post-Earthquake Response.
Gaithersburg, MD: National Institute of Standards and Technology. Tang, A., & Edwards, C. (2014). Tohoku, Japan, Earthquake and Tsunami of March 11, 2011 Lifeline
Performance. Reston, VA: American Society of Civil Engineers.