Embed Size (px)
Citation preview

9 Testing the SystemTesting the system is very different from unit and integration testing. When you unit test your
components, you have complete control over the testing process. You create your own test data, design your own test cases, and run the tests yourself when you integrate components, you sometimes work by yourself but often you collaborate with a small part of the test or development team. However, when you test a system, you work with the entire development team, coordinating what you do and being directed by the test team leader. In this chapter, we look at the system testing process: its purpose, steps, participants, techniques, and tools.
9.1 PRINOPLES OF SYSTEM TESTINGThe objective of unit and integration testing was to ensure that the code implemented the
design properly; that is, that the programmers wrote code to do what the designers intended. In system testing, we have a very different objective: to ensure that the system does what the customer wants it to do. To understand how to meet this objective, we first must understand where faults in the system come from.Sources of Software Faults
Recall that a software fault causes a failure only when accompanied by the right conditions. That is, a fault may exist in the code, but if the code is never executed, or if the code is not executed long enough or in the appropriate configuration to cause a problem, we may never see the software fail. Because testing cannot exercise every possible condition, we keep as our goal the discovery of faults, hoping that in the process, we eliminate all faults that might lead to failures during actual system usage.
Software faults can be inserted in a requirement, design, or code component, or in the documentation, at any point during development or maintenance. Figure 9.1 illustrates the likely causes of faults in each development activity. Although we would like to find and correct faults as early as possible, system testing acknowledges that faults may still be present after integration testing.
Faults can be introduced to the system early in development or late, such as when correcting a newly discovered fault. For example, defective software can result from faults in the requirements whether a requirement was ambiguous because the customer was unsure of a need or because we misinterpreted the customer's meaning, the result is the same: a system that does not work the way the customer wants it to work. The same kind of communication mishaps can occur during system design. We may misinterpret a requirement and write an incorrect design specification. Or we understand the requirement but may word the specification so poorly that those who subsequently read it and use the design misunderstand it. Similarly, we may make assumptions about characteristics and relationships that are not shared by the other readers of the design.
Similar events can lead to program design faults. Misinterpretations are common when the system design is translated into lower-level descriptions for program design specifications. Programmers are several levels removed from the initial discussions with customers about system goals and functionality Having responsibility for one "tree" but not the "forest," programmers cannot be expected to spot design faults that have been perpetuated through the first steps of the development cycle. For this reason, requirements and design reviews are essential to assuring the quality of the resulting system.

Incorrect, missing, or unclear requirements
Incorrect or unclear translation
Incorrect or unclear design specification
Incorrect or unclear design specification
Misinterpretation of system design
Misinterpretation of program design
Incorrect documentation
Incorrect syntax or semantics
Incomplete test procedures
New faults introduced when old ones corrected
Incomplete test procedures
Incorrect user documentation
Poor human factors
New faults introduced when old ones corrected
Changes in requirements
FIGURE 9.1 Causes of faults during development.The programmers and designers on our development team may also fail to use the proper
syntax and semantics for recording their work. A compiler or assembler can catch some of these faults before a program is run, but they will not find faults when the form of a statement is correct but does not match the intention of the programmer or designer.
Once program component testing begins, faults may be added unintentionally in making changes to correct other problems. These faults are often very difficult to detect, because they may appear only when certain functions are exercised, or only under certain conditions. If those functions have already been tested when a new fault is inadvertently added, the new fault may not be noticed until much later, when its source may not be clear. This situation is likely to happen if we are reusing code from other applications, and we modify it to suit our current needs. The nuances of the code's design may not be apparent, and our changes may in fact do more damage than good.
For example, suppose you are testing components A, B, and C. You test each separately when you test all three together, you find that A passes a parameter to C incorrectly In repairing A, you make sure that the parameter pass is now correct, but you add code that sets a pointer incorrectly Because you may not go back and test A independently again, you may not find evidence of the new fault until much later in testing, when it is not clear that A is the culprit.
In the same way, maintenance may introduce new faults. System enhancements. Rquire changes to the requirements, the system architecture, the program design, and the implementation itself, so many kinds of faults can be inserted as the enhancement is described, designed, and
RequirementsanalysisSystemdesign
Programdesign
Programimplemention
Unit/integration
Systemtesting
Maintenance

coded. In addition, the system may not function properly because users do not understand how the system was designed to work. If the documentation is unclear or incorrect, a fault may result. Human factors, including user perception, play a large role in understanding the system and interpreting its messages and required input. Users who are not comfortable with the system may not exercise system functions properly or to greatest advantage.
Test procedures should be thorough enough to exercise system functions to everyone's satisfaction: user, customer, and developer. If the tests are incomplete, faults may remain undetected. As we have seen, the sooner we detect a fault, the better; faults detected early are easier and cheaper to fix. Thus, complete and early testing can help not only to detect faults quickly, but also to isolate the causes more easily.
Figure 9.1 shows the reasons for faults, not evidence of them. Because testing aims to uncover as many faults as possible, it is concerned with where they may exist. Knowing how faults are created gives us clues about where to look when testing a system.System Testing Process
There are several steps in testing a system:1. function testing2. performance testing3. acceptance testing4. installation testing
FIGURE 9.2 Steps in the testing process.The steps are illustrated in Figure 9.2. Each step has a different focus, and a step's success
depends on its goal or objective. Thus, it is helpful to review the purpose of each step of system testing.
Process objectives. Initially, we test the functions performed by the system. We begin with a set of components that were tested individually and then together. A function test checks that the integrated system performs its functions as specified in the requirements. For example, a function test of a bank account package verifies that the package can correctly credit a deposit, enter a withdrawal, calculate interest, print the balance, and so on.
once the test team is convinced that the functions work as specified, the performance test compares the integrated components with the nonfunctional system requirements. These requirements, including security, accuracy speed, and reliability, constrain the way in which the system functions are performed. For instance, a performance test of the bank account package evaluates the speed with which calculations are made, the precision of the computation, the security precautions required, and the response time to user inquiry
At this point, the system operates the way the designers intend. We call this a verified system; it is the designers' interpretation of the requirements specification. Next, we compare the system with the customer's expectations by reviewing the requirements definition document. If we are satisfied that the system we have built meets the requirements, then we have a validated system; that is, we have verified that the requirements have been met.
So far, all the tests have been run by the developers, based on their understanding of the system and its objectives. The customers also test the system, making sure that it meets their understanding of the requirements, which may be different from the developers. This test, called an acceptance test, assures the customers that the system they requested is the system that was

built for them. The acceptance test is sometimes run in its actual environment but often is run at a test facility different from the target location. For this reason, we may run a final installation test to allow users to exercise system functions and document additional problems that result from being at the actual site. For example, a naval system may be designed, built, and tested at the developer's site, configured as a ship might be, but not on an actual ship. Once the development site tests are complete, an additional set of installation tests may be run with the system on board each type of ship that will eventually use the system.
Build or Integration Plan. Ideally, after program testing, you can view the collection of components as a single entity Then, during the first steps of system testing, the integrated collection is evaluated from a variety of perspectives, as previously described. However, large systems are sometimes unwieldy when tested as one enormous collection of components. In fact, such systems are often candidates for phased development, simply because they are much easier to build and test in smaller pieces. Thus, you may choose to perform phased system testing. We saw in Chapter 1 that a system can be viewed as a nested set of levels or subsystems. Each level is responsible for performing at least the functions of those subsystems it contains. Similarly we can divide the test system into a nested sequence of subsystems and perform the system test on one subsystem at a time.
The subsystem definitions are based on predetermined criteria. Usually, the basis for division is functionality For example, we saw in Chapter 8 that Microsoft divides a product into three subsystems based on most critical functions, desirable functions, and least needed functions. Similarly, a telecommunications system that routes calls may be divided into subsystems in the following way:
1. Routing calls within an exchange2. Routing calls within an area code3. Routing calls within a state, province, or district4. Routing calls within a country5. Routing international callsEach larger subsystem contains all the subsystems preceding it. We begin our system testing
by testing the functions of the first system. when all of the within-exchange functions are tested successfully we proceed to test the second system. Similarly, we test the third, fourth, and fifth systems in turn. The result is a successful test of the entire system, but incremental testing has made fault detection and correction much easier than it would have been had we focused only on the largest system. For example, a problem revealed during function tests of calling within a state, province, or district is likely to be the result of code that handles state but not area code or exchange information. Thus, we can narrow our search for the cause to the code in subsystem 3 plus the code in 1 or 2 affected by 3. Had this problem been discovered only when all subsystems were integrated, we could not easily pinpoint the likely source.
Incremental testing requires careful planning. The test team must create a build plan or integration plan to define the subsystems to be tested and to describe how where, when, and by whom the tests will be conducted. Many of the issues we discussed in integration testing must be addressed by the build plan, including order of integration and the need for stubs or drivers.
Sometimes, a level or subsystem of a build plan is called a spin. The spins are numbered, with the lowest level called spin zero. For large systems, spin zero is often a minimal system; it is sometimes even just the operating system on a host computer.
For example, the build plan for the telecommunications system may contain a schedule similar to the one in Table 9.1. The build plan describes each spin by number, functional content, and testing schedule. If a test of spin n succeeds and a problem arises in spin n + 1, then the most likely source of the problem is related to the difference between spins n and n + 1, namely the added functionality from one spin to the next. If the difference between two successive spins is small, then we have relatively few places to look for the problem's cause.
The number of spins and their definition depend primarily on our resources and those of our customer. These resources include not only hardware and software, but also time and personnel availability. A minimal system is placed in the earliest spin, and subsequent spins are defined by integrating the next most important or critical functions as early as is feasible. For example, consider the star network shown in Figure 9.3. The star's center is a computer that receives messages from several smaller computers, each of which captures data from sensors and transmits them for processing. Thus, the major functions of the central computer are translating and assimilating messages from the outlying computers. Since these functions are critical to the whole system, they should be included in an early spin. In fact, we may define the spins in the following way:
TABLE 9.1 Build Plan for Telecommunications System
Spin Functions Test Start Test End
0 Exchange 1 September 15 September
1 Area code 30 September 15 October
2 State/Province/district 25 October 5 November
3 Country 10 November 20 November
4 International 1 December 15 December
FIGURE 9.3 Star network example.. Spin 0: test the central computer's general functions. Spin l: test the central computer's message translation function. Spin 2: test the central computer's message assimilation function. Spin 3: test each outlying computer in the stand-alone mode. Spin 4: test the outlying computer's message sending function. Spin 5: test the central computer's message receiving function
and so on.The spin definitions also depend on the system components' ability to operate in the stand-
alone mode. It may be harder to simulate a missing piece of a system than to incorporate it in a spin, since interdependencies among parts sometimes require as much simulation code as actual code. Remember that our goal is to test the system. The time and effort needed to build and use

test tools might better be spent in testing the actual system. This trade-of f is similar to that involved in selecting a test philosophy during unit and integration testing: Developing many stubs and drivers may require as much time during program testing as testing the original components they simulate.Configuration Management
We often test a system in stages or pieces, based on spins (as before) or on subsystems, functions, or other decompositions that make testing easier to handle. (We look at these testing strategies later in this chapter.) However, system testing must also take into ac. count the several different system configurations that are being developed. A system configuration is a collection of system components delivered to a particular customer. For example, a mathematical computation package may be sold in one configuration for UNIX-based machines, in another for windows machines, and still another for Solaris systems. The configurations may be further distinguished by those running on certain kinds of chips or with particular devices available. Usually we develop core software that runs on each, and we use the principles described in Chapters 5, 6 and 7 to isolate the differences among configurations to a small number of independent components. For instance, the core functionality may be contained in components A, B, and C; then, configuration 1 includes A, B, C, and D, and configuration 2 is A, B, C, and E.
Developing and testing these different configurations requires configuration management, the control of system differences to minimize risk and error. We have seen in earlier chapters how the configuration management team makes sure that changes to requirements, design, or code are reflected in the documentation and in other components affected by the changes. During testing, configuration management is especially important, coordinating efforts among the testers and developers.
Versions and Releases. A configuration for a particular system is sometimes called a version. Thus, the initial delivery of a software package may consist of several versions, one for each platform or situation in which the software will be used. For example, aircraft software may be built so that version 1 runs on Navy planes, version 2 runs on Air Force planes, and version 3 runs on commercial airliners.
As the software is tested and used, faults are discovered that need correction or minor enhancements are made to the initial functionality A new release of the software is an improved system intended to replace the old one. Often, software systems are described as version n, release m, or as version n.m, where the number reflects the system's position as it grows and matures. Version n is sometimes intended to replace version n-1, and release m supersedes m-1. (The word "version" can have two different meanings: a version for each type of platform or operating system, or one in a sequence of phased products. The terminology is usually understood from the context in which it is used. For example, a vendor might provide version 3 of its product on a UNIX platform and version 4 on a windows platform, each offering the same functionality)
The configuration management team is responsible for assuring that each version or release is correct and stable before it is released for use, and that changes are made accurately and promptly Accuracy is critical, because we want to avoid generating new faults while correcting existing ones. Similarly promptness is important, because fault detection and correction are proceeding at the same time that the test team searches for additional faults. Thus, those who are trying to repair system faults should work with components and documentation that reflect the current state of the system.

Tracking and controlling versions are especially important when we are doing phased development. As we noted in earlier chapters, a production system is a version that has been tested and performs according to only a subset of the customer's requirements. The next version, with more features, is developed while users operate the production system. This development system is built and tested; when testing is compete, the development system replaces the production system to become the new production system.
For example, suppose a power plant is automating the functions performed in the control room. The power plant operators have been trained to do everything manually and are uneasy about working with the computer, so we decide to build a phased system. The first phase is almost identical to the manual system, but it allows the plant operators to do some automated record keeping. The second phase adds several automated functions to the first phase, but half of the control room functions are still manual. Successive phases continue to automate selected functions, building on the previous phases until all functions are automated. By expanding the automated system in this way, we allow plant operators slowly to become accustomed to and feel comfortable with the new system.
At any point during the phased development, the plant operators are using the fully tested production system. At the same time, we are working on the next phase, testing the development system. When the development system is completely tested and ready for use by the plant operators, it becomes the production system (i.e., it is used by plant operators) and we move on to the next phase. When working on the development system, we add functions to the current production or operational system to form the new development system.
While a system is in production, problems may occur and be reported to us. Thus, a development system often serves two purposes: It adds the functionality of the next phase, and it corrects the problems found in previous versions. A development system can therefore involve adding new components as well as changing existing ones. However, this procedure allows faults to be introduced to components that have already been tested. When we write a build plan and test plans, we should address this situation and consider the need for controlling changes implemented from one version and release to the next. Additional testing can make sure that the development system performs at least as well as the current production system. However, records must be kept of the exact changes made to the code from one version to the next, so we can trace problems to their source. For example, if a user on the production system reports a problem, we must know what version and release of the code are being used. The code may differ dramatically from one version to another. If we work with the wrong listing, we may never locate the problem's cause. Worse yet, we may think we have found the cause, making a change that introduces a new fault while not really fixing the old one!
Regression Testing. As we saw in Chapter 8, the purpose of testing is to identify faults, not to correct them. However, it is natural to want to find the cause of a problem and then correct it as soon as possible after discovery. Otherwise, the test team is unable to judge whether the system is functioning properly, and the continued presence of some faults may halt further testing. Thus, any test plan must contain a set of guidelines for fault correction as well as discovery However, correcting faults during the testing process can introduce new faults while fixing old ones, as mentioned earlier.
Regression testing identifies new faults that may have been introduced as current ones are being corrected. A regression test is a test applied to a new version or release to verify that it still

performs the same functions in the same manner as an older version or release. For example, suppose that the functional test for version m was successful and testing is
proceeding on version m + 1, where m + 1 has all the functionality of m plus some new functions. You request that several lines of code be changed in m + 1 to repair a fault located in an earlier test; the code must be changed now so that the testing of m + 1 can continue. If the team is following a policy of strict regression testing, the testing involves these steps:
1. Inserting your new code2. Testing functions known to be affected by the new code3. Testing essential functions of m to verify that they still work properly (the actual regression testing)4. Continuing function testing of m + 1
These steps ensure that adding new code has not negated the effects of previous tests. Sidebar 9.1 illustrates the dangers of not performing regression tests.
Often, the regression test involves reusing the most important test cases from the previous level's test; if you specify regression testing in your test plan, you should also explain which test cases are to be used again.
Deltas, Separate Files, and Conditional Compilation. Were are three primary ways to control versions and releases, and each has implications for managing configurations during testing. Some development projects prefer to keep separate files for each different version or release. For example, a security system might be issued in two configurations: version one for machines that can store all of the data in main memory and version two for machines with less memory, where the data must be put out to disk under certain conditions. The basic functionality for the system may be common, handled by components A1 through Ak, but the memory management may be done by component B1 for version one and B2 for version two.
Suppose a fault is discovered in B1 that also exists in B2 and must be fixed to work in the same way or suppose functionality must be added to both B 1 and B2 - Keeping both versions current and correct can be difficult. The changes needed are not likely to be identical, but their results must be the same in the eyes of the user. To address this difficulty, we can designate a particular version to be the main version, and define all other versions to be variations from the main. Then, we need store only the differences, rather than all the components for each of the other versions. The difference file, called a delta, contains editing commands that describe how the main version is to be transformed to a different version. We say that we “apply a delta” to transform the main version into its variation.
The advantage of using deltas is that changes to common functionality are made only to the main version. Furthermore, deltas require far less storage space than full-blown versions. However, there are substantial disadvantages. If the main version is lost or corrupted, then all versions are lost. More importantly, it is sometimes very difficult to represent each variation as a transformation from the main version. For example, consider a main version containing the following code:
…26 int total = o;
…A delta file defines a variation that replaces line 26 with new code:
26 int total x l;

However, suppose a change is made to the main version file adding a line between lines 15 and 16.Then line 26 becomes line 27, and applying the delta changes the wrong command. Thus, sophisticated techniques are needed to maintain the correspondence between the main version and its variations, and to apply the deltas properly.
Deltas are especially useful for maintaining releases. The first release is considered to be the main system, and subsequent releases are recorded as a set of deltas to release 1.
A third approach to controlling file differences is to use conditional compilation. That is, a single code component addresses all versions. Conditional statements use the compiler to determine which statements apply to which versions. Because the shared code appears only once, we can make one correction that applies to all versions. However, if the variations among versions are very complex, the source code may be very difficult to read-and understand. Moreover, for large numbers of versions, the conditional compilation may become unmanageable.
Conditional compilation addresses only the code. However, separate files and deltas are useful not only in controlling code, but also in controlling other development artifacts such as requirements, design, test data, and documentation. Sidebar 9.2 illustrates how both deltas and separate files can be useful in organizing and changing large systems.
Change Control. The configuration management team works closely with the test team to control all aspects of testing. Any f change proposed to any part of the system is approved first by the configuration management team. The change is entered in all appropriate components and documentation, and the team notifies all who may be affected. For example, if a test results in modifying a requirement, changes are also likely to be needed in the requirements specification, the system design, the program design, the code, all relevant documentation, and even the test plan itself. Thus, altering one part of the system may affect everyone who is working on the system's development.
Change control is further complicated when more than one developer is making a change to the same component. For instance, suppose that two failures occur during testing. Jack is assigned to find and fix the cause of the first failure, and Jill is assigned to find and fix the cause of the second. Although the failures at first seem unrelated, Jack and Jili both discover that the root cause is in a code component called initialize. Jack may remove initialize from the system library make his changes, and place his corrected version back in the library. Then Jill, working from the original version, makes her corrections and replaces Jack's corrections with hers, thereby undoing his! Regression testing may reveal that Jack's assigned fault is still uncorrected, but effort and time have been wasted.
To address this problem, the configuration management team performs change control. The team oversees the libraries of code and documents, and developers must "check out" copies when making fixes. In our example, Jill would not have been able to obtain a copy of initialize until Jack had replaced his version with a corrected, tested version. Or the configuration management team would have taken the extra step of consolidating Jack's and Jill's versions into one version; then, the consolidated version would have undergone regression testing as well as testing to ensure that both failures were eliminated.
An additional method for assuring that all project members are working with the most up-to-date documents is to keep them online. By viewing documents on a screen and updating them immediately, we avoid the time lag usually caused by having to print and distribute new or revised pages. However, the configuration management team still maintains some degree of control to

make sure that changes to documents mirror changes to design and code. We may still have to "check out" versions in order to change them, and we may be told that some documents are locked or unavailable if someone else is working with them. Sidebar 9.3 describes how Microsoft uses private copies of source code to allow developers to test changes individually before changes are combined into the day's build.Test Team
As we will see, the developers have primary responsibility for function and performance testing, but the customer plays a large role in acceptance and installation tests. However, the test team for all tests is drawn from both staffs. Often, no programmers from the project are involved in system testing; they are too familiar with the implementation's structure and intention, and they may have difficulty recognizing the differences between implementation and required function or performance.
Thus, the test team is often independent of the implementation staff Ideally some test team members are already experienced as testers. Usually, these "professional testers" are former analysts, programmers, and designers who now devote all their time to testing systems. The testers are familiar not only with the system specification, but also with testing methods and tools.
Professional testers organize and run the tests. They are involved from the beginning, designing test plans and test cases as the project progresses. The professional testers work with the configuration management team to provide documentation and other mechanisms for tying tests to the requirements, design components, and code.
The professional testers focus on test development, methods, and procedures. Because the testers may not be as well-versed in the particulars of the requirements as those who wrote them, the test team includes additional people who are familiar with the requirements. Analysts who were involved in the original requirements definition and specification are useful in testing because they understand the problem as defined by the customer. Much of system testing compares the new system to its original requirements, and the analysts have a good feeling for the customer's needs and goals. Since they have worked with the designers to fashion a solution, analysts have some idea of how the system should work to solve the problem.
System designers add the perspective of intent to the test team. The designers understand what we proposed as a solution, as well as the solution's constraints. They also know how the system is divided into functional or data-related subsystems, and how the system is supposed to work. When designing test cases and assuring test coverage, the test team calls on the designers for help in listing all possibilities.
Because tests and test cases are tied directly to requirements and design, a configuration management representative is on the test team. As failures occur and changes are requested, the configuration management specialist arranges for the changes to be reflected in the documentation, requirements, design, code, or other development artifact. In fact, changes to correct a fault may result in modifications to other test cases or to a large part of the test plan. The configuration management specialist implements these changes and coordinates the revision of tests.
Finally the test team includes users. They are best qualified to evaluate issues dealing with appropriateness of audience, ease of use, and other human factors. Sometimes, users have little voice in the early stages of the project. Customer representatives who participate during requirements analysis may not plan to use the system but have jobs related to those who will. For

instance, the representatives may be managers of those who will use the system or technical representatives who have discovered a problem that indirectly relates to their work. However, these representatives may be so removed from the actual problem that the requirements description is inaccurate or incomplete. The customer may not be aware of the need to redefine or add requirements.
Therefore, users of the proposed system are essential, especially if they were not present when the system requirements were first defined. A user is likely to be familiar with the problem because of daily exposure to it, and can be invaluable in evaluating the system to verify that it solves the problem.
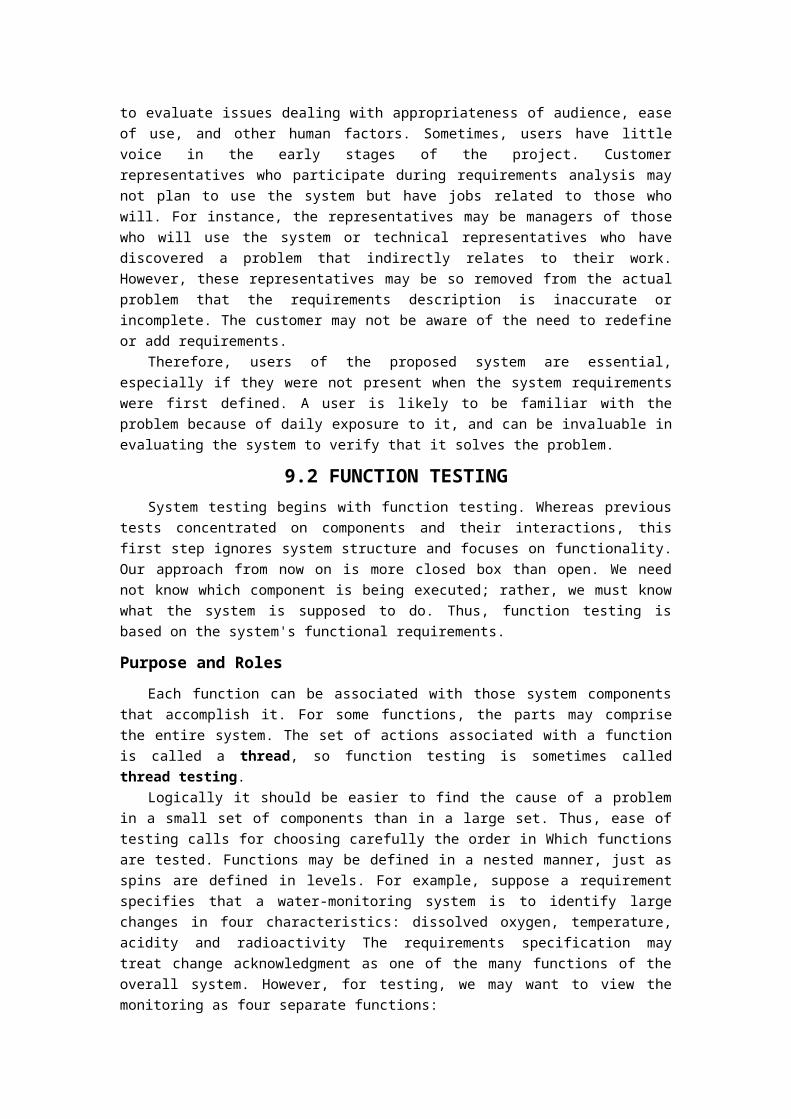
9.2 FUNCTION TESTINGSystem testing begins with function testing. Whereas previous tests concentrated on
components and their interactions, this first step ignores system structure and focuses on functionality. Our approach from now on is more closed box than open. We need not know which component is being executed; rather, we must know what the system is supposed to do. Thus, function testing is based on the system's functional requirements.Purpose and Roles
Each function can be associated with those system components that accomplish it. For some functions, the parts may comprise the entire system. The set of actions associated with a function is called a thread, so function testing is sometimes called thread testing.
Logically it should be easier to find the cause of a problem in a small set of components than in a large set. Thus, ease of testing calls for choosing carefully the order in Which functions are tested. Functions may be defined in a nested manner, just as spins are defined in levels. For example, suppose a requirement specifies that a water-monitoring system is to identify large changes in four characteristics: dissolved oxygen, temperature, acidity and radioactivity The requirements specification may treat change acknowledgment as one of the many functions of the overall system. However, for testing, we may want to view the monitoring as four separate functions:
. acknowledging change in dissolved oxygen
. acknowledging change in temperature
. acknowledging change in acidity
. acknowledging change in radioactivityThen, we test each one individually
Effective function tests should have a high probability of detecting a fault. We use the same guidelines for function testing that we use for unit testing. That is, a test should
. have a high probability of detecting a fault
. use a test team independent of the designers and programmers
. know the expected actions and output
. test both valid and invalid input
. never modify the system just to make testing easier
. have stopping criteriaFunction testing is performed in a carefully controlled situation. Moreover, since we are
testing one function at a time, function testing can actually begin before the entire system is constructed, if need be.
Function testing compares the system's actual performance with its requirements, so the test

cases for function testing are developed from the requirements document. For example, a word processing system can be tested by examining the way in which the system handles
. document creation
. document modification
. document deletionWithin each category different functions are tested. For instance, document modification can
be tested by looking at. adding a character. adding a word. adding a paragraph. deleting a character. deleting a word. deleting a paragraph. changing the font. changing the type size. changing the paragraph formatting
and so on.Cause-and-Effect Graphs
Testing would be easier if we could automatically generate test cases from the requirements. Work has been done at IBM (Elmendorf 1973, 1974) to convert the natural language of requirements definitions to a formal specification that can be used to enumerate test cases for functional testing. The test cases that result are not redundant; that is, one test case does not test functions that have already been tested by another case. In addition, the process finds incomplete and ambiguous aspects of requirements, if any exist.
The process examines the semantics of the requirements and restates them as logical relationships between inputs and outputs or between inputs and transformations. The inputs are called causes, and the outputs and transformations are effects. The result is a Boolean graph reflecting these relationships, called a cause-and-effect graph.
We add information to the initial graph to indicate rules of syntax and to reflect environmental constraints. Then, we convert the graph to a decision table. Each column of the decision table corresponds to a test case for functional testing.
There are several steps in creating a cause-and-effect graph. First, the requirements are separated so each requirement describes a single function. Then, all causes and effects are described. The numbered causes and effects become nodes of the graph. Placing causes on the left-hand side of the drawing and effects on the right, we draw the logical relationships depicted in the graph by using the notation shown in Figure 9.4. Extra nodes can be used to simplify the graph.
Let us work through an example to see how to build this type of graph. Suppose we are testing a water-level monitoring system that reports to an agency involved with flood control. The requirements definition for one of the system functions reads as follows:
The system sends a message to the dam operator about the safety of the lake level. Corresponding to this requirement is a design description:
INPUT The syntax of the function is LEVEL(A,B)
where A is the height in meters of the water behind the dam, and B is the number of

centimeters of rain in the last 24-hour period.
PROCESSING: The function calculates whether the water level is within a safe range,
is too high, or is too low
OUTPUT The screen shows one of the following messages'
L "LEVEL = SAFE" when the result is safe or low
2. "LEVEL = HIGH" when the result is high.
3. "INVALID SYNTAX"
depending on the result of the calculation.
FIGURE 9.4 Notation for cause-and-effect graphsWe can separate these requirements into five "causes":
1. The first fire characters of the command "LEVEL."2. The command contains exactly two parameters separated by a comma and enclosed in parentheses.3. The parameters A and B are real numbers such that the water level is calculated to be LOW4. The parameters A and B are real numbers such that the water level is calculated to be SAFE.5. The parameters A and B are real numbers such that the water level is calculated to be HIGH.
We can also describe three "effects":1. The message "LEVEL = SAFE" is displayed on the screen.2. The message "LEVEL = HIGH" is displayed on the screen.3. The message "INVALID SYNTAX" is printed out.
These become the nodes of our graph, However, the function includes a check on the parameters to be sure that they are passed properly To reflect this, we establish two intermediate nodes:
1. The command is syntactically valid.2. The operands are syntactically valid.
We can draw the relationships between cause and effect, as shown in Figure 9.5. Notice that there are dashed lines to the left of the effects. These lines mean that exactly one effect can result. Other notations can be made on cause-and-effect graphs to provide additional information. Figure 9.6 illustrates some of the possibilities.
Thus, by looking at the graph, we can tell if. exactly one of a set of conditions can be invoked. at most one of a set of conditions can be invoked
FIGURE 9.5 Cause-and-effect graph. FIGURE 9.6 Additional graph notation.. at least one of a set of conditions can be invoked. one effect masks the observance of another effect. invocation of one effect requires the invocation of another
At this point, we are ready to define a decision table using the information from the cause-and-effect graph. We put a row in the table for each cause or effect. In our example, our decision table needs five rows for the causes and three rows for the effects. The columns of the decision table correspond to the test cases. We define the columns by examining each effect and listing an combination of causes that can lead to that effect.
In our LEVEL example, we can determine the number of columns in the decision table by examining the lines flowing into the effect nodes of the graph. We see in Figure 9.5 that there are two separate lines flowing into E3; each corresponds to a column. There are four lines flowing into E1, but only two combinations yield the effect. Each of the combinations is a column in the table. Finally only one combination of lines results in effect E2, so we have our fifth column.
Each column of the decision table represents a set of states of causes and effects We keep track of the states of other conditions when a particular combination is invoked. We indicate the condition of the cause by placing an I in the table when the cause is invoked or true, or an S if the cause is suppressed or false, If we do not care whether the cause is invoked or suppressed, we can use an X to mark the "don't-care" state. Finally we indicate whether a particular effect is absent (A) or present (P).
For testing the LEVEL function, the five columns of Table 9.2 display the relationship between invocation of causes and the resultant effects. If causes 1 and 2 are true (i.e-, the command and parameters are valid), then the effect depends on whether causes 3, 4, or 5 are true. If cause 1 is true but cause 2 is false, the effect is already determined, and we don't care about the state of causes 3, 4, or 5. Similarly, if cause 1 is false, we no longer care about the states of other causes.
TABLE 9.2 Decision 1hble for Cause-and-effect Graph
Test 1 Test2 Test 3 Test4 Test 5
Cause1 I I I S I
Cause2 I I I X S
Cause3 I S S X X
Cause4 S I S X X
Cause5 S S I X X
Effect1 P P A A A
Effect2 A A P A A
Effect3 A A A P P
Note that theoretically we could have generated 32 test cases: Five causes in each of two states yield 25 possibilities. Thus, using a cause-and-effect graph substantially decreases the number of test cases we must consider.
In general, we can reduce the number of test cases even more by using our knowledge of the causes to eliminate certain other combinations. For example, if the number of test cases is high, we may assign a priority to each combination of causes. Then, we can eliminate the combinations of low priority Similarly we can eliminate those combinations that are unlikely to occur or for which testing is not economically justifiable.
In addition to reducing the number of test cases to consider, cause-and-effect graphs help us predict the possible outcomes of exercising the system. At the same time, the graphs find unintended side effects for certain combinations of causes. However, cause-and-effect graphs are not practical for systems that include time delays, iterations, or loops where the system reacts to feedback from some of its processes to perform other processes.
9.3 PERFORMANCE TESTINGonce we determine that the system performs the functions required by the requirements, we
turn to the way in which those functions are performed. Thus, functional testing addresses the functional requirements, and performance testing addresses the nonfunctional requirements.Purpose and Roles
System performance is measured against the performance objectives set by the customer as expressed in the nonfunctional requirements. For example, function testing may have demonstrated that a test system can calculate the trajectory of a rocket, based on rocket thrust, weather conditions, and related sensor and system information. Performance testing examines how well the calculation is done; the speed of response to user commands, accuracy of the result, and accessibility of the data are checked against the customer's performance prescriptions.
Performance testing is designed and administered by the test team, and the results are provided to the customer. Because performance testing usually involves hardware as well as software, hardware engineers may be part of the test team.Types of Performance Tests
Performance testing is based on the requirements, so the types of tests are determined by the kinds of nonfunctional requirements specified.
. Stress tests evaluate the system when stressed to its limits over a short period of time. lf the requirements state that a system is to handle up to a specified number of devices or users, a stress test evaluates system performance when all those devices or users are active simultaneously. This test is especially important for systems that usually operate below maximum capacity but are severely stressed at certain times of peak demand.. Volume tests address the handling of large amounts of data in the system. For example, we look at whether data structures (such as queues or stacks) have been defined to be large enough to handle all possible situations. In addition, we check fields, records, and files to see if their sizes can accommodate all expected data. We also make sure that the system reacts appropriately when data sets reach their maximum size.. Configuration tests analyze the various software and hardware configurations specified
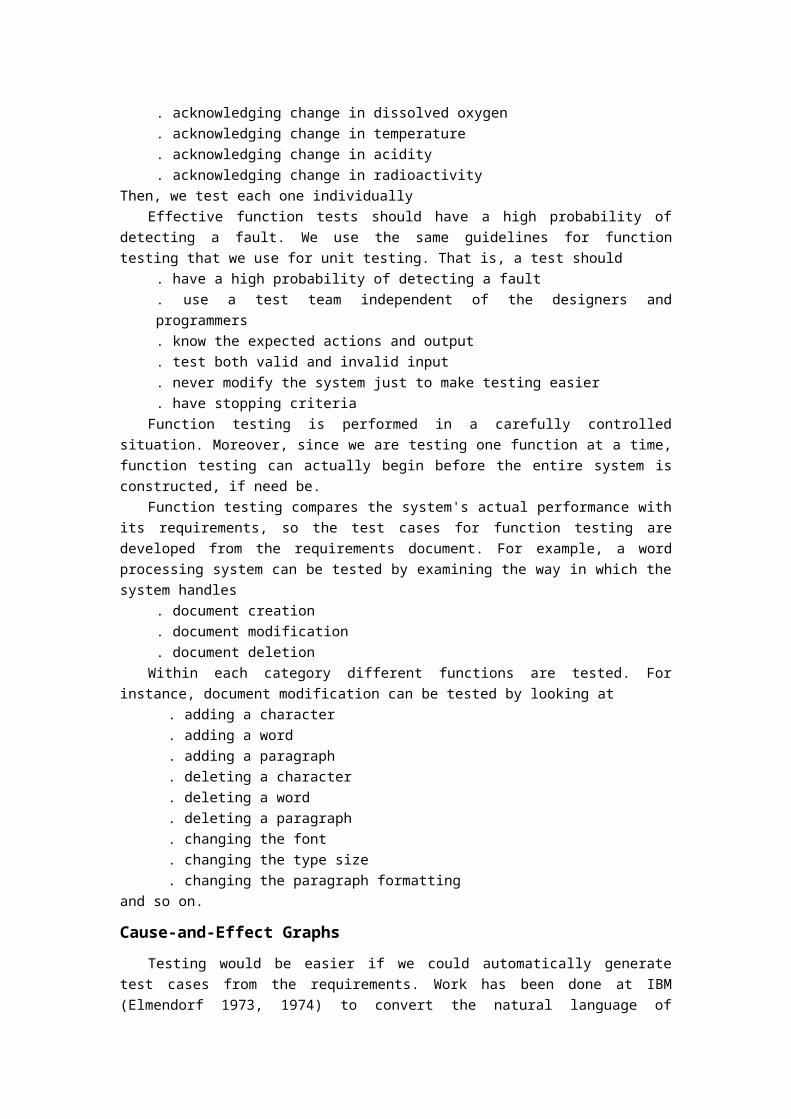
in the requirements. Sometimes a system is built to serve a variety of audiences, and the system is really a spectrum of configurations. For instance, we may define a minimal system to serve a single user, and other configurations build on the minimal configuration to serve additional users. A configuration test evaluates all possible configurations to make sure that each satisfies the requirements.. Compatibility tests are needed when a system interfaces with other systems. We find out whether the interface functions perform according to the requirements. For instance, if the system is to communicate with a large database system to retrieve information, a compatibility test examines the speed and accuracy of data retrieval.. Regression tests are required when the system being tested is replacing an existing system. The regression tests guarantee that the new system's performance is at least as good as that of the old. Regression tests are always used during a phased development.. Security tests ensure that the security requirements are met. We test system characteristics related to availability integrity, and confidentiality of data and services.. Timing tests evaluate the requirements dealing with time to respond to a user and time to perform a function. If a transaction must take place within a specified time, the test performs that transaction and verifies that the requirements are met. Timing tests are usually done in concert with stress tests to see if the timing requirements are met even when the system is extremely active.. Environmental tests look at the system's ability to perform at the installation site. If the requirements include tolerances for heat, humidity, motion, chemical presence, moisture, portability electrical or magnetic fields, disruption of power, or any other environmental characteristic of the site, then our tests guarantee the system's proper performance under these conditions.. Quality tests evaluate the system's reliability, maintainability and availability. These tests include calculation of mean time to failure and mean time to repair, as well as average time to find and fix a fault. Quality tests are sometimes difficult to administer. For example, if a requirement specifies a long mean time between failures, it may be in feasible to let the system run long enough to verify the required mean.. Recovery tests address response to the presence of faults or to the loss of data, power, devices, or services. We subject the system to a loss of system resources and see if it recovers properly. Maintenance tests address the need for diagnostic tools and procedures to help in finding the source of problems. We may be required to supply diagnostic programs, memory maps, traces of transactions, circuit diagrams, and other aids. We verify that the aids exist and that they function properly.. Documentation tests ensure that we have written the required documents. Thus, if user guides, maintenance guides, and technical documents are needed, we verify that these materials exist and that the information they contain is consistent, accurate, and easy to read. Moreover, sometimes requirements specify the format and audience of the documentation; we evaluate the documents for compliance.. Human factors tests investigate requirements dealing with the user interface to the system. We examine display screens, messages, report formats, and other aspects that may relate to ease of use. In addition, operator and user procedures are checked to see if they

conform to ease of use requirements. These tests are sometimes called usability tests.Many of these tests are much more difficult to administer than the function tests.
Requirements must be explicit and detailed, and requirements quality is often reflected in the ease of performance testing. Unless a requirement is clear and testable, in the sense defined in Chapter 4, it is hard for the test team to know when the requirement is satisfied. Indeed, it may even be difficult to know how to administer a test because success is not well-defined.
9.4 RELIABILITY AVAILABIUTY AND MAINTAINABILITYOne of the most critical issues in performance testing is assuring the system's reliability,
availability and maintainability. Because each of these system characteristics cannot always be measured directly before delivery, this assurance is especially difficult; we must use indirect measures to estimate the system's likely characteristics. For this reason, we take a closer look in this section at testing for reliable, available, and maintainable systems.Definitions
To understand what we mean by reliability availability and maintainability consider an automobile. We think of a car as being reliable if it functions properly most of the time. We realize that some functions may stop working and that parts that wear out will need to be fixed or replaced. However, we expect a reliable car to operate for long periods of time before requiring any maintenance. That is, the car is reliable if it has long periods of consistent, desirable behavior between maintenance periods.
Reliability involves behavior over a period of time, but availability describes something at a given point in time. A car is available if you can use it when you need it. The car may be 20 years old and has required maintenance only twice, so we can call the car highly reliable. But if it happens to be in the repair shop when you need it, it is still not available. Thus, something can be highly reliable, but not available at a particular point in time.
Suppose your car is both reliable and available, but it was manufactured by a company that is no longer in business. This situation means that when your car fails (which, admittedly is infrequently), the maintainer has great difficulty finding replacement parts. Thus, your car is in the repair shop for a very long time before it is fixed properly and returned to you. In this case, your car has low maintainability
The same concepts apply to software systems. We want our software to function consistently and correctly over long periods of time, to be available when we need it, and to be repaired quickly and easily if it does fail. We say formally that software reliability is the probability that a system will operate without failure under given conditions for a given time interval. We express reliability on a scale from 0 to 1: A system that is highly reliable will have a reliability measure close to 1, and an unreliable system will have a measure close to o, Reliability is measured over execution time, not real time (i.e., not clock time), so that it more accurately reflects system usage.
Similarly, software availability is the probability that a system is operating successfully according to specification at a given point in time. More formally, it is the probability that a system is functioning completely at a given instant in time, assuming that the required external resources are also available. A system that is completely up and running has availability 1; one that is unusable has availability 0. Availability is measured at points of clock time, not execution time.
Likewise, software maintainability is the probability that, for a given condition of use, a maintenance activity can be carried out within a stated time interval and using stated procedures

and resources. It, too, ranges from 0 to 1. It is very different from hardware maintenance; hardware usually requires the system to be unavailable as maintenance is being carried out, but software maintenance can sometimes be done while the system is still up and running.
Because reliability, availability, and maintainability are defined in terms of failures, they must be measured once the system is complete and working. Software engineers usually distinguish known failures from new ones; that is, in determining reliability we count only new failures, not the ones we know about but have not yet fixed.
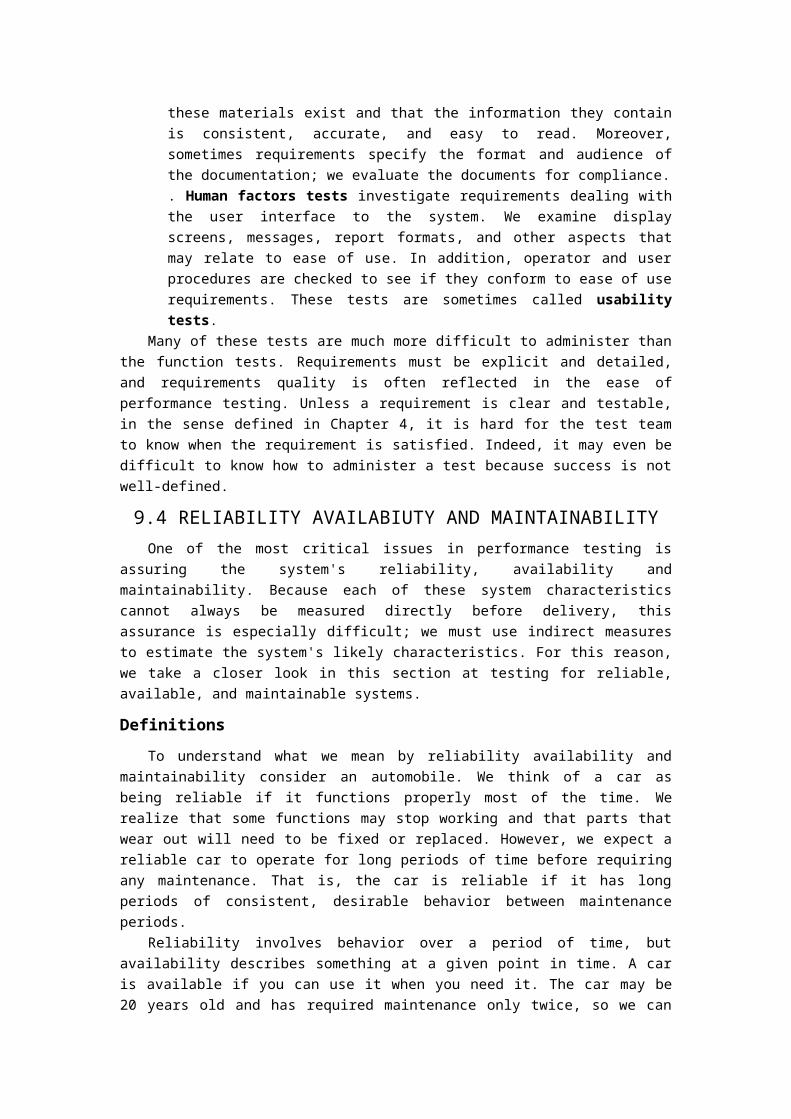
In addition, we often assign a severity level to each failure, to capture its impact on the system. For example, the U.S. Military Standard MIL-STD-1629A distinguishes among four different levels of failure severity:
1. Catastrophic: a failure that may cause death or systen1 loss.2. Critical: a failure that may cause severe injury or major system damage that results in mission loss.3. Marginal: a failure that may cause minor injury or minor system damage that results in delay, loss of availability, or mission degradation.4. Minor: a failure not serious enough to cause injury or system damage, but that results in unscheduled maintenance or repair.
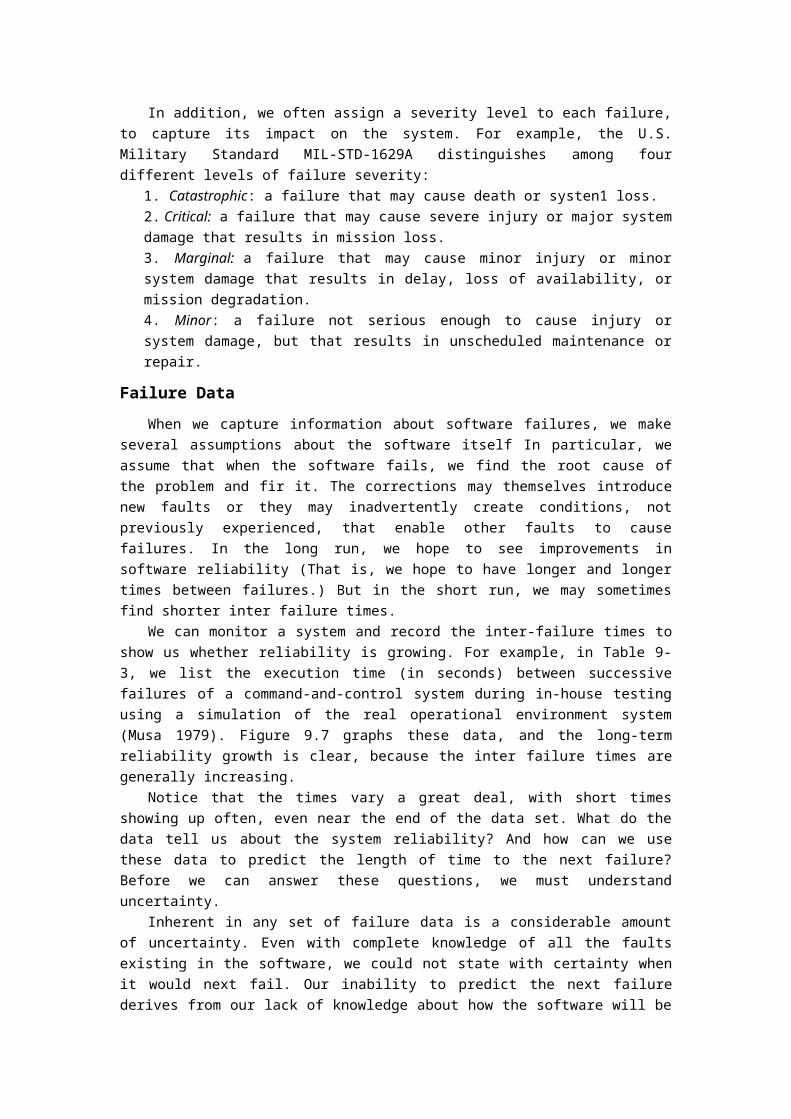
Failure DataWhen we capture information about software failures, we make several assumptions about
the software itself In particular, we assume that when the software fails, we find the root cause of the problem and fir it. The corrections may themselves introduce new faults or they may inadvertently create conditions, not previously experienced, that enable other faults to cause failures. In the long run, we hope to see improvements in software reliability (That is, we hope to have longer and longer times between failures.) But in the short run, we may sometimes find shorter inter failure times.
We can monitor a system and record the inter-failure times to show us whether reliability is growing. For example, in Table 9-3, we list the execution time (in seconds) between successive failures of a command-and-control system during in-house testing using a simulation of the real operational environment system (Musa 1979). Figure 9.7 graphs these data, and the long-term reliability growth is clear, because the inter failure times are generally increasing.
Notice that the times vary a great deal, with short times showing up often, even near the end of the data set. What do the data tell us about the system reliability? And how can we use these data to predict the length of time to the next failure? Before we can answer these questions, we must understand uncertainty.
Inherent in any set of failure data is a considerable amount of uncertainty. Even with complete knowledge of all the faults existing in the software, we could not state with certainty when it would next fail. Our inability to predict the next failure derives from our lack of knowledge about how the software will be used; we do not know the exact inputs or the order in which they will be supplied to the software, so we cannot predict which fault will trigger the next failure. We call this type-1 uncertainty, reflecting uncertainty about how the system will be used. Thus, at any point in time, the time to the next failure is uncertain; we can think of it as a random variable.
TABLE 9.3 Inter-failure Times (Read Left to Right, in Rows)

3 30 113 81 115 9 2 91 112 15
138 50 77 24 108 88 670 120 26 114
325 55 242 68 422 l80 10 1146 600 15
36 4 0 8 227 65 176 58 457 300
97 263 452 255 197 193 6 79 816 1351
148 21 233 134 357 193 236 31 369 748
0 232 330 365 1222 543 10 16 529 379
44 129 810 290 300 529 281 160 828 1011
445 296 1755 1064 1783 860 983 707 33 868
724 2323 2930 1461 843 12 26l 1800 865 1435
30 143 108 0 3110 1247943 700 875 245
729 1897 447 386 446 122 990 948 1082 22
75 482 5509 100 10 1071 371 790 6150 3321
1045 648 5485 1160 1864 4116
FIGURE 9.7 Graph of failure data from Table 9.3.A second fuzzy area, called type-2 uncertainty, reflects our lack of knowledge about the
effect of fault removal. When we fix a fault, we do not know if our corrections are complete and successful. And even if we have fixed the fault properly, we do not know how much improvement there is in the inter-failure times. That is, we are uncertain about the degree to which our correction increases the software's reliability.Measuring Reliability Availability' and Maintainability
We want to express reliability availability and maintainability as attributes of the software, measured as numbers between 0 (unreliable, unavailable, or unmaintainable) and 1 (completely reliable, always available, and completely maintainable). To derive these measures, we examine attributes of the failure data. Assume that we are capturing failure data and that we have seen i . 1 failures. We can record the inter failure times, or times to failure, as t1, t2,..., ti ca 1. The average of these values is the Mean Time to Failure (MTTF).
Suppose each underlying fault has been fixed and the system is again running. We can use r to denote the yet-to-be-observed next time to failure; L is a random variable. When we make statements about the reliability of the software, we are really making probability statements about r.

There are several other time-related data important to calculating availability and maintainability once a failure occurs, there is additional time lost as the faults causing the failure are located and repaired. The Mean Time to Repair (MTIR) tells us the average time it takes to fix a faulty software component. We can combine this measure with the mean time to failure to tell us how long the system is unavailable for use. That is, we measure availability by examining the Mean Time between Failures (MTBF), calculated as
MTBF = MTTF + MTTRSome practitioners and researchers propose measures for reliability, availability, and
maintainability, based on these means. For example, consider the relationship between system reliability and the mean time to failure. As the system becomes more reliable, its mean time to failure should increase. We want to use the MTTF in a measure whose value is near zero when Mm is small, and nears 1 as Mm gets larger and larger. Using this relationship, we can define a measure of a system's reliability as
R = MTTF/(1 + MTTF)so that it ranges between 0 and 1, as required. Similarly, we can measure availability so as to maximize MTBF:
A = MBF/(1 + MTBF)When something is maintainable, we want to minimize the MTTR. Thus, we can measure
maintainability asM = 1/(1 + MTTR)
Other researchers use surrogate measures to capture the notion of reliability such as fault density (i.e., faults per thousand lines of code or faults per function point), when they cannot measure failures directly Some researchers, such as Voas and Friedman (1995), argue that it is not the gross number of detected faults or failures that is important for software reliability, but the ability of a system as a whole to hide as-yet- undetected faults.Reliability Stability and Growth
We want our reliability measure to tell us whether the software is improving (i.e., failing less frequently) as we find and fir faults. If the inter-failure times stay the same, then we have reliability stability. If they increase, we have reliability growth. However, it is very difficult to predict when a system will fail. The prediction is a little easier for hardware than for software because, as noted in Sidebar 9.4, hardware reliability is distinctly different from software reliability Hardware failures are probabilistic; we may not know the exact time of failure, but we can say that a piece of hardware will probably fail during a given time period. For example, if we know that a tire wears out in an average of 1o years, then we understand that the tire does not go from a failure probability of 0 on day 3652 (one day short of 1o years) to a failure probability of 1 on day 3653. Instead, the probability of failure increases slowly from o, when we purchase the new tire, toward 1, as we approach 10 years of ownership. We can graph the probability's increaseover time, and the shape of the curve will depend on the materials from which the tire was made, the tire design, the type of driving we do, the weight of the car, and more. We use these parameters to model the likely failure.
We take a similar approach when modeling software failure, defining a probability density function f of time t, written f(t), that describes our understanding of when the software is likely to fail. For example, suppose we know that a software component will fail some time in the next 24 hours (because eventually a buffer will overflow), but that it is equally likely to fail in any 1-hour

time interval. There are 86,400 seconds in 24 hours, so we can measure time t in seconds and define the probability density function to be 1/86,400 for any t between 0 and 86,400, and 0 for any t greater than 86,400. We call this function uniform in the interval from t = 0 to 86,400 because the function takes the same value in that interval; it is depicted in Figure 9.8.
But not every density function is uniform, and one of the difficult problems in understanding and measuring reliability is capturing the failure behavior in an appropriate probability density function. That is, we can define a function f (t) and use it to calculate the likelihood that a software component will fail in a given time interval [t1, t2 ]. Since this probability is the area under the curve between the endpoints of the interval, the probability of failure between t1 and t2 is
∫ f(t)dt
FIGURE 9.8 Uniform density function.In particular, the distribution function, F(t), is the value of this integral over the interval
from 0 to t. F(t) is the probability that the software will fail before time t, and we define the reliability function, R(t), to be 1-Fi(t); it is the probability that the software will function properly up until time t.Reliability Prediction
We can use the historical information about failures and failure times to build simple predictive models of reliability. For example, using Musa's data from Table 9.3, we can predict the time of next failure by averaging the previous two failure times to predict the third. That is, we observe from the table that t1 = 1 and t2 = 30, so we predict that the time to failure, T3, will be the mean: 31/2 = 15.5. We can continue this computation for each observation, ti, so that we have:
. for i = 4, we have t2 = 30 and t3 = 113, so T4 is 71.5
. for i = 5, we have t3 = 113 and t4 = 81, so T5 is 97and so on. What results is the gray line labeled "av 2" in foure 9.9. We can extend this technique to include more of the historical data; the figure also shows what our predictions are like if we use the 1o previous failure times (av 10) and the 20 previous failure times (av 20).
However, researchers have suggested more sophisticated models of reliability that reflect our assumptions about software behavior as we find and fix faults. For instance, some models assume that the change in system behavior is the same by fixing one fault as by fixing another. But other models recognize that faults are different, and the effects of correction differ, too. For example, we may have different probability density functions for each correction, especially when We have reliability growth. As Fenton and Pfleeger (1997) point out, any system of prediction must include three elements:
. a prediction model that gives a complete probability specification of the stochastic process (such as the functions Fi(Ti) and an assumption of independence of successive times)

FIGURE 9.9 Predicting next failure times from past history
. an inference procedure for the unknown parameters of the model based on the values of t1, t2,... , ti -1
. a prediction procedure that combines the model and inference procedure to make predictions about future failure behaviorIn this section, we examine two popular reliability prediction models; for more models and
more detailed information, see Fenton and Pfleeger (1997).Good reliability models explicit address both types of uncertainty about reliability Type-1
uncertainty is handled by assuming that each fault is encountered randomly, so the time to the next failure is described using an exponential distribution. For example, Motorola uses an exponential distribution in its zero-failure testing approach (Sidebar 9.5). Thus, we can differentiate reliability models by the way they handle type-2 uncertainty
The Jelinski-Moranda Model. The Jelinski-Moranda model is the earliest and probably the best-known reliability model (Jelinski and Moranda 1972). It assumes that there is no type{2 uncertainty That is, the model assumes that corrections are perfect (they fix the fault causing the failure, while introducing no new faults). Jelinski-Moranda also assumes that fixing any fault contributes equally to improving the reliability
To see if the Jelinski-Moranda model portrays failure realistically suppose we are examining software that has 15 faults, where 0.003 represents the degree to which fixing each fault contributes to the increase in reliability Table 9.4 lists the mean time to the ith failure, plus a simulated set of failure times (produced using random numbers in the model). As i approaches 15 (the last remaining fault), the failure times become larger and larger. In other words, the second column tells us the mean time to ith failure based on past history, and the third column tells us the predicted time to the next (i.e., the ith) failure based on the Jelinski-Moranda model,
The widely used Musa model is based on Jelinski-Moranda, using execution time to capture inter-failure times. It also incorporates calendar time for estimating the time when target reliability is achieved (Musa, Iannino, and Okumoto 1990). Musa tied reliability to project management, encouraging managers to use reliability modeling in many environments, particularly telecommunications.
The Littlewood Model. The Littlewood modeI is more realistic than JelinskiMoranda, because it treats each corrected fault's contribution to reliability as an independent random variable. The contributions are assumed to have a gamma distribution. Littlewood uses two sources of uncertainty in his distribution, so we call his model doubly stochastic. The Littlewood model tends to encounter and remove faults with large contributions to reliability earlier than faults with a smaller contribution, representing the diminishing returns often experienced as
testing continues. The Jelinski-Moranda model uses an exponential distribution for the times at which faults are discovered, but Little-wood's model uses a Pareto distribution.
TABLE 9.4 Successive Failure Times for Jelinski-Moranda
i Mean Time to ith Failure Simulated Time to ith Failure
1 22 11
2 24 41
3 26 13
4 28 4
5 30 30
6 33 77
7 37 11
8 42 64
9 48 54
10 56 34
11 67 183
12 83 83
13 l11 17
14 167 l90
15 333 436
Importance of the Operational EnvironmentWe compare and contrast the accuracy of several reliability models in Chapter 13. Here, we
look at the common assumption that a model accurate in the past will be accurate in the future, assuming the conditions of use are the same. Usually, our predictions are based on failures occurring during testing. But our testing environment may not reflect actual or typical system use.
Realism is even more difficult to capture when users have different modes of system use, different experience levels, and different operating environments For example, a novice user of a spreadsheet or accounting package is not likely to use the same shortcuts and sophisticated techniques as an experienced user; the failure profiles for each are likely to be quite different.
Musa addressed this problem by anticipating typical user interaction with the system, captured in an operational profile that describes likely user input over time. Ideally the operational profile is a probability distribution of inputs. When the testing strategy is based on the operational profile, the test data reflect the probability distribution.
An operational profile is often created by dividing the input space into a number of distinct classes and assigning to each class a probability that an input from that class will be selected. For example, suppose a program allows you to run one of three different menu options: create, delete, and modify. We determine from tests with users that option create is selected twice as often as delete or modify (which are selected equally often). We can assign a probability of o.5 to create, 0.25 to delete, and 0.25 to modify. Then, our testing strategy selects inputs randomly so that the probability of an input's being create is 0.5, delete is 0.25, and modify is 0.25.
This strategy of statistical testing has at least two benefits:1. Testing concentrates on the parts of the system most likely to be used and hence should result in a system that the user finds more reliable.2. Reliability predictions based on the test results should give us an accurate prediction of reliability as seen by the user.

However, it is not easy to do statistical testing properly There is no simple or repeatable way of defining operational profiles. We see later in this chapter how clean-room software development integrates statistical testing into its approach to building quality software.
9.5 ACCEPTANCE TESTINGWhen function and performance testing are complete, we are convinced that the system
meets all requirements specified during the initial stages of software development. The next step is to ask the customers and users if they concur.Purpose and Roles
Until now we as developers have designed the test cases and administered all tests. Now the customer leads testing and defines the cases to be tested. The purpose of acceptance testing is to enable the customers and users to determine if the system we built really meets their needs and expectations. Thus, acceptance tests are written, conducted, and evaluated by the customers, with assistance from the developers only when the customer requests an answer to a technical question. Usually those customer employees who were involved in requirements definition play a large part in acceptance testing, because they understand what kind of system the customer intended to have built.Types of Acceptance Tests
There are three ways the customer can evaluate the system. In a benchmark test, the customer prepares a set of test cases that represent typical conditions under which the system will operate when actually installed. The customer evaluates the system's performance for each test case. Benchmark tests are performed with actual users or a special team exercising system functions. In either case, the testers are familiar with the requirements and able to evaluate the actual performance.
Benchmark tests are commonly used when a customer has special requirements. Two or more development teams are asked to produce systems according to specification; one system will be chosen for purchase, based on the success of benchmark tests. For example, a customer may ask two communications companies to install a voice and data network. Each system is benchmarked. Both systems may meet a requirement, but one may be faster or easier to use than the other. The customer decides which one to purchase based on how the systems meet the benchmark criteria.
A pilot test installs the system on an experimental basis' users exercise the system as if it had been installed permanently whereas benchmark tests include a set of special test cases that the users apply pilot tests rely on the everyday working of the system to test all functions. The customer often prepares a suggested list of functions that each user tries to incorporate in typical daily procedures. However, a pilot test is much less formal and structured than a benchmark test,
Sometimes, we test a system with users from within our own organization or company before releasing the system to the customer; we "pilot" the system before the customer runs the real pilot test. Our in-house test is called an alpha test, and the customer's pilot is a beta test. This approach is common when systems are to be released to a wide variety of customers. For example, a new version of an operating system may be alpha tested at our own offices and then beta-tested using a specially selected group of customer sites. We try to choose as beta test sites customers who represent all kinds of system usage. (Sidebar 9.6 warns of the dangers of using a beta version as the "real" system.) Even if a system is being developed for just one customer, a pilot test usually involves only a small subset of the customer's potential users. We choose the users so their activities represent those of most others who will use the system later. One location or
organization may be chosen to test the system, rather than allowing all intended users to have access.
If a new system is replacing an existing one or is part of a phased development, a third kind of testing can be used for acceptance. In parallel testing, the new system operates in parallel with the previous version. The users gradually become accustomed to the new system but continue to use the old one to duplicate the new This gradual transition allows users to compare and contrast the new system with the old It also allows skeptical users to build their confidence in the new system by comparing the results obtained with both and verifying that the new system is just as effective and efficient as the old. In a sense, parallel testing incorporates a user-administered combination of compatibility and function testing.Results of Acceptance Tests
The type of system being tested and the customer's preferences determine the choice of acceptance test. In fact, a combination of some or all of the approaches can be used. Tests by users sometimes find places where the customer's expectations as stated in the requirements do not match what we have implemented. In other words, acceptance testing is the customer's chance to verify that what was wanted is what was built. If the customer is satisfied, the system is then accepted as stated in the contract.
In reality, acceptance testing uncovers more than requirements discrepancies. The acceptance test also allows customers to determine what they really want, whether specified in the requirements documents or not. Remember that the requirements analysis stage of development gives customers an opportunity to explain to us what problem needs a solution, and the system design is our proposed solution. Until customers and users actually work with a system as a proposed solution, they may not really know whether the problem is indeed solved. In fact, working with our system may help customers to discover aspects of the problem (or even new problems) of which they were not aware.
We have seen in previous chapters that rapid prototyping may be used to help the customer understand more about the solution before the, entire system is implemented. However, prototypes are often impractical or too expensive to build. Moreover, when building large systems, there is sometimes a long lag between the initial specification and the first viewing of even part of a system. During this time, the customer's needs may change in some way For instance, federal regulations, key personnel, or even the nature of the customer's business may change, affecting the nature of the original problem. Thus, changes in requirements may be needed not only because they were specified improperly at the beginning of development, but also because the customers may decide that the problem has changed and a different solution is needed.
After acceptance testing, the customer tells us which requirements are not satisfied and which must be deleted, revised, or added because of changing needs. Configuration management stall identify these changes and record the consequent modifications to design, implementation, and testing.
9.6 INSTALLATION TESTINGThe final round of testing involves installing the system at user sites. If acceptance testing has
been performed on-site, installation testing may not be needed. However, if acceptance testing conditions were not the same as actual site conditions, additional testing is necessary. To begin installation testing, we configure the system to the user environment. We attach the proper number and kind of devices to the main processor and establish communications with other systems. We
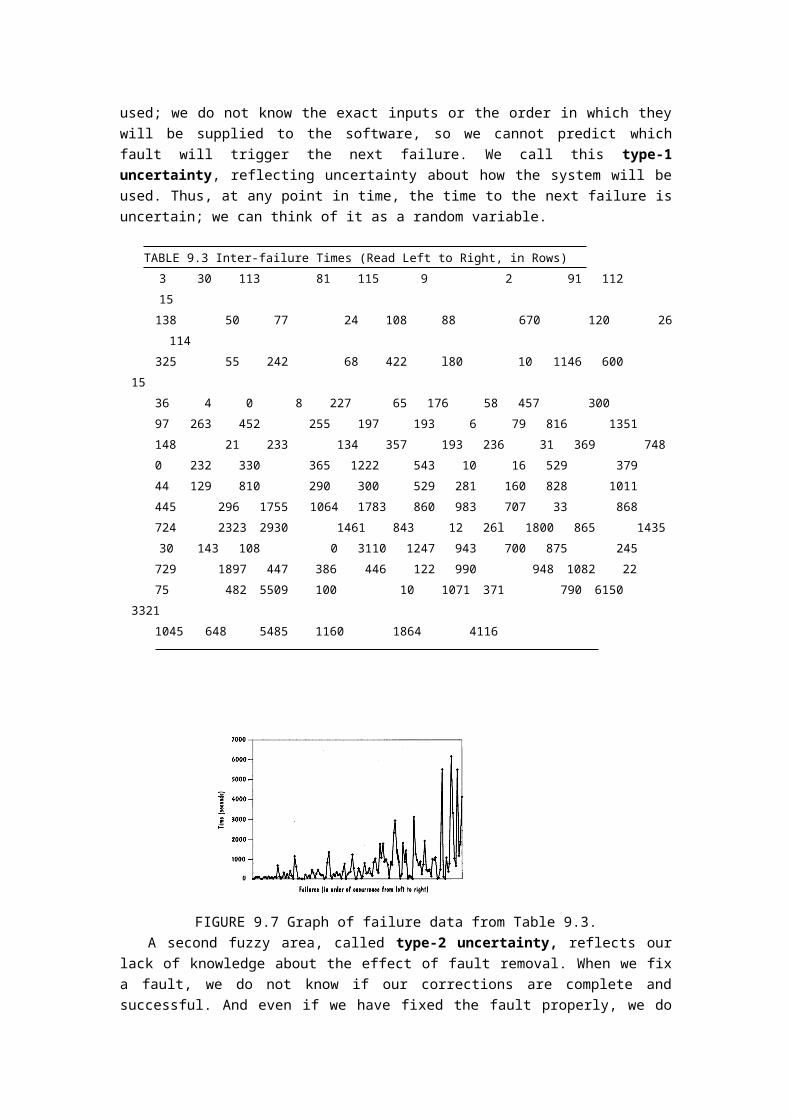
allocate files and assign access to appropriate functions and data.Installation tests require us to work with the customer to determine what tests are needed on-
site. Regression tests may be administered to verify that the system has been installed properly and works "in the field" as it did when tested previously The test cases assure the customer that the system is complete and that all necessary files and devices are present. The tests focus on two things: completeness of the installed system and verification of any functional or nonfunctional characteristics that may be affected by site conditions. For example, a system designed to work aboard a ship must be tested to demonstrate that it is not affected by the severe weather or the ship's motion.
When the customer is satisfied with the results, testing is complete and the system is formally delivered.
9.7 AUTOMATED SYSTEM TESTINGMany of the test tools described in Chapter 8 are also helpful in system testing. Others are
designed specifically to test large groups of components or to assist in testing hardware and software at the same time.
Simulation allows us to concentrate on evaluating one part of a system while portraying the characteristics of other parts. A simulator presents to a system all characteristics of a device or system without actually having the device or system available. Just as a flight simulator allows you to learn to fly without an actual airplane, a device simulator allows you to control a device even when the device is not present. This situation occurs often, especially when the software is being developed off site or when the device is being developed in parallel with the software.
For example, suppose a vendor is building a new communication system, consisting of both hardware and software, at the same time that software engineers are developing the driver for it. It is impossible to test the not-yet-completed vendor's device, so the device's specifications are used to build a simulator that allows us to test the expected interactions.
Similarly, a simulator is particularly useful if a special device is located on the customer's or user's site but testing is being done at another location. For instance, if you are building an automobile navigation system, you may not need the actual automobile to test the software; you can have your system interact with an automobile simulator instead. In fact, sometimes a device simulator is more helpful than the device itself, since the simulator can store data indicating the device's state during the various stages of a test. Then the simulator reports on its state when a failure occurs, possibly helping you to find the fault that caused it.
Simulators are also used to look like other systems with which the test system must interface- If messages are communicated or a database is accessed, a simulator provides the necessary information for testing without duplicating the entire other system. The simulator also helps with stress and volume testing, since it can be programmed to load the system with substantial amounts of data, requests, or users.
In general, simulators give you control over the test conditions. This control allows you to perform tests that might otherwise be dangerous or impossible. For example, the test of a missile guidance system can be made much simpler and safer using simulators.
Automation can also help in designing test cases. For example, Cohen et al. (1996) describe an Automatic Efficient Test Generator (AETG), developed at Bellcore, that uses combinatorial design techniques to generate test cases. In their combinatorial design approach, they generate tests that cover all pair-wise, triple, or n-way combinations of test parameters. For instance, to

cover all pair-wise combinations, if x1 is a valid value for a one parameter and x2 valid for another, then there is a test case in which the first parameter is x1 and the second is x2. In one experiment, the test requirements for final release had 75 parameters, with 1029 possible test combinations. Using the AETG the researchers generated only 28 tests to cover all pair-wise parameter combinations. In another experiment, their technique generated tests that yielded better block and decision coverage than random testing. And a third study showed that the automated system revealed significant requirements and code faults that were not found using other testing means. Sidebar 9.7 describes another example of how test automation accelerated the test process.
9.8 TEST DOCUMENTATIONTesting can be complex and difficult. The system's software and hardware can contribute to
the difficulty, as can the procedures involved in using the system. In addition, a distributed or real-time system requires great care in tracing and timing data and processes to draw conclusions about performance. Finally when systems are large, the large number of people involved in development and testing can make coordination difficult. To control the complexity and difficulty of testing, we use complete and carefully designed test documentation.
Several types of documentation are needed. A test plan describes the system itself and the plan for exercising all functions and characteristics. A test specification and evaluation details each test and defines the criteria for evaluating each feature addressed by the test. Then, a test description presents the test data and procedures for individual tests. Finally the test analysis report describes the results of each test. Figure 9.10 shows the relationship of the documents to the testing process.Test Plans
In Chapter 8, we discussed the role of the test plan in laying out the patterns of testing for all testing activities. Now we look at how a test plan can be used to direct system testing.
Figure 9.11 illustrates a test plan's components. The plan begins by stating its objectives, which should
. guide the management of testing
. guide the technical effort required during testing
. establish test planning and scheduling, including specifying equipment needed, organizational requirements, test methods, anticipated outcomes, and user orientation. explain the nature and extent of each test. explain how the tests will completely evaluate system function and performance. document test input, specific test procedures, and expected outcomesNext, the test plan references other major documents produced during development. In
particular, the plan explains the relationships among the requirements documents, design documents, code components 'and documents, and test procedures. For example, there may be a naming or numbering scheme that ties together all documents, so that requirement 4.9 is reflected in design components 5.3, 5.6, and 5.8, and tested by procedure 12.3.
Following these preliminary sections is a system summary since a reader of the test plan may not have been involved with the previous stages of development, the system summary puts the testing schedule and events in context. The summary need not be detailed; it can be a drawing depicting the major system inputs and outputs with a description of major transformations.
Once testing is placed in a system context, the plan describes the major tests and test approaches to be used. For example, the test plan distinguishes among function tests, performance
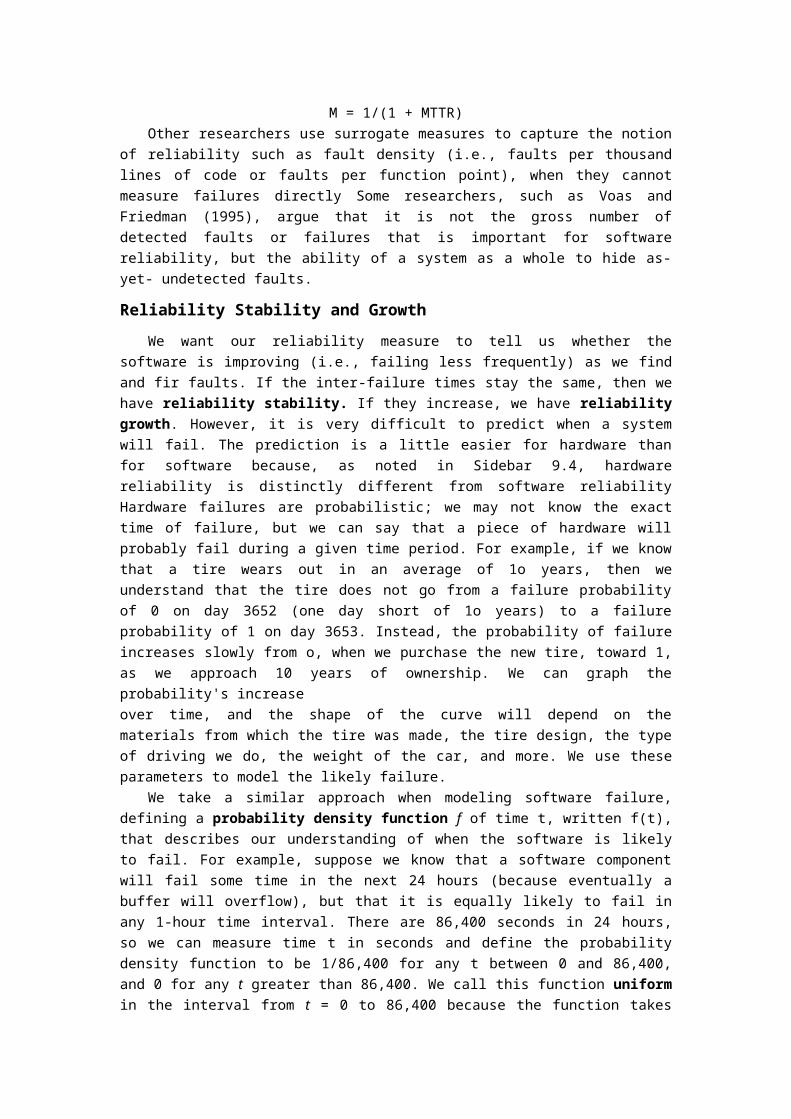
tests, acceptance tests, and installation tests. If the function tests can be further divided by some criterion (such as subsystem tests), the test plan lays out the overall organization of the testing.
After explaining the component tests, the plan addresses the schedule of events. The schedule includes the test location as well as time frame. Often depicted as a milestone chart or activity graph, the test schedule includes
1. the overall testing period2. the major subdivisions of testing, and their start and stop times3. any pretest requirements (such as orientation or familiarization with the system,user training, or generation of test data) and the time necessary for each4. the time necessary for preparing and reviewing the test report
If testing is to take place at several locations, the test plan includes a schedule for each. A chart illustrates the hardware, software, and personnel necessary for administering the tests at each location, and the duration for which each resource will be needed. Noted, too, are special training or maintenance needs.
The plan identifies test materials in terms of deliverables (such as user or operator manuals, sample listings, or tapes) and materials supplied by the site (such as special test apparatus, database tables, or storage media). For example, if a test is to use a database management system to build a sample database, the test may require the users at the site to define data elements before the arrival of the test team. Similarly, if the test team requires any security or privacy precautions, the personnel at the test location may be required to establish passwords or special access for them before the test can begin.Test Specification and Evaluation
The test plan describes an overall breakdown of testing into individual tests that address specific items. For example, if the system being tested has its processing distributed over several computers, the function and performance tests can be further divided into tests for each subsystem.
For each such individual test, we write a test specification and evaluation. The specification begins by listing the requirements whose satisfaction will be demonstrated by the test. Referring to the requirements documents this section explains the test's purpose. One way to view the correspondence between requirements and tests is to use a table or chart, such as Table 9.5. Note that the requirements listed across the top reference the number in a requirements document; the function on the left is mandated by the requirement in whose column the X is placed.
TABLE 9.5 Test-requirement Correspondence Chart
Requirement 2.4: Requirement 2.4.2: Requirement 2.4.3:
Generate and Selectively Retrieve Produce Specialized
Test Maintain Database Data Reports
1. Add new record X
2. Add field X
3. Change field X
4. Delete record X
5. Delete field X
6. Create index X
Retrieve record with
a requested
7. Cell number X

8. Water height X
9. Canopy height X
1o. Ground cover X
1l. Percolation rate X
12. Print full X
database
l3. Print directory X
14. Print keywords X
l5. Print simulation X
summary
The system functions involved in the test are enumerated in the table. The performanc e tests can be described in a similar way Instead of listing functional requirements, the chart lists requirements related to speed of access, database security and so on.
Often, an individual test is really a collection of smaller tests, the sum of which illustrates requirements satisfaction. In this case, the test specification shows the relationship between the smaller tests and the requirements.
Each test is guided by a test philosophy and adopts a set of methods. However, the philosophy and methods may be constrained by other requirements and by the realities of the test situation. The specification makes these test conditions clear. Among the conditions may be some of the following:
. Is the system using actual input from users or devices, or are special cases generated by a program or surrogate device?. What are the test coverage criteria?. How will data be recorded?. Are there timing, interface, equipment, personnel, database, or other limitations on testing?. If the test is a series of smaller tests, in what order are the tests to be performed?If test data are to be processed before being evaluated, the test specification discusses the
processing. For instance, when a system produces large amounts of data, data-reduction techniques are sometimes used on the output so that the result is more suitable for evaluation.
Accompanying each test is a way to tell when the test is complete. Thus, the specification is followed by a discussion of how we know when the test is over and the relevant requirements have been satisfied. For example, the plan explains what range of output results will meet the requirement.
The evaluation method follows the completion criteria. For example, data produced during testing may be collected and collated manually and then inspected by the test team. Alternately, the team could use an automated tool to evaluate some of the data and then inspect summary reports or do an item-by-item comparison with expected output. The efficiency and effectiveness measures described in Sidebar 9.8 can be used to assess the thoroughness of the tests.Test Description
A test description is written for every test defined in the test specification. We use the test description document as a guide in performing the test. These documents must be detailed and clear, including
. the means of control

. the data
. the proceduresA general description of the test begins the document. Then, we indicate whether the test will
be initiated and controlled by automatic or manual means. For instance, data may be input manually from the keyboard, but then an automated driver may exercise the functions being tested. Alternatively the entire process could be automated.
The test data can be viewed in several parts: input data, input commands, input states, output data, output states, and messages produced by the system. Each is described in detail. For instance, input commands are provided so the team knows how to initiate the test, halt or suspend it, repeat or resume an unsuccessful or incomplete one, or terminate the test. Similarly the team must interpret messages to understand the sys. tem status and control testing. We explain how the team can distinguish among failures resulting from input data, from improper test procedures, or from hardware malfunction (wherever possible).
For example, the test data for a test of a SORT routine may be the following:INPUT DATA:
Input data are to be provided by the LIST program. The program
generates randomly a list of N words of alphanumeric characters;
each word is of length M. The program is invoked by calling
RUN LIST (N,M)
in your test driver. The output is placed in global data area
LISTBUF. The test datasets to be used for this test are as
follows:
Case l: Use LIST with N=5, M=5
Case 2: Use LIST with N=l0, M=5
Case 3: Use LIST with N=l5, M=5
Case 4: Use LIST with N=50, M=l0
Case 5: Use LIST with N=l00, M=l0
Case 6: Use LIST with N=l50, M=l0
INPUT COMMANDS:
The SORT routine is invoked by using the command
RUN SORT (INBUF, OUTBUF) or
RUN SORT (INBUF)
OUTPUT DATA:
If two parameters are used, the sorted list is placed in OUTBUF.
otherwise, it is placed in INBUF.
SYSTEM MESSAGES:
During the sorting process, the following message is displayed:
“Sorting.. .please wait... ”
Upon completion, SORT displays the following message on the
screen:
"Sorting completed"
To halt or terminate the test before the completion message is
displayed, press CONTROL-C on the keyboard.
A test procedure is often called a test script because it gives us a step-by-step description of

how to perform the test. A rigidly defined set of steps gives us control over the test, so we can duplicate conditions and re-create the failure if necessary when trying to find the cause of the problem. If the test is interrupted for some reason, we must be able to continue the test without having to return to the beginning.
For example, part of the test script for testing the "change field" function (listed in Table 9.5) might look like this:
Step N: Press function key 4: Access data file.
Step N+1: Screen will ask for the name of the date file.
Type 'sys: test. txt'
Step N+2: Menu will appear, reading
* delete file
* modify file
* rename file
Place cursor next to 'modify file' and press
RETUAN key.
Step N+3: Screen will ask for record number. Type '4017 ’.
Step N+4: Screen will fill with data fields for record 40l7:
Record number: 4017 X: 0042 Y: 0036
Soil type: clay Percolation: 4 mtrs/hr
Vegetation: kudzu Canopy height: 25 mtrs
Water table: 12 mtrs Construct: outhouse
Maintenance code: 3T/4F/ 9R
Step N+5: Press function key 9: modify
Step N+6: Entries on screen will be highlighted. Move cursor
to VEGETATION field. Type ‘grass’ over ‘kudzu’ and
press RETURN key.
Step N+7: Entries on screen will no longer be highlighted.
VEGETATION field should now read' grass'.
Step N+8: Press function key l6: Return to previous screen .
Step N+9: Menu will appear, leading
* delete file
* modify file
* rename file
To verify that the modification has been recorded,
place cursor next to 'modify file' and press RETURN
key.
Step N+10: Screen will ask for record number. Type ‘4017’.
Step N+11: Screen will fill with data fields for record 4017:
Record number: 4017 X: 0042 Y: 0036
Soil type: clay Percolation: 4 mtrs/hr
Vegetation: grass Canopy height: 25 mtrs
Water table: l2 rntrs Construct: outhouse
Maintenance code: 3T/4F/9R

The test script steps are numbered, and data associated with each step are referenced. If we have not described them elsewhere, we explain how to prepare the data or the site for the test. For example, the equipment settings needed, the database definitions and the communication connections may be detailed. Next, the script explains exactly what is to happen during the test. We report the keys pressed, the screens displayed, the output produced, the equipment reactions, and any other manifestation. We explain the expected outcome or output, and we give instructions to the operator or user about what to do if the expected outcome is different from the actual outcome.
Finally, the test description explains the sequence of activities required to end the test. These activities may involve reading or printing critical data, terminating automated procedures, or turning off pieces of equipment.Test Analysis Report
When a test has been administered, we analyze the results to determine if the function or performance tested meets the requirements. Sometimes, the mere demonstration of a function is enough. Most of the time, though, there are performance constraints on the function. For instance, it is not enough to know that a column can be sorted or summed. We must measure the calculation's speed and note its correctness. Thus, a test analysis report is necessary for several reasons:
. It documents the results of a test.
. If a failure occurs, the report provides information needed to duplicate the failure (if necessary) and to locate and fix the source of the problem.. It provides information necessary to determine if the development project is complete.. It establishes confidence in the system's performance.
The test analysis report may be read by people who were not part of the test process but who are familiar with other aspects of the system and its development. Thus, the report includes a brief summary of the project, its objectives, and relevant references for this test. For example, the test report mentions those parts of the requirements, design and implementation documents that describe the functions exercised in this test. The report also indicates those parts of the test plan and specification documents that deal with this test.
Once the stage is set in this way the test analysis report lists the functions and performance characteristics that were to be demonstrated and describes the actual results. The results include function, performance, and data measures, noting whether the target requirements have been met. If a fault or deficiency has been discovered, the report discusses its impact. Sometimes, we evaluate the test results in terms of a measure of severity This measure helps the test team decide whether to continue testing or wait until the fault has been corrected. For example, if the failure is a spurious character in the upper part of a display screen, then testing can continue while we locate the cause and correct it. However, if a fault causes the system to crash or a data file to be deleted, the test team may decide to interrupt testing until the fault is repaired.Problem Report Forms
Recall from Chapter 1 that a fault is a problem in a system artifact that can cause a system failure; the fault is seen by the developer, and the failure is experienced by the user. During testing, we capture data about faults and failures in problem report form. A discrepancy report form is a problem report that describes occurrences of problems where anal system behaviors or attributes do not match with what we expect. It explains What was expected, what actually

happened, and the circumstances leading to the failure. A fault report form explains how a fault was found and fired, often in response to the filing of a discrepancy report form.
Every problem report form should answer several questions about the problem it is describing:
. Location: Where did the problem occur?
. Timing: When did it occur?
. Symptom: What was observed?
. End result: What were the consequences?
. Mechanism: How did it occur?
. Cause: Why did it occur?
. Severity: How much was the user or business affected?
. Cost: How much did it cost?Figure 9.12 is an example of an actual fault report form from a British utility Notice that a
fault number is assigned to each fault, and the developers record the date When they were notified that a problem had occurred as well as the date when the problem's cause was located and fixed. Because developers do not address each problem right away (for example, because other Problems have higher priority), the developers also record the actual number of hours needed to repair this particular fault.
However, the fault report form is missing a great deal of data. In general, a fault report form should address our list of questions with this kind of detailed information (Fenton and Pfleeger 1997):
. Location: within-system identifier, such as module or document name
. Timing: phases of development during which fault was created, detected, and corrected
. Symptom: type of error message reported or activity that revealed fault (such as testing, review or inspection). End result: failure caused by the fault. Mechanism: how the source was created, detected, and corrected . Cause: type of human error that led to the fault. Severity: refers to severity of resulting or potential failure. Cost: time or effort to locate and correct; can include analysis of cost had fault been identified earlier in the development
Notice that each of these aspects of a fault reflects the developer's understanding of the fault's impact on the system. On the other hand, a discrepancy report should reflect a user's view of the failure caused by a fault. The questions are the same, but the answers are very different:
. Location: installation where the failure was observed
. Timing: CPU time, clock time, or other relevant measure of time
. Symptom: type of error message or indication of failure
. End result: description of failure, such as "operating system crash," "service degraded," "loss of data," "Wrong output," and "no output". Mechanism: chain of events, including keyboard commands and state data leading to failure'. Cause: reference to possible faults leading to failure
FIGURE 9.12 Fault report form.
. Severity: impact on user or business
. Cost: cost to fir plus cost of lost potential businessFigure 9.13 is an actual discrepancy report form, mistakenly called a "fault" report. It
addresses many of the questions in our list and does a good job of describing the failure. However, it contains a list only of the items changed, not a description of the underlying cause of the failure. Ideally this form should reference one or more fault reports, so that we can tell which faults caused which failures.
We need more complete information in our problem report forms so we can eva luate the effectiveness and efficiency of our testing and development practices. Especially when we have limited resources, historical information captured in problem reports helps us to understand which activities are likely to cause faults, and which practices are good at finding and fixing them.
9.9 TESTING SAFETYCRITICAL SYSTEMSIn Chapter 1, we looked at several examples of systems whose failure can harm or kill people
Such systems are called safety-critical, since the consequences of their failure are so severe. Anthes (1997) reported many other instances where software failures led to unacceptable levels of harm. For example, from 1986 to 1996, 450 reports were filed with the US. Food and Drug Administration, describing software faults in medical devices. And 24 of these reports involved software that led to death or injury. Among the problems reported were these:
FIGURE 9. 13 Discrepancy report from air traffic control system development (Pfleeger and Hatton 1997).
. An intravenous medication pump ran dry and injected air into a patient.
. A monitor failed to sound an alarm when a patient's heart stopped beating.
. A respirator delivered "unscheduled breaths" to a patient.
. A digital display combined the name of one patient with medical data from an-other patient.
The problems are not necessarily indicative of declining software quality Rather, they reflect the increasing amount of software being placed in safety-critical systems.
Unfortunately we do not always understand how the software development process affects the characteristics of the products we build, so it is difficult for us to ensure that safety-critical

systems are safe enough. In particular, we do not know how much each practice or technique contributes to a product's reliability At the same time, our customers require us to reach ever-higher levels of ultrahigh reliability
For instance, the Airbus 32o is a fly-by-wire aircraft, meaning that software controls most of its vital functions. Because the airplane cannot tolerate failure of its fly-by-wire software, its system reliability requirement is a failure rate of 10-9 per hour (Rouquet and Traverse 1986). The software requirement must be even more restrictive.
The prescribed failure rate means that the system can tolerate at most one failure in 109 hours. In other words the system can fall at most once in over 100,000 years of operation. We say that a system has ultrahigh reliability when it has at most one failure in 109 hours. It is clear that we cannot apply our usual reliability assessment techniques in cases like this; to do so would mean running the system for 100,000 years (at least) and tracking the failure behavior. Thus, we must seek other practices to help assure the software's reliability
Figure 9.14 shows us another way to look at the ultrahigh reliability problem. We have graphed failure data from q system in operational use; software and hardware design changes were implemented to fix the causes of the failures. In the graph, the Littlewood-Verrall model was used to compute the current Rate of Occurrence of Failures (ROCOF) at various times as testing proceeds. The dashed line, fitted manually shows an apparently clear law of diminishing returns: Because the slope of the line flattens out, failures occur less and less frequently That is, we must test for longer periods of time to make the system fail again, so reliability is increasing.
FIGURE 9. 14 Estimates of rate of occurrence of failure derived from a Musa data set (Fenton andPfleeger 1997).
However, it is not at all clear what the ultimate reliability will be. We cannot tell if the curve is asymptotic to zero or whether we reach a nonzero reliability because we are introducing new faults as we fix old ones. Even if we felt confident that the system could reach ultrahigh levels of reliability, we would still need to test for extraordinarily long periods of time to demonstrate our confidence.
In fact, even when we test a program for a long time without a failure, we still do not have the level of assurance we need. Littlewood has shown that if a program has worked failure-free for
x hours, there is about a 50:50 chance that it will survive the next x hours before failing. To have the kind of confidence apparently needed for an aircraft such as the A32o would require a failure-free performance of the software for several billion hours (Littlewood 1991). Thus, even if the system had actually achieved its target reliability, we could not assure ourselves of it in an acceptable period of time.
Assuring very high levels of reliability is a difficult but critical challenge that must be met if we hope to continue to use software in safety-critical systems. Many software engineers suggest that we use formal verification techniques with our requirements, designs, and code. But formal evaluation of natural language is impossible, and important information may be lost if we translate natural language to mathematical symbols. Even formal proofs of specification and design are not foolproof, because mistakes are sometimes made in the proofs. For this reason, companies such as Baltimore Gas and Electric (Sidebar 9.9) rely on a combination of quality assurance techniques to try to catch or prevent as many faults as possible. Sidebar 9.1o lists additional industrial approaches to increasing safety At the same time, researchers have been looking for other methods to help developers understand and assure reliability. We look at three of these techniques: design diversity, software safety cases, and cleanroom.Design Diversity
Design diversity, introduced in Chapter 5, is based on a simple philosophy. The same system is built according to the same requirements specification but in several independent ways, each according to a different design. Each system runs in parallel with the others, and a voting scheme coordinates actions when one system's results differ from the others. The underlying assumption is that it is unlikely that at least three of the five groups of developers will write incorrect software for a given requirement, so high reliability is likely (Avizienis and Kelly 1984). Several systems have been built using this technique, including the software for the U.S. space shuttle and the Airbus A320 (Rouquet and Traverse 1986). However, there is empirical evidence suggesting that independently developed software versions will not fail independently; the diverse designs do not always offer reliability higher than that of a single version.
For example, Knight and Leveson (1986) performed an experiment in which 27 versions of a software system were developed independently. They examined the faults discovered in each system and found a high incidence of common ones Knight and Leveson speculate that, because we train our software developers to use common techniques and common approaches to design, we can expect different designers and developers to make the same kinds of mistakes. Eckhardt and Lee (1985) discuss a theoretical scenario, based on the notion of varying the difficulty of different inputs, that supports these empirical findings.
Milier (1986) points out that, even if we build redundant systems that fail independently we must still try to estimate the dependence between any two versions. He show that this demonstration is as difficult as the problem of testing the resulting system as a black box, and claims this to be an essentially impossible task.Software Safety Cases
Testing is necessarily connected to software's design and implementation. We can examine the design to help us define test cases, as well as to determine when we have considered all possible scenarios. Fenelon et al. (1994) suggest that we look at the quality of safety-critical systems by listing the system's goals, investigating how the design meets those goals and ensuring that the implementation matches the design. Overall, we want the system to be safe, that is, free
from accident or loss. We can decompose the safety goals and assign failure rates or constraints to each component of the design, so that satisfying each lower-level goal will "roll up" to allow us to meet safety goals for the entire system. Ill this way, we make a safety case for the system, making explicit the ways in which our software meets performance goals for safety-critical systems.
We can analyze a system from four different perspectives: knowing the cause or not, and knowing the effects or not. In each instance, we want to establish links between situations that lead to normal behavior and those that lead to potential failure. Table 9.6 illustrates steps we can take in each case. Used during design, these analyses help us plan ways to avoid failure; used during testing, they help us identify important test cases
We saw in Chapter 5 how fault-t fee analysis allows us to examine possible effects and trace them back to their likely root causes. Failure Modes and Effects Analysis (KMEA) complements fault-tree analysis by working from known failure modes to unknown system effects. We say that a hazard is a system state that, together with the right conditions, will lead to an accident. A the mode is a situation that can give rise to a hazard. For example, the overflow in the Ariane-4 SRI is a hazard; it did not cause Ariane4 to fall, because the associated conditions did not occur (but they certainly did on Ariane-5). The failure mode for Ariane-5 is the situation where the SRI ran longer than the period for which it was designed.
FMEA is highly labor-intensive and based on the experience of the analysts. It usually involves our performing an initial analysis of the software design, abstracting "modes that might lead to failures. Then we look at how combinations of the basic failure modes might lead to actual failures. Sidebar 9.11 describes how FMEA, in concert with other techniques, might have improved the safety of Therac-25.
TABLE 9.6 Perspectives for Safety Analysis
Known Cause Unknown Cause
Known effect Description of system behavior Deductive analysis, including fault-
tree analysis
Unknown effect Inductive analysis including failure Exploratory analysis, including
modes and effects analysis hazard and operability studies
Hazard and operability studies (HAZOPS) involve a structured analysis to anticipate system hazard and to suggest means to avoid or deal with them. They are based on a technique developed by the Imperial Chemical Industries (UK) in the 1so to analyze the design of a new chemical plan. HAZOPS uses guide words as part of an extensive review process in conjunction with an analysis of control and data flow between process components, to help analysts identify hazards. Table 9.7 presents an example of guide words for a system where even timing controlled by data and signals is important for task coordination.
TABLE 9.7 HAZOP Guide Words
Guideword Meaning
no No data or control signal sent or received
more Data volume is too high or fast
less Data volume is too low or slow
part of Data or control signal is incomplete
other than Data or control signal has additional component
early Signal arrives too early for system clock
late Signal arrives too late for system clock
before Signal arrives earlier in sequence than expected
after Signal arrives later in sequence than expected
Fenelon et al. (1994) have adapted HAZOPS, to software situations, called the SHARD method. They base their guide words on three views of a hazard:
1. Provision: The software either provides a service when it should not or it does not provide a service when it should: omission/commission.2. Timing: The service is either provided too soon or too late: early/late.3. Value: The service is incorrect and it is either easy to see the fault or not: coarse incorrect/subtle incorrect.
This framework is expanded to a large set of guidewords, as shown in Table 9.8.Once a failure mode is identified, we look for possible causes and consequences. When we
find a meaningful cause and effect, we then look for strategies either to avoid the causes or to moderate the effects. During testing, we can select test cases to exercise each failure mode, so that we can observe that the system reacts appropriately (i.e., does not lead to a catastrophic failure).
TABLE 9.8 SHARD Guidewords'
Failure
Categorization
Flow Provision Timing Value
Protocol Type Omission Commission Early Late Subtle Coarse
Pool Boolean No update Unwanted N/A old data Stuck at... N/A
update
Value No update Unwanted N/A old data wrong out of
update tolerance tolerance
Complex No update Unwanted N/A old data Incorrect Inconsistent
update
Channel Boolean No data Extra data Early Late Stuck at... N/A
Value No data Extra data Early Late Wrong out of
Tolerance tolerance
Complex No data Extra data Early Late Incorrect Inconsistent
CleanroomIn the Inid-i98os, researchers at IBM proposed a new software development process,
designed to produce high-quality software with a high-productivity team. Their process called cleanroom, reflects ideas used in chip production to keep faults at a minimum (Mills, Dyer, and Linger 1987).
Cleanroom Principles and Techniques. The cleanroom approach addresses two fundamental principles:
1. to certify the software with respect to the specifications, rather than wait for unit testing to find the faults3. to produce zero-fault or near-zero-fault software
The principles are applied by blending several techniques discussed in this and earlier chapters. First, software is specified using box structures, introduced in Chapter 5. The system is defined as a black box, refined as a state box, and refined again as a clear box. The box structures
encourage analysts to find omissions in requirements early in the life Cycle, when they are easier and cheaper to fix.
Next, the clear-box specification is converted to an intended function, expressed in natural language or in mathematics, as appropriate. A correctness theorem defines a relationship, expressed as one of three correctness conditions, that describes the correctness of each intended function with respect to its control structures.
For example, the correctness conditions for common structures can be expressed in question form (Linger undated):
Control structures: Correctness conditions:
Sequence For all arguments:
[ f ]
Do
g: Does g followed by h do f?
h
OD
If thenelse
[ f ]
IF p whenever p is true
THEN does g do f, and
g whenever p is false
ELSE does h do f?
h
FI
While do
[ f] Is termination guaranteed, and
WHILE p whenever p is true
Do does g followed by f do f, and
g whenever p is false
OD does doing nothing do f?
The project team review these relationships and verifies the correctness conditions with formal proofs of correctness. For example, a program and its subproofs may look like this (Linger undated):.
Program: Subproofs :
[f1] f1 = [DO g1;g2; [f2] OD] ?
DO
gl
g2
[f2] f2 = [WHILE pl DO [f3] OD] ?
WHILE
Pl
DO [f3] f3 = [DO g3; [f4];g8 OD] ?
g3
[f4] f4 = [IF p2 THEN [f5] ELSE [f6] FI] ?

IF
P2
THEN [f5] f5 = [DO g4;g5 OD] ?'
g4
g5
ELSE [f6] f6 = [DQ g6;g7 OD] ?
g6
g7
FI
g8
OD
OD
This verification takes the place of unit testing, which is not permitted. At this stage, the software is certified with respect to its specification.
The final step involves statistical usage testing, where test cases are randomized based on probability of usage, as we saw earlier in this chapter. The results are used in a quality model to determine the expected mean time to failure and other quality measures. The researchers at IBM feel that traditional coverage testing finds faults in random order, whereas statistical testing is more effective at improving overall software reliability Cobb and Mills (1990) report that statistical usage testing is more than 20 times as effective at extending Mm than is coverage testing.
The promise of Cleanroom. There have been many empirical evaluations of cleanroom. For example, Linger and Spangler (1992) note that first-time cleanroom teams at IBM and elsewhere have produced over 300,000 lines of code with high productivity, involving a fault rate of 2.9 faults per thousand lines of code. They claim that this is an order of magnitude reduction from the 3o to 5o faults per thousand lines of their code developed traditionally Moreover, "experience shows that errors left behind by correctness validation tend to be simple mistakes easily found and fixed in statistical testing, not the deep design and interface errors often encountered in traditional development" (Linger and Spangler 1992). The reported results are based on teams ranging from 3 to 50 members, with many kinds of applications developed in a large assortment of procedural and object-oriented languages.
The Software Engineering Laboratory at NASA’s Goddard Space Flight Center put cleanroom to a rigorous test. It performed a series of controlled experiments and case studies to determine if some of the key elements of the cleanroom approach work as advertised. As you can see from the results in Table 9.9, cleanroom seems to work well on small projects but not on larger ones. Consequently, the SEL cleanroom process model is evolving, in particular, the current SEL process model is being applied to projects involving fewer than 5o,o00 lines of code but is being changed for larger projects. In addition, SEL developers no longer use reliability modeling and prediction, because they have little data on which to base their projections. Basili and Green (1994) note that these studies, performed in a flight dynamics environment, have convinced them that key features of cleanroom led to lower fault rates, higher productivity, a more complete and consistent set of code comments, and a redistribution of developer effort. However, they caution that the SEL environment is different from IBM's, and that cleanroom must be tailored to the environment in which it is used.

Cautions about Cleanroom. Although much in the literature suggests that cleanroom improves software quality Beizer (1997) suggests that we read the results with caution. He claims that cleanroom's lack of unit testing promotes dangerous malpractice, contradicting "known testing theory and common sense." According to Beizer, "you cannot find a bug unless you execute the code that has the bug," and orthodox cleanroom relies only on statistical testing to verify reliability shunning unit testing of any kindMorever, statistical usage testing, itself can be misleading, as explained in Sidebar 9.12.
TABLE 9.9 NASA’s SEL Study Results (Basili and Green 1994) @ 1996 IEEE
Characteristic Experiment Case Study 1 Case Study 2 Case Study 3
Team sire Three-person de- Three-person de- Four-person devel- Fourteen-person
velopment teams velopment team, opment team; development
(l0 experiment two-person test two-person test team; four-person
team, 5 control team team test team
teams), common
independent tester
Project size and 15000 lilles of For- 40,000 lines of For- 22,000 lines of For- 160,000 lines of
application tran code; message tran code; flight- tlan code; flight-Fortran code;
system for gradu- dynamics, ground- dynamics, ground- flight-dynamics,
ate laboratory support system support system ground-support
course system
Results Cleanroom teams Project spent high- Project continued Project reliability'
used fewer com- er percentage of trend in better only slightly bet-
puter resources, effort in design, reliability while ter than baseline
satisfied require- used fewer com- maintaining while productivi-
ments more suc- puter resources, baseline produc- ty fell below
cessfully and and achieved bet- tivity baseline
made higher per- ter productivity
centage of sched- and reliability
uled deliveries than environ-
ment baseline
Beizer points out that cleanroom is never measured against. proper unit testing done by addressing coverage goals. testing done by software engineers trained in testing techniques. testing performed by organizations that use test design and automated testingtechniques. proper integration testing
Moreover, cleanroom assumes that we are good at measuring software reliability However, the reliability literature, summarized by the papers in Lyu's reliability handbook (1996), indicates that there are many problems with reliability engineering. In particular, as we have seen, we cannot guarantee that the operational profiles, essential to good modeling, are accurate or even meaningful.
Beizer describes the results of 24 empirical studies that have evaluated cleanroom, including Basili and Green'sf (1994), pointing out that they have several fatal flaws.

. The subjects knew they were participating in an experiment, so the Hawthorne effect may have influenced the results. That is, the fact that the participants knew their products were being evaluated may have caused the increase in quality not the cleanroom technique itself. The "control'' group of testers had no training or experience in proper testing methods. No coverage tools or automated techniques were used to support testing.. Cheating was not controlled, so it is possible that cleanroom was actually applied to already debugged code.
By contrast, Beizer notes that no research has ever exposed current testing theory as being mathematically flawed. Since he finds the body of empirical evidence unconvincing, he suggests that retrospective empirical analysis can eliminate some of the bias (Vinter 1996). To compare two methods, we can develop software with the first method, recording all the faults discovered during the development process and the first year of use. Then, the second method could be applied to the code to see whether it reveals any of the faults already discovered. Similarly, a system developed using the second method could have the first method applied to it retrospectively.
The winner of this argument is yet to be determined. But Beizer raises some important issues and teaches us to be skeptical, not only of the software engineering techniques that are proposed to solve major problems of quality and productivity but also of the evaluative techniques used to convince us that one technique is superior to another. We must take great care to test our theories and assumptions as well as our software.
9.10 INFORMATION SYSTEMS EXAMPLEThe concepts discussed in this chapter have practical significance for the developers of the
Piccadilly system. The testers must select a method for deckling how to perform system testing, when to stop testing, and how many faults and failures to expect. These questions are not easy to answer. For example, the literature is not clear about what kind of fault density is expected or acceptable:
. Joyce (1989) reports that NASA’s space shuttle avionics system had a defect density of 0.1 fault per thousand lines of code.. Jones (1991) claims that leading-edge software companies have a fault density of 0.2 fault per thousand lines of code, or no more than 0.025 user-reported failure per function point.. Musa, Iannino, and Okumoto (1990) describe a reliability survey that found an average density of 1.4 faults per thousand lines of code in critical systems.. Cavano and LaMonica (1987) reference surveys of military systems, indicating fault density ranging from 5.0 to 55.0 faults per thousand lines of code.
So setting goals for fault density or computing stopping criteria, is difficult at best. As noted in Sidebar 9.13, hardware analogies are sometimes inappropriate for making decision about quality Instead, the Piccadilly developers would be wise to examine fault and failure records from past projects that are similar in some ways: language, functions, team members, or design techniques. They can build a model of fault and failure behavior, assess likely risks, and n1ake projections based on the data that are captured as testing progresses.
There are many variables associated with Piccadilly system functions, because the price of advertising time is dependent on so many different characteristics: day of week, time of day competing programs, number and kind of repeat advertisements, and more. Thus there are many different test cases to consider, and an automated testing tool may be useful for generating and tracking test cases and their results.

Bach (1997) suggests several factors to consider when selecting a test tool.. Capability: Does the tool have all the critical features needed, especially for test result validation and for managing the test data and scripts?. Reliability: Does the tool work for long periods of time without failure?. Capacity: Can the tool work without failure in a large-scale industrial environment?. Learnability: Can the tool be mastered in a short period of time?. Operability: Is the tool easy to use or are its features cumbersome and difficult?. Performance: wll the tool save you time and money during test planning, development, and administration?. Compatibility: Does the tool work in your environment?. Nonintrusiveness Does the tool simulate an actual user, and in a realistic way?
Bach cautions us not to rely only on descriptions in users manuals or functions demonstrated at trade shows. To address each factor, it is important to use the tool on a real project, learning about how it works in our environment. The Piccadilly developers should evaluate several tools in their environment and select one that, relieves them of the tedious process of generating all possible test cases. However, no tool will relieve them of the process of deciding which factors are important in distinguishing one test case from another.
9.11 REAL-TIME EXAMPLEWe have seen in earlier chapters that problems with requirements and inadequate reviews
contributed to the failure of Ariane-5's inertial, reference software, SRI. The committee evaluating the failure also considered the preventative role that simulation might have played. They noted that it would have been impossible to isolate and test the SRI during flight, but software or hardware simulations could have generated signals related to predicted flight parameters while a turntable provided angular movements. Had this approach been taken during acceptance testing, the investigators think the failure conditions would have been revealed.
In addition, testing and simulation were being carried out at a Functional Simulation Facility, with the intention of qualifying
. the guidance, navigation, and control systems
. the redundancy of the sensors
. the functions of each rocket stage
. the on-board computer software's compliance with the flight control systemAt this facility, engineers ran closed-loop simulations of the complete flight, including
ground operations, telemetry flow and launcher dynamics. They hoped to verify that the nominal trajectory was correct, as well as trajectories degraded using internal launcher parameters, atmospheric parameters, and equipment failures. During these tests, the actual SRIs were not used; instead, the SRIs were simulated using specially developed software. Only some open-loop tests were performed with the actual SRI, and just for electrical integration and communication compliance.
The investigators note thatIt is not mandatory, even if preferable, that all the parts of the subsystem are present in all the tests at a given level. Sometimes this is not physically possible or it is not possible to exercise them completely or in a representative way In these cases, it is logical to replace them with simulators but only after a careful check that the previous test levels have covered the scope completely (Lions et al. 1996)
In fact, the investigative report describes two ways in which the SRIs could have been used. The first approach might have provided an accurate simulation but would have been very expensive. The second was cheaper but its accuracy was dependent on the simulation's accuracy But in both cases, much of the electronics and all of the software would have been tested in a real operating environment.
So why were the SRIs not used in the closed-loop simulation? First, it was felt that the SRIs were considered to have been qualified at the equipment level. Second, the precision of the navigation software in the on-board computer depended on the SRI's measurements. However, this precision could not have been achieved by using the test signals; simulating failures modes was thought to be better with a model. Finally, the SRI operated with a base period of one millisecond, but the Functional Simulation Facility used six milliseconds, further reducing simulation precision.
The investigators found these reasons to be valid technically But they also pointed out that the purpose of a system simulation test is to verily not just interfaces, but also the system as a whole for the particular application. They concluded that
there was a definite risk in assuming that critical equipment such as the SRI had been validated by
qualification on its own, or by previous use on Ariane-4. While high accuracy of a simulation is desirable, in
the FSF system tests it is clearly better to compromise on accuracy but achieve all other objectives, amongst
them to prove the proper system integration of equipment such as the SRI. The precision of the guidance
system can be effectively demonstrated by analysis and computer simulation. (Lions et al. 1996)
9.12 WHAT THIS CHAPTER MEANS FOR YOUThis chapter discussed many of the major issues in software testing, including those related
to reliability and safety As an individual developer, you should anticipate testing from the very beginning of the system life cycle. During requirements analysis, you should think about system functions that will capture state information and data that will help you find the root cause if the software fails. During design, you should use fault-tree analysis, failure modes and effects analysis, and other techniques to help you avoid failures or moderate their effects. During design and code reviews, you can build a safety case to convince you and your colleagues that your software is highly reliable and will lead to a safe system. And during testing, you can take great care to consider all possible test cases, to automate where appropriate, and to ensure that your design addresses all possible hazards.
9.13 WHAT THIS CHAPTER MEANS FOR YOUR DEVELOPMENT TEAMAs an individual developer, you can take steps to assure that the components you design,
develop, and test work according to the specification. But of ten the problems that arise in testing derive from the interfaces among components. Integration testing is useful to test combinations of components, but system testing adds more realism--and more chance for failure to occur. Your team must keep communication channels open during this type of testing and make all assumptions explicit. Your team must examine carefully the system's boundary conditions and exception handling.
Techniques such as cleanroom require a great deal of team planning and coordination, in developing the box structures and in designing and running the statistical tests. And the activities involved in acceptance testing require close collaboration with customers and users; as they run tests and find problems, you must quickly determine the cause so correction can allow testing to proceed. Thus, whereas some parts of development are solitary, individual tasks, testing the

system is a collaborative, group task.9.14 WHAT THIS CHAPTER MEANS FOR RESEARCHERSThere are many more approaches to testing than we have been able to describe here.
Empirical research continues, to help us understand which kinds of testing find which kinds of faults. This body of empirical work, combined with "testing theory" promise to make our testing more cost-effective.
Hamlet (1992) suggest several key issues for researchers to consider:. In testing for reliability clever ways of partitioning the system to guide testing may be no better than random testing.. We need a better understanding of what it means for software to be dependable. It is possible that state explosion (i.e., the very large number of states that create a very large number of test cases) is not as critical as we think it is. We may be able to group related states and then pick sample test cases from the groups.. We may be able to characterize those kinds of programs and systems for which the number of test cases is not forbiddingly high; we can say that these systems are more "testable" than those with an impossibly high number of cases to execute.. Voas and Miller (1995) have defined a technique that examines a state's "sensitivity" to changes in the data state. Faults in insensitive states are likely to be difficult to detect by testing. Researchers must investigate how sensitivity relates to testing difficulty
In addition, researchers should distinguish between testing to find faults and testing to increase reliability Some researchers (such as Frankl et al. 1997) have demonstrated that using the first goal does not always meet the second one.
9.15 TERM PROJECTWe have discussed how designs may not be as diverse as we would like to think they are.
Compare your design with those of other students or teams in your class. How are they different? How are they the same? For each kind of testing, would the similarities or differences in design help or hinder the discovery of faults in code?
9.16 KEY REFERENCESThere have been several special issues of IEEE Software focused on the topics covered in this
chapter. The June 1992 and May 1995 issues looked at reliability and the March 1991 issue focused on testing.
The proceedings of the annual International Conference on Software Engineering usually has good papers on the latest in testing theory For example, Frankl et al. (1997) examine the difference between testing to improve reliability and testing to find faults. Good reference books on testing include Beizer (1990); Kaner, Falk, and Nguyen (1993); and Kit (1995). Each provides a realistic perspective based on industrial experience.
There are several companies that evaluate software testing tools and publish summaries of their capabilities. For example, Ovum Ltd. ([email protected]. com) provides detailed, 20-page evaluations of each of several dozen testing tools. The tools are described in term of their application to requirements analysis and validation, planning and management, simulation, test development, test execution, coverage analysis, source code analysis, and test case generation.
Software dependability and safety-critical systems are receiving more and more attention, and there are many good articles and books about the key issues, including Leveson (1996, 1997). In addition, the Dependable Computing Systems Centre in the Department of Computer Science,

University of York, UK, is developing techniques and tools for assessing software dependability You can get more information from its director, John McDermid, at [email protected].
Usability testing is very important; a system that is correct and reliable but difficult to use may in fact be worse than an easy-to-use but unreliable system. Usability tests and more general usability issues are covered in depth in Hix and Hartson (1993).
9.17 EXERCISES1. Consider the development of a two-pass assembler. Outline its function and describe how you might test it so each function is tested thoroughly before the next function is examined. Suggest a build plan for the development, and explain how the build plan and testing must be designed together.2. Certification is an outside source's endorsement of a system's correctness. It is often granted by comparing the system to a predefined standard of performance. For example, the U.S. Department of Defense certifies an Ada compiler after testing it against a long list of functional specifications. In the terminology of this chapter, is such a test a function test? A performance test? An acceptance test? An installation test? Explain why or why not.3. When you develop a build plan, you must take into account the resources available to both developers and customers, including time, staff and money Give examples of resource constraints that can affect the number of builds defined for system development. Explain how these constraints affect the build plan.4. Suppose a mathematician's calculator has a function that computes the slope and intercept of a line. The requirement in the definition document reads: "The calculator shall accept as input an equation of the form Ax + By + C = 0 and print out the slope and intercept." The system implementation of this requirement is the function LINE whose syntax is LINE(A,B,C), where A and B are the coefficients of x and y, and C is the constant in the equation. The result is a printout of D and E, where D is the slope and E the intercept. Write this requirement as a set of causes and effects, and draw the corresponding cause-and-effect graph.5. In Chapter 4, we discussed the need for requirements to be testable. Explain why testability is essentia1 for performance testing. Use examples to support your explanation.6. What kinds of performance tests might be required for a word processing system? A payroll system? An automated bank teller system? A water quality monitoring system? A power plant control system?7. An air traffic control system can be designed so it serves one user or many. Explain how such a system can have a variety of configurations, and outline how a set of configuration tests might be designed.8. A navigation system is about to be installed on an airplane. What issues must be considered as you design the installation test?9. The following news release from CNN describes a software feature whose proper implementation might have prevented the crash of Korean Air Lines flight 801 in Guam in August 1997. What type of testing could have ensured that the feature was working properly in an appropriately sized area around Guam airport?10. Give an example to show that testing is sometimes impossible without using a device simulator. Give another example to show the need for a system simulator.11. Comment on the discrepancy report form in Figure 9.15 in light of the questions that we should be able to answer about the failure by reading the form.

12. A payroll system is designed so that there is an employee information record for each person who works for the company Once a week, the employee record is updated with the number of hours worked by the employee that week. Once every two weeks, summary reports are printed to display the number of hours worked since the beginning of the fiscal year. Once a month, each employee's pay for the month is transferred electronically into his or her bank account. For each of the types of performance tests described in this chapter, describe whether it should be applied to this system.13. Wllie's Wellies PLC has commissioned Robusta Systems to develop a computer-based system for testing the strength of its complete line of rubber footwear. Willie's has nine factories in various locations throughout the world, and each system will be configured according to factory size. Explain Why Robusta and Willie's should conduct installation testing When acceptance testing is complete.14. Write a test script for testing the LEVEL function described in this chapter.15. In this chapter, we have proposed a reliability measures in terms of mean time to failure, availability in terms of mean time between failures, and maintainability in terms of mean time to repair. Are these measures consistent with the definitions presented in this chapter? That is, if reliability availability and maintainability are defined as probabilities, will we get the same numbers as if we use the metrics? If not, can one be transformed into the other or are there basic, irreconcilable differences?
FIGURE 9.1 S Example discrepancy report form.
16. A safety-critical system fails and several lives are lost. When the cause of the failure is investigated, the inquiry commission discovers that the test plan neglected to consider the case that caused the system failure. Who is responsible for the deaths: The testers for not noticing the missing case? The test planners for not writing a complete test plan? The managers for not having checked the test plan? The customer for not having done a thorough acceptance test?17. If a system's ultrahigh reliability requirement means that the reliability can never be verified, should the system be used anyway?18. Sometimes, customers hire an independent organization (separate from the development organization) to do independent Verification and Validation (V&V). The V&V staff examines all aspects of development, including process and product, to ensure the quality of the final product. If an independent V&V team is used and the system still experiences a catastrophic failure, who should be held responsible: the managers, the V&V team, the designers, the coders, or the testers?19. In this chapter, we introduced two functions: the distribution function, F(t), and the reliability function, R(t). If the reliability of a system improves as we test and fix it, what happens to the graphs of these functions?20. Sidebar 9.3 describes two versions of Vxworks software, one for a 68000 chip and one for an R6o(X) chip. Explain the configuration management issues related to building one system for two different chips. Could the configuration management strategy have helped the vendor to port the 68000 version to the R6000?21. A test oracle is a hypothetical person or machine that can tell when actual test results are the same as expected results. Explain the need for including a test oracle in developing testing theory22. Outline a build plan for testing the Piccadilly system.