Embed Size (px)
Citation preview
MultiAttribute Tradespace Exploration as Front End for Effective Space System Design
9 October 2009
2LT. John Richmond
Greg O’Neill
Jorge Cañizales Diaz
MATECON
“MultiAttribute Tradespace Exploration with ConCurrent Design”
� What does it mean? � Applying a series of decision metrics (attributes) that consider the integration of all stakeholder requirements to generate a framework incorporating all qualified designs and indicating the most viable candidates.
9 Oct 2009 2
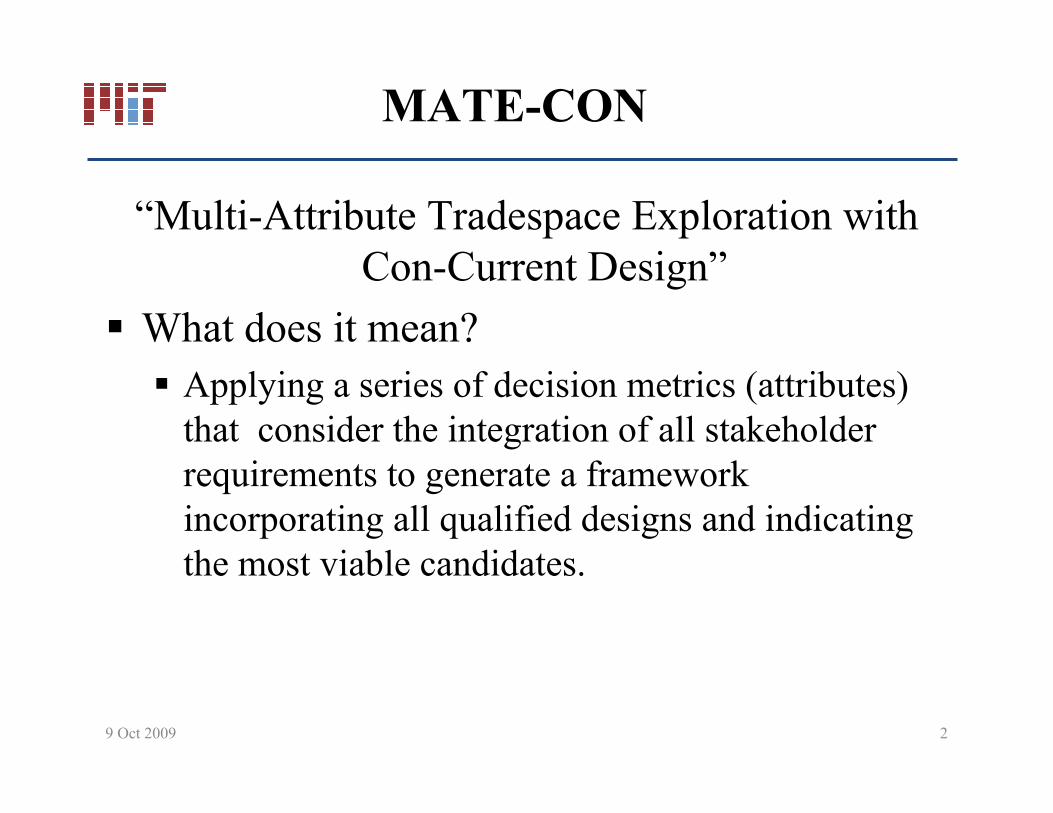
Taxonomy� MATECON buzzwords
Decision Maker Person who makes decisions that impact a system at any stage of its lifecycle
Design Variable Designercontrolled quantitative parameter that reflects an aspect of a concept
Design Vector Set of design variables that, taken together, uniquely define a design or architecture
Attribute Decision maker perceived metric measuring how well a defined objective is met
Utility Perceived value under uncertainty of an attribute
Tradespace Space spanned by completely enumerated design variables
Pareto Frontier Set of efficient allocations of resources forming a surface inmetric space
Exploration Utilityguided search for better solutions within a tradespace
Concurrent Design Techniques of design that utilize information technology forrealtime interaction among specialists
Architecture Level of segmentation for analysis that represents overall project form and function
9 Oct 2009 3

Index
1. Context of MATECON
2. Implementing MATECON1. MATE
2. CON
3. Alternatives
4. Benefits
5. Limitations
6. Discussion
9 Oct 2009 4
Index
1. Context of MATECON
2. Implementing MATECON1. MATE
2. CON
3. Alternatives
4. Benefits
5. Limitations
6. Discussion
9 Oct 2009 5
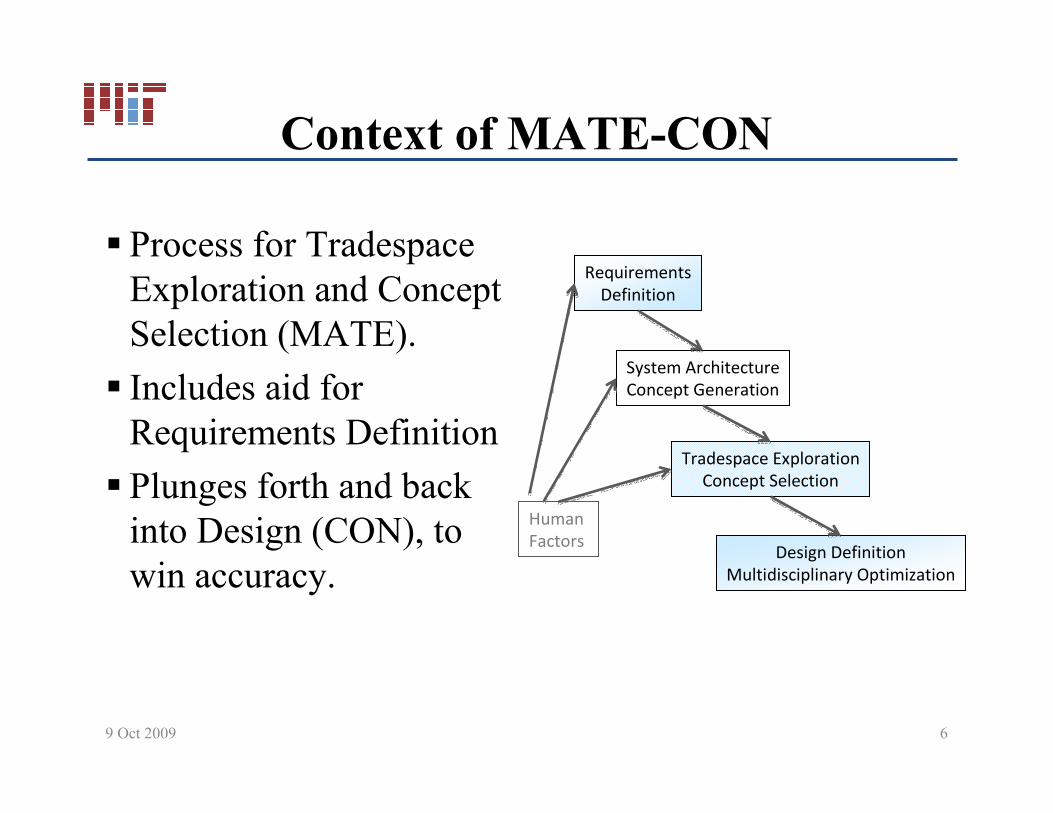
Context of MATECON
� Process for Tradespace Exploration and Concept Selection (MATE).
� Includes aid for Requirements Definition
� Plunges forth and back into Design (CON), to win accuracy.
System Architecture
Concept Generation
Tradespace Exploration
Concept Selection
Design Definition
Multidisciplinary Optimization
Human
Factors
Requirements
Definition
9 Oct 2009 6
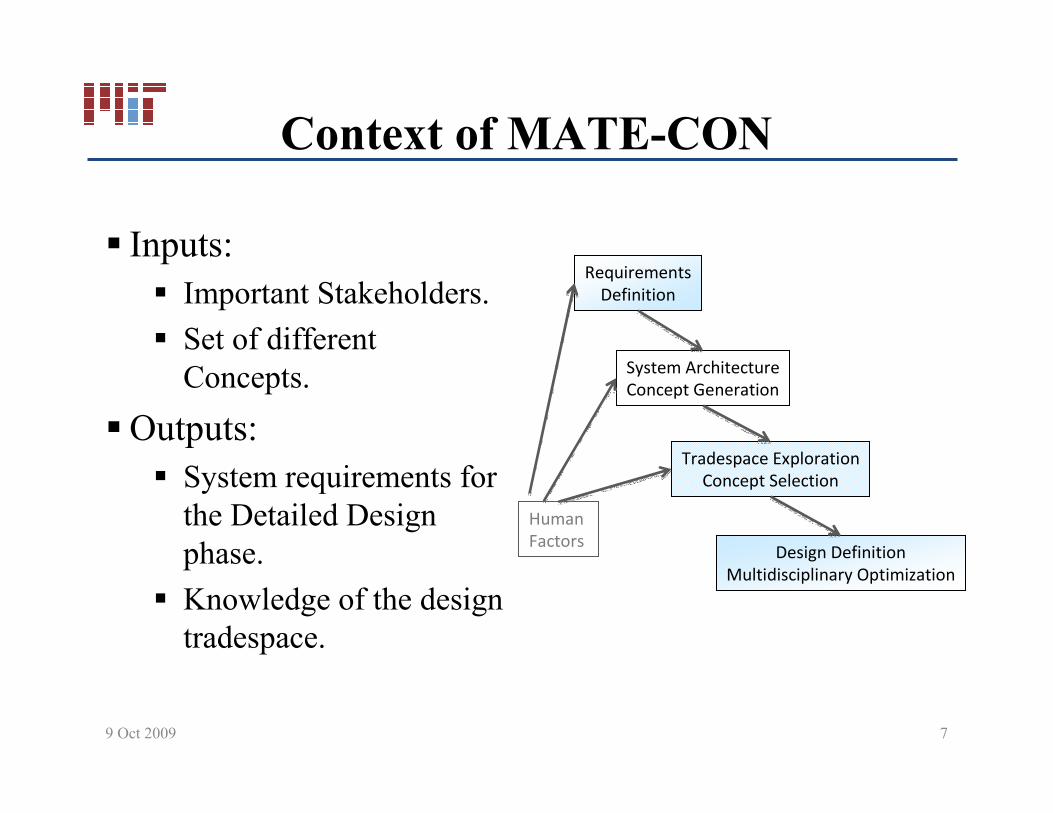
Context of MATECON
� Inputs: � Important Stakeholders.
� Set of differentConcepts.
�Outputs: � System requirements for the Detailed Design phase.
� Knowledge of the design tradespace.
System Architecture
Concept Generation
Tradespace Exploration
Concept Selection
Design Definition
Multidisciplinary Optimization
Human
Factors
Requirements
Definition
9 Oct 2009 7
Index
1. Context of MATECON
2. Implementing MATECON1. MATE
2. CON
3. Alternatives
4. Benefits
5. Limitations
6. Discussion
9 Oct 2009 8
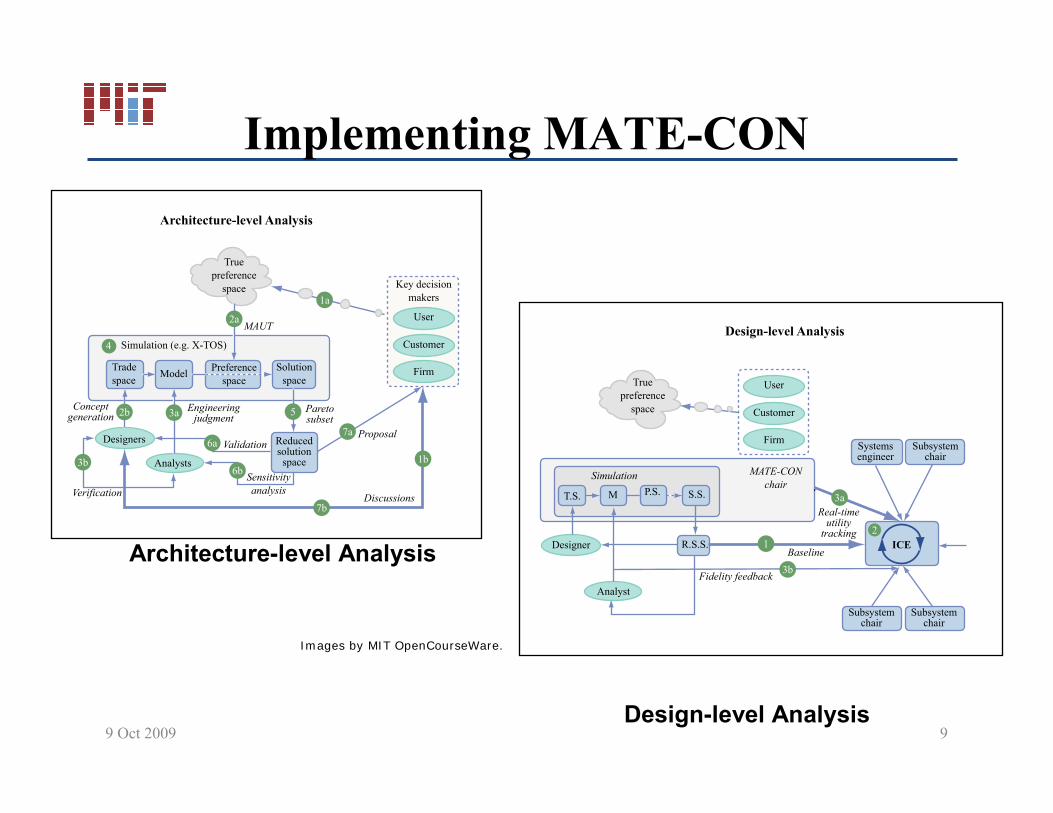
Implementing MATECON
Architecturelevel Analysis
Designlevel Analysis 9 Oct 2009 9
Tradespace
Reducedsolution
space
Designers
Analysts
Solutionspace
User
Key decisionmakers
Customer
FirmModel Preferencespace
Truepreference
space
4
2b 3a
3b6b
7b
1b
7a6a
5
2a
1a
Simulation (e.g. X-TOS)
Conceptgeneration
Engineeringjudgment
Validation
VerificationSensitivityanalysis
Proposal
Discussions
Paretosubset
MAUT
Architecture-level Analysis
Designer
Analyst
Truepreference
space
User
Customer
Firm Systemsengineer
ICE
Design-level Analysis
Subsystemchair
Subsystemchair
Subsystemchair
3a
21
3bFidelity feedback
Simulation MATE-CONchair
Baseline
Real-timeutility
tracking
S.S.
R.S.S.
T.S. P.S.M
Images by MIT OpenCourseWare.

Index
1. Context of MATECON
2. Implementing MATECON1. MATE
2. CON
3. Alternatives
4. Benefits
5. Limitations
6. Discussion
9 Oct 2009 10
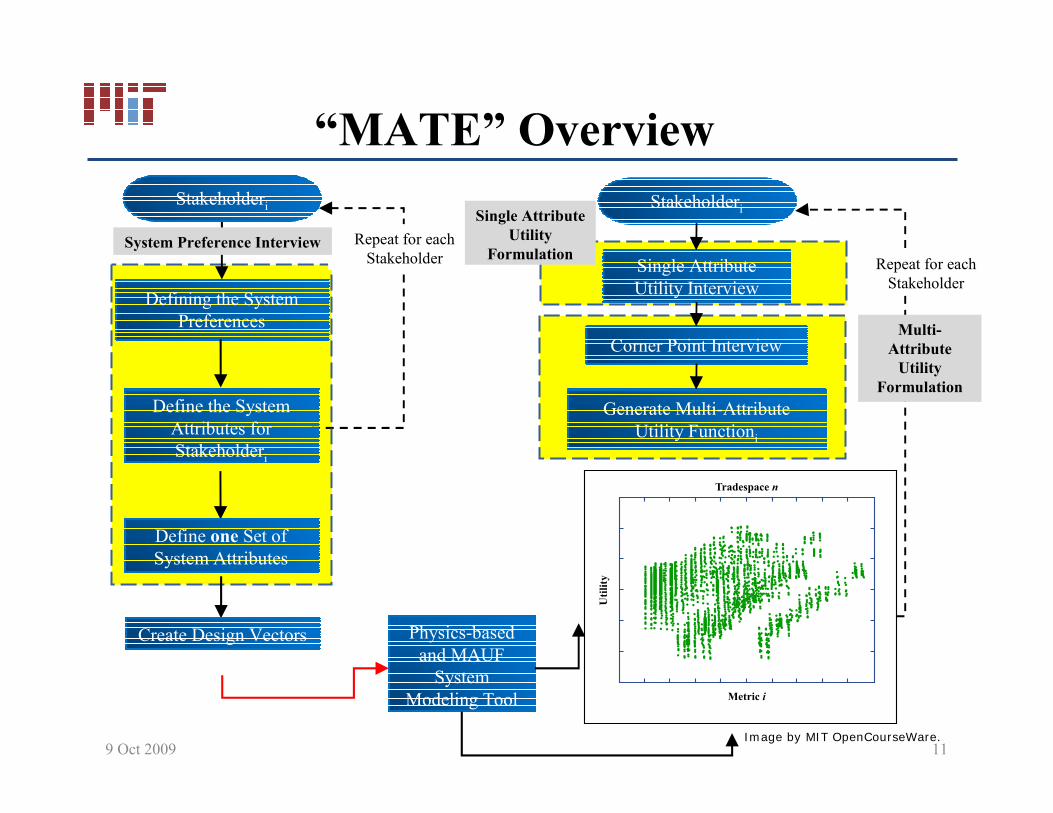
“MATE” Overview
9 Oct 2009 11
Generate MultiAttribute
Utility Functioni
Defining the System Preferences
Repeat for each Stakeholder
Define one Set of System Attributes
Stakeholderi Stakeholderi
Single Attribute
Utility Interview
Corner Point Interview
Define the System Attributes for Stakeholderi
System Preference Interview
Multi
Attribute Utility
Formulation
Single Attribute Utility
Formulation Repeat for each Stakeholder
Physicsbased and MAUF System
Modeling Tool
Create Design Vectors
Metric i
Tradespace n
Util
ity
Image by MIT OpenCourseWare.
Remote Sensing Mission Attributes
0.0
0.1
0.2
0.3
0.4
0.5
0.6
0.7
0.8
0.9
1.0
30 40 50 60 70 80 90 100
Uti
lity
()
System Availability (%)
System Availability: Single Attribute Utility Function
0.0
0.1
0.2
0.3
0.4
0.5
0.6
0.7
0.8
0.9
1.0
0 5 10 15 20 25
Uti
lity
()
Revisit Rate (hours)
Revisit Rate: Single-Attribute Utility Function
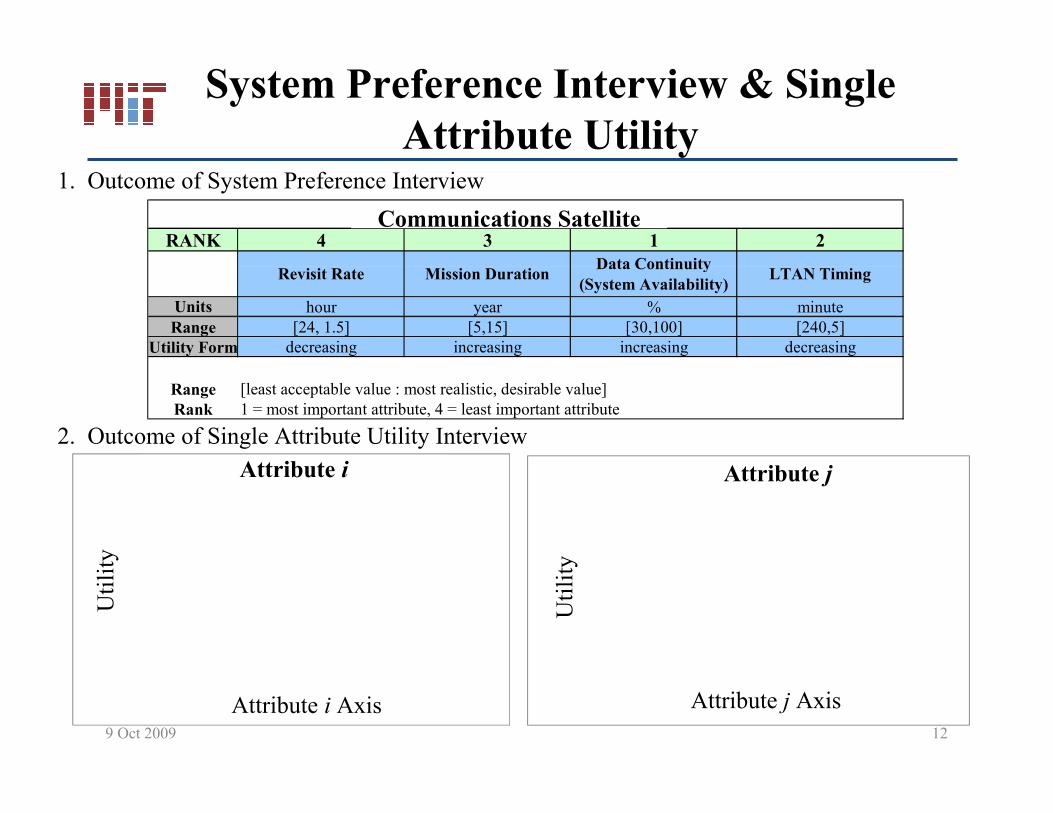
System Preference Interview & SingleAttribute Utility
1. Outcome of System Preference Interview
Communications Satellite RANK 4 3 1 2
Data Continuity Revisit Rate Mission Duration
(System Availability) LTAN Timing
Units hour year % minute Range [24, 1.5] [5,15] [30,100] [240,5]
Utility Form decreasing increasing increasing decreasing
Range [least acceptable value : most realistic, desirable value] Rank 1 = most important attribute, 4 = least important attribute
2. Outcome of Single Attribute Utility Interview
-
-Attribute j
Attribute j Axis
Utility
-
Attribute i
Attribute i Axis
Utility
9 Oct 2009 12
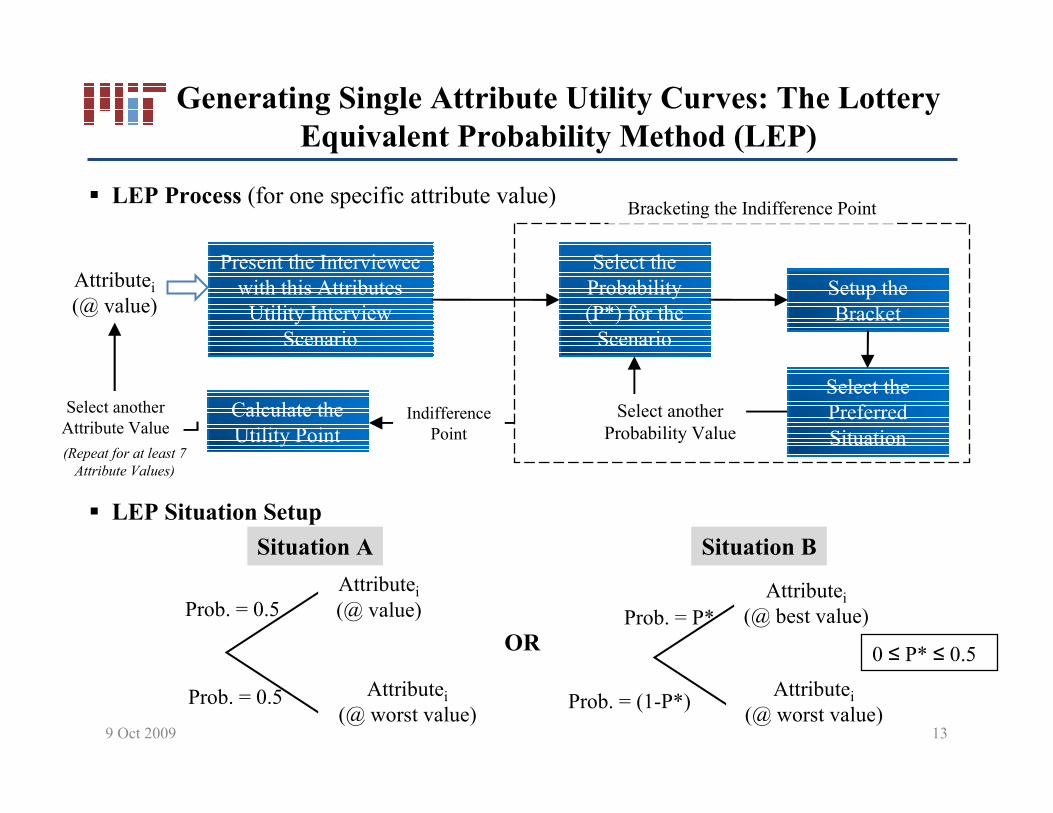
Generating Single Attribute Utility Curves: The LotteryEquivalent Probability Method (LEP)
� LEP Process (for one specific attribute value)
Select the Probability (P*) for the Scenario
Setup the Bracket
Present the Interviewee with this Attributes Utility Interview
Scenario
Attributei (@ value)
(Repeat for at least 7 Attribute Values)
Select another Probability Value
Select the Preferred Situation
Bracketing the Indifference Point
Indifference
Point Calculate the Utility Point
Select another
Attribute Value
� LEP Situation Setup
Situation A
Attributei (@ value)
Attributei (@ worst value)
Situation B
Prob. = 0.5
OR
Prob. = 0.5 Prob. = (1P*)
9 Oct 2009 13
Prob. = P* Attributei
(@ best value)
Attributei (@ worst value)
0 ≤ P* ≤ 0.5
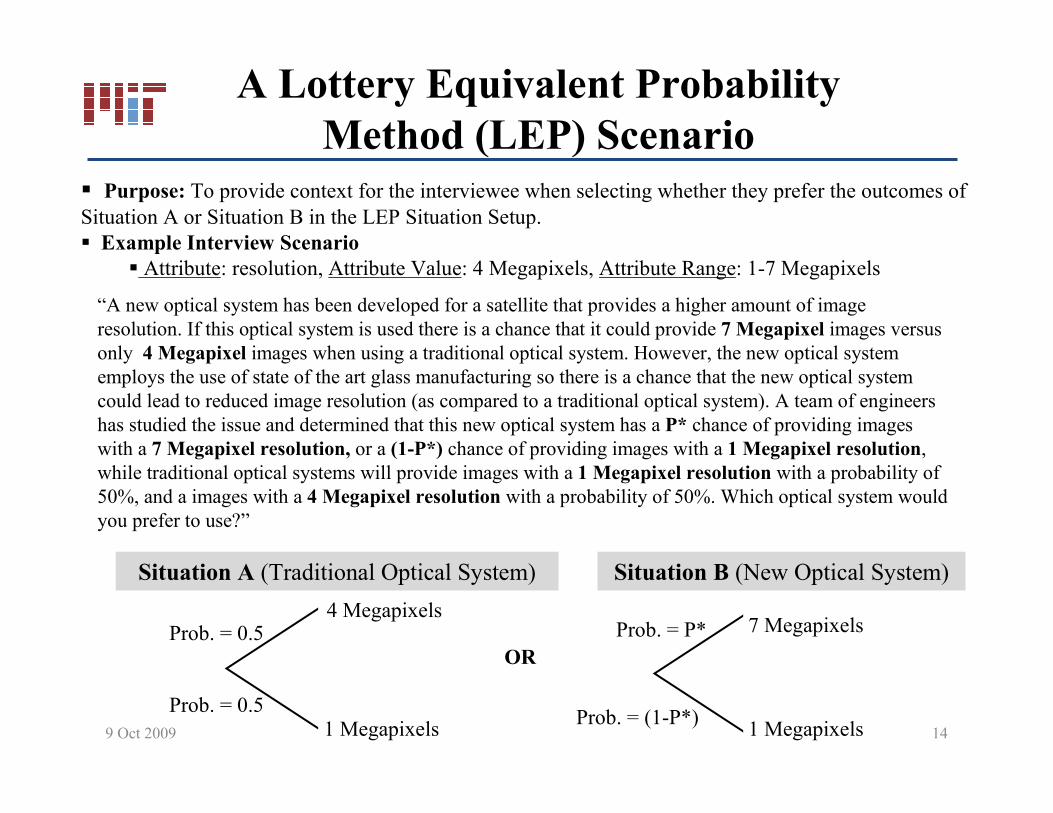
A Lottery Equivalent ProbabilityMethod (LEP) Scenario
� Purpose: To provide context for the interviewee when selecting whether they prefer the outcomes of Situation A or Situation B in the LEP Situation Setup. � Example Interview Scenario
� Attribute: resolution, Attribute Value: 4 Megapixels, Attribute Range: 17 Megapixels
“A new optical system has been developed for a satellite that provides a higher amount of image resolution. If this optical system is used there is a chance that it could provide 7 Megapixel images versus only 4 Megapixel images when using a traditional optical system. However, the new optical system employs the use of state of the art glass manufacturing so there is a chance that the new optical system could lead to reduced image resolution (as compared to a traditional optical system). A team of engineers has studied the issue and determined that this new optical system has a P* chance of providing images with a 7 Megapixel resolution, or a (1P*) chance of providing images with a 1 Megapixel resolution, while traditional optical systems will provide images with a 1 Megapixel resolution with a probability of 50%, and a images with a 4 Megapixel resolution with a probability of 50%. Which optical system would you prefer to use?”
Situation A (Traditional Optical System) Situation B (New Optical System)
4 Megapixels
1 Megapixels
Prob. = P* Prob. = 0.5 OR
Prob. = 0.5 Prob. = (1P*)
9 Oct 2009
7 Megapixels
1 Megapixels 14
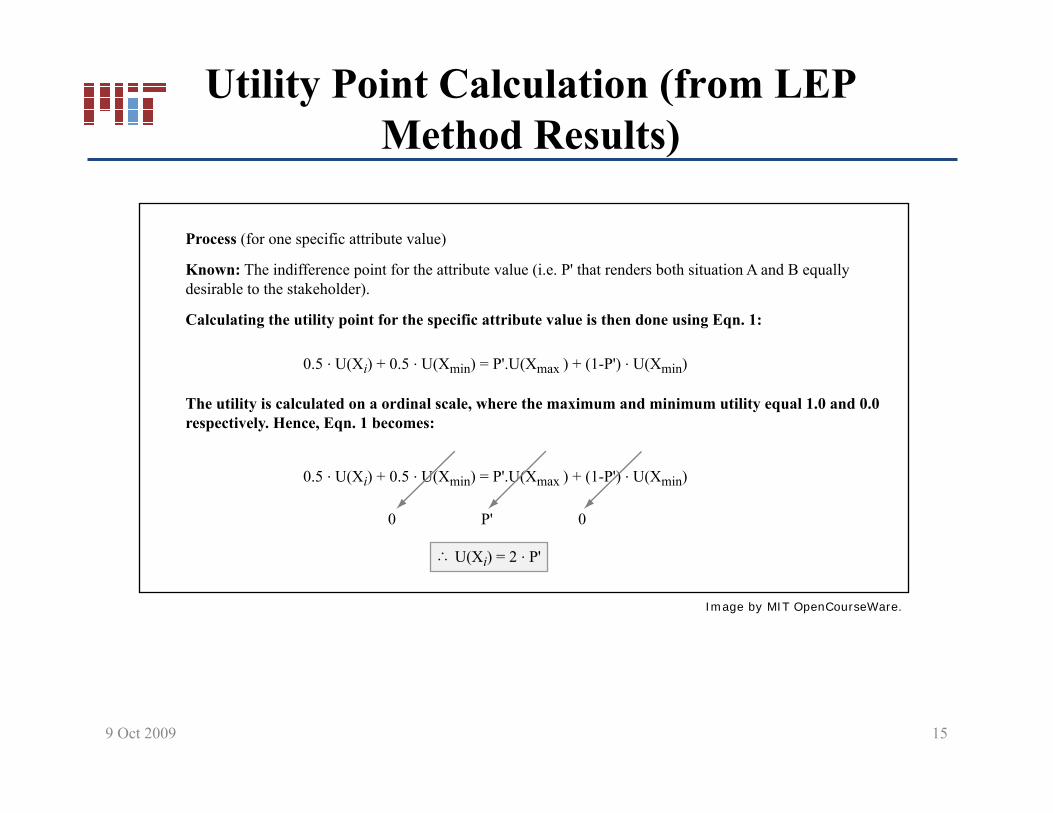
Utility Point Calculation (from LEPMethod Results)
9 Oct 2009 15
Process (for one specific attribute value)
0 0P'
Known: The indifference point for the attribute value (i.e. P' that renders both situation A and B equallydesirable to the stakeholder).
Calculating the utility point for the specific attribute value is then done using Eqn. 1:
The utility is calculated on a ordinal scale, where the maximum and minimum utility equal 1.0 and 0.0respectively. Hence, Eqn. 1 becomes:
0.5 . U(Xi) + 0.5 . U(Xmin) = P'.U(Xmax ) + (1-P') . U(Xmin)
U(Xi) = 2 . P'
0.5 . U(Xi) + 0.5 . U(Xmin) = P'.U(Xmax ) + (1-P') . U(Xmin)
Image by MIT OpenCourseWare.
__
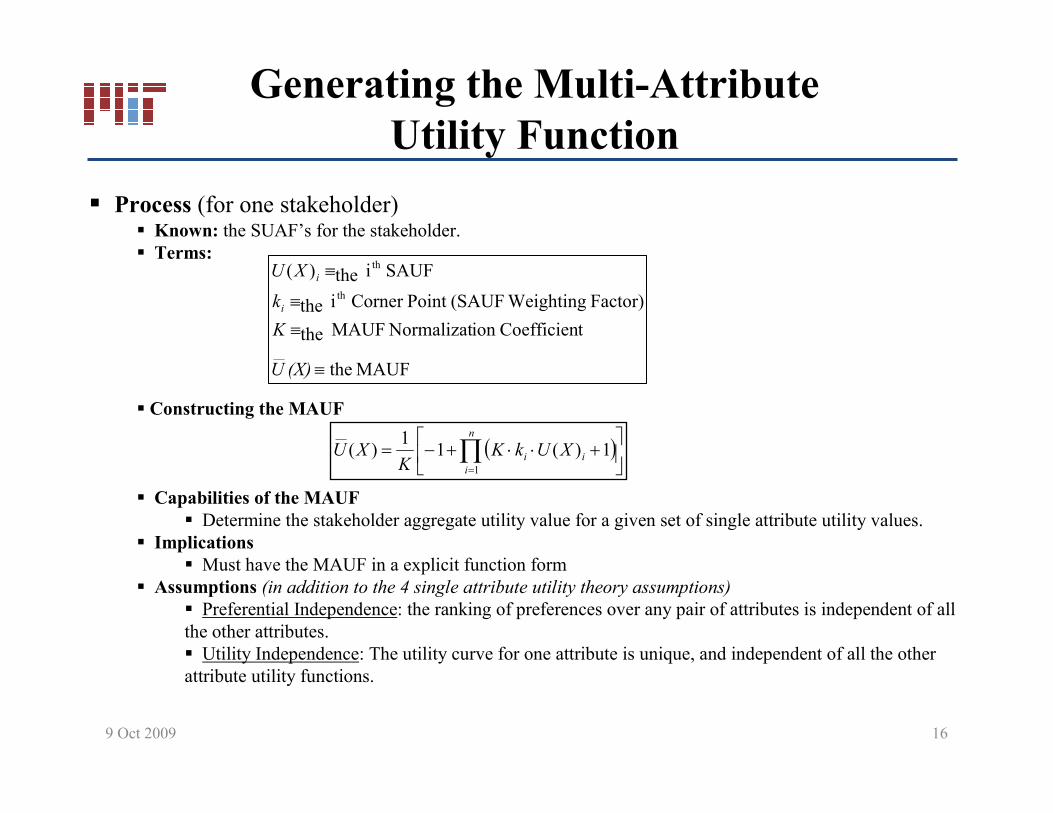
Generating the MultiAttributeUtility Function
� Process (for one stakeholder) � Known: the SUAF’s for the stakeholder. � Terms:
U (X )i ≡ the ith SAUF
k ≡ the ith Corner Point (SAUF Weighting Factor)i
K ≡ the MAUF Normalization Coefficient
U (X) ≡ the MAUF
� Constructing the MAUF __ 1 n U (X ) = −1+∏(K ⋅ ki ⋅U (X )i +1)
K i=1
� Capabilities of the MAUF � Determine the stakeholder aggregate utility value for a given set of single attribute utility values.
� Implications � Must have the MAUF in a explicit function form
� Assumptions (in addition to the 4 single attribute utility theory assumptions) � Preferential Independence: the ranking of preferences over any pair of attributes is independent of all the other attributes. � Utility Independence: The utility curve for one attribute is unique, and independent of all the other attribute utility functions.
9 Oct 2009 16
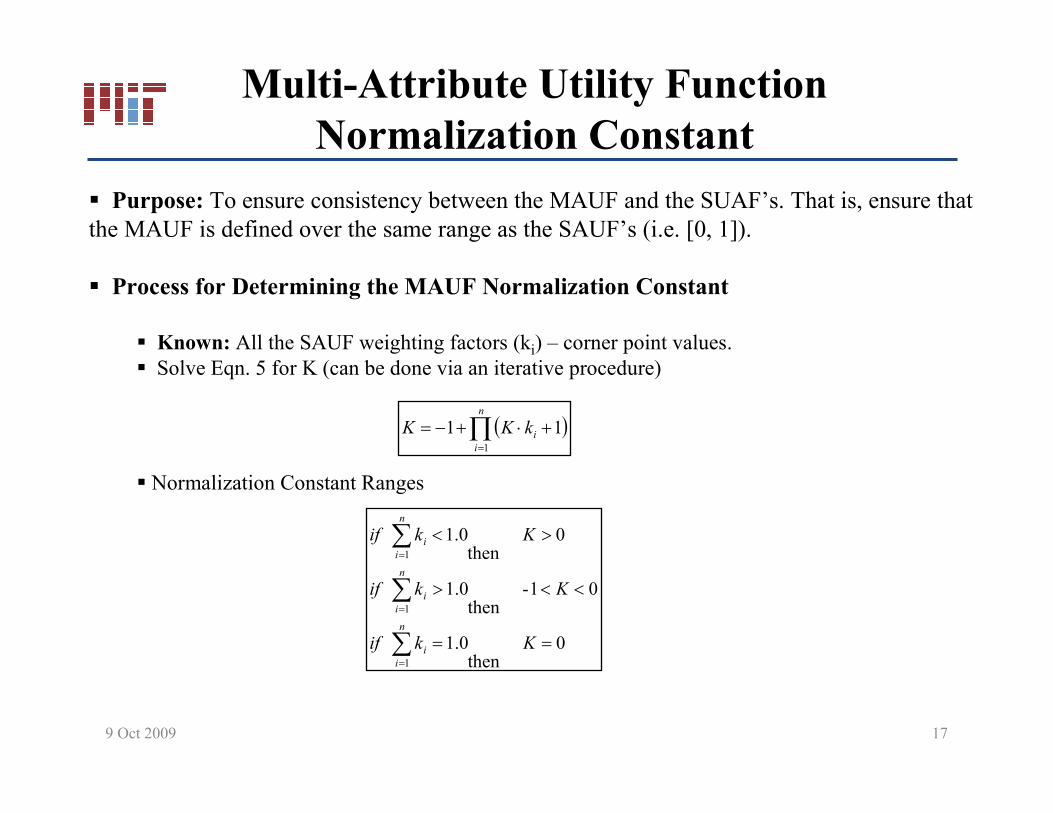
MultiAttribute Utility FunctionNormalization Constant
� Purpose: To ensure consistency between the MAUF and the SUAF’s. That is, ensure that the MAUF is defined over the same range as the SAUF’s (i.e. [0, 1]).
� Process for Determining the MAUF Normalization Constant
� Known: All the SAUF weighting factors (ki) – corner point values. � Solve Eqn. 5 for K (can be done via an iterative procedure)
( )∏ =
+⋅+−= n
i ikKK
1
11
� Normalization Constant Ranges
if ∑ n
ik < 1.0 Kthen
> 0=i 1
if ∑ n
ik > 1.0 < Kthen
1 < 0=i 1
if ∑ n
ik = 1.0 Kthen
= 0=i 1
9 Oct 2009 17

Index
1. Context of MATECON
2. Implementing MATECON1. MATE
2. CON
3. Alternatives
4. Benefits
5. Limitations
6. Discussion
9 Oct 2009 18
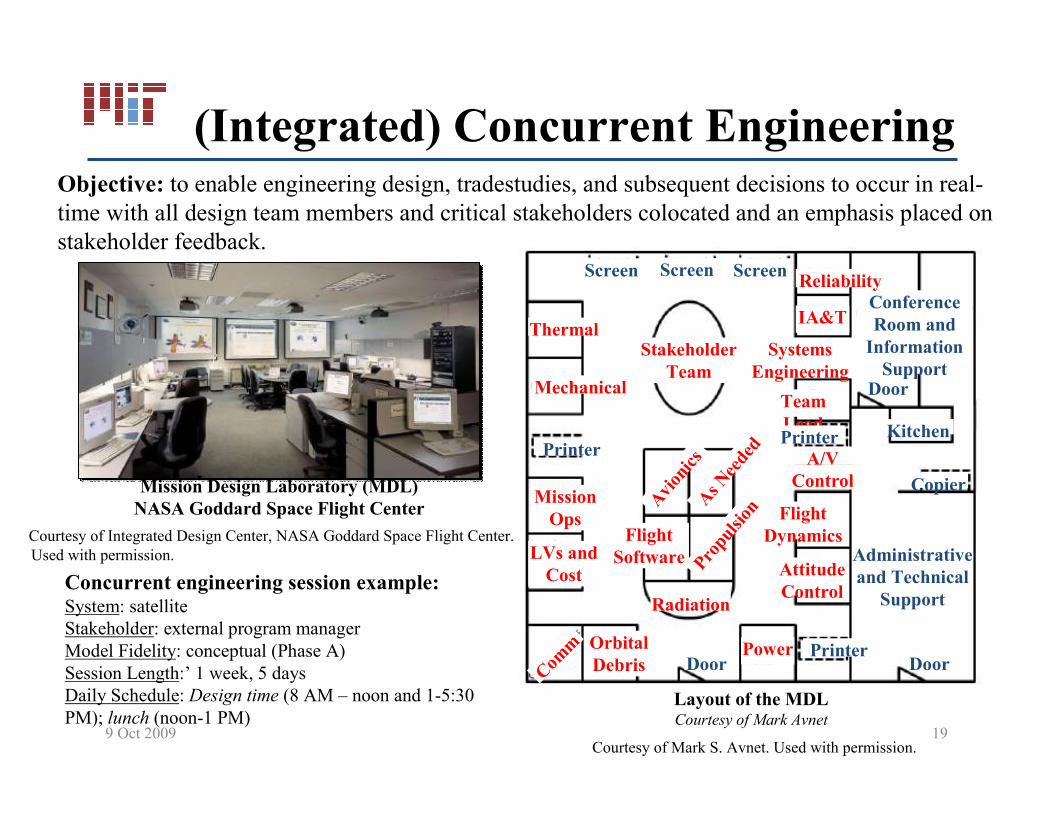
(Integrated) Concurrent Engineering Objective: to enable engineering design, tradestudies, and subsequent decisions to occur in realtime with all design team members and critical stakeholders colocated and an emphasis placed on stakeholder feedback.
Concurrent engineering session example: System: satelliteStakeholder: external program managerModel Fidelity: conceptual (Phase A)Session Length:’ 1 week, 5 daysDaily Schedule: Design time (8 AM – noon and 15:30PM); lunch (noon1 PM)
9 Oct 2009
Mission Design Laboratory (MDL) NASA Goddard Space Flight Center
Layout of the MDL Courtesy of Mark Avnet
Mission Ops
LVs and Cost
Com
m Orbital
Debris Door Door
Door
Administrative
and Technical Support
Copier
Kitchen
Conference
Room and Information Support
Stakeholder
Team
Printer
Thermal
Mechanical
Screen Screen Screen Reliability
IA&T
Systems Engineering
Team Lead Printer A/V
Control
Power Printer
Flight
Dynamics
Attitude
Control
Avionics
AsNeeded
Propulsion
Radiation
Flight
Software
19
Courtesy of Integrated Design Center, NASA Goddard Space Flight Center.Used with permission.
Courtesy of Mark S. Avnet. Used with permission.
Index
1. Context of MATECON
2. Implementing MATECON1. MATE
2. CON
3. Alternatives
4. Benefits
5. Limitations
6. Discussion
9 Oct 2009 20
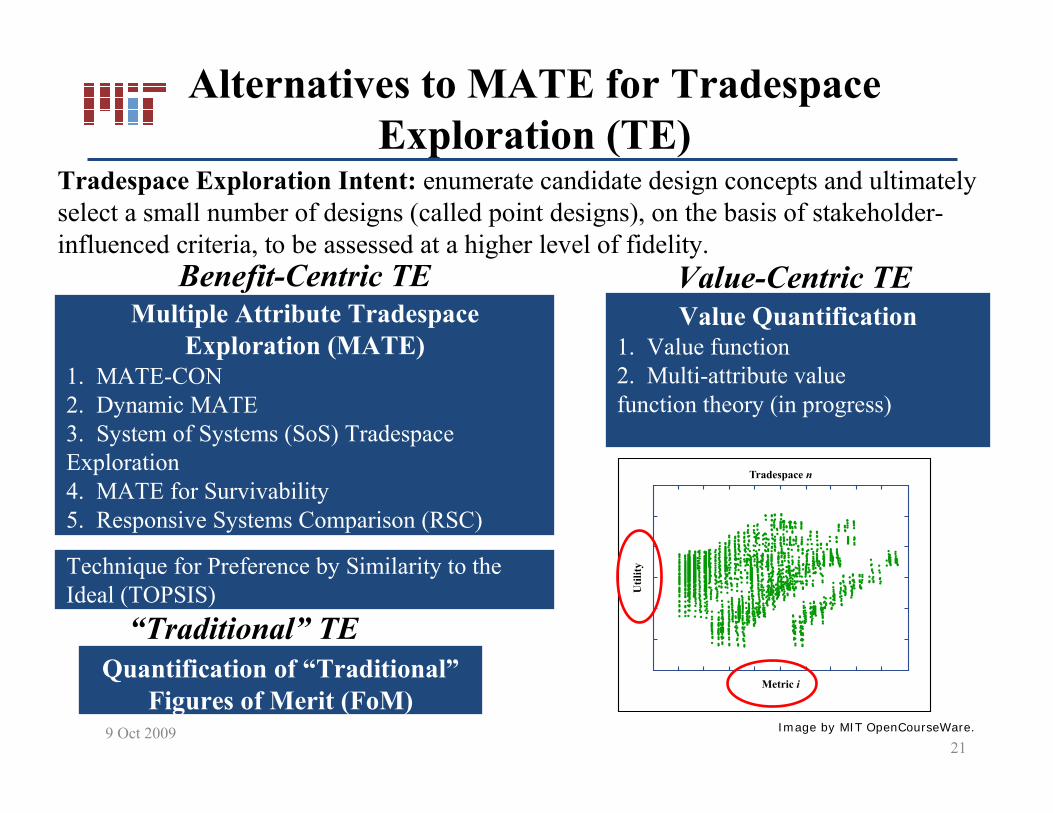
Alternatives to MATE for TradespaceExploration (TE)
Tradespace Exploration Intent: enumerate candidate design concepts and ultimately select a small number of designs (called point designs), on the basis of stakeholderinfluenced criteria, to be assessed at a higher level of fidelity.
BenefitCentric TE ValueCentric TE Multiple Attribute Tradespace
Exploration (MATE) 1. MATECON 2. Dynamic MATE 3. System of Systems (SoS) Tradespace Exploration 4. MATE for Survivability 5. Responsive Systems Comparison (RSC)
Technique for Preference by Similarity to the Ideal (TOPSIS)
“Traditional” TEQuantification of “Traditional”
Figures of Merit (FoM)
Value Quantification 1. Value function 2. Multiattribute value function theory (in progress)
219 Oct 2009
Metric i
Tradespace n
Util
ity
Image by MIT OpenCourseWare.

Index
1. Context of MATECON
2. Implementing MATECON1. MATE
2. CON
3. Alternatives
4. Benefits
5. Limitations
6. Discussion
9 Oct 2009 22
Benefits
�Forced design decisions’ changes, during the design phase, can be guided using the knowledge of the larger tradespace. Their impact is thus reduced.
�By calculating utility gradients, counterintuitive design decisions are revealed.
�Almost full automatization reduces impact of changing stakeholder expectations.
9 Oct 2009 23
Benefits
�Propagating the utility metric down through the Design levels prevents pursuing a detailed design without understanding its global effects.
�Proved less time and effort for a given project, and other benefits. � But the reference is to a conference paper by the author.
9 Oct 2009 24
Index
1. Context of MATECON
2. Implementing MATECON1. MATE
2. CON
3. Alternatives
4. Benefits
5. Limitations
6. Discussion
9 Oct 2009 25
Limitations
�Very different concepts are a challenge to model in 1 vector.
9 Oct 2009 26
Computer generated images of space vehicles removed due to copyright restrictions.
Limitations
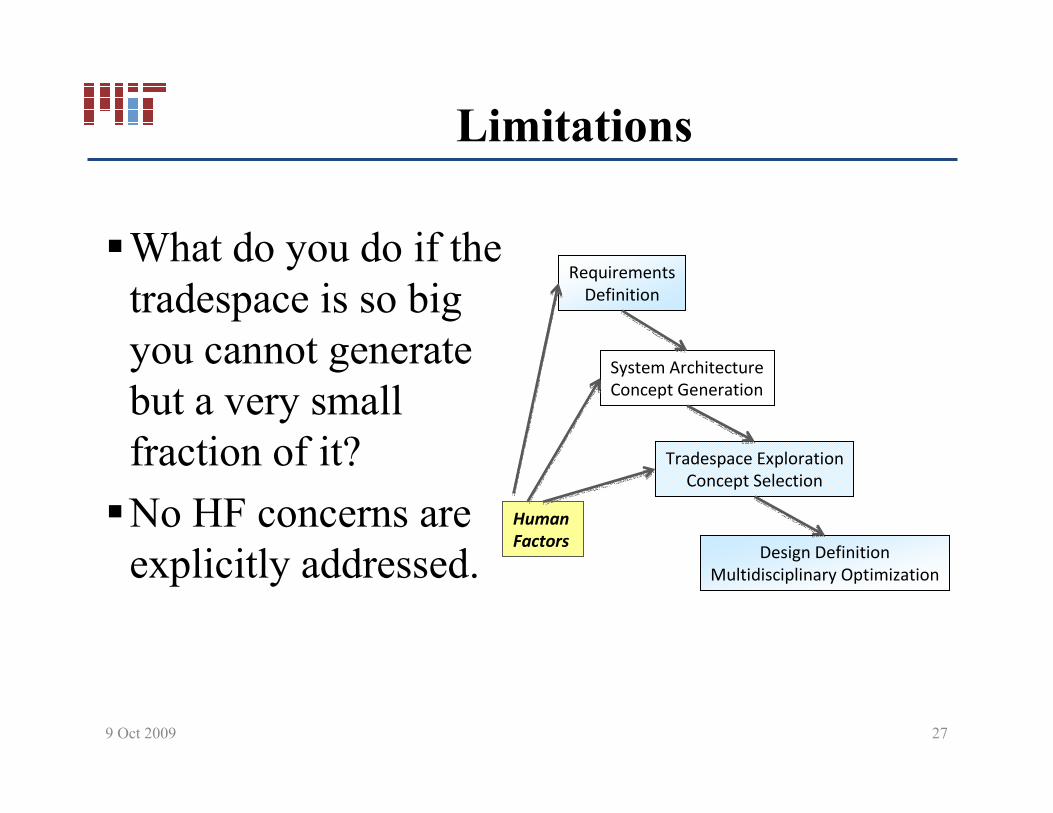
�What do you do if the tradespace is so big you cannot generate but a very small fraction of it?
�No HF concerns are explicitly addressed.
System Architecture
Concept Generation
Tradespace Exploration
Concept Selection
Design Definition
Multidisciplinary Optimization
Human
Factors
Requirements
Definition
9 Oct 2009 27
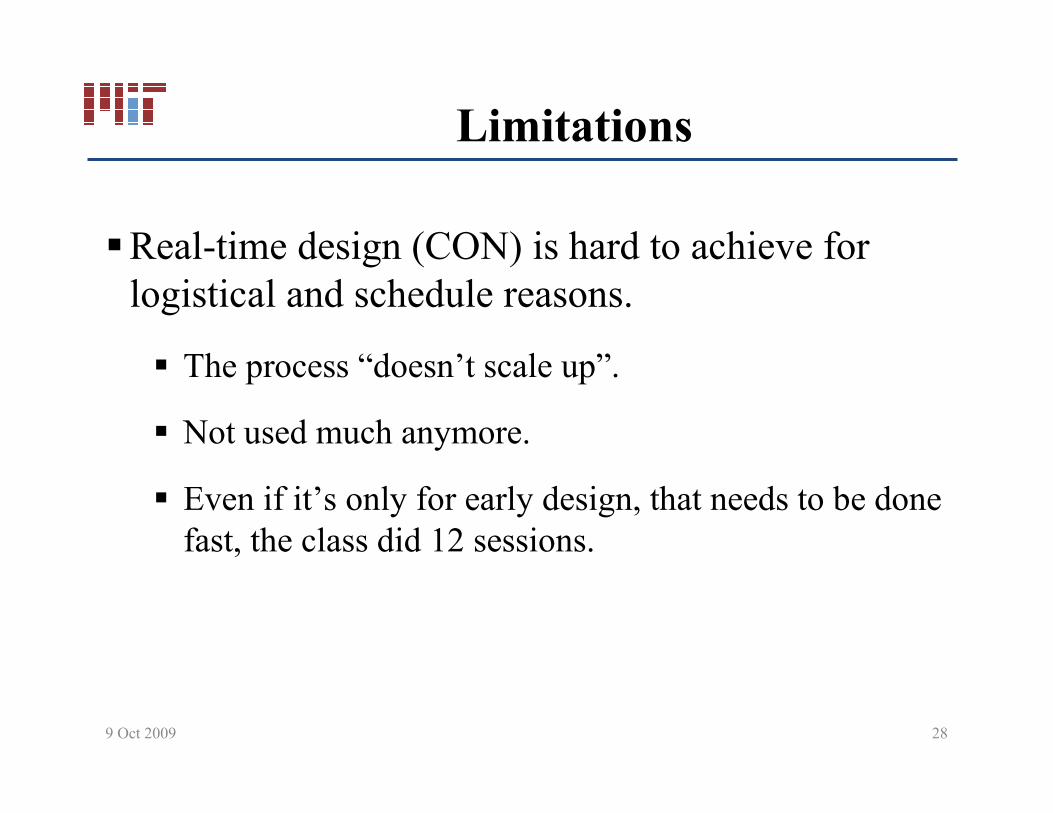
Limitations
�Realtime design (CON) is hard to achieve for logistical and schedule reasons.
� The process “doesn’t scale up”.
� Not used much anymore.
� Even if it’s only for early design, that needs to be done fast, the class did 12 sessions.
9 Oct 2009 28
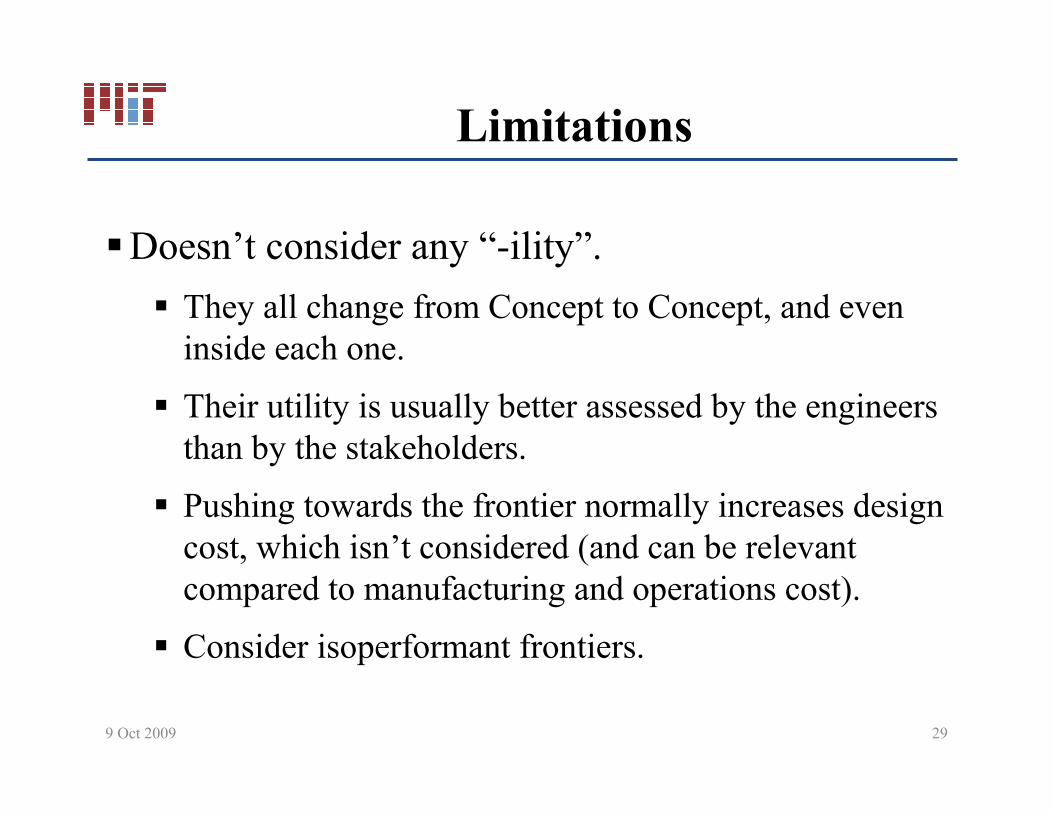
Limitations
�Doesn’t consider any “ility”.
� They all change from Concept to Concept, and even inside each one.
� Their utility is usually better assessed by the engineers than by the stakeholders.
� Pushing towards the frontier normally increases design cost, which isn’t considered (and can be relevant compared to manufacturing and operations cost).
� Consider isoperformant frontiers.
9 Oct 2009 29
Index
1. Context of MATECON
2. Implementing MATECON1. MATE
2. CON
3. Alternatives
4. Benefits
5. Limitations
6. Discussion
9 Oct 2009 30
Discussion Questions
� Considering the architecturelevel analysis and the designlevel analysis that incorporate MAUT and ICEMaker, at what point do you freeze the design and move forward?
� For tradespace exploration, do you think employing the metric of utility is a viable alternative to “more traditional” metrics, given the inherent advantages (e.g., aggregation of benefit) and disadvantages (e.g., ordinal nature) of utility?
9 Oct 2009 31
Discussion Questions
� Stakeholders networks (utility flow) can be easily incorporated into the methodology.
� What is MIT’s Generalized Information Network Analysis (GINA) method (that provided advances in modeling tradespaces)?
� What is Quality Function Deployment (QFD), which is used to organize and prioritize suggested variables?
� What is SMAD’s Small Satellite Cost Model?
9 Oct 2009 32

MIT OpenCourseWarehttp://ocw.mit.edu
16.842 Fundamentals of Systems Engineering Fall 2009
For information about citing these materials or our Terms of Use, visit: http://ocw.mit.edu/terms.