Embed Size (px)
Citation preview
9
NEW PRODUCT DEVELOPMENT

THE NEED FOR INNOVATION *WITH PRODUCTS AND / OR SERVICES
• IMPROVE THE ENTITY’S POSITION
• FULFILL CONSUMER NEEDS AND WANTS
• REINVIGORATE OF THE CORPORATION BY EXPANDING THE ENTREPRENEURIAL SPIRIT.
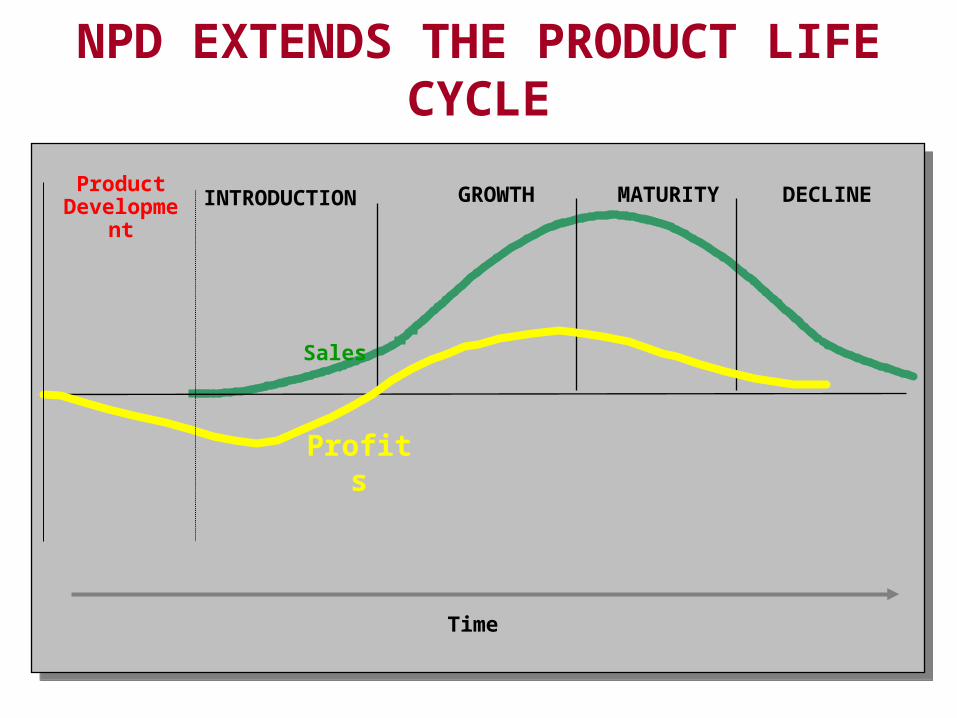
NPD EXTENDS THE PRODUCT LIFE CYCLE
Time
ProductDevelopment INTRODUCTION
Sales
GROWTH MATURITY DECLINE
Profits

THE VARIATION OF PRODUCTSLO1
BRAND
PRODUCT FAMILY 1
PRODUCT FAMILY 2
PRODUCT LINE 1
PRODUCT LINE 2
PRODUCT LINE 3
PRODUCTS 1 TO n
Brand Product family Product line Product

THE VARIATION OF PRODUCTSCLASSIFYING PRODUCTS
LO1
Type of User [B2C or B2B]
10-5
Degree of Tangibility Nondurable goods Durable goods Services

CLASSIFYING CONSUMER GOODS[Review]
LO2
Shopping Products
> Considerable selection time & effort> Moderately brand loyal> Comparison shop> Few locations
Clothing, appliances, services
Convenience Products
> Frequently purchased> Little effort> Low priced> Numerous locations
Staples, impulse items
Specialty Products
> Unique characteristics> Significant purchase efforts> Brand – limited locations
Big Bertha golf club, Rolex
Unsought Products
> Little awareness or interest until need > Require much advertising & personal selling
Insurance, some innovations
Emergency Products> Unexpected need> Speed with little to no brand loyalty
Emergency room, ambulance, towing
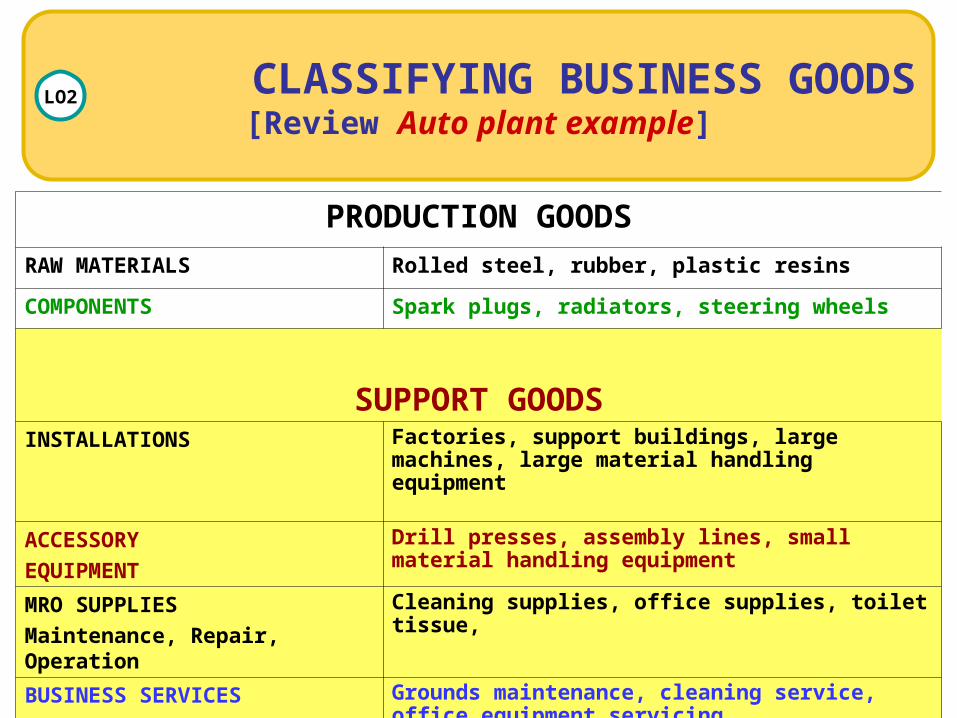
CLASSIFYING BUSINESS GOODS[Review Auto plant example]
LO2
PRODUCTION GOODSRAW MATERIALS Rolled steel, rubber, plastic resins
COMPONENTS Spark plugs, radiators, steering wheels
SUPPORT GOODSINSTALLATIONS Factories, support buildings, large machines, large
material handling equipment
ACCESSORY
EQUIPMENT
Drill presses, assembly lines, small material handling equipment
MRO SUPPLIES
Maintenance, Repair, Operation
Cleaning supplies, office supplies, toilet tissue,
BUSINESS SERVICES Grounds maintenance, cleaning service, office equipment servicing

3. MarketDevelopment
Newmarkets
1. MarketPenetration / Saturation
Existingmarkets
Existingproducts
2. ProductDevelopment
Newproducts
ANSOFF’S PRODUCT / MARKETEXPANSION GRID

HOW DO FIRMS LOOK AT NEW PRODUCTS?
LO3
Newness Compared to Existing Products
Newness in Legal Terms
Newness From the Organization’s Perspective Product line extension or Innovation
Newness in Consumer’s Perspective Continuous to discontinuous

WHAT ARE THE TYPES OF NEW PRODUCTS?
LO3
• New
• New
• New
• Improved or revised product
• Repositioned products
• Lower-priced alternative – Multi-brand strategy

Creating project plans to focus product development, Harvard Business Review, March-April, 1992, Vol. 70, No. 2, p.74.
MORE -------------------------------------------- LESS
P
R
O
C
E
S
S
C
H
A
N
G
E
PRODUCT CHANGE
SIZE CHANGE
INCREMENTAL CHANGE
APPLE iMAC:
PLASTIC COLORATION
SINGLE DEPARTMENT
UPGRADE
NEXT GENERATION PROCESS
R&D JOINT VENTURE
NEW FAMILY OF DRUGS
NEW CORE PROCESS
DERIVATIVES AND EXTENSIONS
ADDITION TO PRODUCT FAMILY
NEXT GENERATION PRODUCT
NEW CORE PRODUCT
R&D ADVANCED DEVELOPMENT
PROJECTSGENETIC ENGINEERING
ALLIANCES AND PARTNERSHIP
PROJECTS
FIVE TYPES OF DEVELOPMENT PROJECTS

WHY DO NEW PRODUCTS FAIL?INC. Magazine, March, 1999
LO4
10-12
• • • INADEQUATE MARKET RESEARCH / PRODUCT TESTING ANALYSIS• POOR TIMIMG• LACK OF CAPACITY• LACK OF ADEQUATE DISTRIBUTION• LACK OF TRAINING• POOR EXECUTION OF THE MARKETING MIX
• especially lack of promotion•

WHY DO NEW PRODUCTS SUCCEED?LO4
10-13
• CUSTOMER ORIENTATION• Product is 1-compatible and 2-not too complex
• BUSINESS ACUMEN
• LEADERSHIP [NPD champion / management]
• RESULTS ORIENTATION
• Product is easy to 1-try or observe and 2-see the benefits … some examples?

NEW PRODUCT DEVELOPMENT ISSUES
•
• ORGANIZATION
• FRAGMENTED MARKETS
•
• CAPITAL REQUIREMENTS
• SHORTER PRODUCT LIFE CYCLES

THE NEW-PRODUCT PROCESSNEW-PRODUCT STRATEGY DEVELOPMENT
LO5
New-Product Process
• SWOT Analysis
New-Product Strategy Development
Objectives: Identify Markets and Strategic Roles
• Environmental Scanning
Improve Innovation: Use Cross-Functional Teams
10-15

THE NEW-PRODUCT PROCESSIDEA GENERATION
LO5
10-16
COMPANY OUT …
CUSTOMERS AND PROSPECTS IN …
Understand

THE NEW-PRODUCT PROCESSIDEA GENERATION
LO5
10-17
• CUSTOMERS / PROSPECTS / EMPLOYEES / R&D• SUPPLIERS• COMPETITIVE PRODUCTS• UNDERSTANDING TRENDS / ISSUES / …
• Demographics• Problems• Competition• Market research• Technology / R&D breakthrough

METHODS OF IDEA GENERATION
• BRAINSTORMING
• CATALOG TECHNIQUE
• FREE ASSOCIATION
• ATTRIBUTE LISTING
• THINKING OUT OF THE BOX
• Techniques for creative thinking– http://members.optusnet.com.au/~charles57/Creative/Techniques/
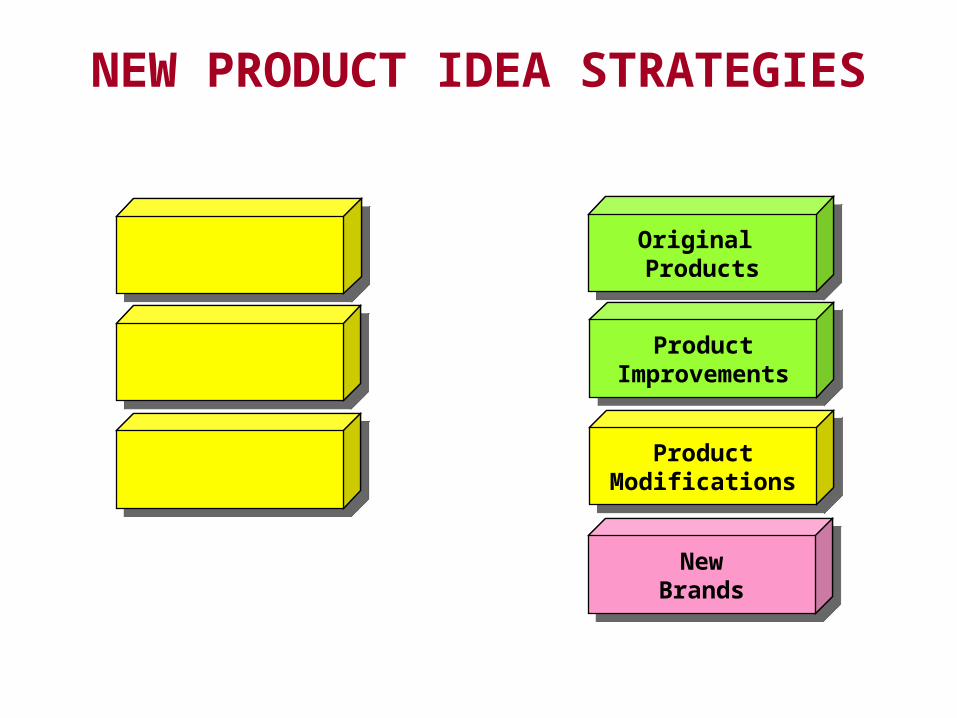
NEW PRODUCT IDEA STRATEGIES
Original Products
Original Products
ProductImprovements
ProductImprovements
ProductModifications
ProductModifications
NewBrands
NewBrands

KEY NPD DECISIONS
• ENTREPRENEURSHIP CHALLENGE
• DISCIPLINE MEANS PROCESS– Manufacturing feasibility– Government approvals [if necessary]
•
• RISK / REWARD POTENTIAL
• TIME-TO-MARKET
•

NEW PRODUCT DEVELOPMENT CYCLE
IdeaGeneration
ConceptDevelopmentand Testing
MarketingStrategy
Development
IdeaScreening
BusinessAnalysis
ProductDevelopment
MarketTesting
Commercialization
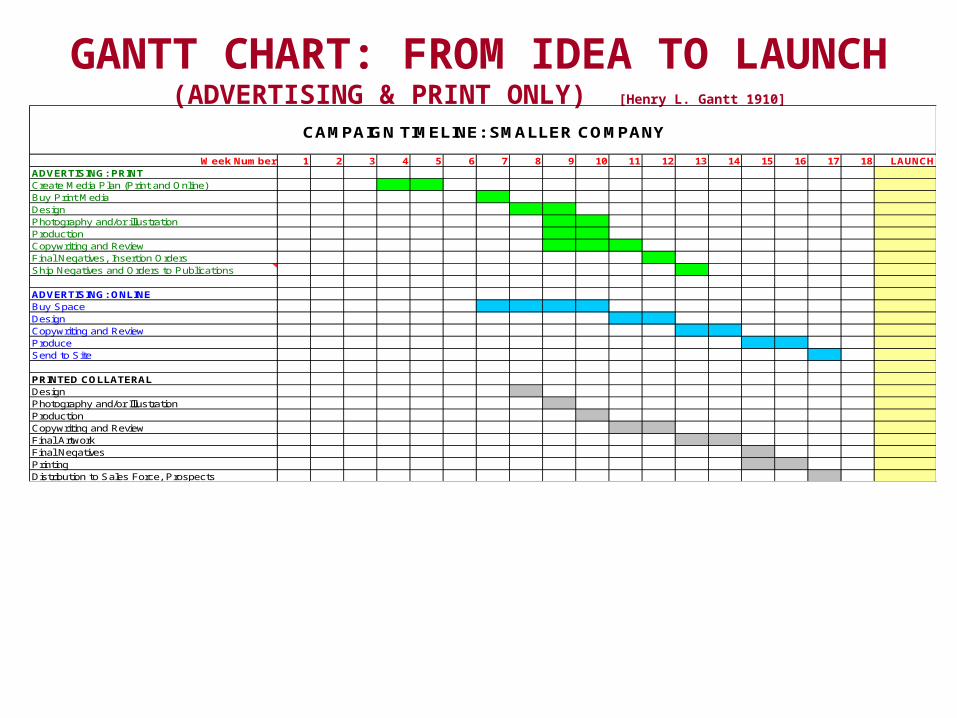
GANTT CHART: FROM IDEA TO LAUNCH(ADVERTISING & PRINT ONLY) [Henry L. Gantt 1910]
Week Number 1 2 3 4 5 6 7 8 9 10 11 12 13 14 15 16 17 18 LAUNCHADVERTISING: PRINTCreate Media Plan (Print and Online)Buy Print MediaDesignPhotography and/or illustrationProductionCopywriting and ReviewFinal Negatives, Insertion OrdersShip Negatives and Orders to Publications
ADVERTISING: ONLINEBuy SpaceDesignCopywriting and ReviewProduce Send to Site
PRINTED COLLATERALDesignPhotography and/or IllustrationProductionCopywriting and ReviewFinal ArtworkFinal NegativesPrinting Distribution to Sales Force, Prospects
CAMPAIGN TIMELINE: SMALLER COMPANY
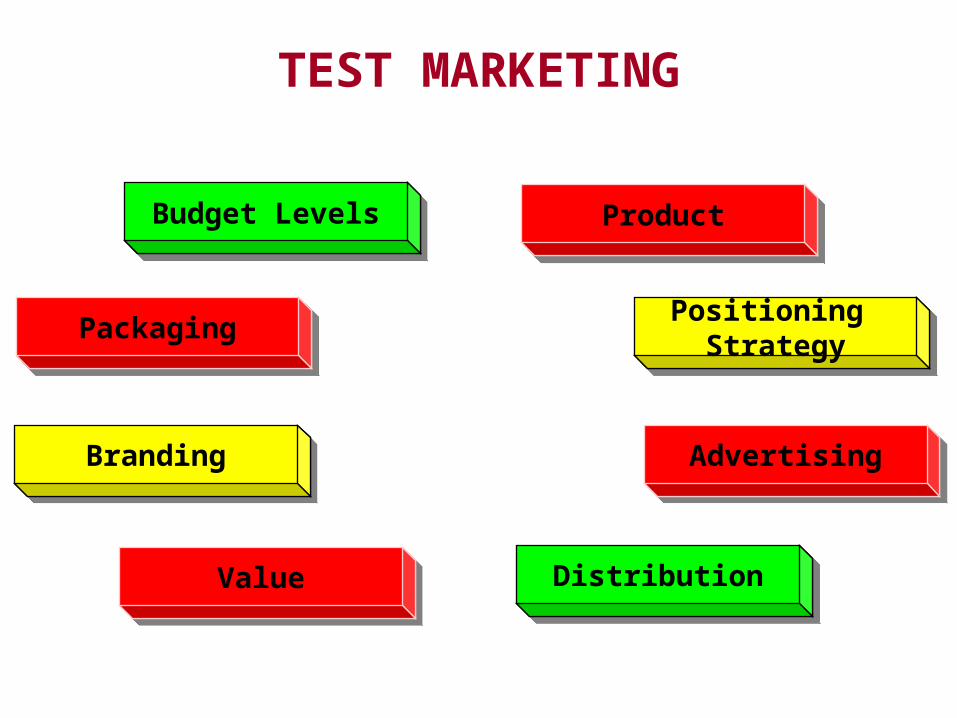
TEST MARKETING
AdvertisingAdvertising
PackagingPackaging
ProductProductBudget LevelsBudget Levels
Positioning Strategy
Positioning Strategy
DistributionDistributionValueValue
BrandingBranding
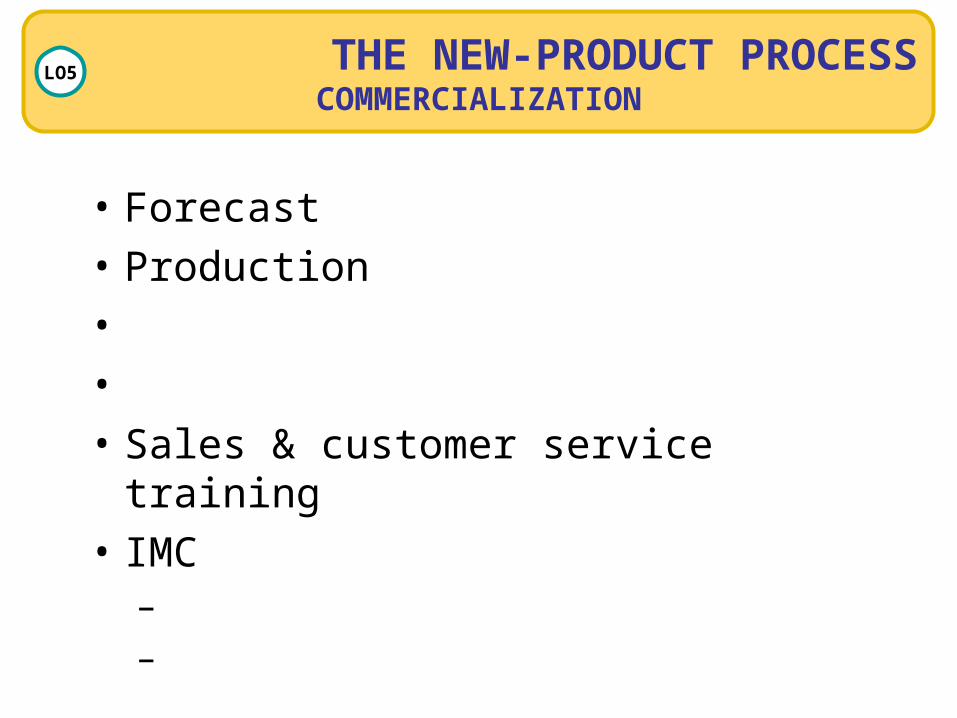
THE NEW-PRODUCT PROCESSCOMMERCIALIZATION
LO5
• Forecast
• Production
•
•
• Sales & customer service training
• IMC– –
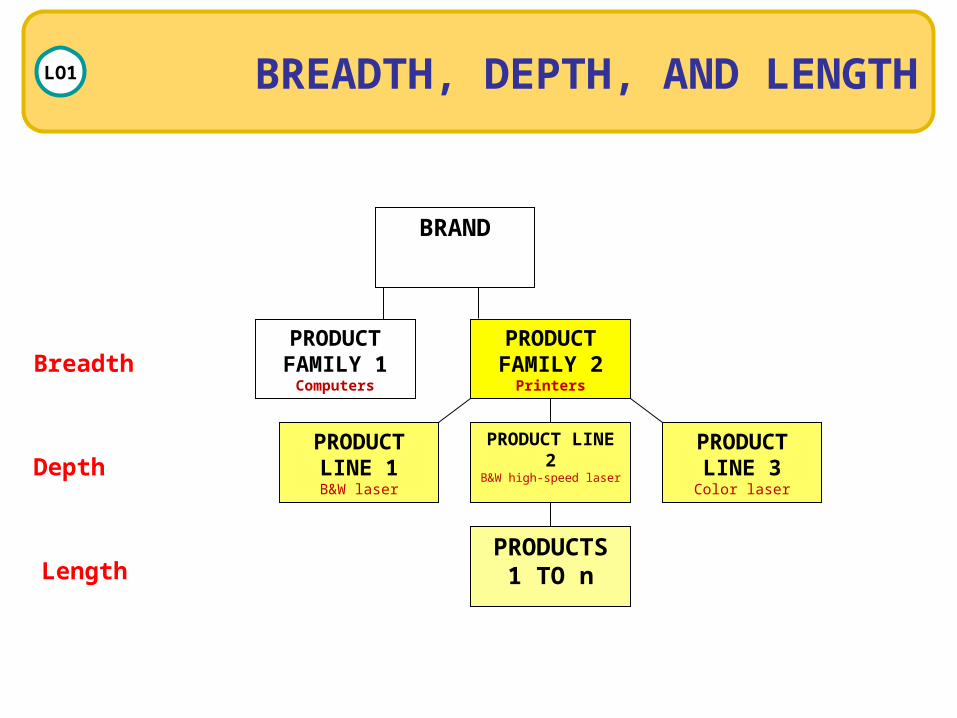
BREADTH, DEPTH, AND LENGTHLO1
BRAND
PRODUCT FAMILY 1
Computers
PRODUCT FAMILY 2
Printers
PRODUCT LINE 1B&W laser
PRODUCT LINE 2
B&W high-speed laser
PRODUCT LINE 3Color laser
PRODUCTS 1 TO n
Breadth
Depth
Length

PRODUCT LINE PLANNING
Product Line ExtensionsProduct Line ExtensionsProduct Line ExtensionsProduct Line Extensions
Stretching
Adding new items to line
Filling
Adding sizes or styles
Upward Danger of Cannibalization
Danger of Cannibalization
Contracting aProduct Line
Dropping items
Contracting aProduct Line
Dropping items
Two-way[Up and down]
Two-way[Up and down]
DownwardDownward

10
PRODUCT LIFE CYCLE
AND
BRAND MANAGEMENT

THE PRODUCT LIFE CYCLE OVERVIEW
TIME
Manage the Marketing Mix (4P’s)
DeclineMaturityIntroduction Growth
SALES

THE PRODUCT LIFE CYCLE
Time
Profits
In product development, an idea is vetted and eventually a decision is made to launch the product if its net present value is acceptable.
• Significant expense in• product development,• • • training of sales and customer services.
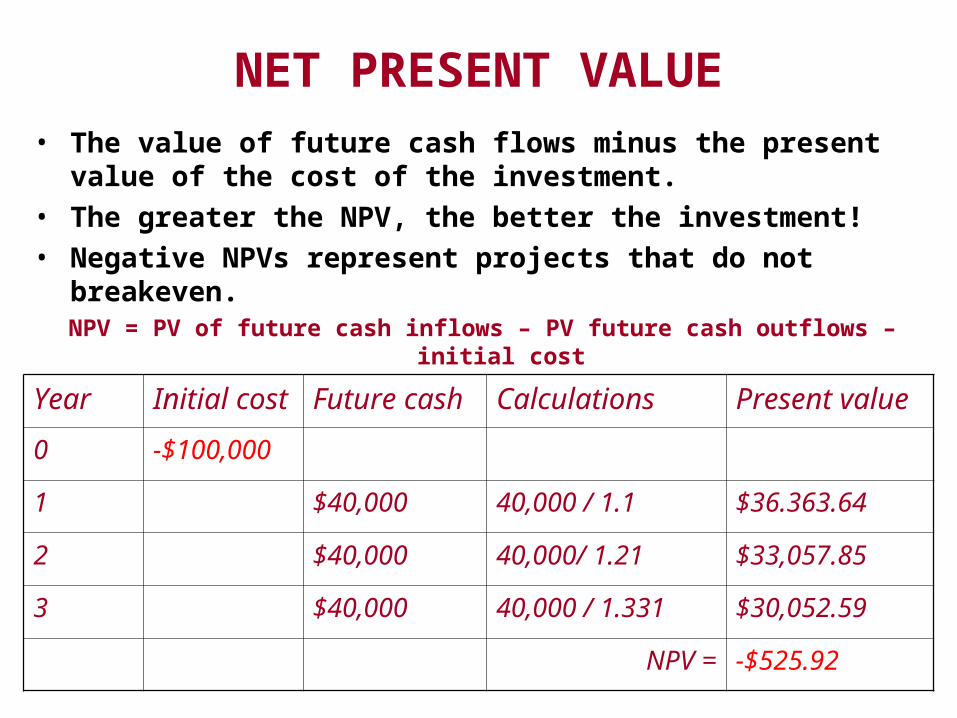
NET PRESENT VALUE
Year Initial cost Future cash Calculations Present value
0 -$100,000
1 $40,000 40,000 / 1.1 $36.363.64
2 $40,000 40,000/ 1.21 $33,057.85
3 $40,000 40,000 / 1.331 $30,052.59
NPV = -$525.92
• The value of future cash flows minus the present value of the cost of the investment.
• The greater the NPV, the better the investment!• Negative NPVs represent projects that do not
breakeven.NPV = PV of future cash inflows – PV future cash outflows – initial cost
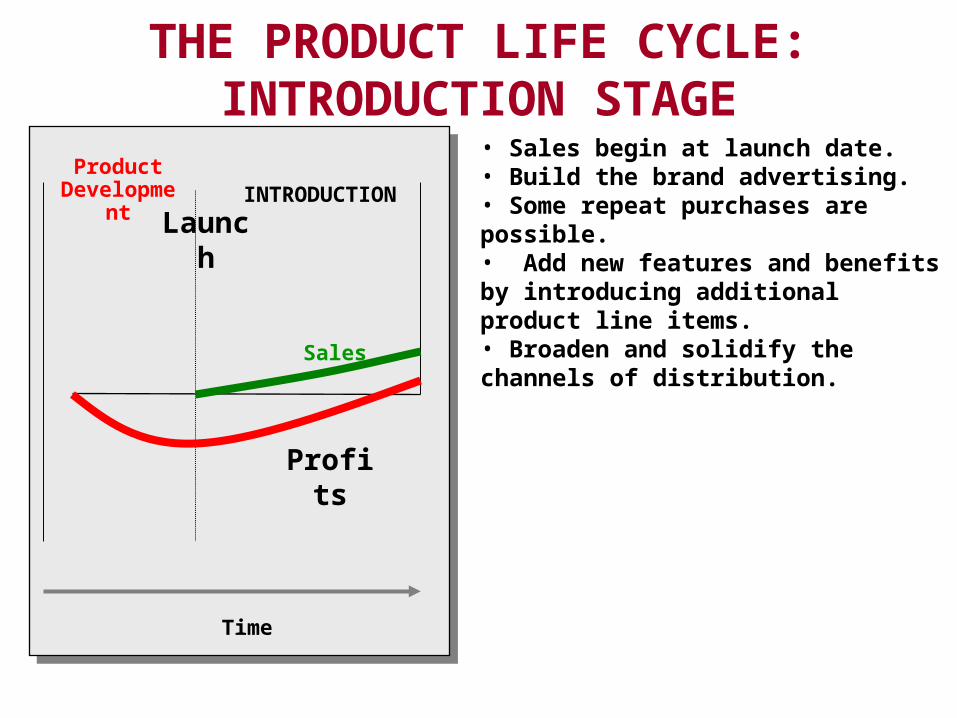
THE PRODUCT LIFE CYCLE:INTRODUCTION STAGE
Time
ProductDevelopment
Profits
INTRODUCTION
Sales
Launch
• Sales begin at launch date.• Build the brand advertising. • Some repeat purchases are possible.• Add new features and benefits by introducing additional product line items.• Broaden and solidify the channels of distribution.
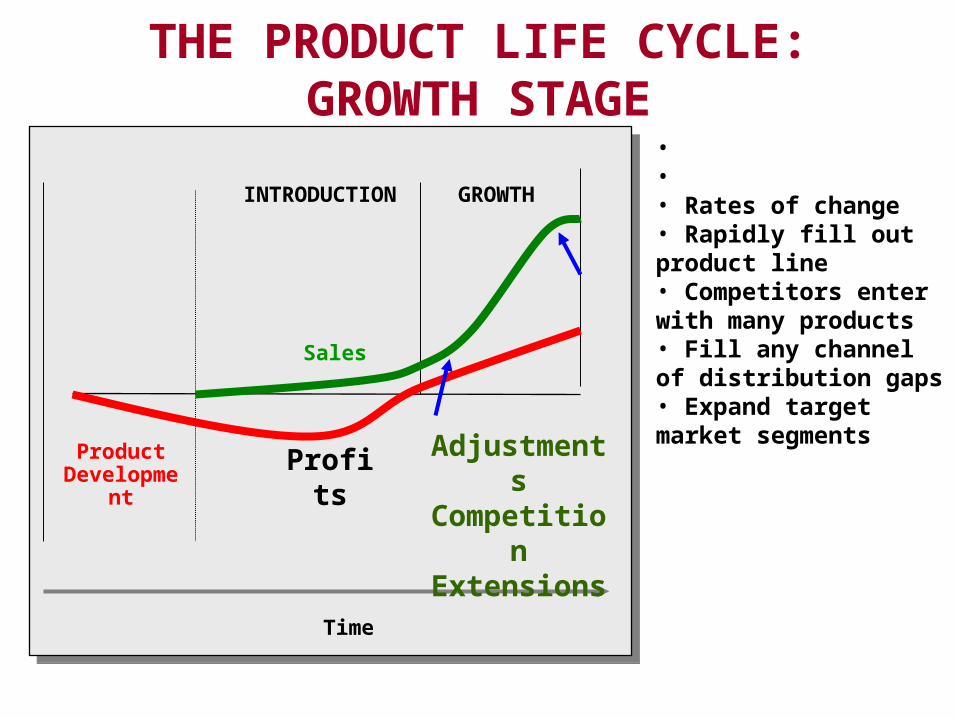
THE PRODUCT LIFE CYCLE:GROWTH STAGE
Time
ProductDevelopment Profits
INTRODUCTION
Sales
GROWTH
AdjustmentsCompetitionExtensions
• • • Rates of change• Rapidly fill out product line• Competitors enter with many products• Fill any channel of distribution gaps• Expand target market segments

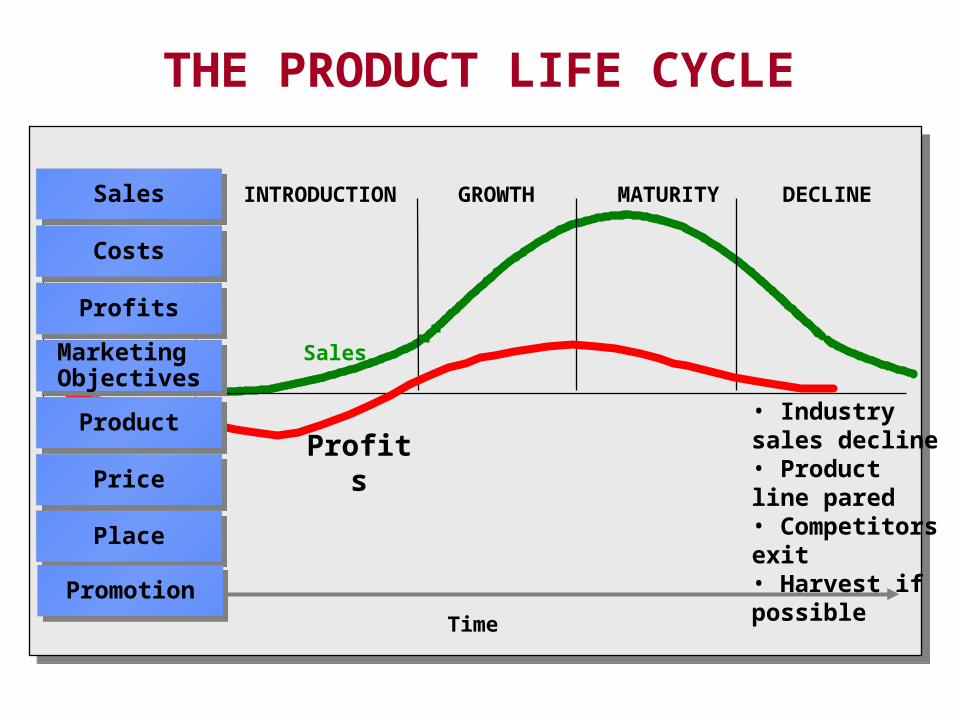
THE PRODUCT LIFE CYCLE
Time
ProductDevelopment
INTRODUCTION
Sales
GROWTH MATURITY DECLINESalesSales
CostsCosts
ProfitsProfits
MarketingObjectivesMarketingObjectives
ProductProduct
PricePrice
PlacePlace
PromotionPromotion

THE PRODUCT LIFE CYCLE:MATURITY STAGE
Time
ProductDevelopment Profits
INTRODUCTION
Sales
GROWTH MATURITY
• Competition is at a maximum• Industry sales level off• Intense price and promotion competition• Product lines begin to be pared• NPD slows to a halt
THE PRODUCT LIFE CYCLE
Time
ProductDevelopment
INTRODUCTION
Sales
GROWTH MATURITY DECLINE
Profits
SalesSales
CostsCosts
ProfitsProfits
MarketingObjectivesMarketingObjectives
ProductProduct
PricePrice
PlacePlace
PromotionPromotion
• Industry sales decline• Product line pared• Competitors exit• Harvest if possible

PLC – MATURITY STAGEDEFENSE STRATGIES AND OPTIONS
Market Market ModificationModification
Market Market ModificationModification Product Product
ModificationModificationProduct Product
ModificationModification
MarketingMarketingMixMix
ModificationModification
MarketingMarketingMixMix
ModificationModification
DIVESTDIVEST
DISCONTINUEDISCONTINUE

PRODUCT LIFE CYCLE:LENGTH & SHAPE OF THE PRODUCT LIFE CYCLE
AFAD PRODUCTSMETRECALFROZEN YOGURT
CMEXICAN FOODTOFUWHOLE GRAIN BREADS
BINSTANT TEASFROZEN JUICE BARSCAKE MIXES
Name some new applications for peanut butter.
Produce life cycles [PLC] can come in many different shapes. That is because
1. markets and market segments have different growth rates and projections,
2. some products have shorter or longer life cycles,
3. NPD which can extend life cycles, and,4. International market entry can extend
product life cycles.

THE PRODUCT LIFE CYCLEB2C ADOPTION [DIFFUSION] OF INNOVATIONS
LO1
TIME ON THE MARKET
34%Late
Majority
2 1/2%Innovators 13 1/2%
EarlyAdopters
34%Early
Majority
16%Laggards
FACTORS
Complexity
Compatibility
Relative advantage
Observability
Trialability
Communicable – easily understood or observed; not too complex
Divisible – usable on a trial basis?
Relative Advantage – perceived superiority [value] to other offerings

THE PRODUCT LIFE CYCLEDIMENSIONS
LO1
The Life Cycle and Consumers
• Barriers to New Product Adoption
Psychological benefits / risks

MANAGING THE PRODUCT LIFE CYCLEMODIFYING THE PRODUCT OR MARKET
LO2
Product Modification
• Product modifications• Product line extensions
Market Modification
• Define new / additional segments• Finding new customers• Finding new applications / product line
extensions
MANAGING THE PRODUCT LIFE CYCLEPOSITIONING THE PRODUCT
LO2
Product positioning or repositioning
Positioning in a new market
Reacting to a competitor’s position
11-41

A BRAND IS A
NAME, TERM, SYMBOL, or ANY OTHER
UNIQUE ELEMENT of a Product that Identifies
One Firms’ Product(s) and Differentiates Them
From the Competition
What are the brands of pens in class today?
How old are brands?

HOW OLD ARE BRANDS?
• Lowenbrau 1383
• Bass Ale 1777
• Baker’s Chocolate 1789
• Ivory Soap 1879
• Coca-Cola 1886
• Lipton Tea 1889
Lufthansa, Nike Air Jordan videos

What brand would you not miss if it went away?
What brand would really change your life if it went away?
Interbrand http://www.interbrand.com/
BRANDING AND BRAND MANAGEMENTLO3

THE STRATEGIC BRAND MANAGEMENT PROCESS
• IDENTIFY AND ESTABLISH BRAND POSITIONING AND VALUES– How do consumers perceive brands?
• Involvement• Reducing perceived risk• Familiar = trusted• Brand A > Brand B [B2C]
– Is this a perception of quality?– Or is it needs satisfaction?
• Perceived benefits [B2C]• Actual benefits [B2C but major in B2B]• Ego / self-actualization [B2C but very minor in B2B]

THE STRATEGIC BRAND MANAGEMENT PROCESS
• FUNCTIONS OF A BRAND– Identify [packaging]
• Easily recognized by sight, sound, or other means
– Practical [successful experience]• Save time with repeat purchases
– Guarantee [warranty; standards compliance]• Consistency of performance or quality
– Optimization for the consumer [experience, advertising]• The best solution for their need – minimal cognitive dissonance
– Continuity [lifetime value of a customer]• Long-term relationship
– Hedonistic [advertising, image, recognition] • Ego satisfaction
Branding
Brand Name
• Logo
BRANDING AND BRAND MANAGEMENTLO3
Trade Name a commercial, legal name under which a company
does business
Trademark ® ™
11-47
WHAT DOES BRANDING DO?
• – Sets us apart in many different ways
• – Image for immediate recognition
• – Perception allows the customer or prospect to
form their own sense of value.
WHAT DOES BRANDING DO?
• Facilitates product line expansion– It is easier to sell new products under an existing
brand name!
• Encourages repeat purchases– Brand recall and brand satisfaction lead to
additional sales at a much lower cost of sales.
• Aligns with market segmentation– The brand must meaningfully relate to your market
segments.

HOW ARE BRANDS USED?
• Create – Google, Yahoo, …
• Reposition your brand – Dangerous– Expensive– Uncertain results
• Rejuvenate a brand – New Coke … Coke Classic

BRAND CONSIDERATIONS
Attributes Benefits Values
Culture
User
Personality*

BRAND ISSUES
Advantagesof
Brand Names
BrandEquity
Advantagesof
Brand Names
BrandEquity LoyaltyLoyalty
AttributesAttributes
Perceived Quality& Value
Perceived Quality& ValueConsistencyConsistency
IdentificationIdentification
AwarenessAwarenessCredibilityCredibility
Defense AgainstCompetition
Defense AgainstCompetition
EVERYTHING YOU DO WITH A BRAND MUST ADD TO SUSTAINABLE COMPETITIVE ADVANTAGE!

BRAND DECISIONS
BrandSelectionDecision
•Brand
•No brand
Brand-SponsorDecision
•Manu-facturerbrand
•Distribu-tor(private)brand
•Licensedbrand
Brand-Name
Decision•Individualbrandnames•Blanketfamilyname•Separatefamilynames•Company-individualnames
Brand-Repositioning
Decision
•Reposi-tioning
•Noreposi-tioning
Brand-StrategyDecision•Lineextension
•Brandextension
•Multi-brands
•Newbrands
•Cobrands
Should all products be branded?

BRAND IDENTITY *
• Association Bill Cosby Jello
• Character Pink Panther Owens Insulation
• Animal Bull Merrill Lynch
• Image “You’re in good hands with Allstate”

BRAND IDENTITY: COKE & McDONALD’s AROUND THE GLOBE

BRAND LOYALTY
No Brand Loyalty(customer will change)
No Brand Loyalty(customer will change)
Satisfied Customer(no reason to change)Satisfied Customer
(no reason to change)
Satisfied & Switching CostSatisfied & Switching Cost
Values the Brand(brand as friend)
Values the Brand(brand as friend) 2 - Brand
Preference
Devoted to Brand
Devoted to Brand
3 - Brand Insistence
1 - Brand Awareness

CUSTOMER-BASED BRAND EQUITY PYRAMID
RESONANCE
SALIENCEProjecting the brand
JUDGMENTS FEELINGS
PERFORMANCE IMAGERY
4. RELATIONSHIPS4. RELATIONSHIPS
3. RESPONSE3. RESPONSE
2. MEANING2. MEANING
1. IDENTITY1. IDENTITY
BRANDING AND BRAND MANAGEMENTBRAND PERSONALITY
LO3
11-58
is a set of human characteristics that consumers associate with a brand name.
If product X was your friend,WHAT KIND OF CONVERSATION WOULD
YOU HAVE WITH IT?

BRAND PERSONALITY
Brand Personality
RuggednessSophisticationCompetenceExcitementSincerity
•Hallmark•Coke
•Pepsi •HP•Wall Street Journal
•BMW•Lexus•Grey Poupon
•Nike•Wells Fargo
Grey Poupon, Canadian Brand Passion videos

BRANDING AND BRAND MANAGEMENTBRAND EQUITY
LO3
11-60
"The secret to our enduring brand lies in delivering an experience rather than just a
collection of products and services."
- Harley-Davidson Annual Report, 2003

BRAND EQUITY
The price premium a purchaser will pay versus the competitors.
The perceived value of owning the brand – an off-balance sheet number.
PMI – Kraft Foods $12.9B 600% of book
KKR – RJR Nabisco $ 5.8B 550% of book

BRAND EQUITYFINANCIAL FORMULAS
PROJECTION
YEAR 1 YEAR 2 YEAR 3 YEAR 4 YEAR 5
NET SALES 15,225,305 110,654,231 187,149,914 225,687,518 286,405,622
AFTER-TAX INCOME -4,598,715 20,869,507 36,399,557 44,386,498 61,588,823
PLUS: INTEREST 0 0 0 0 0
PLUS: TAXES 0 4,226,576 13,633,532 16,839,933 24,187,772
EBIT -4,598,715 25,096,084 50,033,089 61,226,432 85,776,595
PLUS: DEPRECIATION 1,647,705 7,065,591 11,003,969 11,273,760 11,593,510
EBITD -2,951,010 32,161,675 61,037,058 72,500,192 97,370,105
PLUS: AMORTIZATION 439,958 487,178 504,918 534,398 563,878
EBITDA -2,511,052 32,648,853 61,541,976 73,034,590 97,933,983
LESS: CAPITAL EXPENDITURES -10,844,832 -23,347,138 -11,927,540 -11,939,493 -10,987,290
LESS: INVESMENT IN WORKING CAPITAL -962,038 -3,015,648 -3,509,064 -4,231,645 -5,370,110
FREE CASH FLOW -14,317,922 6,286,066 46,105,372 56,863,452 81,576,583
< $176,513,551

BRANDING AND BRAND MANAGEMENTBRAND NAME SELECTION
LO3
11-63
SuggestProductBenefits
Distinctive
Lack PoorForeign
LanguageMeanings
SuggestProductQualities
Easy to:PronounceRecognizeRemember

• PLUS …
• IT MUST BE ABLE TO BE REGISTERED AND PROTECTED!
• YOU MUST BE CONSISTENT IN THE USE OF YOUR BRAND.
BRANDING AND BRAND MANAGEMENTBRAND NAME SELECTION
LO3

BRAND STRATEGIES
Line ExtensionCherry Coke, Vanilla Coke
MultibrandsProctor & Gamble
Brand Extension[Multiproduct]
Honda Motorcycles
New BrandsWindex (by acquisition)B
ran
d N
ame
Existing New
Product Category
Existing
New
Cannibalization ?
Fighting brands
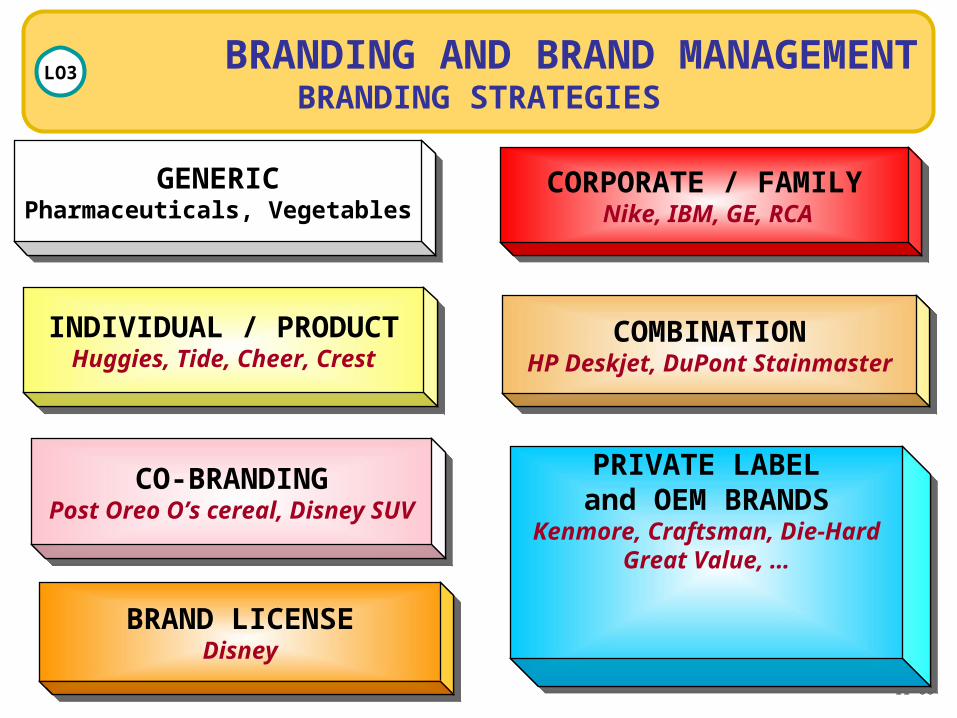
BRANDING AND BRAND MANAGEMENTBRANDING STRATEGIES
LO3
11-66
GENERICPharmaceuticals, Vegetables
GENERICPharmaceuticals, Vegetables
INDIVIDUAL / PRODUCTHuggies, Tide, Cheer, Crest
INDIVIDUAL / PRODUCTHuggies, Tide, Cheer, Crest
CO-BRANDINGPost Oreo O’s cereal, Disney SUV
CO-BRANDINGPost Oreo O’s cereal, Disney SUV
CORPORATE / FAMILY Nike, IBM, GE, RCA
CORPORATE / FAMILY Nike, IBM, GE, RCA
PRIVATE LABELand OEM BRANDS
Kenmore, Craftsman, Die-HardGreat Value, …
PRIVATE LABELand OEM BRANDS
Kenmore, Craftsman, Die-HardGreat Value, …
COMBINATIONHP Deskjet, DuPont Stainmaster
COMBINATIONHP Deskjet, DuPont Stainmaster
BRAND LICENSEDisney
BRAND LICENSEDisney

11
PACKAGING, LABELING
AND
LEGAL ISSUES

PACKAGING AND LABELING PRODUCTSCONTEMPORARY PACKAGING AND
LABELING CHALLENGESLO4
• Recognize and differentiate
• Communicate benefits [prove value]
• Address health [dosage], safety [use], or security issues [personal data]
• Comply with government and industry standards

THE PRODUCT / SERVICE CONCEPT
BrandName
QualityLevel
Design
FeaturesDelivery& Credit
Installation
Warranty
After-Sale
Service
CoreBenefit
orService
CoreBenefit
orService
Actual / BrandedProduct
Actual / BrandedProduct
AugmentedProduct
AugmentedProduct

PACKAGING & LABELING ARE CRITICAL
Recognition [preferably immediate B2C]
Promote the company & brand image
Opportunity for innovation
Additional utility
-package reuse [environmental]

PACKAGING AND LABELING
PromotesPromotesIdentifiesIdentifies
Competitive Advantages
Competitive Advantages
Describes[Marketing information]
Describes[Marketing information]
Sales TasksSales Tasks Product Safety[Protection, use & storage]
Product Safety[Protection, use & storage]
Packagingand
Labeling
Packagingand
Labeling

PACKAGING FUNCTIONS:
• DESIGN [Functional / For reuse / Appeals]
• CONTAIN [Complete product / storage / use / convenience]
• PROTECT [Minimize product damage]
• PROMOTE [Display / Advertise]
• MATERIALS– – Spoilage and other damage–

PACKAGING FUNCTIONS:PROTECTION
•
• CAN BE A SUBSTANTIAL PORTION OF A CONSUMER PRODUCT COST.
• Varies by type of product– Food contrasted with perfume

PACKAGING FUNCTIONS:DISTRIBUTION
• INFRASTRUCTURE –
• SYSTEMS–
AS/RS 44,000 PALLET POSITIONS
http://www.idslogistics.com/asrs.htm

PACKAGING ISSUES:INTERMODAL STRESS POINTS
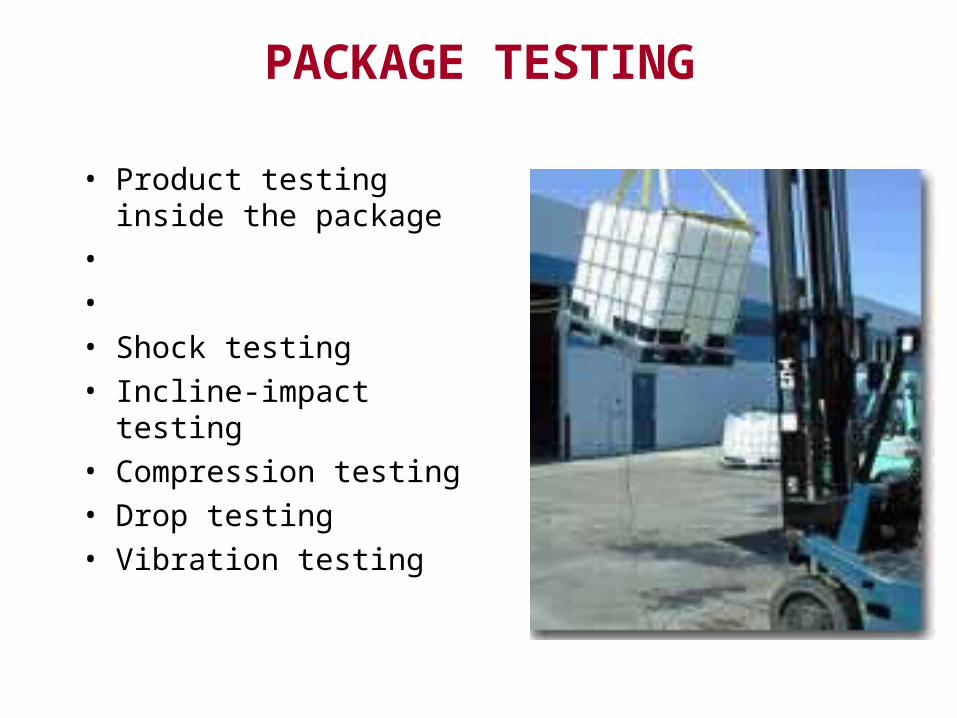
PACKAGE TESTING
• Product testing inside the package
• • • Shock testing• Incline-impact testing• Compression testing• Drop testing• Vibration testing

INNOVATIONS IN PACKAGING
• Reusable containers
• Multiple break-down sizes
•
• Promotional aid

REASONS FOR A CONSIDERING A PACKAGING CHANGE
• Competitive packaging
• New promotion
•
• Entering a new market or channel
• – Type of product, trade area, …
• – Campbell’s soups

PACKAGING: LABEL OBJECTIVESSee also http://www.fda.gov
PROMOTE THE PRODUCT
• Persuasive theme [advertising message]
DESCRIBE THE PRODUCT
•Informational [What is it?]
USE THE PRODUCT
• How to use• How to store
COMPLY WITH REQUIREMENTS AND LAWS
• Labels [bar code]• Warnings• Contents

LABELING ISSUES
• Meet industry / government requirements– UPC code– Industry specific usually federally driven
• Legal framework– Fair Trade Commission Act [1914]
•
– Fair Packaging and Labeling Act [1966]•

LABELING
• ON-PACKAGE LABELS ARE USUALLY SPECIFIED BY COUNTRY LAW– LANGUAGE[S]
– REQUIRED INFORMATION [& PLACEMENT]
• 1/1/2005 U.S. & CANADA CONVERT TO INTERNATIONAL 13-DIGIT BAR CODES
•
BRANDING AND BRAND MANAGEMENTLegal Concerns
LO4
Warranty
• Express Warranties
• Limited Coverage Warranties
• Full Warranties
• Implied Warranties11-82

BRANDING AND BRAND MANAGEMENTLegal Concerns
LO4
11-83
INTELLECTUAL PROPERTY
– COPYRIGHTS– TRADEMARKS & SERVICEMARKS– PATENTS– –

COPYRIGHT©
• A copyright protects the original way an idea is expressed.
• Examples include any original– Architecture or art– Drama, digital, literary, or musical work
•

TRADEMARK TM ®
• A trademark is some item used to uniquely identify the product.
• Examples include– Word, slogan– Logo, package design– Dilution [Federal Trademark Dilution Act of 1995 ]– Genericized trademark
• When registered in the U.S. it carries a ®.
• If it used for a service in the U.S. it is called

PATENTS
A patent protects the original idea and the way it is implemented. [ ]
PATENT ISSUES
-Is it patentable?
-Novelty Test: Relative, Novel, Absolute Novelty
-Non-obvious Test
-Global filing sequence
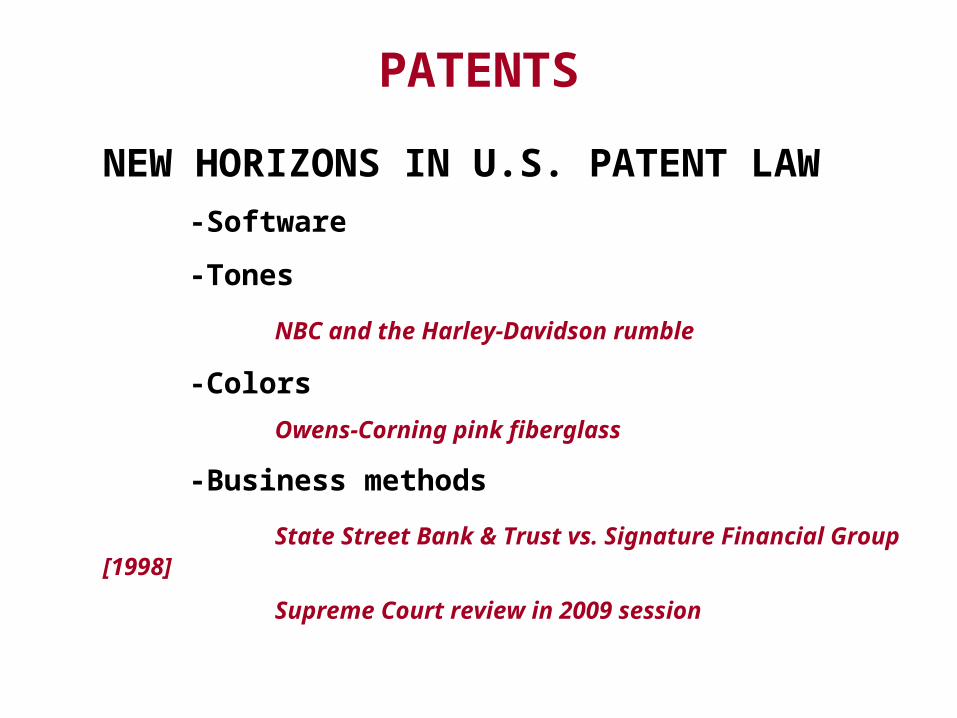
PATENTS
NEW HORIZONS IN U.S. PATENT LAW
-Software
-Tones
NBC and the Harley-Davidson rumble
-Colors
Owens-Corning pink fiberglass
-Business methods
State Street Bank & Trust vs. Signature Financial Group [1998]
Supreme Court review in 2009 session
TRADE SECRET
A trade secret is any piece of information that is not commonly known, deduced, or an intuitive extension of an existing piece of data that has significant value. Nor is it something competitors can learn through standard investigation procedures.
PROTECTION –
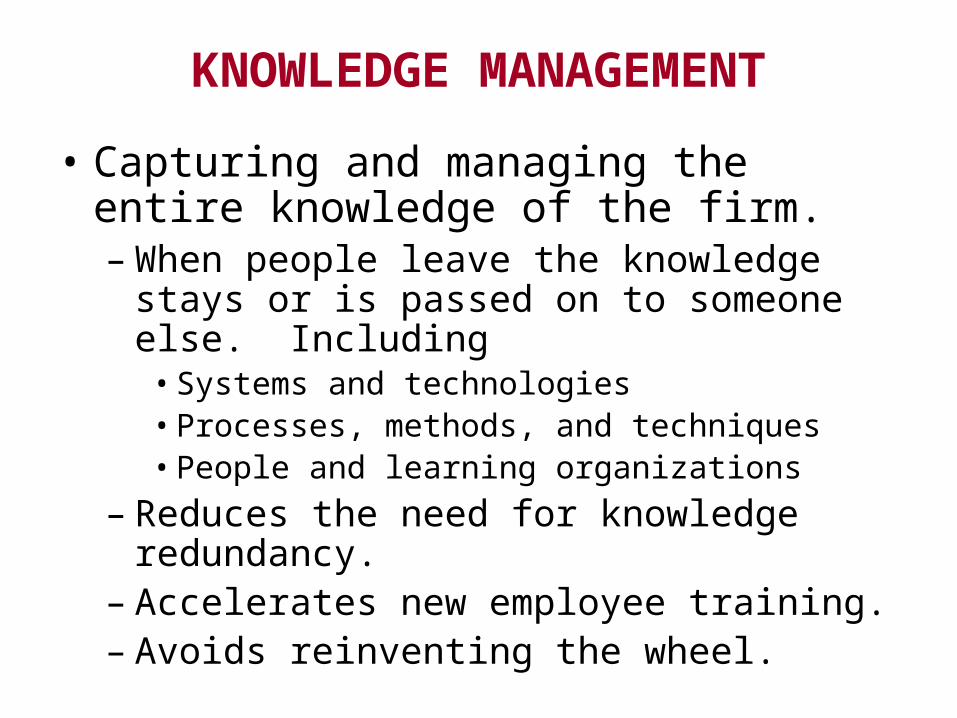
KNOWLEDGE MANAGEMENT
• Capturing and managing the entire knowledge of the firm.– When people leave the knowledge stays or is
passed on to someone else. Including• Systems and technologies• Processes, methods, and techniques• People and learning organizations
– Reduces the need for knowledge redundancy.– Accelerates new employee training.– Avoids reinventing the wheel.
12A
PRICE THEORY, STRATEGY,
AND TACTICS –
ESTABLISHING VALUE

NATURE AND IMPORTANCE OF PRICEWHAT IS A PRICE?
LO1
CUSTOMERS VALUE PRICECOST &PROFIT
PRODUCTPLACE
PROMOTION
CUSTOMERSVALUEPRICECOST &PROFIT
PRODUCTPLACE
PROMOTION
PRICE PHILOSOPHIES

PRICE AND VALUE
•
• Value is the perceived worth of the purchase. – Quantitatively: A ratio of perceived
benefits to price.
• If the value proposition is valid, price is never a problem to a qualified prospect - because
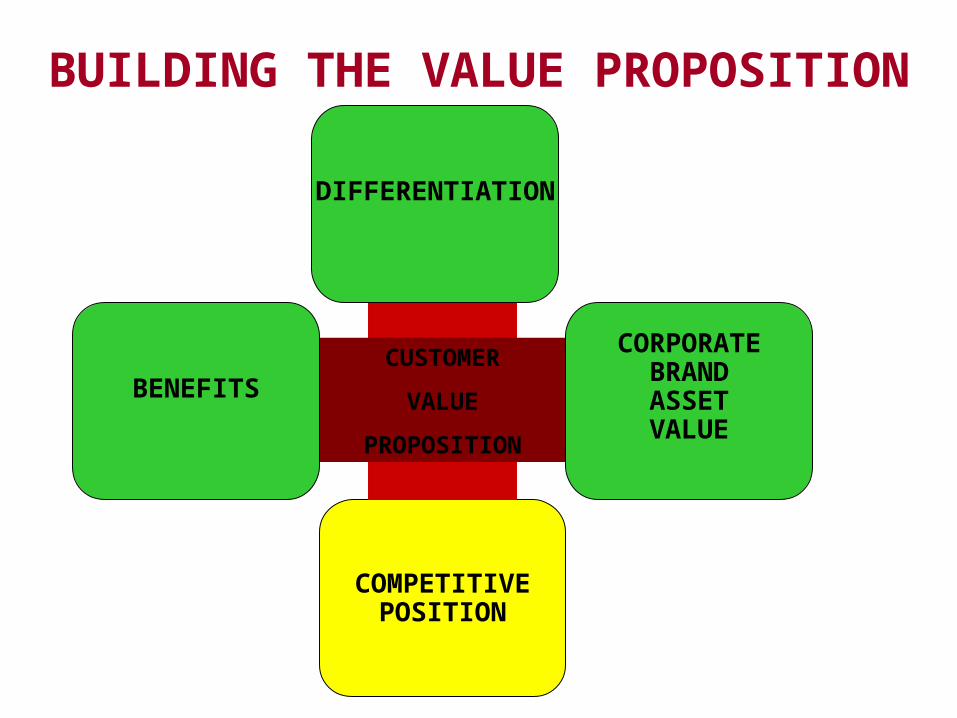
BUILDING THE VALUE PROPOSITION
COMPETITIVEPOSITION
CUSTOMER
VALUE
PROPOSITION
CORPORATEBRANDASSETVALUE
BENEFITS
DIFFERENTIATION
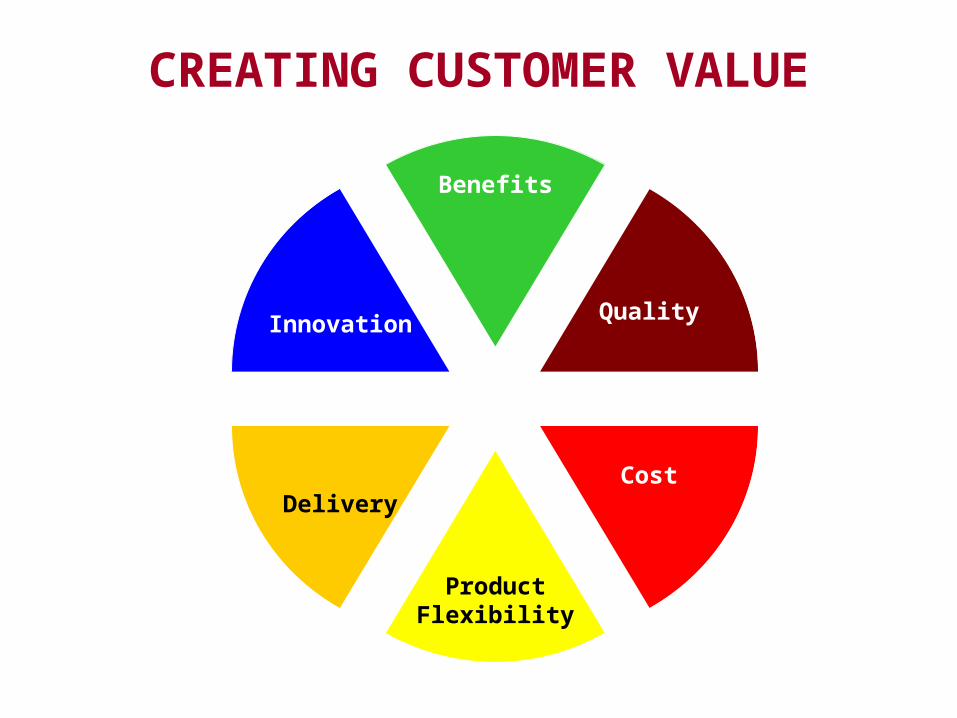
CREATING CUSTOMER VALUE
Benefits
Quality
Cost
Product Flexibility
Delivery
Innovation

SOURCES OF VALUEVALUE IS PERCEPTION – PERCEPTION IS VALUE
• Product or service
• Experience
•
• Perceived quality
•

SOURCES OF VALUEVALUE IS PERCEPTION – PERCEPTION IS VALUE
• The sales force is trained to use
– – – –
•

FEATURES, ADVANTAGES, BENEFITS[FABS]
FEATURE ADVANTAGE
Specific attributes
Describes what it does
Color /Ingredients /Packaging
Explanation

STEP 1: IDENTIFY PRICING OBJECTIVESAND CONSTRAINTS
IDENTIFYING PRICING OBJECTIVES
LO2
INTERNAL FACTORS EXTERNAL FACTORS
Marketing StrategyAnd Objectives
Marketing Mix Decisions
Cost Factors
OrganizationalConsiderations
• Market segment profile• Product design & performance• Channels of Distribution• Integrated marketing communication

CORPORATE OBJECTIVES INFLUENCE ON PRICE DECISIONS
Survival
Low Prices to Cover Variable Costs andSome Fixed Costs to Stay in Business
Survival
Low Prices to Cover Variable Costs andSome Fixed Costs to Stay in Business
Current Profit Acceptance Level
Maximum Current Profit, Cash Flow, ROI, or ROA
Current Profit Acceptance Level
Maximum Current Profit, Cash Flow, ROI, or ROA
Market Share Leadership
Price to Become the Market Share Leader in unit volume and/or revenue.
Market Share Leadership
Price to Become the Market Share Leader in unit volume and/or revenue.
Product Quality Leadership
High Prices to Cover Higher Performance Quality and R & D
Product Quality Leadership
High Prices to Cover Higher Performance Quality and R & D

WHAT AFFECTS PRICE?
INTERNAL FACTORS EXTERNAL FACTORS
Market, Demand,And Competition
Substitute Productsand Services
Vendor & Materials Issues
Reseller Needs
External Factors:Economy, Government, …

STEP 1: IDENTIFY PRICING OBJECTIVESAND CONSTRAINTS
IDENTIFYING PRICING CONSTRAINTS
LO2
Pricing Constraints – factors that limit the price range of an item.• Demand for the
Product Class (Cars), Product (Sports Cars), and Brand (Bugatti Veyron)
• Newness of the Product: Stage in the Product Life Cycle
13-101

STEP 1: IDENTIFY PRICING OBJECTIVESAND CONSTRAINTS
IDENTIFYING PRICING CONSTRAINTS
LO2
13-102
TYPE OF COMPETITION
• ECONOMICS•Monopolistic competition•Oligopoly
• COMPETITIVE PRICES
• COMPETITIVE TACTICS

PRICE AS PICTURED BY THE CONSUMER
NET PRICE
List priceLess: discounts
QuantitySeasonalCash / couponPromotion
Less: AllowancesTrade-in value
PRODUCTBENEFITS +
ServiceQualityBrand / warrantyRepairPackagingCredit / financingDelivery / availabilityIncentives
<

PRICE AS PICTURED BY THE RESELLER
NET PRICE
List priceLess: Volume discounts
QuantitySeasonalCash / couponSpecial
Less: AllowancesTrade-in value
PRODUCTBENEFITS +
ProductServiceQualityBrand*Availability*Inventory*Promotional activity
<
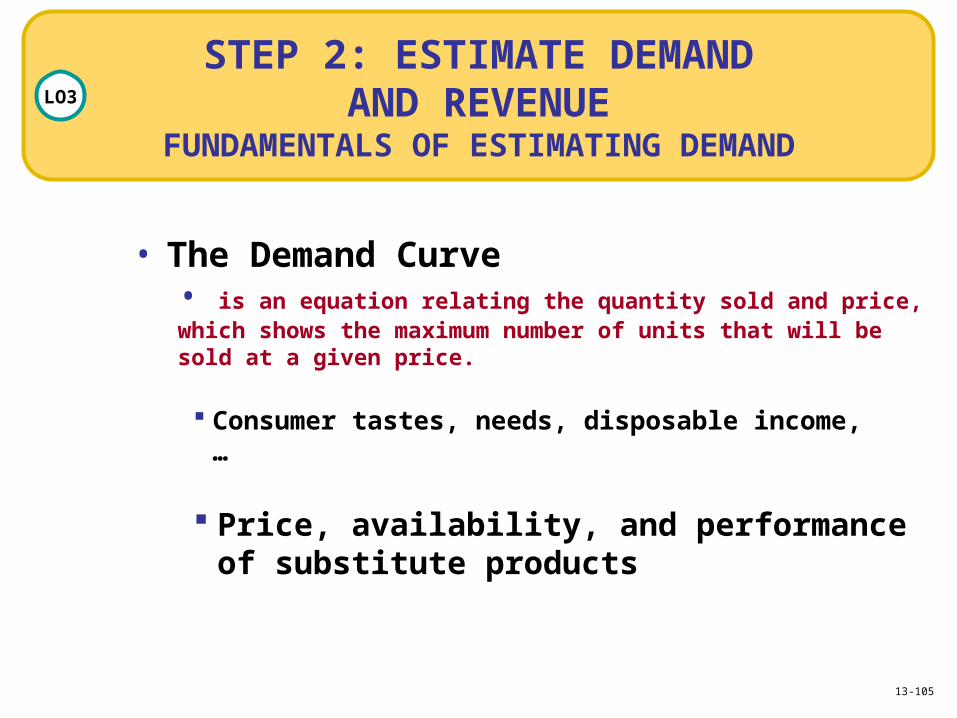
STEP 2: ESTIMATE DEMANDAND REVENUE
FUNDAMENTALS OF ESTIMATING DEMAND
LO3
• The Demand Curve• is an equation relating the quantity sold and price, which shows the maximum number of units that will be sold at a given price.
Price, availability, and performance of substitute products
Consumer tastes, needs, disposable income, …
13-105

STEP 2: ESTIMATE DEMANDAND REVENUE
FUNDAMENTALS OF ESTIMATING DEMAND
LO3
• Movement Along vs. a Shift of Demand Curve
Movement Along a Demand Curve
Shift in the Demand Curve
13-106

FIGURE 13-5AFIGURE 13-5A Demand curve for Newsweek [put up for sale on May 5, 2010 after nearly three years of losses] showing the effect on annual sales by a change in price caused by a movement along the demand curve.
13-107
If price is lowered by 25%, demand is estimated to increase by 50%.
Is this example of selling 50% more for 25% less good for your firm?
What is the key concern?
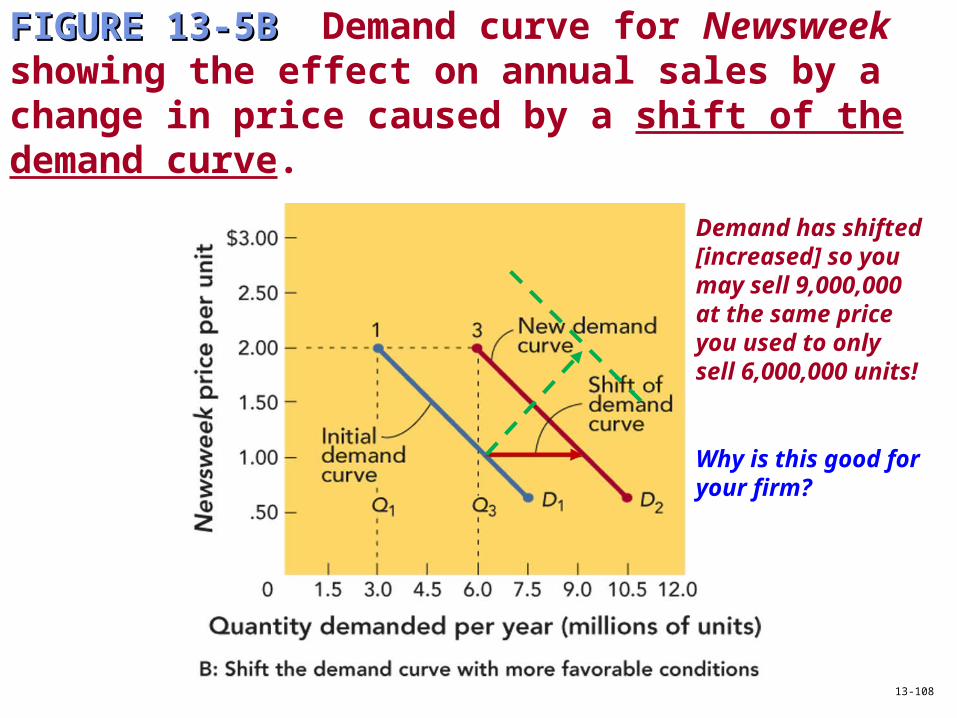
FIGURE 13-5BFIGURE 13-5B Demand curve for Newsweek showing the effect on annual sales by a change in price caused by a shift of the demand curve.
13-108
Demand has shifted [increased] so you may sell 9,000,000 at the same price you used to only sell 6,000,000 units!
Why is this good for your firm?

STEP 2: ESTIMATE DEMANDAND REVENUE
FUNDAMENTALS OF ESTIMATING REVENUE
LO3
Total Revenue TR = Net unit price * Quantity sold
Marginal Revenue MR = ΔTR / ΔQFor 1 more unit, this is the slope of the TR curve.
13-109

FIGURE 13-7FIGURE 13-7 How Newsweek’s downward-sloping demand curve affects total, average, and marginal revenues.
13-110

BASIC ECONOMICS: DEMAND
P
R
I
C
E
QUANTITY
DEMANDED
DEMAND FOR A
NECESSITY: SALT
DEMAND FOR A
SUBSTITUTE: PEANUTS
DEMAND FOR A
SUBSTITUTE:
COTTON
INDUSTRY
OVERSUPPLY
PRODUCT
SUBSTITUTION
?

STEP 2: ESTIMATE DEMANDAND REVENUE
FUNDAMENTALS OF ESTIMATING REVENUE
LO4
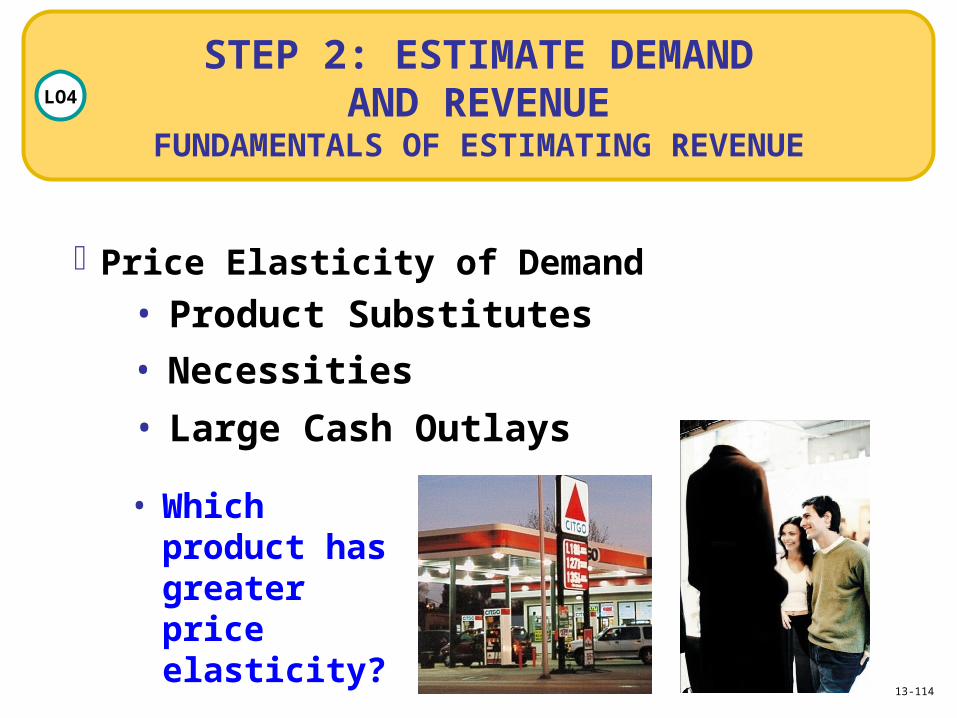
Price Elasticity of Demand (E) =
Percentage Change in Quantity Demanded
Percentage Change in Price
• Elastic Demand – what you want
• Inelastic Demand – must know when this occurs
13-112
Price Elasticity of Demand

BASIC ECONOMICS: DEMAND
P
R
I
C
E
QUANTITY DEMANDED[PER PERIOD]
EQUILIBRIUM
INELASTIC
DEMAND
ELASTIC
DEMAND
Small Q
LARGE P
LARGE Q
Small P
STEP 2: ESTIMATE DEMANDAND REVENUE
FUNDAMENTALS OF ESTIMATING REVENUE
LO4
• Necessities
• Large Cash Outlays
• Product Substitutes
Price Elasticity of Demand
13-114
• Which product has greater price elasticity?
STEP 3: DETERMINE COST, VOLUME,AND PROFIT RELATIONSHIPS
THE IMPORTANCE OF CONTROLLING COSTS
LO5
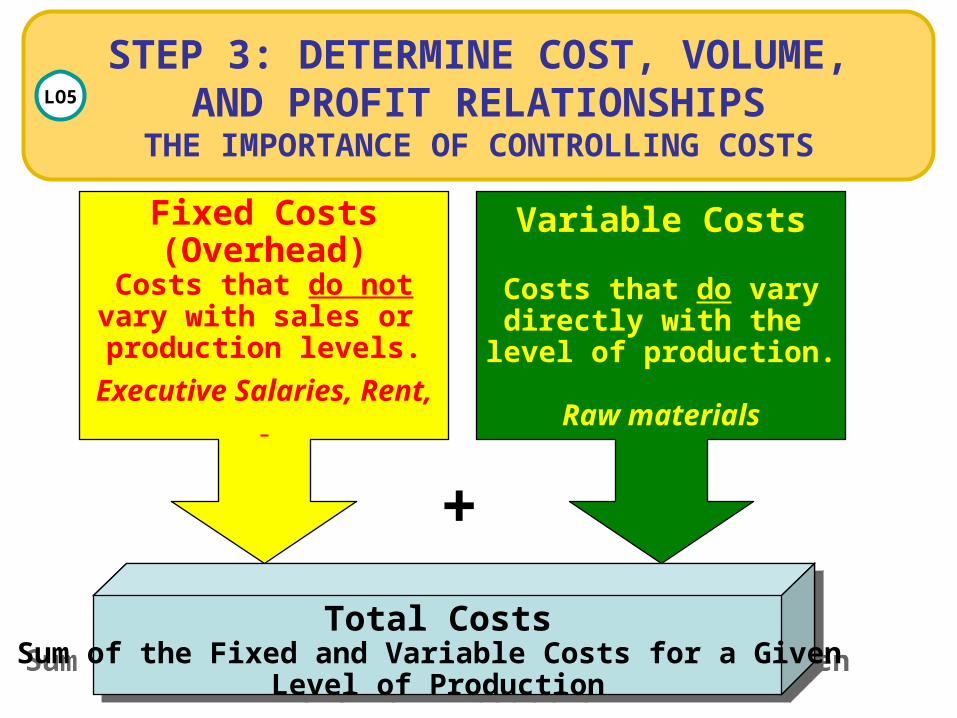
Total CostsSum of the Fixed and Variable Costs for a Given
Level of Production
Total CostsSum of the Fixed and Variable Costs for a Given
Level of Production
Variable Costs
Costs that do varydirectly with the
level of production.
Raw materials
Fixed Costs(Overhead)
Costs that do notvary with sales or production levels.
Executive Salaries, Rent,
+
STEP 3: DETERMINE COST, VOLUME,AND PROFIT RELATIONSHIPS
MARGINAL COST
LO5
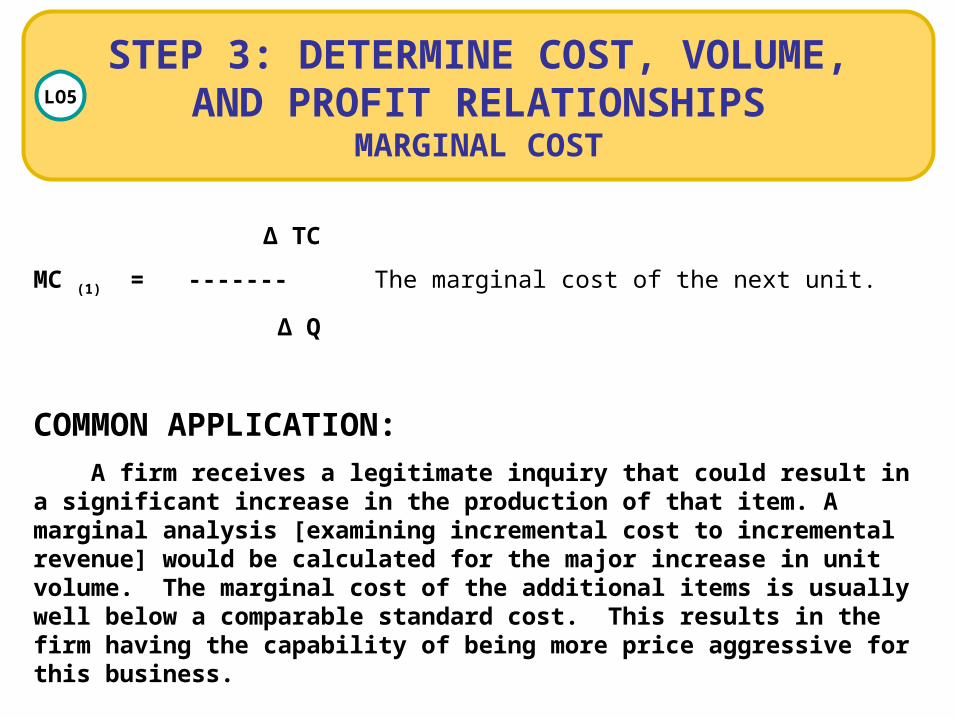
Δ TC
MC (1) = ------- The marginal cost of the next unit.
Δ Q
COMMON APPLICATION:
A firm receives a legitimate inquiry that could result in a significant increase in the production of that item. A marginal analysis [examining incremental cost to incremental revenue] would be calculated for the major increase in unit volume. The marginal cost of the additional items is usually well below a comparable standard cost. This results in the firm having the capability of being more price aggressive for this business.
STEP 3: DETERMINE COST, VOLUME,AND PROFIT RELATIONSHIPS
BREAK-EVEN ANALYSIS
LO6
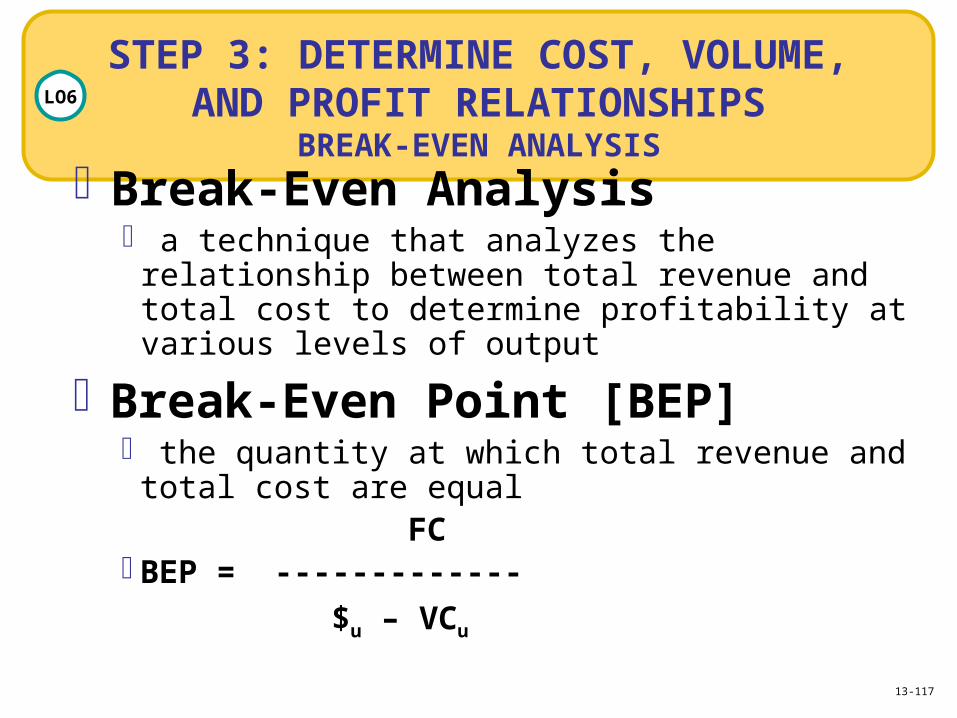
Break-Even Analysis a technique that analyzes the relationship between
total revenue and total cost to determine profitability at various levels of output
Break-Even Point [BEP] the quantity at which total revenue and total cost are
equal FC
BEP = -------------
$u – VCu
13-117

FIGURE 13-9FIGURE 13-9 Profit is a maximum at the quantity at which
13-118

FIGURE 13-10FIGURE 13-10 Calculating a break-even point for the picture frame store shows its profit starts at 400 framed pictures per year.
13-119

STEP 3: DETERMINE COST, VOLUME,AND PROFIT RELATIONSHIPS
BREAK-EVEN ANALYSIS
LO6
Break-Even Chart a graphic presentation of the break-even analysis that
shows when total revenue and total cost intersectto identify profit or loss for a given quantity sold
13-120

FIGURE 13-11FIGURE 13-11 Break-even analysis chart for a picture frame store shows the break-even point at 400 pictures
13-121
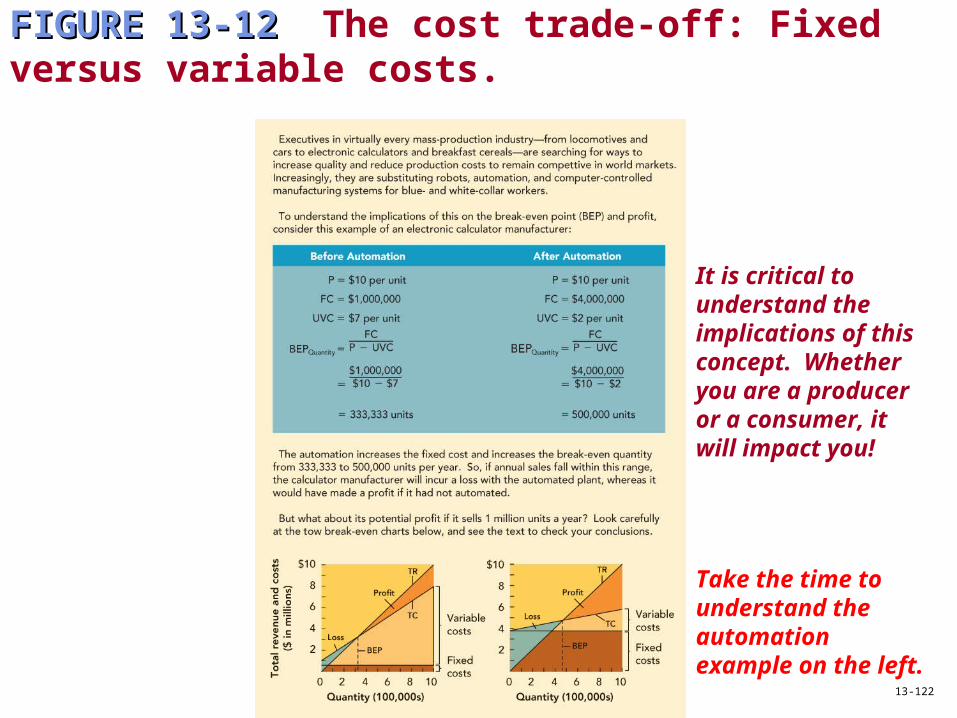
FIGURE 13-12FIGURE 13-12 The cost trade-off: Fixed versus variable costs.
13-122
It is critical to understand the implications of this concept. Whether you are a producer or a consumer, it will impact you!
Take the time to understand the automation example on the left.
12B
PRICE THEORY, STRATEGY,
AND TACTICS –
IMPLEMENTATION

Four possible approaches for selecting an approximate price level.
14-124

STEP 4: SELECT ANAPPROXIMATE PRICE LEVEL
NEW PRODUCT STRATEGIES
LO1
MARKET PENETRATIONInitial low price for volume
[Wal-Mart]
MARKET PENETRATIONInitial low price for volume
[Wal-Mart]
Planned reductions
[Computers]
Planned reductions
[Computers]
MARKET SKIMMINGInitial high price followed
by price decreases
MARKET SKIMMINGInitial high price followed
by price decreases
•
• Could be too high resulting in
– product sales failure, and/or
– loss of first mover advantage
• Puts a major burden on having enough NPD and timing of new product introductions.

STEP 4: SELECT ANAPPROXIMATE PRICE LEVEL
PRODUCT MIX STRATEGIES
LO1
PRODUCT LINESteps between items in line
[Cell phones]
PRODUCT LINESteps between items in line
[Cell phones]
CAPTIVE PRODUCT[Razor blades, film]
CAPTIVE PRODUCT[Razor blades, film]
PRODUCT BUNDLE[Season tickets]
PRODUCT BUNDLE[Season tickets]
BY-PRODUCT[Plastic lumber]
BY-PRODUCT[Plastic lumber]

STEP 4: SELECT ANAPPROXIMATE PRICE LEVEL
COMPETITION-BASED STRATEGIES
LO1
GOING – RATEBased on what competitors
are charging
GOING – RATEBased on what competitors
are charging
SOLE SOURCESOLE SOURCE
EQUAL TOPRODUCT LEADER
[ALCOA, metals]
EQUAL TOPRODUCT LEADER
[ALCOA, metals]

STEP 4: SELECT ANAPPROXIMATE PRICE LEVEL
PSYCHOLOGICAL STRATEGIES
LO1
• Adjusting Prices for a Psychological Effect
•
• Reference Prices [buyer’s perspective - clothing]
•
• Price Lining
• Prestige Pricing

PSYCHOLOGICAL PRICING
Units sold Units sold
Price
per
unit
Price
per
unit
1 – Demand is inelastic over range: appliances2 – Retail price points for a product, e.g. $100, $70, $40
$399
$349

STEP 4: SELECT ANAPPROXIMATE PRICE LEVEL
PROMOTIONAL STRATEGIES
LO1
• Adjusting Prices for a Psychological Effect
• Loss leader [milk]
• Discounts [temporary] reductions• Sales• Seasonal
• Coupons• Free standing: average redemption rates of ~1%-2% / many others 6-7%.

STEP 4: SELECT ANAPPROXIMATE PRICE LEVELGEOGRAPHICAL PRICE STRATEGIES
LO1
• Adjusting Prices to Account for the Geographical Location of Customers
• Zones [UPS]
• FOB • Origin• Freight allowed
• The quoted price = Cost of goods + cost of freight
• Uniform delivered in practice is •
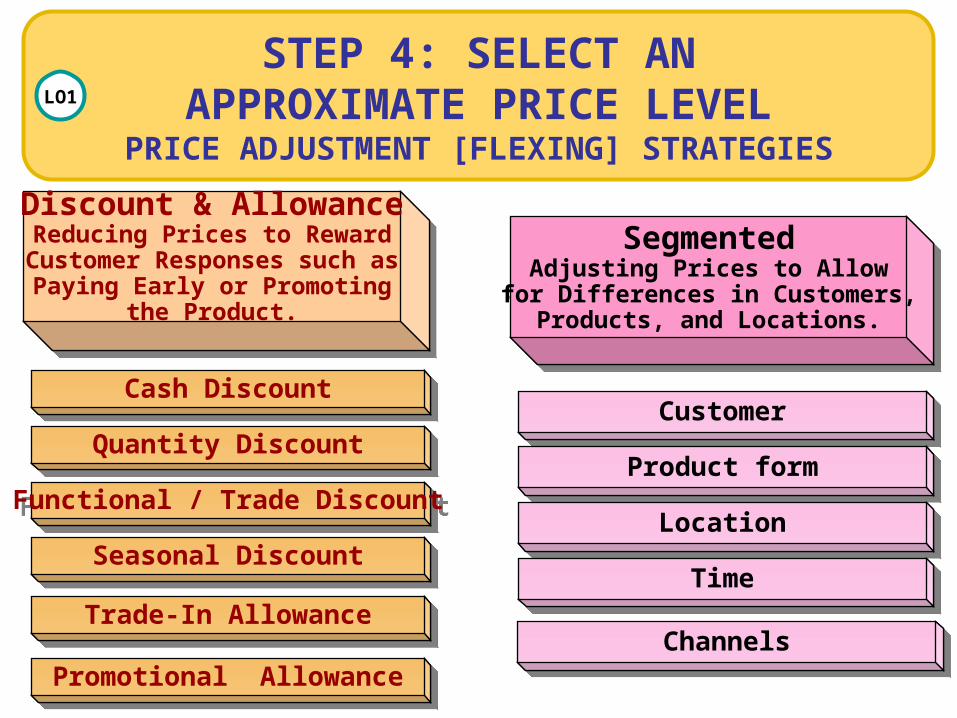
STEP 4: SELECT ANAPPROXIMATE PRICE LEVEL
PRICE ADJUSTMENT [FLEXING] STRATEGIES
LO1
Discount & AllowanceReducing Prices to Reward
Customer Responses such asPaying Early or Promoting
the Product.
Discount & AllowanceReducing Prices to Reward
Customer Responses such asPaying Early or Promoting
the Product.
Cash DiscountCash Discount
Quantity DiscountQuantity Discount
Functional / Trade DiscountFunctional / Trade Discount
Seasonal DiscountSeasonal Discount
Trade-In AllowanceTrade-In Allowance
Promotional AllowancePromotional Allowance
SegmentedAdjusting Prices to Allow
for Differences in Customers,Products, and Locations.
SegmentedAdjusting Prices to Allow
for Differences in Customers,Products, and Locations.
CustomerCustomer
Product formProduct form
LocationLocation
TimeTime
ChannelsChannels
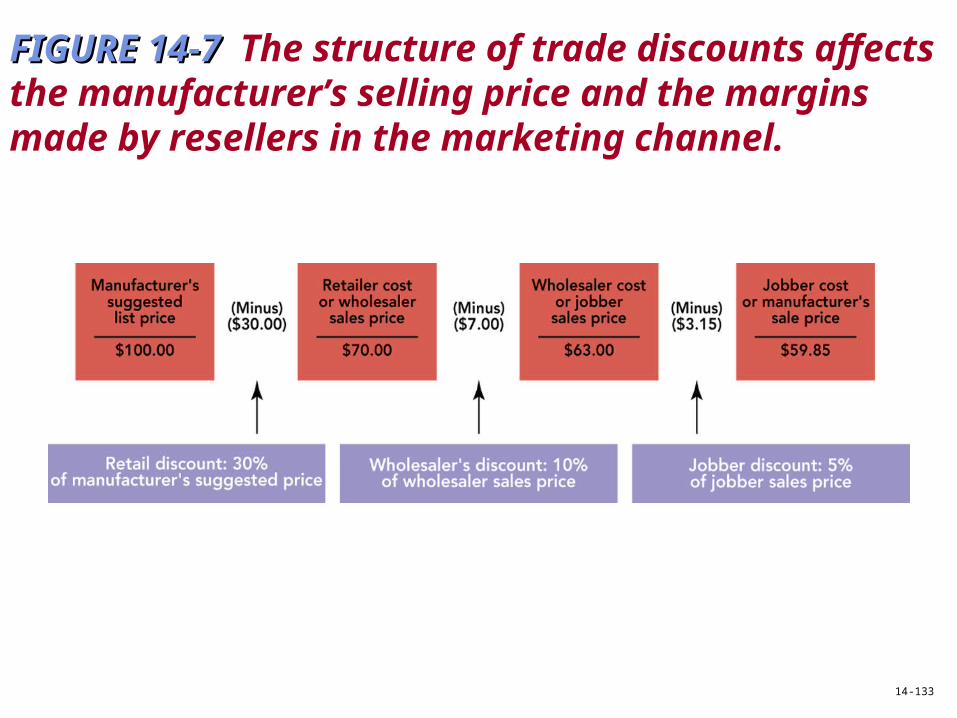
FIGURE 14-7FIGURE 14-7 The structure of trade discounts affects the manufacturer’s selling price and the margins made by resellers in the marketing channel.
14-133
STEP 4: SELECT ANAPPROXIMATE PRICE LEVEL
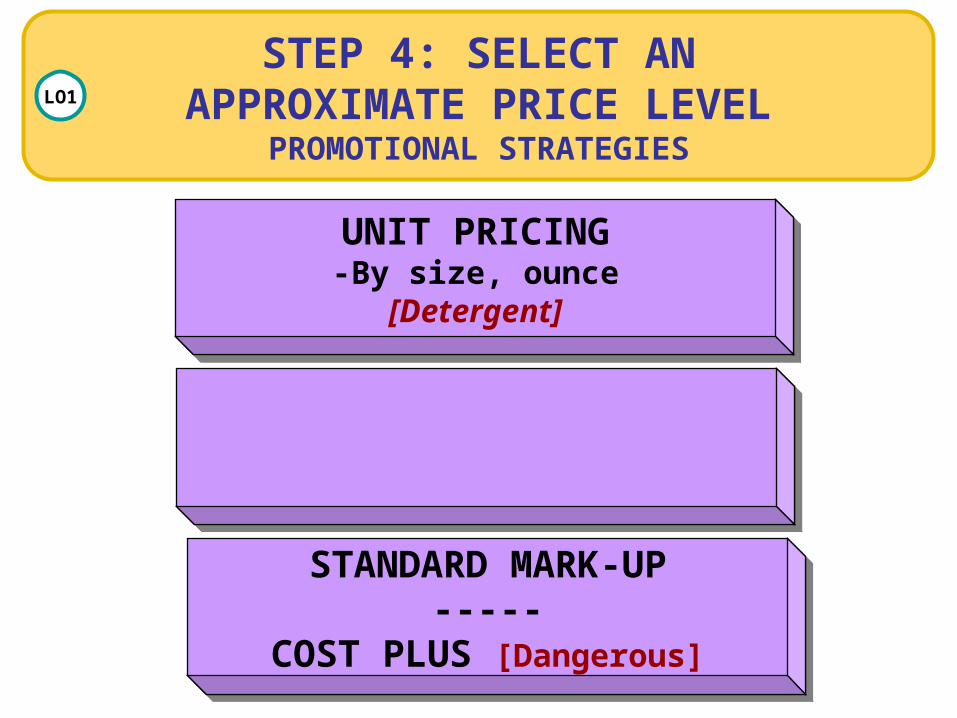
PROMOTIONAL STRATEGIES
LO1
UNIT PRICING-By size, ounce
[Detergent]
UNIT PRICING-By size, ounce
[Detergent]
STANDARD MARK-UP-----
COST PLUS [Dangerous]
STANDARD MARK-UP-----
COST PLUS [Dangerous]
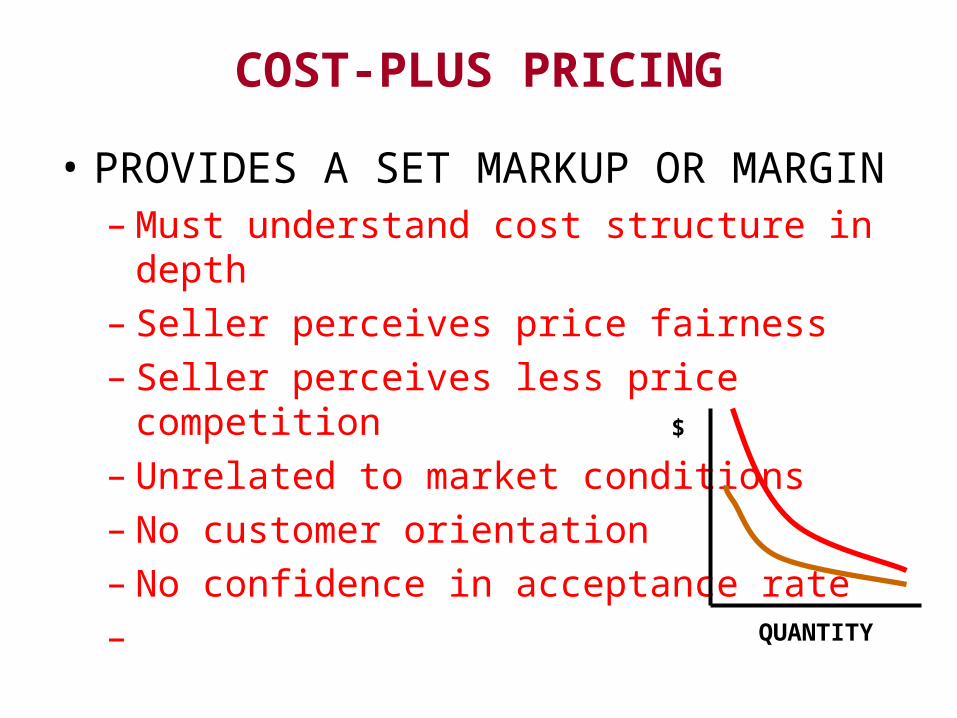
COST-PLUS PRICING
• PROVIDES A SET MARKUP OR MARGIN– Must understand cost structure in depth– Seller perceives price fairness– Seller perceives less price competition– Unrelated to market conditions– No customer orientation– No confidence in acceptance rate–
$
QUANTITY

BREAK-EVEN ANALYSIS
2
4
6
8
10
12
200 400 600 800 1,000
Total Revenue
Total Cost
Target Profit($2 million)
Sales Volume in Units (thousands)
Co
st i
n
Do
llar
s (m
illi
on
s)
Fixed Cost
Variable Cost

STEP 5: SET THE LIST OR QUOTED PRICECOMPANY, CUSTOMER, AND
COMPETITIVE EFFECTS ON PRICING
LO2
Company Effects
Customer Effects
Competitive Effects
14-137

FIGURE 14-6FIGURE 14-6 Three special adjustments to list or quoted price include discounts, allowances, and geographical adjustments.
14-138
• Off-Peak Pricing
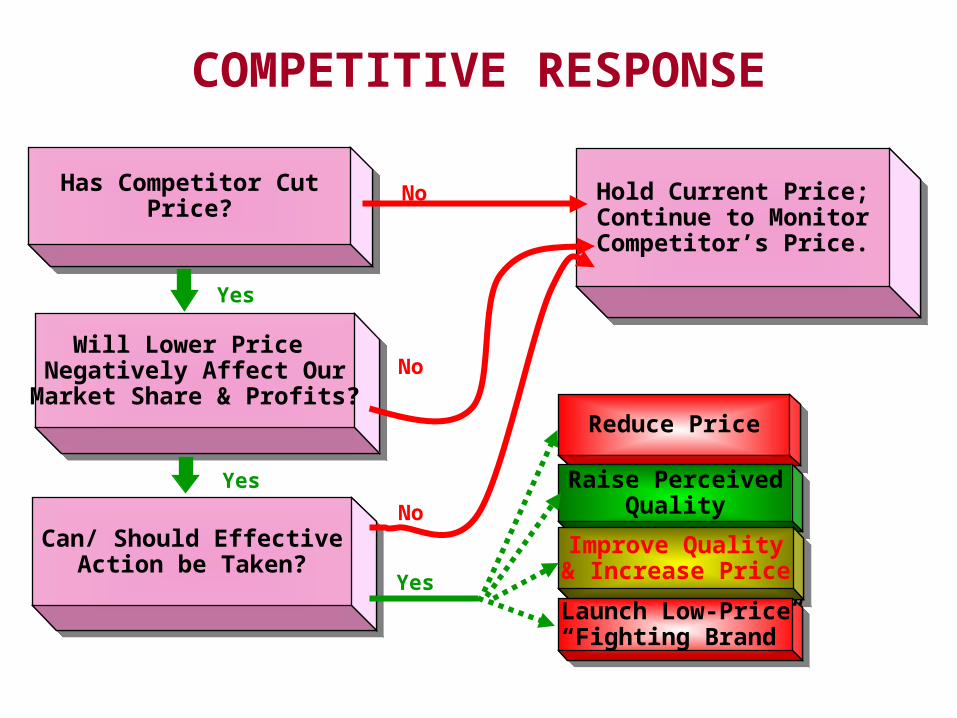
COMPETITIVE RESPONSE
Hold Current Price;Continue to MonitorCompetitor’s Price.
Hold Current Price;Continue to MonitorCompetitor’s Price.
Reduce PriceReduce Price
Raise PerceivedQuality
Raise PerceivedQuality
Improve Quality& Increase PriceImprove Quality& Increase Price
Launch Low-Price“Fighting Brand”
Launch Low-Price“Fighting Brand”
Has Competitor CutPrice?
Has Competitor CutPrice?
Will Lower Price Negatively Affect Our
Market Share & Profits?
Will Lower Price Negatively Affect Our
Market Share & Profits?
Can/ Should EffectiveAction be Taken?
Can/ Should EffectiveAction be Taken?
Yes
No
No
No
Yes
Yes

STEP 6: MAKE SPECIAL ADJUSTMENTSTO THE LIST OR QUOTED PRICE
LEGAL & REGULATORY ASPECTS OF PRICING
LO4
Price Fixing
• Horizontal Price Fixing
• Vertical Price Fixing
Resale Price Maintenance
14-140
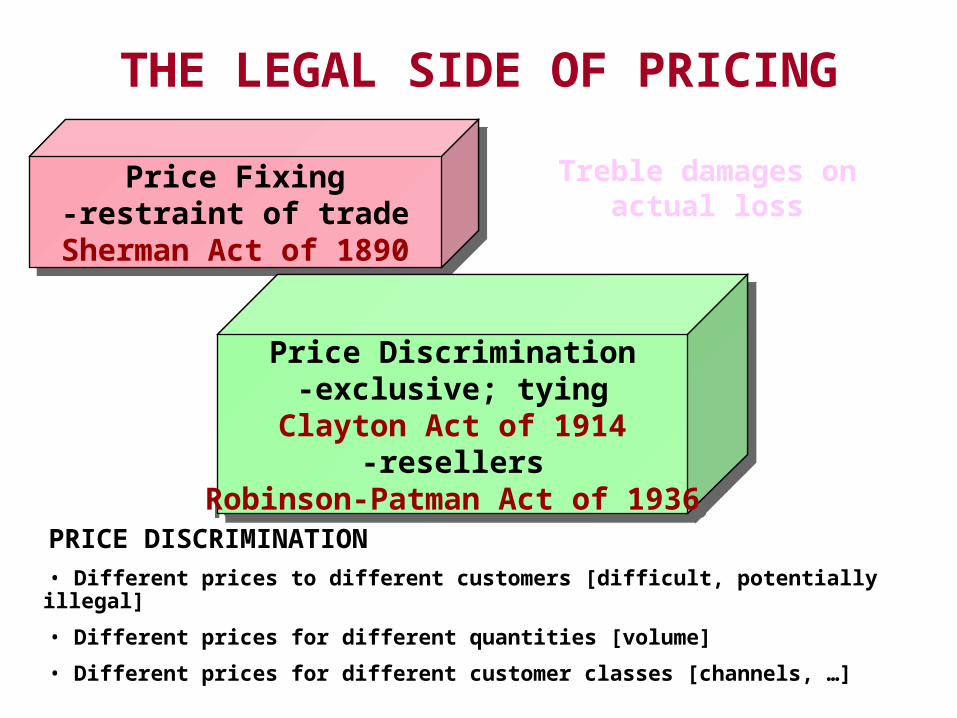
THE LEGAL SIDE OF PRICING
Price Fixing-restraint of trade
Sherman Act of 1890
Price Fixing-restraint of trade
Sherman Act of 1890
Price Discrimination-exclusive; tying
Clayton Act of 1914-resellers
Robinson-Patman Act of 1936
Price Discrimination-exclusive; tying
Clayton Act of 1914-resellers
Robinson-Patman Act of 1936
Treble damages on actual loss
PRICE DISCRIMINATION• Different prices to different customers [difficult, potentially illegal]
• Different prices for different quantities [volume]
• Different prices for different customer classes [channels, …]

ROBINSON-PATMAN ACT [1936]
• Case law and code law• Predatory Pricing […per se…]• Intent to harm
– Fry Roofing case• Section 2(a) Price Discrimination [p. 21]
– Dealing with purchasing– Different prices to different customers
• difficult, potentially illegal– Different prices for different quantities
• Volume discounts– Different prices for different customer classes
• Airlines, seniors, …

THE LEGAL SIDE OF PRICING
Deceptive PracticesWheeler-Lea Act of 1936
Deceptive PracticesWheeler-Lea Act of 1936
Price Fixing-restraint of trade
Sherman Act of 1890
Price Fixing-restraint of trade
Sherman Act of 1890
Price Discrimination-exclusive; tying
Clayton Act of 1914-resellers
Robinson-Patman Act of 1936
Price Discrimination-exclusive; tying
Clayton Act of 1914-resellers
Robinson-Patman Act of 1936
FTC: false and deceptive acts