Embed Size (px)
Citation preview
311
9 Marine Carbonates:Their Formation and DestructionRALPH R. SCHNEIDER, HORST D. SCHULZAND CHRISTIAN HENSEN
9.1 Introduction
For marine carbonates, an overwhelming amountof information exists in a variety of specializedjournals addressing marine geochemistry and car-bon cycling, as well as in many books summariz-ing the state of knowledge on this topic. There-fore it would be far beyond the scope of thischapter to try to completely review what is knownabout marine calcareous sediments and their di-agenesis. On the other hand, although intensivelyinvestigated since the previous century (e.g. Murray1897), marine carbonates have gained increasingattention by marine biologists, geochemists, pale-oceanographers and paleoclimatologists over thelast three decades. Among other reasons this isbecause marine carbonates, together with theoceanic CO2-carbonic acid-system, act as a sink orsource of carbon within the global carbon cyclewhich has become a key topic of investigation andmodelling related to the role of the greenhouse gasCO2 in future global climate change.
Descriptions of sedimentary carbonates in dif-ferent oceanic environments always have dealtwith the formation of the calcium carbonate andthe biologically, physically and chemically medi-ated processes governing the observed distribu-tion of sedimentary carbonates in the marinerealm. In this context special emphasis was oftengiven to the complex pattern of inorganic and or-ganic carbon exchange between the atmosphere,the world ocean and the continents. These are ad-ditional factors determining the distribution of in-organic carbon dissolved in seawater and the ac-cumulation or destruction of calcium carbonate inmarine sediments (Berger 1976; Andersen andMalahoff 1977; Broecker and Peng 1982;Sundquist and Broecker 1985; Morse andMackenzie 1990). The intention of this chapter is
furthermore to review the knowledge on the rateof calcium carbonate production in the ocean, thefluxes through the water column, as well as therates of inorganic carbon accumulation and de-struction in different marine environments. Forthis purpose this chapter summarizes studies deal-ing with the estimation of global carbonate reser-voirs and fluxes in the state of ongoing produc-tion, accumulation and dissolution or physicalerosion (Milliman 1993; Milliman and Droxler 1996;Wollast 1994). In addition, this chapter addressesthe principles and presents examples forcalculation of carbonate saturation conditions un-der variable boundary conditions in the oceanicCO2-carbonic acid-calcite system, i.e. temperature,pressure, salinity, and CO2 exchange with theatmosphere.
9.2 Marine Environments ofCarbonate Production andAccumulation
This section primarily focuses on the descriptionof the deposition and accumulation of carbonatesin shallow waters and in the deep ocean. The maindepocenters for calcium carbonates are thecontinental shelf areas, as well as island arcs oratolls, which are the typical shallow water envi-ronments for massive carbonate formation, andthe pelagic deep-sea sediments above the calcitecompensation depth catching the rain of small cal-careous tests formed by marine plankton in thesurface waters.
9.2.1 Shallow-Water Carbonates
Shallow-water carbonates are formed either bysediments made up of a variety of carbonate par-
9 Marine Carbonates: Their Formation and Destruction
312
ticles which have their origin in biotic and abioticprocesses, or by massive reefs and platforms builtup by skeleton-forming organisms. On a globalscale, these shallow-water carbonates in the mod-ern environment are mainly constituted by par-ticles of skeletal origin. However, aside from thecorals, the understanding of the physico-chemicaland vital factors affecting the biomineral composi-tion of shallow platform calcareous sediments inwarm waters is still incomplete. Shallow environ-ment precipitates form ooids and aragonitic needlemuds, whereby the former involve primarilyabiotic processes and the latter have both anabiotic and biotic source.
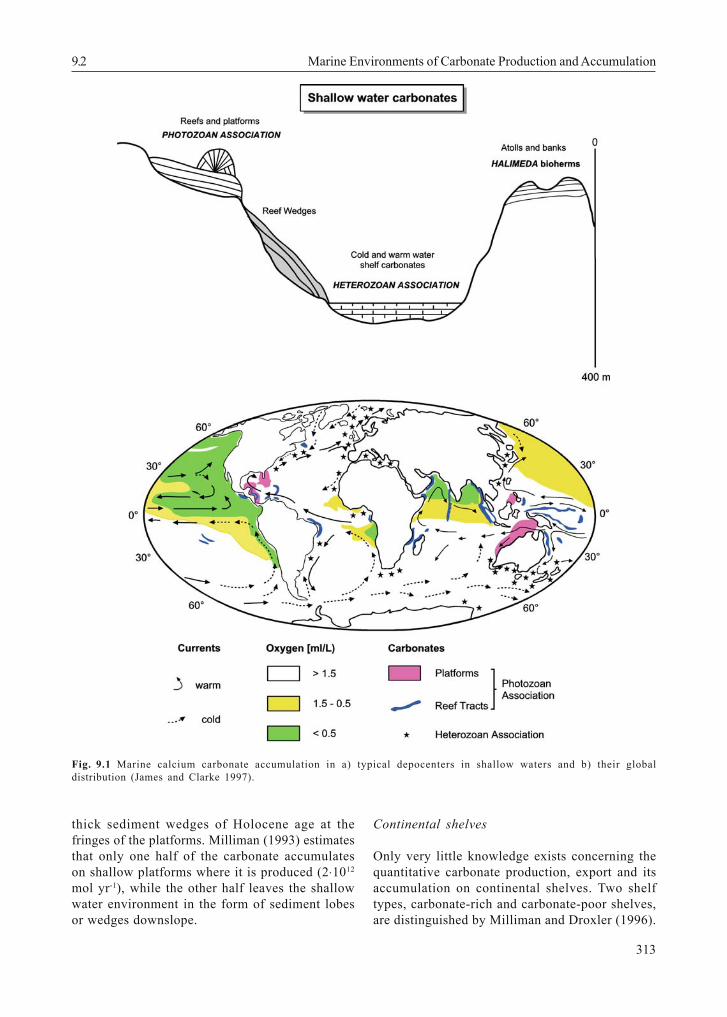
For long time, the classical picture of shallowwater carbonates was suggesting that most oftheir formation was restricted to tropical and sub-tropical regions within the 22°C isotherm of annualmean surface water temperatures (e.g. Berger andSeibold 1993), but it now has become evident thata significant amount of carbonate can also beformed as so-called 'cool-water' carbonate banksand reefs in temperate and cold latitudes (reviewby James 1997; Freiwald 2002). In the temperateand cold-water zones, particularly shelf and upperslope areas with only very low inputs ofterrigenous sediments are covered by cool-watercarbonate bioherms (Fig. 9.1a). Different from thewarm-water environment, where the major portionof skeletal carbonate is predominantly formed byan association of hermatypic corals and greenalgae referred to as 'Photozoan Association '(James 1997), the cool-water carbonates can becomposed of molluscs, foraminifers, echinoderms,bryozoans, barnacles, ostracods, sponges, worms,ahermatypic corals and coralline algae. Fordifferentiation from the warm-water PhotozoanAssociation, the group of organisms forming cool-water carbonates in shallow waters that are colderthan 20°C is defined by James 1997 as HeterozoanAssociation (see also Fig. 9.1). According toFreiwald (2002) the largest coral reef provincesoccur at greater water depths under cold and darkconditions usually below the storm wave base fromthe high to low latitudes of both hemispheres. Inthe North Atlantic the dominant reef-forming coralsbelong to scleractinian species. A first attempt tocalculate the amount of CaCO3 produced by cold-water reefs on global carbonate production wasprovided by Lindberg & Mienert (2005). Theirestimate is in the order of 4 to 12 % of that oftropical reefs which results in a tentative estimate >1 % of total marine carbonate production. Since
these first estimates are relying on data from theNorwegian shelf only, it is difficult to come upwith really reliable global carbonate productionesti-mates for cold-water reefs at the moment.Therefore the estimates of Wollast (1994); Milli-man & Droxler (1996), and Vecsei (2004) forworldwide shelf areas are considered here. Forbudget considerations it seems feasible to sepa-rate shal-low-water carbonates according toMilliman (1993) into coral reefs, carbonateplatforms which consist of non-reef habitats,such as banks and embayments dominated bythe sedimentation of biogenic and abiogeniccalcareous particles, and shelves which can befurther subdivided into car-bonate-rich and car-bonate-poor shelves (Table 9.1 adopted fromMilliman (1993) and Milliman and Droxler (1996),taking into account Vescei (2004) estimates.
Reefs
Hermatypic coralalgal reefs and their fore-reefsections occupy an area of about 0.35 ⋅106 km2 andare considered as the most productive carbonateenvironments in modern times. Carbonateaccretion is the result of corals and green algaeand, to a minor extent also of benthic foraminifera.Measured on a global scale, the mean calciumcarbonate accumulation in coral reefs is in theorder of 900-2700 g CaCO3 m-2yr-1. The totalpresent-day global CaCO3 production by coralreefs then is 6.5-8.3 ⋅1012 mol yr-1 from whichabout 7⋅1012 mol yr-1 accumulate, while the rest(up to 1.5 ⋅1012 mol yr-1) undergoes physicalerosion and offshore transport, as well asbiological destruction (Milliman 1993).
Carbonate platforms
These platforms are the second important tropicalto subtropical environment where high amounts ofcarbonate are produced and accumulated at waterdepths shallower than 50 m. The areal extension isabout 0.8⋅106 km2. In contrast to reefs, oncarbonate platforms production is mainly carriedout by benthic red/green algae, mollusks andbenthic foraminifera. Estimates of biotic and, to amuch lesser extent, abiotic carbonate production onplatforms range between 300-500 g CaCO3 m
-2 yr-1,which amounts to 4⋅1012 mol yr-1 on a global scale.Accumulation of platform carbonate is difficult toassess because a lot of it is dissolved or can befound as exported material in several 10 to 100 m
313
9.2 Marine Environments of Carbonate Production and Accumulation
thick sediment wedges of Holocene age at thefringes of the platforms. Milliman (1993) estimatesthat only one half of the carbonate accumulateson shallow platforms where it is produced (2⋅1012
mol yr-1), while the other half leaves the shallowwater environment in the form of sediment lobesor wedges downslope.
Continental shelves
Only very little knowledge exists concerning thequantitative carbonate production, export and itsaccumulation on continental shelves. Two shelftypes, carbonate-rich and carbonate-poor shelves,are distinguished by Milliman and Droxler (1996).
Fig. 9.1 Marine calcium carbonate accumulation in a) typical depocenters in shallow waters and b) their globaldistribution (James and Clarke 1997).
9 Marine Carbonates: Their Formation and Destruction
314
Their areas amount to 15 and 10⋅1012 km2,respectively (Hay and Southam 1977). Howeverfor the two shelf types well-constrained estimatesof how much carbonate is produced are missing.In the context of shelves it may be important toseparate two other specific bioherms which couldhave a great potential in shallow-water carbonateproduction. These are sedimentary carbonates ex-clusively built up by the calcareous green algaeHalimeda in tropical latitudes (e.g. Roberts andMacintyre 1988) and extensive biotic cold-watercarbonate reefs or banks as described above formid to high latitudes. For Halimeda bioherms totalcarbonate production and accumulation is about1.5⋅1012 mol yr-1 (Table 9.1) while the estimates foropen shelves given by Wollast (1994) andMilliman and Droxler (1996) do not differentiate a
budget for cold-water shelf areas on its own. Meancarbonate production on lower-latitude shelf areasmay range between 50 and 100 g m-2yr-1 (Table 9.1);in total 6⋅1012 mol yr-1. How much of this annualproduction actually accumulates, is dissolved orexported to the deep-sea remains questionable,because shelf sediments are commonly a mixture ofmodern and relictic components. Moreover,accumulation rates on broad sandy shelves likethat off Argentina are not well-known, becausethey have not been investigated in such detail yetas other shelf environments. According toMilliman and Droxler (1996) half of the productionon carbonate-rich shelves is accumulating (3⋅1012
mol yr-1; Table 9.1) while the other half is eithertransported downslope to the deep sea or dis-solved. For carbonate-poor shelves carbonate
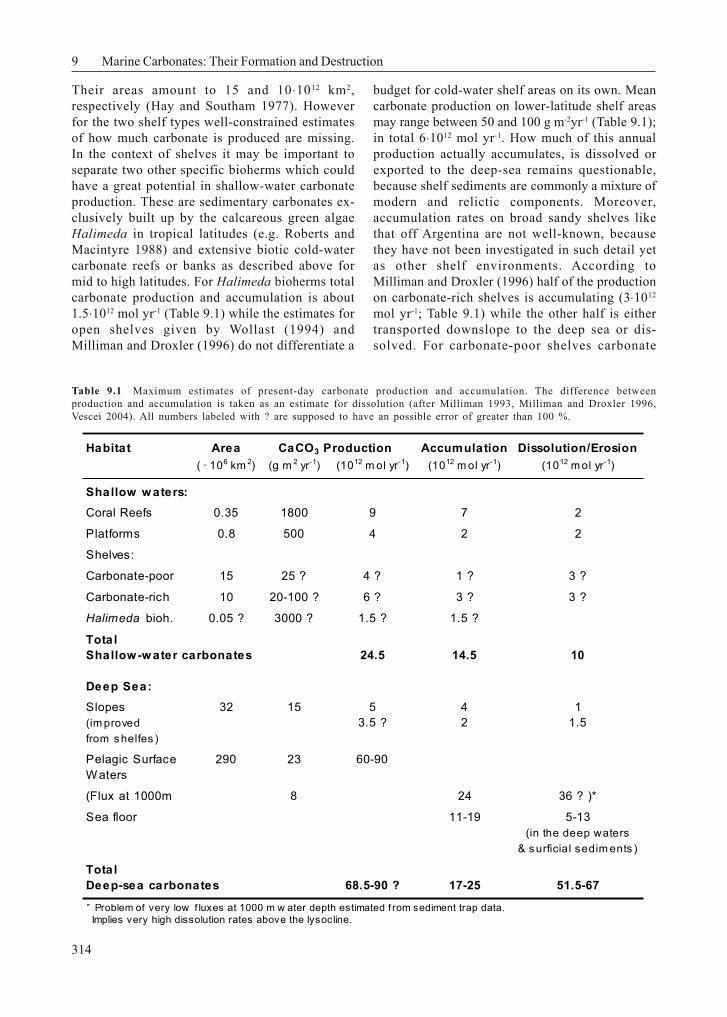
Table 9.1 Maximum estimates of present-day carbonate production and accumulation. The difference betweenproduction and accumulation is taken as an estimate for dissolution (after Milliman 1993, Milliman and Droxler 1996,Vescei 2004). All numbers labeled with ? are supposed to have an possible error of greater than 100 %.
Habitat Area CaCO3 Production Accumulation Dissolution/Erosion( · 106 km 2) (g m 2 yr-1) (1012 m ol yr-1) (1012 m ol yr-1) (1012 m ol yr-1)
Shallow w aters:Coral Reefs 0.35 1800 9 7 2
Platforms 0.8 500 4 2 2
Shelves:
Carbonate-poor 15 25 ? 4 ? 1 ? 3 ?
Carbonate-rich 10 20-100 ? 6 ? 3 ? 3 ?
Halimeda bioh. 0.05 ? 3000 ? 1.5 ? 1.5 ?
TotalShallow -w ater carbonates 24.5 14.5 10
Deep Sea:Slopes 32 15 5 4 1(im proved 3.5 ? 2 1.5from shelfes )
Pelagic Surface 290 23 60-90W aters
(Flux at 1000m 8 24 36 ? )*
Sea floor 11-19 5-13(in the deep waters
& surficial sedim ents )
TotalDeep-sea carbonates 68.5-90 ? 17-25 51.5-67
* Problem of very low f luxes at 1000 m w ater depth estimated f rom sediment trap data. Implies very high dissolution rates above the lysocline.
315
9.2 Marine Environments of Carbonate Production and Accumulation
production should at least exceed 20 g m-2yr-1
which is the average value of planktonic produc-tion in coastal waters. While global carbonate pro-duction on carbonate-poor shelves may be rela-tively high (4⋅1012 mol yr-1; Milliman and Droxler1996), carbonate accumulation in this environmentis negligible.
The rate of total neritic carbonate production inthe modern ocean is roughly 25⋅1012 mol yr-1 fromwhich 60 % (15⋅1012 mol yr-1) accumulate as shallow-water carbonates. The difference, 10⋅1012 mol yr-1, isthe contribution of the neritic environment to thepelagic environment, either in the form of flux oftotal dissolved inorganic carbon or particulate ac-cumulation on continental slopes and in the deepsea.
9.2.2 Pelagic Calcareous Sediments
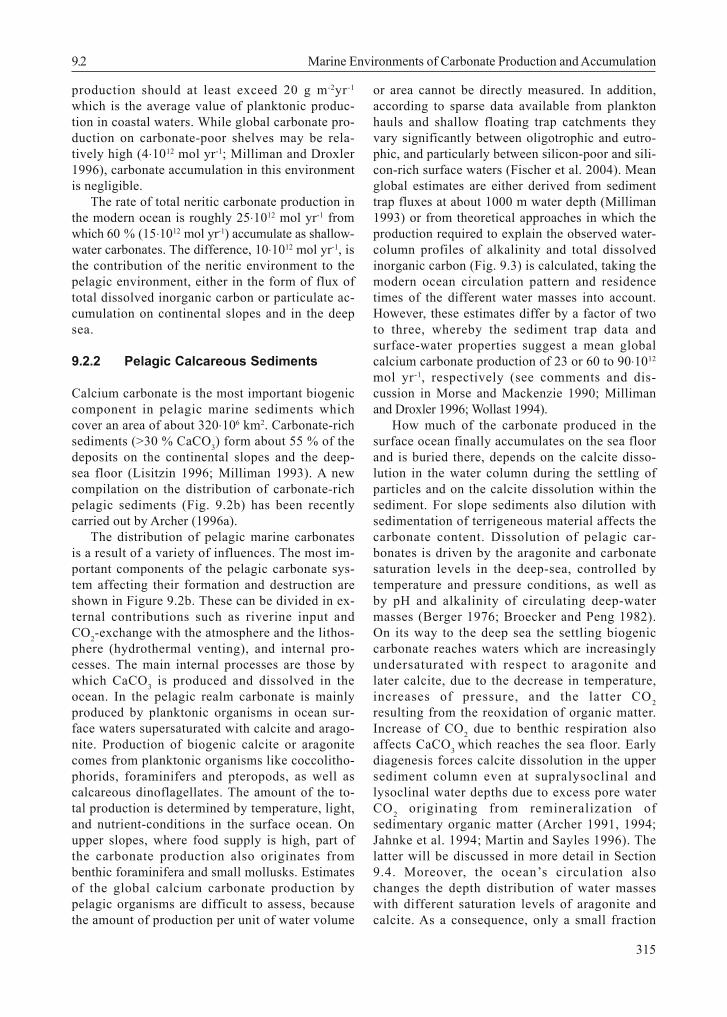
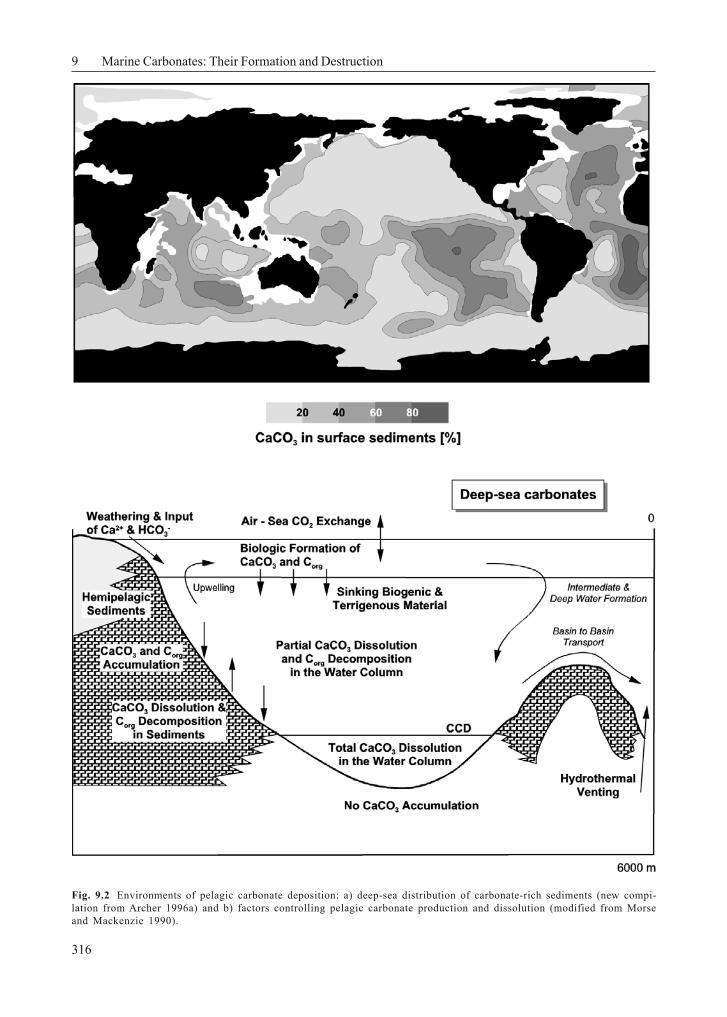
Calcium carbonate is the most important biogeniccomponent in pelagic marine sediments whichcover an area of about 320⋅106 km2. Carbonate-richsediments (>30 % CaCO3) form about 55 % of thedeposits on the continental slopes and the deep-sea floor (Lisitzin 1996; Milliman 1993). A newcompilation on the distribution of carbonate-richpelagic sediments (Fig. 9.2b) has been recentlycarried out by Archer (1996a).
The distribution of pelagic marine carbonatesis a result of a variety of influences. The most im-portant components of the pelagic carbonate sys-tem affecting their formation and destruction areshown in Figure 9.2b. These can be divided in ex-ternal contributions such as riverine input andCO2-exchange with the atmosphere and the lithos-phere (hydrothermal venting), and internal pro-cesses. The main internal processes are those bywhich CaCO3 is produced and dissolved in theocean. In the pelagic realm carbonate is mainlyproduced by planktonic organisms in ocean sur-face waters supersaturated with calcite and arago-nite. Production of biogenic calcite or aragonitecomes from planktonic organisms like coccolitho-phorids, foraminifers and pteropods, as well ascalcareous dinoflagellates. The amount of the to-tal production is determined by temperature, light,and nutrient-conditions in the surface ocean. Onupper slopes, where food supply is high, part ofthe carbonate production also originates frombenthic foraminifera and small mollusks. Estimatesof the global calcium carbonate production bypelagic organisms are difficult to assess, becausethe amount of production per unit of water volume
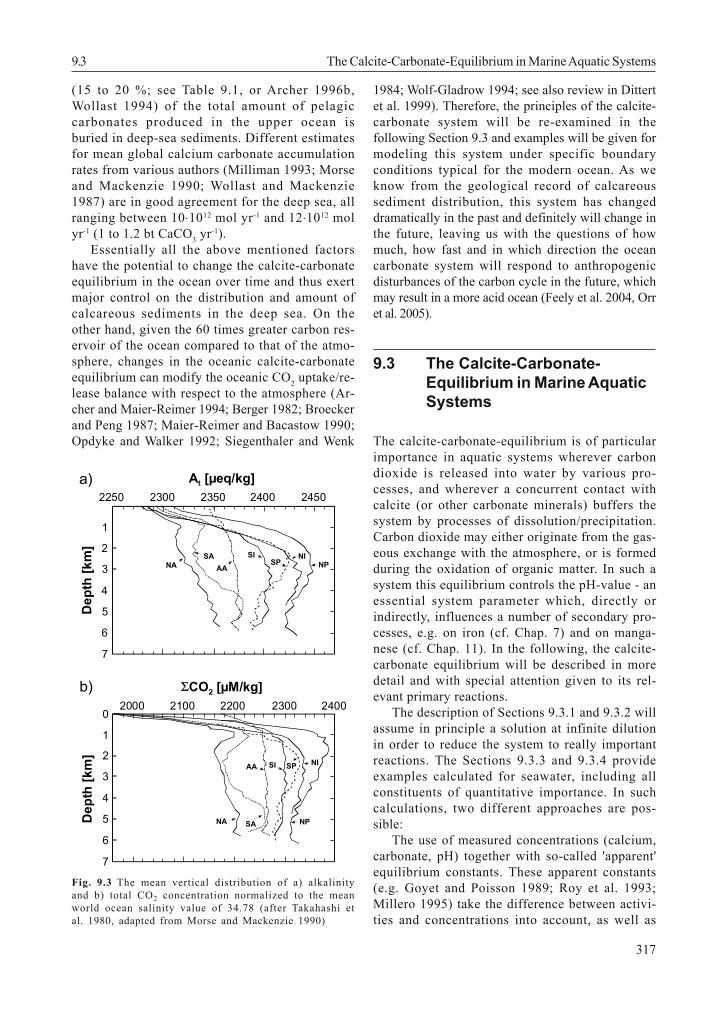
or area cannot be directly measured. In addition,according to sparse data available from planktonhauls and shallow floating trap catchments theyvary significantly between oligotrophic and eutro-phic, and particularly between silicon-poor and sili-con-rich surface waters (Fischer et al. 2004). Meanglobal estimates are either derived from sedimenttrap fluxes at about 1000 m water depth (Milliman1993) or from theoretical approaches in which theproduction required to explain the observed water-column profiles of alkalinity and total dissolvedinorganic carbon (Fig. 9.3) is calculated, taking themodern ocean circulation pattern and residencetimes of the different water masses into account.However, these estimates differ by a factor of twoto three, whereby the sediment trap data andsurface-water properties suggest a mean globalcalcium carbonate production of 23 or 60 to 90⋅1012
mol yr-1, respectively (see comments and dis-cussion in Morse and Mackenzie 1990; Millimanand Droxler 1996; Wollast 1994).
How much of the carbonate produced in thesurface ocean finally accumulates on the sea floorand is buried there, depends on the calcite disso-lution in the water column during the settling ofparticles and on the calcite dissolution within thesediment. For slope sediments also dilution withsedimentation of terrigeneous material affects thecarbonate content. Dissolution of pelagic car-bonates is driven by the aragonite and carbonatesaturation levels in the deep-sea, controlled bytemperature and pressure conditions, as well asby pH and alkalinity of circulating deep-watermasses (Berger 1976; Broecker and Peng 1982).On its way to the deep sea the settling biogeniccarbonate reaches waters which are increasinglyundersaturated with respect to aragonite andlater calcite, due to the decrease in temperature,increases of pressure, and the latter CO2resulting from the reoxidation of organic matter.Increase of CO2 due to benthic respiration alsoaffects CaCO3 which reaches the sea floor. Earlydiagenesis forces calcite dissolution in the uppersediment column even at supralysoclinal andlysoclinal water depths due to excess pore waterCO2 originating from remineralization ofsedimentary organic matter (Archer 1991, 1994;Jahnke et al. 1994; Martin and Sayles 1996). Thelatter will be discussed in more detail in Section9.4. Moreover, the ocean’s circulation alsochanges the depth distribution of water masseswith different saturation levels of aragonite andcalcite. As a consequence, only a small fraction
9 Marine Carbonates: Their Formation and Destruction
316
Fig. 9.2 Environments of pelagic carbonate deposition: a) deep-sea distribution of carbonate-rich sediments (new compi-lation from Archer 1996a) and b) factors controlling pelagic carbonate production and dissolution (modified from Morseand Mackenzie 1990).
317
(15 to 20 %; see Table 9.1, or Archer 1996b,Wollast 1994) of the total amount of pelagiccarbonates produced in the upper ocean isburied in deep-sea sediments. Different estimatesfor mean global calcium carbonate accumulationrates from various authors (Milliman 1993; Morseand Mackenzie 1990; Wollast and Mackenzie1987) are in good agreement for the deep sea, allranging between 10⋅1012 mol yr-1 and 12⋅1012 molyr-1 (1 to 1.2 bt CaCO3 yr-1).
Essentially all the above mentioned factorshave the potential to change the calcite-carbonateequilibrium in the ocean over time and thus exertmajor control on the distribution and amount ofcalcareous sediments in the deep sea. On theother hand, given the 60 times greater carbon res-ervoir of the ocean compared to that of the atmo-sphere, changes in the oceanic calcite-carbonateequilibrium can modify the oceanic CO2 uptake/re-lease balance with respect to the atmosphere (Ar-cher and Maier-Reimer 1994; Berger 1982; Broeckerand Peng 1987; Maier-Reimer and Bacastow 1990;Opdyke and Walker 1992; Siegenthaler and Wenk
1984; Wolf-Gladrow 1994; see also review in Dittertet al. 1999). Therefore, the principles of the calcite-carbonate system will be re-examined in thefollowing Section 9.3 and examples will be given formodeling this system under specific boundaryconditions typical for the modern ocean. As weknow from the geological record of calcareoussediment distribution, this system has changeddramatically in the past and definitely will change inthe future, leaving us with the questions of howmuch, how fast and in which direction the oceancarbonate system will respond to anthropogenicdisturbances of the carbon cycle in the future, whichmay result in a more acid ocean (Feely et al. 2004, Orret al. 2005).
9.3 The Calcite-Carbonate-Equilibrium in Marine AquaticSystems
The calcite-carbonate-equilibrium is of particularimportance in aquatic systems wherever carbondioxide is released into water by various pro-cesses, and wherever a concurrent contact withcalcite (or other carbonate minerals) buffers thesystem by processes of dissolution/precipitation.Carbon dioxide may either originate from the gas-eous exchange with the atmosphere, or is formedduring the oxidation of organic matter. In such asystem this equilibrium controls the pH-value - anessential system parameter which, directly orindirectly, influences a number of secondary pro-cesses, e.g. on iron (cf. Chap. 7) and on manga-nese (cf. Chap. 11). In the following, the calcite-carbonate equilibrium will be described in moredetail and with special attention given to its rel-evant primary reactions.
The description of Sections 9.3.1 and 9.3.2 willassume in principle a solution at infinite dilutionin order to reduce the system to really importantreactions. The Sections 9.3.3 and 9.3.4 provideexamples calculated for seawater, including allconstituents of quantitative importance. In suchcalculations, two different approaches are pos-sible:
The use of measured concentrations (calcium,carbonate, pH) together with so-called 'apparent'equilibrium constants. These apparent constants(e.g. Goyet and Poisson 1989; Roy et al. 1993;Millero 1995) take the difference between activi-ties and concentrations into account, as well as
9.3 The Calcite-Carbonate-Equilibrium in Marine Aquatic Systems
Dep
th [k
m]
1
2
3
4
5
6
7
Dep
th [k
m]
0
1
2
3
4
5
6
7
NASA
AA
SISP
NINP
NA SA
AA SI SP NI
NP
2250 2300 2350 2400 2450
2000 2100 2200 2300 2400
ΣCO2 [µM/kg]
At [µeq/kg]a)
b)
Fig. 9.3 The mean vertical distribution of a) alkalinityand b) total CO2 concentration normalized to the meanworld ocean salinity value of 34.78 (after Takahashi etal. 1980, adapted from Morse and Mackenzie 1990)
9 Marine Carbonates: Their Formation and Destruction
318
the fact, that for instance only part of the mea-sured calcium is present in the form of Ca2+-ions,whereas the rest forms complexes or ion pairs(CaSO4
0aq, CaHCO3
+aq, or others). This is true for
seawater, since the activity coefficients of thesecomplexes or ion pairs with sufficient accuracyexert a constant influence.
The other approach employs a geochemicalcomputer model, such as PHREEQC (Parkhurst1995; also Chap. 15) with an input of a completeseawater analysis. Such a model will then calcu-late the activity coefficients and the species distri-bution of the solution according to the completeanalysis and the constants of the thermodynamicdatabase used. These constants are well knownwith an accuracy which is usually better than theaccuracy of most of our analyses at least for themajor aquatic species. Together with the 'real' con-stant of the solubility product a reliable saturationindex (SI = log Ω) is then calculated. Theconstants of solubility products are not accu-rately known for some minerals, but for calcite,and also for most other carbonates, these con-stants and their dependence on temperature andpressure are very well documented.
Both approaches used in the analysis ofseawater lead to identical results, thus leaving itundetermined which method should be preferredfor seawater analysis. However, for marine pore wa-ter the first approach is not valid, since quitedifferent concentrations of complexes or ion pairsare likely to occur, for instance, sulfate reductionand/or an increase of alkalinity. Therefore we relyon the second approach in our examples andstrongly recommend it for the marine geochemistry.
9.3.1 Primary Reactions of the Calcite-Carbonate-Equilibrium withAtmospheric Contact in InfinitelyDiluted Solutions
Upon making contact with the atmosphere, thepartial pressure (pCO2) of carbon dioxide (CO2,g)determines the concentration of carbonic acid(H2CO0
3,aq) in solution. The equilibrium reaction iswritten as:
CO2,g + H2O ⇔ H2CO30aq (9.1)
The equilibrium is determined by the equation:
KCO2 = [H2CO30aq] / pCO2 · [H2O] = 3.38E-2
(25°C, 1 atm) (9.2)
In this form the reaction combines twodifferent steps: One leads to the formation ofCO2,aq in aqueous solution, and a second leadsfrom CO2,aq to the formation of H2CO3
0aq. The
brackets [...] denote activities, whereas paren-theses embrace molar concentrations. Theactivity of water [H2O] is equal to 1.0 in infi-nitely diluted solutions, whereas it is slightlyless in seawater (0.981). The value of the con-stant KCO2 – as for all other constants in thefollowing – is determined at a temperature 25°Cand under a pressure of 1 atm. The temperaturedependency of the constants was empiricallyinvestigated by Plummer et al. (1978) for therange between 5°C and 60°C. The computerprogram PHREEQC (Parkhurst 1995) alsoaccounts for this temperature dependence. Thepressure dependence, which is important ingreat water depths, is considered only in themodel SOLMINEQ (Kharaka et al. 1988). Theconstants belonging to this program, correctedfor specific water depths, can be extracted andexplicitly entered into the database of thegenerally more versatile model PHREEQC.
The aqueous complex H2CO30
aq dissociates intoprotons and bicarbonate ions:
H2CO30aq ⇔ H+ + HCO3
- (9.3)
This equilibrium is described by the equation:
KH2CO3 = [H+] · [HCO3-] / [H2CO3
0aq] = 4.48E-7
(25°C, 1 atm) (9.4)
The second step of dissociation is determined by:
HCO3- ⇔ H+ + CO3
2- (9.5)
This equilibrium is described by the equation:
KHCO3 = [H+] · [CO32-] / [HCO3
-] = 4.68E-11(25°C, 1 atm) (9.6)
Furthermore, the dissociation of water needs to beincluded:
H2O ⇔ H+ + OH- (9.7)
with the constant KH20:
KH2O = [H+] · [OH-] = 1.00E-14(25°C, 1 atm) (9.8)
319
The contact made by processes of dissolutionand precipitation with the solid phase of calcite isdescribed by the reaction:
CaCO3,calcite ⇔ Ca2+ + CO32- (9.9)
The equilibrium is described by the equation:
Kcalcite = [Ca2+] · [CO32-] = 3.31E-9
(25°C, 1 atm) 9.10
Another essential condition for describing thecalcite-carbonate-equilibrium consists in the ful-fillment of the neutral charge rule. This holds thatcharges may be neither lost nor gained on reach-ing the equilibrium state.
The balance of the charges is done indirectlyon the basis of the ions that are the carriers ofthese charges. Therefore, calculations must con-sider divalent ions twice:
2 (Ca2+) + (H+) = (OH-) + (HCO3-) + 2 (CO3
2-)(9.11)
It should be noted that the parentheses (...) inthis charge balance represent molar concentra-tions, since the chemical activities are not of im-portance here, instead the really existent amountsof the substances and their charges. Equation 9.11describes in a simplified form the conditions inwhich the equilibrium state is reached startingfrom pure water. Only in this case all final concen-trations produce charges equal to zero in thebalance.
In an impure system, any initial concentration(...)i or initial activity [...]i may be present. In thiscontext, the index 'i' stands for 'initial'. On the ba-sis of these concentrations, those reached on at-taining the final equilibrium state (...)f or [...]f willthen have to be sought for. The index 'f' in thiscase stands for 'final'. The statement as to thecharge balance made in Equation 9.11 is not ac-complished by observing the total concentrationof each reactant, but by the difference between'initial' to 'final'. The generalized case described inEquation 9.12 resumes the condition of Equation9.11 in which all initial concentrations are set tozero (pure water).
2 (Ca2+)f – 2 (Ca2+)i + (H+)f – (H+)i =(OH-)f – (OH-)i + (HCO3
-)f – (HCO3-)i +
2 (CO32-)f – 2 (CO3
2-)i (9.12)
In a system following this description, the so-lution for all six variables (Ca2+), (H+), (OH-),(H2CO3
0), (HCO3-), (CO3
2-) is sought for the condi-tion of a final equilibrium state determined by theEquations 9.2, 9.4, 9.6, 9.8, 9.10, and 9.12. It shouldbe noted that in Equations 9.2, 9.4, 9.6, 9.8, and9.10 the activities written in brackets [...] are to beunderstood as final activities [...]f, which are prod-ucts of an activity coefficient and the single con-centrations in equilibrium (...)f (cf. Eq. 15.2 in Sect.15.1.1). For a system at infinite dilution, however,these activity coefficients are 1.0, and thus concen-trations are (...) equal to activities [...].
The system of six non-linear equations with sixunknown variables can be solved mathematicallyfor (H+)f by inserting the equations into eachother until only constants, initial concentrations(...)i, and pCO2 describe the complete equation.This way of solving the problem leads to a cubicequation for which an analytical solution exists. Inpractice, however, this strategy is irrelevant, sincesuch a set of equations cannot be analyticallysolved for other boundary conditions (e.g. a sys-tem which is closed with respect to CO2, havingno contact with the atmosphere) or if more con-stituents are included (e.g. complex species likeCaHCO3
+aq or CaCO3
0aq). In such a case, it must be
solved by an iteration process, as will be de-scribed in the succeeding section. The applicationof spreadsheet calculation programs make such aniterative solution easy to find by pursuing theprocedures below:
First, the concentration of (H2CO30)f is calcu-
lated on the basis of the given pCO2 using Equa-tion 9.2
Then, the pH-value of the equilibrium is esti-mated. For a first approximation, the pH-value de-rived from the 'initial' concentration of (H+)i may beused. But any other pH-value, for instance pH 7,is permitted as well.
With this pH-value, the concentrations of (H+)fand (OH-)f are calculated using Equation 9.8.
Successively, (HCO3-)f and (CO3
-)f are calcu-lated using the Equations 9.4 and 9.6 and the val-ues so far determined. The concentration of (Ca2+)fis obtained from Equation 9.12.
Now the saturation index (SIcalcite) can be calcu-lated with Equation 9.10 (cf. Eq. 15.1 in Sect.15.1.1). If the saturation index equals zero, thenthe estimation of the pH-value in equilibrium, asmentioned in step 2, has been correct, as well asall other equilibrium concentrations (...)f calculatedin steps 3 and 4. If the saturation index (SIcalcite) is
9.3 The Calcite-Carbonate-Equilibrium in Marine Aquatic Systems
9 Marine Carbonates: Their Formation and Destruction
320
not equal to zero with sufficient accuracy, theestimation for the pH in step 2 will have to beimproved until the correct value is found.
Irrespective whether a solution to this systemis found in the iterative manner described, orwhether it is solved by finding an analytical solu-tion of the cubic equation, the pH-value of theequilibrium is at all times determined by the partialpressure pCO2 in the atmosphere. As it remains incontact with the solution, such a system isreferred to as open to CO2. It is characteristic ofsuch systems that the reactions can cause the re-lease of CO2 into the atmosphere at any time andthat CO2 can be drawn from the atmosphere with-out directly affecting total atmospheric pCO2.
9.3.2 Primary Reactions of the Calcite-Carbonate-Equilibrium withoutAtmospheric Contact
A system which is closed to CO2 exists whereverthe final calcite-carbonate-equilibrium is reachedwithout any concurrent uptake or release of atmo-spheric CO2 in its process. This implies that theEquations 9.1 and 9.2 are no longer valid. In theirstead, a balance of various C-species is related tocalcium. This balance maintains that the sum of C-species must equal the calcium concentration insolution, since both can enter the solution onlyby dissolution of calcite or aragonite:
(Ca2+) = (H2CO30) + (HCO3
-) + (CO32-) (9.13)
Analogous to Equations 9.11 and 9.12, Equa-tion 9.13 is only valid if the initial solution con-sists of pure water. In the normal case, in whichthe solution will already contain dissolved car-bonate- and/or calcium ions, the difference be-tween equilibrium concentrations (...)f and the ini-tial concentrations (...)i needs to be regarded:
(Ca2+)f – (Ca2+)i =(H2CO3
0)f – (H2CO30)i + (HCO3
-)f –(HCO3
-)i + (CO32-)f – (CO3
2-)i (9.14)
The six Equations 9.4, 9.6, 9.8, 9.10, 9.12, and9.14 must now be solved for the six variables(Ca2+), (H+), (OH-), (H2CO3
0), (HCO3-), (CO3
2-).There is no analytical solution for this non-linearequation system. If there were one, it would be ir-relevant because an iterative solution, similar tothe one described in the previous section, wouldalways be easier to handle and besides be more
reliable. However, still independent of the methodof mathematical solution is the fact that the equi-librium is exclusively determined by the carbonateconcentration which the system previously con-tained and which is defined by the concentrations(...)i. At this particular point, the amount of CO2would also have to be considered which is liber-ated into such a system, e.g. from the oxidation oforganic matter. This amount would be simplyadded to the 'initial' concentrations and wouldinfluence the equilibrium in the same way as thepre-existing carbonate.
9.3.3 Secondary Reactions of the Calcite-Carbonate-Equilibrium in Seawater
In seawater, the differences between activities andconcentrations must always be considered (cf.Sect. 15.1.1). The activity coefficients for monova-lent ions in seawater assume a value around 0.75,for divalent ions this value usually lies around 0.2.In most cases of practical importance, the activitycoefficients can be regarded with sufficientexactness as constants, since they are, over thewhole range of ionic strengths in solution,predominately bound to the concentrations ofsodium, chloride, and sulfate which are not di-rectly involved in the calcite-carbonate-equilib-rium. The proportion of ionic complexes in theoverall calcium or carbonate content can mostlybe considered with sufficient exactness as con-stant in the free water column of the ocean. Yet,this cannot be applied to pore water which fre-quently contains totally different concentrationsand distributions of complex species due to diage-netic reactions.
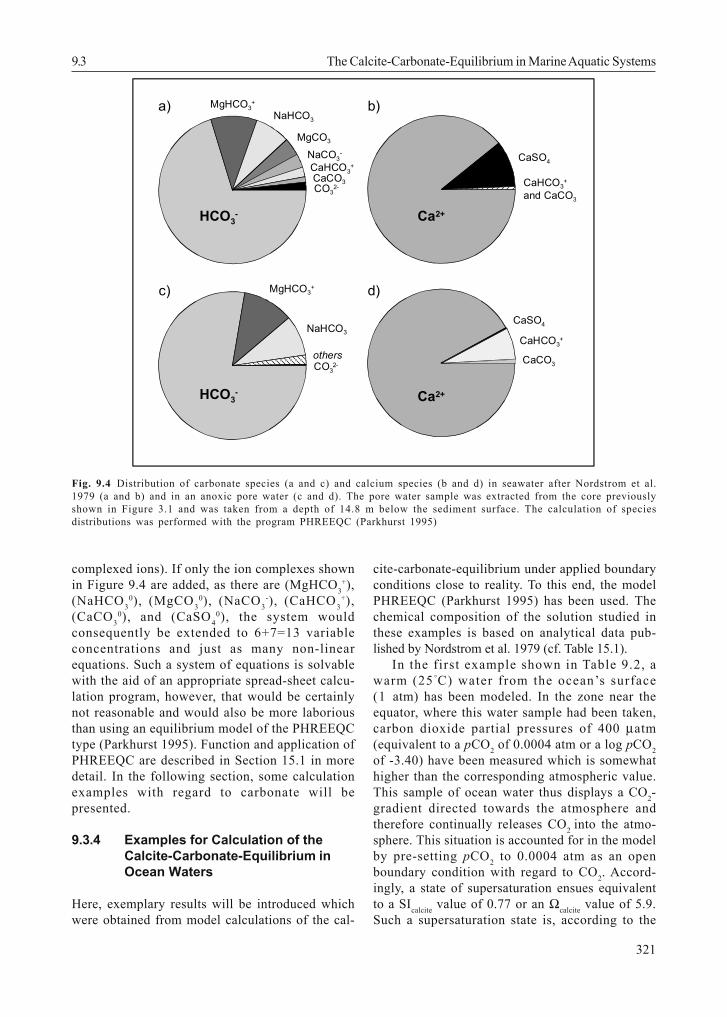
Figure 9.4 shows the distribution of carbonateand calcium species in ocean water and in an an-oxic pore water, calculated with the programPHREEQC (Parkhurst 1995). It is evident thatabout 10 % of total calcium is prevalent in theform of ionic complexes and 25 – 30 % of the totaldissolved carbonate in different ionic complexesother than bicarbonate. These ionic complexes arenot included in the equations of Sections 9.3.1and 9.3.2. Accordingly, the omission of thesecomplexes would lead to an erraneous calculationof the equilibrium. The inclusion of each complexshown in Figure 9.4 implies further additions tothe system of equations, consisting in anotherconcentration variable (the concentration of thecomplex) and a further equation (equilibrium of thecomplex concentration relative to the non-
321
complexed ions). If only the ion complexes shownin Figure 9.4 are added, as there are (MgHCO3
+),(NaHCO3
0), (MgCO30), (NaCO3
-), (CaHCO3+),
(CaCO30), and (CaSO4
0), the system wouldconsequently be extended to 6+7=13 variableconcentrations and just as many non-linearequations. Such a system of equations is solvablewith the aid of an appropriate spread-sheet calcu-lation program, however, that would be certainlynot reasonable and would also be more laboriousthan using an equilibrium model of the PHREEQCtype (Parkhurst 1995). Function and application ofPHREEQC are described in Section 15.1 in moredetail. In the following section, some calculationexamples with regard to carbonate will bepresented.
9.3.4 Examples for Calculation of theCalcite-Carbonate-Equilibrium inOcean Waters
Here, exemplary results will be introduced whichwere obtained from model calculations of the cal-
cite-carbonate-equilibrium under applied boundaryconditions close to reality. To this end, the modelPHREEQC (Parkhurst 1995) has been used. Thechemical composition of the solution studied inthese examples is based on analytical data pub-lished by Nordstrom et al. 1979 (cf. Table 15.1).
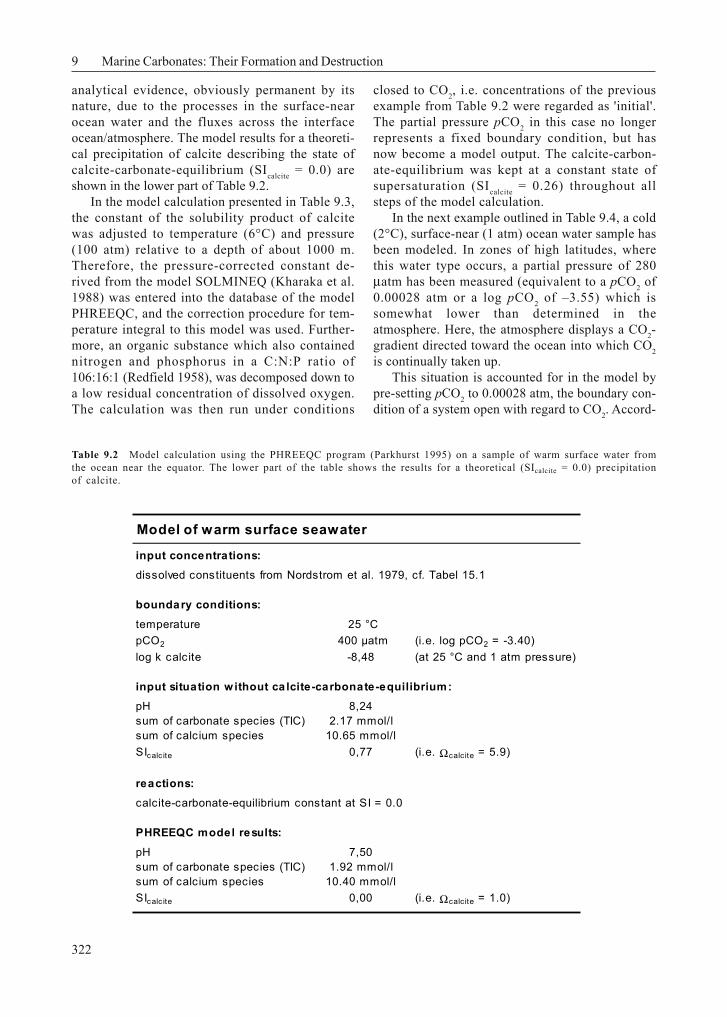
In the first example shown in Table 9.2, awarm (25°C) water from the ocean’s surface(1 atm) has been modeled. In the zone near theequator, where this water sample had been taken,carbon dioxide partial pressures of 400 µatm(equivalent to a pCO2 of 0.0004 atm or a log pCO2of -3.40) have been measured which is somewhathigher than the corresponding atmospheric value.This sample of ocean water thus displays a CO2-gradient directed towards the atmosphere andtherefore continually releases CO2 into the atmo-sphere. This situation is accounted for in the modelby pre-setting pCO2 to 0.0004 atm as an openboundary condition with regard to CO2. Accord-ingly, a state of supersaturation ensues equivalentto a SIcalcite value of 0.77 or an Ωcalcite value of 5.9.Such a supersaturation state is, according to the
MgHCO3+
CO32-
NaHCO3
MgCO3
NaCO3-
CaHCO3+
CaCO3
HCO3-
HCO3-
MgHCO3+
NaHCO3
CO32-
others
Ca2+
Ca2+
CaSO4
CaHCO3+
CaCO3
CaSO4
CaHCO3+
and CaCO3
a) b)
c) d)
Fig. 9.4 Distribution of carbonate species (a and c) and calcium species (b and d) in seawater after Nordstrom et al.1979 (a and b) and in an anoxic pore water (c and d). The pore water sample was extracted from the core previouslyshown in Figure 3.1 and was taken from a depth of 14.8 m below the sediment surface. The calculation of speciesdistributions was performed with the program PHREEQC (Parkhurst 1995)
9.3 The Calcite-Carbonate-Equilibrium in Marine Aquatic Systems
9 Marine Carbonates: Their Formation and Destruction
322
analytical evidence, obviously permanent by itsnature, due to the processes in the surface-nearocean water and the fluxes across the interfaceocean/atmosphere. The model results for a theoreti-cal precipitation of calcite describing the state ofcalcite-carbonate-equilibrium (SIcalcite = 0.0) areshown in the lower part of Table 9.2.
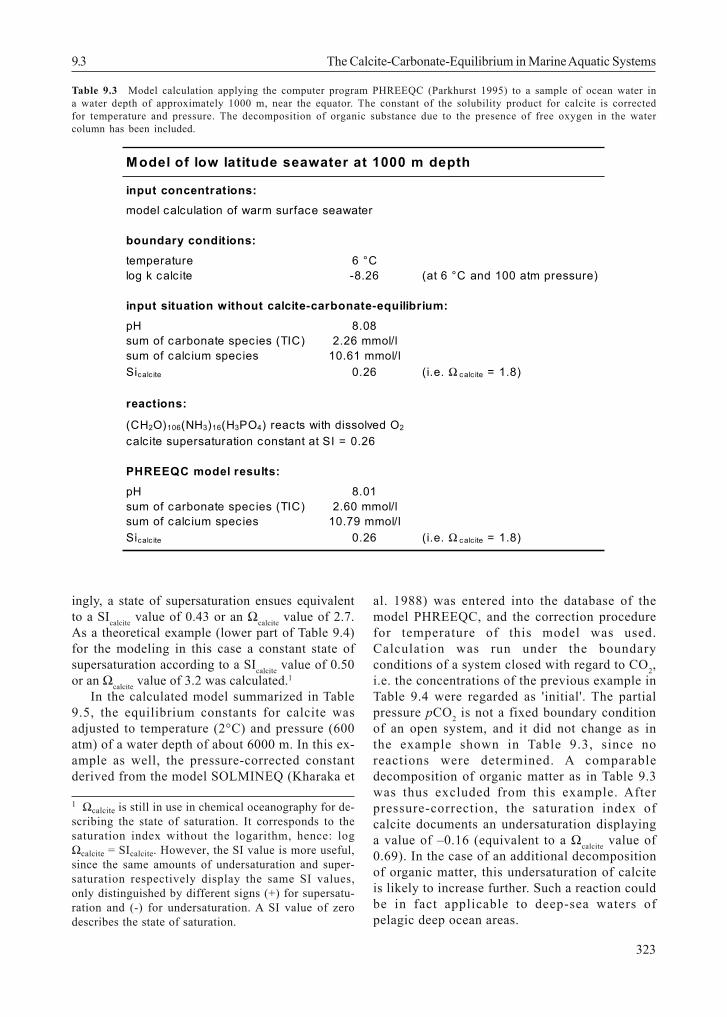
In the model calculation presented in Table 9.3,the constant of the solubility product of calcitewas adjusted to temperature (6°C) and pressure(100 atm) relative to a depth of about 1000 m.Therefore, the pressure-corrected constant de-rived from the model SOLMINEQ (Kharaka et al.1988) was entered into the database of the modelPHREEQC, and the correction procedure for tem-perature integral to this model was used. Further-more, an organic substance which also containednitrogen and phosphorus in a C:N:P ratio of106:16:1 (Redfield 1958), was decomposed down toa low residual concentration of dissolved oxygen.The calculation was then run under conditions
closed to CO2, i.e. concentrations of the previousexample from Table 9.2 were regarded as 'initial'.The partial pressure pCO2 in this case no longerrepresents a fixed boundary condition, but hasnow become a model output. The calcite-carbon-ate-equilibrium was kept at a constant state ofsupersaturation (SIcalcite = 0.26) throughout allsteps of the model calculation.
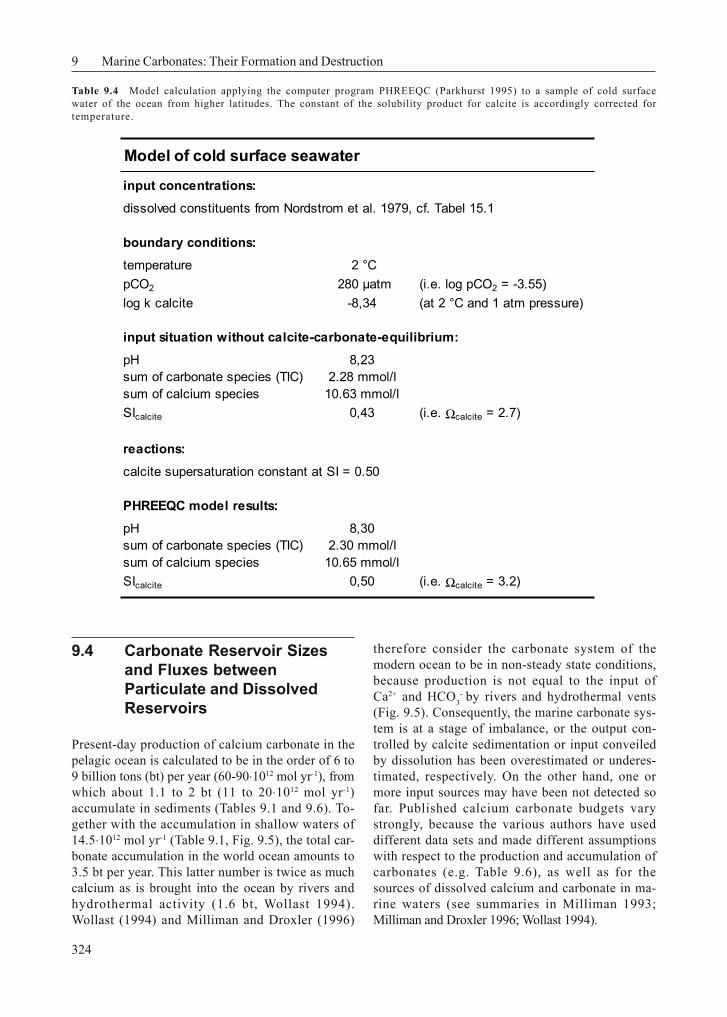
In the next example outlined in Table 9.4, a cold(2°C), surface-near (1 atm) ocean water sample hasbeen modeled. In zones of high latitudes, wherethis water type occurs, a partial pressure of 280µatm has been measured (equivalent to a pCO2 of0.00028 atm or a log pCO2 of –3.55) which issomewhat lower than determined in theatmosphere. Here, the atmosphere displays a CO2-gradient directed toward the ocean into which CO2is continually taken up.
This situation is accounted for in the model bypre-setting pCO2 to 0.00028 atm, the boundary con-dition of a system open with regard to CO2. Accord-
Table 9.2 Model calculation using the PHREEQC program (Parkhurst 1995) on a sample of warm surface water fromthe ocean near the equator. The lower part of the table shows the results for a theoretical (SIcalcite = 0.0) precipitationof calcite.
Model of warm surface seawater
input concentrations:
dissolved constituents from Nordstrom et al. 1979, cf. Tabel 15.1
boundary conditions:
temperature 25 °CpCO2 400 µatm (i.e. log pCO2 = -3.40)log k calcite -8,48 (at 25 °C and 1 atm pressure)
input situation w ithout ca lcite-carbonate-equilibrium:
pH 8,24sum of carbonate species (TIC) 2.17 mmol/lsum of calcium species 10.65 mmol/lSIcalc ite 0,77 (i.e. Ωcalcite = 5.9)
reactions:
calcite-carbonate-equilibrium constant at SI = 0.0
PHREEQC model results:
pH 7,50sum of carbonate species (TIC) 1.92 mmol/lsum of calcium species 10.40 mmol/lSIcalc ite 0,00 (i.e. Ωcalcite = 1.0)
323
ingly, a state of supersaturation ensues equivalentto a SIcalcite value of 0.43 or an Ωcalcite value of 2.7.As a theoretical example (lower part of Table 9.4)for the modeling in this case a constant state ofsupersaturation according to a SIcalcite value of 0.50or an Ωcalcite value of 3.2 was calculated.1
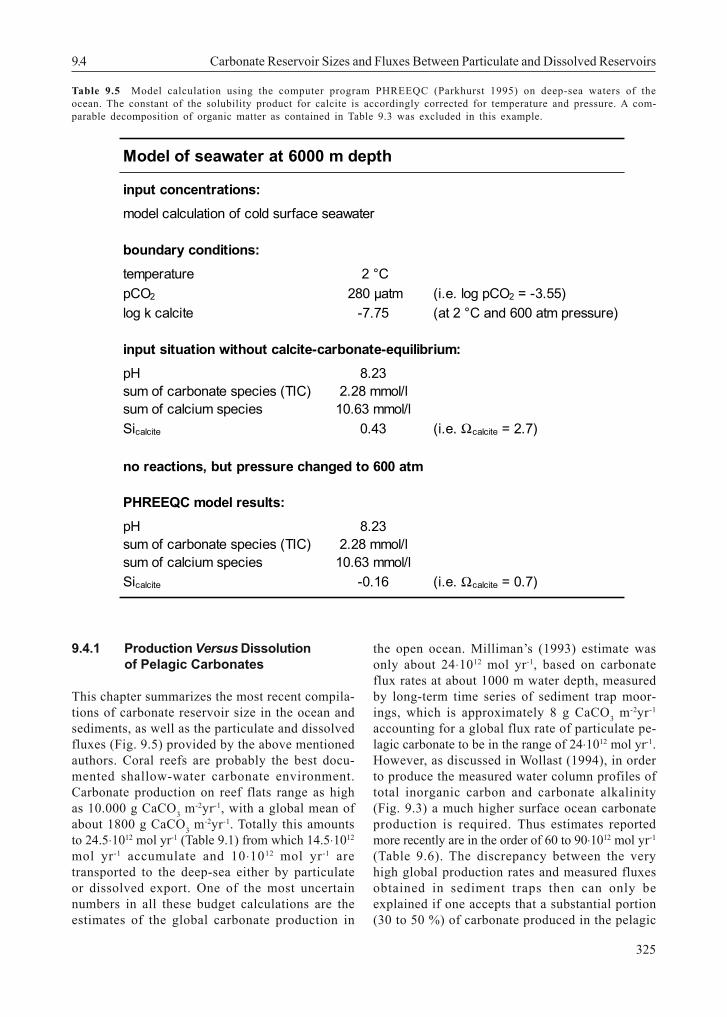
In the calculated model summarized in Table9.5, the equilibrium constants for calcite wasadjusted to temperature (2°C) and pressure (600atm) of a water depth of about 6000 m. In this ex-ample as well, the pressure-corrected constantderived from the model SOLMINEQ (Kharaka et
al. 1988) was entered into the database of themodel PHREEQC, and the correction procedurefor temperature of this model was used.Calculation was run under the boundaryconditions of a system closed with regard to CO2,i.e. the concentrations of the previous example inTable 9.4 were regarded as 'initial'. The partialpressure pCO2 is not a fixed boundary conditionof an open system, and it did not change as inthe example shown in Table 9.3, since noreactions were determined. A comparabledecomposition of organic matter as in Table 9.3was thus excluded from this example. Afterpressure-correction, the saturation index ofcalcite documents an undersaturation displayinga value of –0.16 (equivalent to a Ωcalcite value of0.69). In the case of an additional decompositionof organic matter, this undersaturation of calciteis likely to increase further. Such a reaction couldbe in fact applicable to deep-sea waters ofpelagic deep ocean areas.
Model of low latitude seawater at 1000 m depth
input concentrations:model calculation of warm surface seawater
boundary conditions:
temperature 6 °Clog k calc ite -8.26 (at 6 °C and 100 atm pressure)
input situation without calcite-carbonate-equilibrium:
pH 8.08sum of carbonate species (TIC) 2.26 mmol/lsum of calc ium species 10.61 mmol/lSicalc ite 0.26 (i.e. Ω c alc ite = 1.8)
reactions:
(CH2O)106(NH3)16(H3PO4) reacts with dissolved O2
calc ite supersaturation constant at SI = 0.26
PHREEQC model results:
pH 8.01sum of carbonate species (TIC) 2.60 mmol/lsum of calc ium species 10.79 mmol/lSicalc ite 0.26 (i.e. Ω c alc ite = 1.8)
Table 9.3 Model calculation applying the computer program PHREEQC (Parkhurst 1995) to a sample of ocean water ina water depth of approximately 1000 m, near the equator. The constant of the solubility product for calcite is correctedfor temperature and pressure. The decomposition of organic substance due to the presence of free oxygen in the watercolumn has been included.
9.3 The Calcite-Carbonate-Equilibrium in Marine Aquatic Systems
1 Ωcalcite is still in use in chemical oceanography for de-scribing the state of saturation. It corresponds to thesaturation index without the logarithm, hence: logΩcalcite = SIcalcite. However, the SI value is more useful,since the same amounts of undersaturation and super-saturation respectively display the same SI values,only distinguished by different signs (+) for supersatu-ration and (-) for undersaturation. A SI value of zerodescribes the state of saturation.
9 Marine Carbonates: Their Formation and Destruction
324
9.4 Carbonate Reservoir Sizesand Fluxes betweenParticulate and DissolvedReservoirs
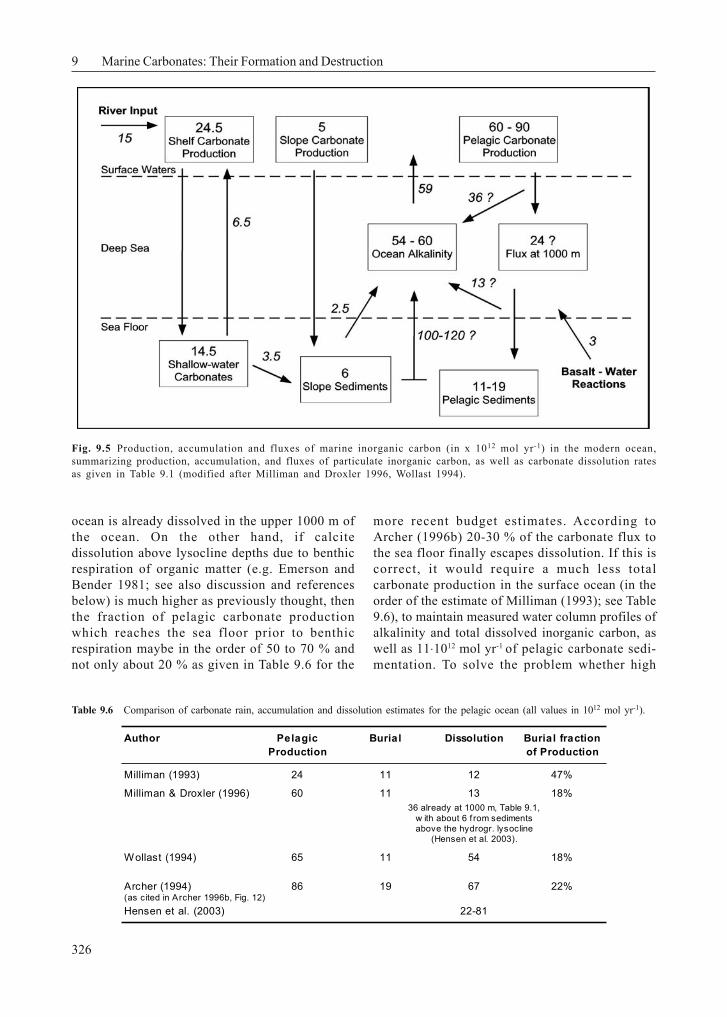
Present-day production of calcium carbonate in thepelagic ocean is calculated to be in the order of 6 to9 billion tons (bt) per year (60-90⋅1012 mol yr-1), fromwhich about 1.1 to 2 bt (11 to 20⋅1012 mol yr-1)accumulate in sediments (Tables 9.1 and 9.6). To-gether with the accumulation in shallow waters of14.5⋅1012 mol yr-1 (Table 9.1, Fig. 9.5), the total car-bonate accumulation in the world ocean amounts to3.5 bt per year. This latter number is twice as muchcalcium as is brought into the ocean by rivers andhydrothermal activity (1.6 bt, Wollast 1994).Wollast (1994) and Milliman and Droxler (1996)
therefore consider the carbonate system of themodern ocean to be in non-steady state conditions,because production is not equal to the input ofCa2+ and HCO3
- by rivers and hydrothermal vents(Fig. 9.5). Consequently, the marine carbonate sys-tem is at a stage of imbalance, or the output con-trolled by calcite sedimentation or input conveiledby dissolution has been overestimated or underes-timated, respectively. On the other hand, one ormore input sources may have been not detected sofar. Published calcium carbonate budgets varystrongly, because the various authors have useddifferent data sets and made different assumptionswith respect to the production and accumulation ofcarbonates (e.g. Table 9.6), as well as for thesources of dissolved calcium and carbonate in ma-rine waters (see summaries in Milliman 1993;Milliman and Droxler 1996; Wollast 1994).
Table 9.4 Model calculation applying the computer program PHREEQC (Parkhurst 1995) to a sample of cold surfacewater of the ocean from higher latitudes. The constant of the solubility product for calcite is accordingly corrected fortemperature.
Model of cold surface seawater
input concentrations:
dissolved constituents from Nordstrom et al. 1979, cf. Tabel 15.1
boundary conditions:
temperature 2 °CpCO2 280 µatm (i.e. log pCO2 = -3.55)log k calcite -8,34 (at 2 °C and 1 atm pressure)
input situation without calcite-carbonate-equilibrium:
pH 8,23sum of carbonate species (TIC) 2.28 mmol/lsum of calcium species 10.63 mmol/lSIcalcite 0,43 (i.e. Ωcalcite = 2.7)
reactions:
calcite supersaturation constant at SI = 0.50
PHREEQC model results:
pH 8,30sum of carbonate species (TIC) 2.30 mmol/lsum of calcium species 10.65 mmol/lSIcalcite 0,50 (i.e. Ωcalcite = 3.2)
325
9.4.1 Production Versus Dissolutionof Pelagic Carbonates
This chapter summarizes the most recent compila-tions of carbonate reservoir size in the ocean andsediments, as well as the particulate and dissolvedfluxes (Fig. 9.5) provided by the above mentionedauthors. Coral reefs are probably the best docu-mented shallow-water carbonate environment.Carbonate production on reef flats range as highas 10.000 g CaCO3 m
-2yr-1, with a global mean ofabout 1800 g CaCO3 m
-2yr-1. Totally this amountsto 24.5⋅1012 mol yr-1 (Table 9.1) from which 14.5⋅1012
mol yr-1 accumulate and 10⋅1012 mol yr-1 aretransported to the deep-sea either by particulateor dissolved export. One of the most uncertainnumbers in all these budget calculations are theestimates of the global carbonate production in
the open ocean. Milliman’s (1993) estimate wasonly about 24⋅1012 mol yr-1, based on carbonateflux rates at about 1000 m water depth, measuredby long-term time series of sediment trap moor-ings, which is approximately 8 g CaCO3 m-2yr-1
accounting for a global flux rate of particulate pe-lagic carbonate to be in the range of 24⋅1012 mol yr-1.However, as discussed in Wollast (1994), in orderto produce the measured water column profiles oftotal inorganic carbon and carbonate alkalinity(Fig. 9.3) a much higher surface ocean carbonateproduction is required. Thus estimates reportedmore recently are in the order of 60 to 90⋅1012 mol yr-1
(Table 9.6). The discrepancy between the veryhigh global production rates and measured fluxesobtained in sediment traps then can only beexplained if one accepts that a substantial portion(30 to 50 %) of carbonate produced in the pelagic
Model of seawater at 6000 m depth
input concentrations:model calculation of cold surface seawater
boundary conditions:temperature 2 °CpCO2 280 µatm (i.e. log pCO2 = -3.55)log k calcite -7.75 (at 2 °C and 600 atm pressure)
input situation without calcite-carbonate-equilibrium:pH 8.23sum of carbonate species (TIC) 2.28 mmol/lsum of calcium species 10.63 mmol/lSicalcite 0.43 (i.e. Ωcalcite = 2.7)
no reactions, but pressure changed to 600 atm
PHREEQC model results:pH 8.23sum of carbonate species (TIC) 2.28 mmol/lsum of calcium species 10.63 mmol/lSicalcite -0.16 (i.e. Ωcalcite = 0.7)
Table 9.5 Model calculation using the computer program PHREEQC (Parkhurst 1995) on deep-sea waters of theocean. The constant of the solubility product for calcite is accordingly corrected for temperature and pressure. A com-parable decomposition of organic matter as contained in Table 9.3 was excluded in this example.
9.4 Carbonate Reservoir Sizes and Fluxes Between Particulate and Dissolved Reservoirs
9 Marine Carbonates: Their Formation and Destruction
326
ocean is already dissolved in the upper 1000 m ofthe ocean. On the other hand, if calcitedissolution above lysocline depths due to benthicrespiration of organic matter (e.g. Emerson andBender 1981; see also discussion and referencesbelow) is much higher as previously thought, thenthe fraction of pelagic carbonate productionwhich reaches the sea floor prior to benthicrespiration maybe in the order of 50 to 70 % andnot only about 20 % as given in Table 9.6 for the
more recent budget estimates. According toArcher (1996b) 20-30 % of the carbonate flux tothe sea floor finally escapes dissolution. If this iscorrect, it would require a much less totalcarbonate production in the surface ocean (in theorder of the estimate of Milliman (1993); see Table9.6), to maintain measured water column profiles ofalkalinity and total dissolved inorganic carbon, aswell as 11⋅1012 mol yr-1 of pelagic carbonate sedi-mentation. To solve the problem whether high
Fig. 9.5 Production, accumulation and fluxes of marine inorganic carbon (in x 1012 mol yr-1) in the modern ocean,summarizing production, accumulation, and fluxes of particulate inorganic carbon, as well as carbonate dissolution ratesas given in Table 9.1 (modified after Milliman and Droxler 1996, Wollast 1994).
Table 9.6 Comparison of carbonate rain, accumulation and dissolution estimates for the pelagic ocean (all values in 1012 mol yr-1).
Author Pelagic Burial Dissolution Burial fractionProduction of Production
Milliman (1993) 24 11 12 47%
Milliman & Droxler (1996) 60 11 13 18%36 already at 1000 m, Table 9.1,
w ith about 6 f rom sedimentsabove the hydrogr. lysocline
(Hensen et al. 2003).
Wollast (1994) 65 11 54 18%
Archer (1994) 86 19 67 22%(as cited in Archer 1996b, Fig. 12)Hensen et al. (2003) 22-81
327
values of alkalinity and total dissolved inorganiccarbon in intermediate and deep waters are the re-sult of dissolving calcite particles settling throughthe water column, or of sedimentary dissolutionabove the lysocline, would require better know-ledge of the total amount of calcite production inthe surface ocean and of the dissolution rates inthe sediment. While the first is very difficult tomeasure, the second may be reached by improvingdata sets of inorganic carbon flux rates from thesediment to ocean at intermediate and deep waterlevels. The next Section 9.4.2. describes the ap-proach of estimating the fluxes of total carbon andinorganic carbon resulting from calcite dissolutionin more detail.
9.4.2 Inorganic and Organic CarbonRelease from Deep Sea Sediments
Although only a small fraction of carbon arrivingat the seafloor is finally buried, over geologicaltime scales deep sea sediments have formed thelargest reservoir of carbon on earth mainlyconsisting of biogenic carbonates (~50 Mio. Gt)and organic detritus (~12 Mio. Gt; i.e. de Baar &Suess, 1993). This huge storage potential ofmarine carbonates is a major factor for maintainingreasonably low atmospheric CO2-levels in earthhistory. However, the ratio of accumulation versusrecycling of carbon at the seafloor reflects adynamic equilibrium depending on various exter-nal forcing factors. Hence, the question for the“how much is being recycled” is an importantissue, but quite difficult to explore.
Diagenetic mineralization and dissolutionprocesses in deep sea sediments have beenrecognized as important control factors andnumerous efforts have been made to estimate thecontribution by benthic reflux to the oceanbudget. The diagenetic reactions are most intenseat the sediment-water interface where the mostlabile components become rapidly mineralized.Hence, this is the place where the determinationbetween burial and recycling is made. The drivingforces of carbon release from the sediments arethe degradation of organic matter and thedissolution of calcium carbonate, which are in turndependent on the supply by the remnants ofbiological production in the surface waters.However, the dissolution of calcium carbonate indeep-sea sediments is controlled by two majorfactors, the degree of undersaturation of the deepocean waters with respect to calcite and aragonite,
and the reaction with carbon dioxide fromrespiration processes. Two of the key parametersare thus, the “rain ratio” (CCaCO3 /CPOC) of thesinking material and the water depth of finaldeposition, above or below the CO3
2- saturationhorizon (lysocline). Because the solubility ofcalcium carbonate increases with increasingpressure, the ocean is usually super-saturated atshallow to intermediate depths and undersatura-ted in the deep basins.
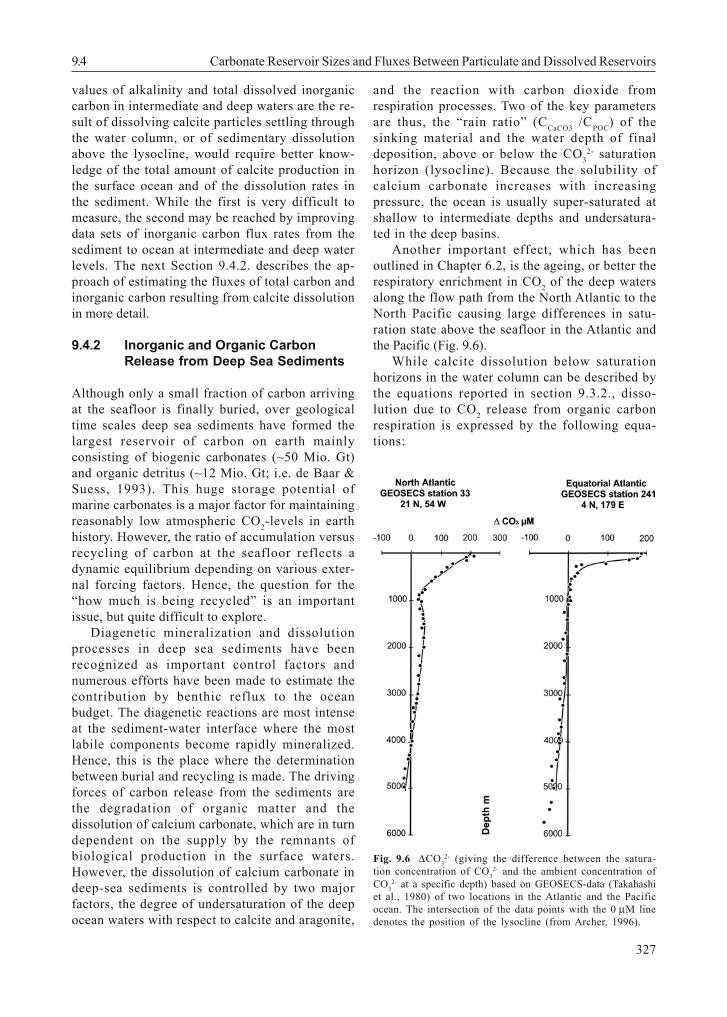
Another important effect, which has beenoutlined in Chapter 6.2, is the ageing, or better therespiratory enrichment in CO2 of the deep watersalong the flow path from the North Atlantic to theNorth Pacific causing large differences in satu-ration state above the seafloor in the Atlantic andthe Pacific (Fig. 9.6).
While calcite dissolution below saturationhorizons in the water column can be described bythe equations reported in section 9.3.2., disso-lution due to CO2 release from organic carbonrespiration is expressed by the following equa-tions:
9.4 Carbonate Reservoir Sizes and Fluxes Between Particulate and Dissolved Reservoirs
Fig. 9.6 ∆CO32- (giving the difference between the satura-
tion concentration of CO32- and the ambient concentration of
CO32- at a specific depth) based on GEOSECS-data (Takahashi
et al., 1980) of two locations in the Atlantic and the Pacificocean. The intersection of the data points with the 0 µM linedenotes the position of the lysocline (from Archer, 1996).
9 Marine Carbonates: Their Formation and Destruction
328
(CH2O)106(NH3)16(H3PO4) + 138 O2 →
106 HCO3- + 16 NO3
- + HPO42- + 16 H2O + 124 H+
(9.15)
124 CaCO3 + 124 H+ → 124 HCO3- + 124 Ca2+
(9.16)
where organic matter with Redfield C:N:P ratio isoxidized and the produced acid is neutralized bysedimentary calcium carbonate.
Carbonate dissolution induced by metabolicprocesses in deep-sea sediments has been neg-lected for a long time. Emerson and Bender (1981)were about the first who explicitly stated that thedegradation of organic matter may significantlydrive calcite dissolution, and hence, affect thepreservation of calcium carbonate in deep-seasediments even above the lysocline. A number ofsubsequent studies has identified this problemand generally focused on the differentiationbetween calcium carbonate dissolution byundersaturation of bottom waters and organicmatter remineralization. These studies specificallyconsidered the dissolution kinetics of calciumcarbonate in deep-sea sediments (i.e. Berelson etal. 1990; Berelson et al. 1994; Hales and Emerson1996 and 1997a; Jahnke et al. 1994 and 1997;Martin and Sayles 1996; Wenzhöfer et al. 2001). Itis very important to understand whether thedissolution of calcium carbonate is driven by oneor the other process in order to correctly interpretthe accumulation of calcium carbonate insediments over time. For example, calcium carbo-nate preservation at a given site may be reducedby stronger bottom water undersaturation or thedecrease of the rain ratio by accelerating themetabolic CO2 release in the sediments. Archerand Maier-Reimer (1994) demonstrated that a shiftto higher rain ratios could explain both, reducedpCO2-levels during the last glacial and sedimen-tary calcium carbonate concentrations in deep-seasediments. The calcite dissolution by oxic respi-ration of organic matter might therefore be able tomask effects of changes in carbonate productivityand deep-water chemistry in the sedimentarycarbonate record (Martin and Sayles, 1996).
For a long time it was not possible to calculatethe benthic total carbon dioxide or alkalinity fluxbecause of artifacts introduced by decompressionprocesses during core recovery. Moreover there
was no established method for predicting a trueconcentration profile or benthic flux (Murray et al.1980; Emerson and Bender 1981; Emerson et al.1980; Emerson et al. 1982). What happens duringrecovery of cores from some thousand meters ofwater depth is that the solubility of CO2 in thepore water is increasingly reduced due todecompression and warming. Probably, dependenton the calcium carbonate content of the sedimentproviding nucleation sites, calcium carbonate isthen precipitated from the pore water on the waythrough the water column. Calculation of thediffusive alkalinity flux across the sediment-waterinterface from such cores may thus, largelyunderestimate the real flux or even suggest a fluxdirected into the sediments (cf. chapter 6).
In the last decade, however, in-situ techniqueshave been developed to overcome these prob-lems. Profiling lander systems were deployed torecord the pore water microprofiles of oxygen, pHand pCO2, and Ca whereas benthic chambers weredeployed to measure solute fluxes across thesediment-water interface directly. Very often,reactive-transport models are used to explain theinterrelation between measured microprofiles, topredict overall calcite dissolution rates by defi-ning the dissolution rate constants, and to dis-tinguish between dissolution driven by organicmatter oxidation and by the undersaturation of thebottom water.
In most of recently published studies, thecalcium carbonate dissolution in seawater and inpore water of surface sediments is assumed tofollow a kinetic process that can be described bythe equation (Morse 1978; Keir 1980):
Rd = kd (1- Ω)n (9.17)
(9.18a)
(9.18b)
where Rd is the calcite dissolution rate, kd is thecalcite dissolution rate constant, and Ω or SIdescribe the degree of saturation (ion activityproduct divided by k), and k the solubilityconstant of the calcium carbonate species inquestion. Mostly, k´ is used instead of k, which isdefined as the apparent solubility constant and is
[ ][ ]kCOCalogSI
23
2 −+
=
[ ][ ]kCOCa 2
32 −+
=Ω
329
related to concentrations instead of activities.Compilations of apparent solubility constants areavailable e.g. by Mehrbach et al. (1973). In severalstudies, a further dependence of Rd on the calciumcarbonate content (respectively the surface area)in the sediment is considered. (for a more detailedoverview of this subject see Zeebe and Wolf-Gladrow 2000).
The most extensively used reaction order formodeling calcite dissolution is 4.5 and 4.2 foraragonite (as suggested by Keir 1980). A moreextensive re-evaluation of this topic has beenprovided by Cai et al. (1995). However, the dis-cussion concerning the “correct” reaction order stillcontinues. The values of kd reported so far rangeover several orders of magnitude from 0.005-0.16 % d-1
(Berelson et al. 1994; Hales and Emerson 1996, 1997a)up to laboratory values of 10-1000 % d-1 (Keir 1980,1983)2. The reason for this huge discrepancy is notclearly known. Important and regionally variablefactors, however, may be the grain size and thus thesurface area of calcium carbonate crystals in thesediments or adsorbed coatings like phosphate ionsprotecting calcium carbonate grains from corrosivepore waters (Jahnke et al. 1994; Hales and Emerson1997a). In contrast, Hales and Emerson (1997b)found evidence that in-situ pH measurements inpore waters of calcite rich deep-sea sediments aremore consistent with a first-order instead of 4.5th
order dependence. Applied to their data, they re-wrote Equation 9.17 to
Rd = 38 (1- Ω)1 (9.19)
In contrast, the study of calcite dissolutionkinetics in CaCO3-poor sedi-ments of theequatorial Atlantic, Adler et al. (2001) againfavored higher reaction orders. In this sense, theobserved dissolution rate constants are highlyvariable, which seems to be mainly dependent ondifferences in the physical (e.g. surface area) andchemical properties (high/low Mg-calcite) of thecalcite mineral phase.
It is also important to consider where in thesediment dissolution occurs. Metabolically pro-duced CO2 released immediately at the sediment-water interface is probably much less effective forcarbonate dissolution than in deeper sedimentstrata, because neutralization with bottom waterCO3
2- might occur instead of dissolution. If theparticulate organic matter is more rapidly mixeddown, i.e. by bioturbation, and oxidized in deepersediment strata, the CO2 released into the porewaters can probably more effectively dissolvecarbonates (Martin and Sayles 1996).
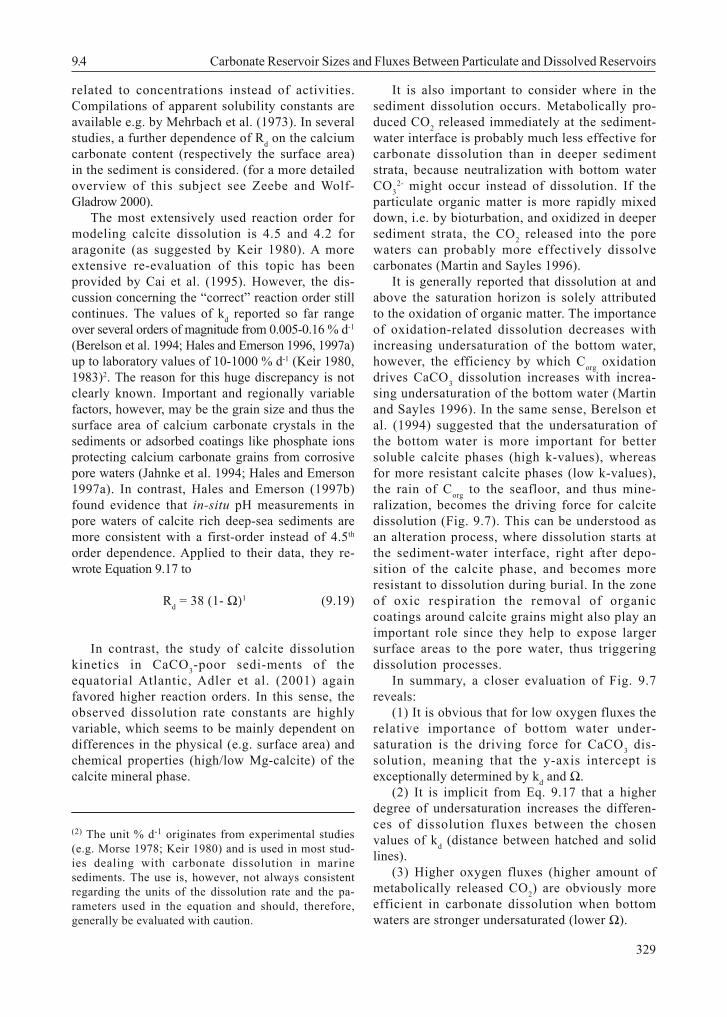
It is generally reported that dissolution at andabove the saturation horizon is solely attributedto the oxidation of organic matter. The importanceof oxidation-related dissolution decreases withincreasing undersaturation of the bottom water,however, the efficiency by which Corg oxidationdrives CaCO3 dissolution increases with increa-sing undersaturation of the bottom water (Martinand Sayles 1996). In the same sense, Berelson etal. (1994) suggested that the undersaturation ofthe bottom water is more important for bettersoluble calcite phases (high k-values), whereasfor more resistant calcite phases (low k-values),the rain of Corg to the seafloor, and thus mine-ralization, becomes the driving force for calcitedissolution (Fig. 9.7). This can be understood asan alteration process, where dissolution starts atthe sediment-water interface, right after depo-sition of the calcite phase, and becomes moreresistant to dissolution during burial. In the zoneof oxic respiration the removal of organiccoatings around calcite grains might also play animportant role since they help to expose largersurface areas to the pore water, thus triggeringdissolution processes.
In summary, a closer evaluation of Fig. 9.7reveals:
(1) It is obvious that for low oxygen fluxes therelative importance of bottom water under-saturation is the driving force for CaCO3 dis-solution, meaning that the y-axis intercept isexceptionally determined by kd and Ω.
(2) It is implicit from Eq. 9.17 that a higherdegree of undersaturation increases the differen-ces of dissolution fluxes between the chosenvalues of kd (distance between hatched and solidlines).
(3) Higher oxygen fluxes (higher amount ofmetabolically released CO2) are obviously moreefficient in carbonate dissolution when bottomwaters are stronger undersaturated (lower Ω).
(2) The unit % d-1 originates from experimental studies(e.g. Morse 1978; Keir 1980) and is used in most stud-ies dealing with carbonate dissolution in marinesediments. The use is, however, not always consistentregarding the units of the dissolution rate and the pa-rameters used in the equation and should, therefore,generally be evaluated with caution.
9.4 Carbonate Reservoir Sizes and Fluxes Between Particulate and Dissolved Reservoirs
9 Marine Carbonates: Their Formation and Destruction
330
(4) For high oxygen fluxes the model predicts aratio of calcite dissolution and oxygen flux of 0.85which is close to the stoichiometrical ratio in Eq.9.15.
More recently in situ microsensor measurementsof O2, pH, pCO2, and Ca could be obtained from theupper continental slope off Gabon (Wenzhöfer et al.2001; Adler et al. 2001; Pfeifer et al. 2002), which, todate, provide one of the most complete sets of non-corrupted pore water data from deep-sea sediments.The bottom water at a water depth of about 1300 mis slightly oversaturated with respect to calcite (Ω =1.07 and 1.10, Adler et al. 2001), thus, dissolutionmust exclusively be mediated by metabolicallyproduced CO2. For the first time, in situ measu-rements of all parameters describing the carbondioxide system, combined with O2 microprofiles,permitted the quantification of the amount of Corgmineralization relative to CaCO3 dissolution. Thesewere completed by a number of ex situ parameters.
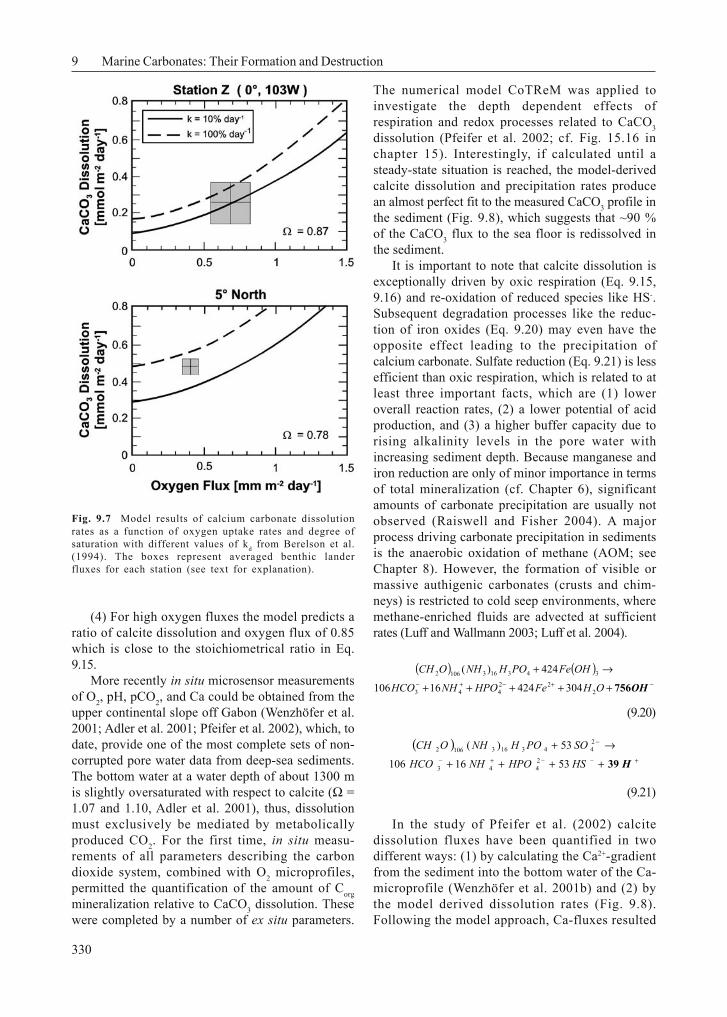
The numerical model CoTReM was applied toinvestigate the depth dependent effects ofrespiration and redox processes related to CaCO3dissolution (Pfeifer et al. 2002; cf. Fig. 15.16 inchapter 15). Interestingly, if calculated until asteady-state situation is reached, the model-derivedcalcite dissolution and precipitation rates producean almost perfect fit to the measured CaCO3 profile inthe sediment (Fig. 9.8), which suggests that ~90 %of the CaCO3 flux to the sea floor is redissolved inthe sediment.
It is important to note that calcite dissolution isexceptionally driven by oxic respiration (Eq. 9.15,9.16) and re-oxidation of reduced species like HS-.Subsequent degradation processes like the reduc-tion of iron oxides (Eq. 9.20) may even have theopposite effect leading to the precipitation ofcalcium carbonate. Sulfate reduction (Eq. 9.21) is lessefficient than oxic respiration, which is related to atleast three important facts, which are (1) loweroverall reaction rates, (2) a lower potential of acidproduction, and (3) a higher buffer capacity due torising alkalinity levels in the pore water withincreasing sediment depth. Because manganese andiron reduction are only of minor importance in termsof total mineralization (cf. Chapter 6), significantamounts of carbonate precipitation are usually notobserved (Raiswell and Fisher 2004). A majorprocess driving carbonate precipitation in sedimentsis the anaerobic oxidation of methane (AOM; seeChapter 8). However, the formation of visible ormassive authigenic carbonates (crusts and chim-neys) is restricted to cold seep environments, wheremethane-enriched fluids are advected at sufficientrates (Luff and Wallmann 2003; Luff et al. 2004).
(9.20)
(9.21)
In the study of Pfeifer et al. (2002) calcitedissolution fluxes have been quantified in twodifferent ways: (1) by calculating the Ca2+-gradientfrom the sediment into the bottom water of the Ca-microprofile (Wenzhöfer et al. 2001b) and (2) bythe model derived dissolution rates (Fig. 9.8).Following the model approach, Ca-fluxes resulted
Fig. 9.7 Model results of calcium carbonate dissolutionrates as a function of oxygen uptake rates and degree ofsaturation with different values of kd from Berelson et al.(1994). The boxes represent averaged benthic landerfluxes for each station (see text for explanation).
( ) ( )−+−+− +++++
→+
OH756OHFeHPONHHCO
OHFePOHNHOCH
222
443
3431631062
30442416106
424)(
( )+−−+−
−
++++
→+
H39HSHPONHHCO
SOPOHNHOCH
5316106
53)(2443
24431631062
331
9.4 Carbonate Reservoir Sizes and Fluxes Between Particulate and Dissolved Reservoirs
in 35.8 µmol cm-2 yr-1 at site GeoB 4906 and 33µmol cm-2 yr-1 at site GeoB 4909, whereas calcitedissolution fluxes calculated directly from Ca-microprofiles are distinctively lower with 20.1 and21.2 µmol cm-2 yr-1, respectively (attributed toscattering data and inconsistencies in themeasured profiles).
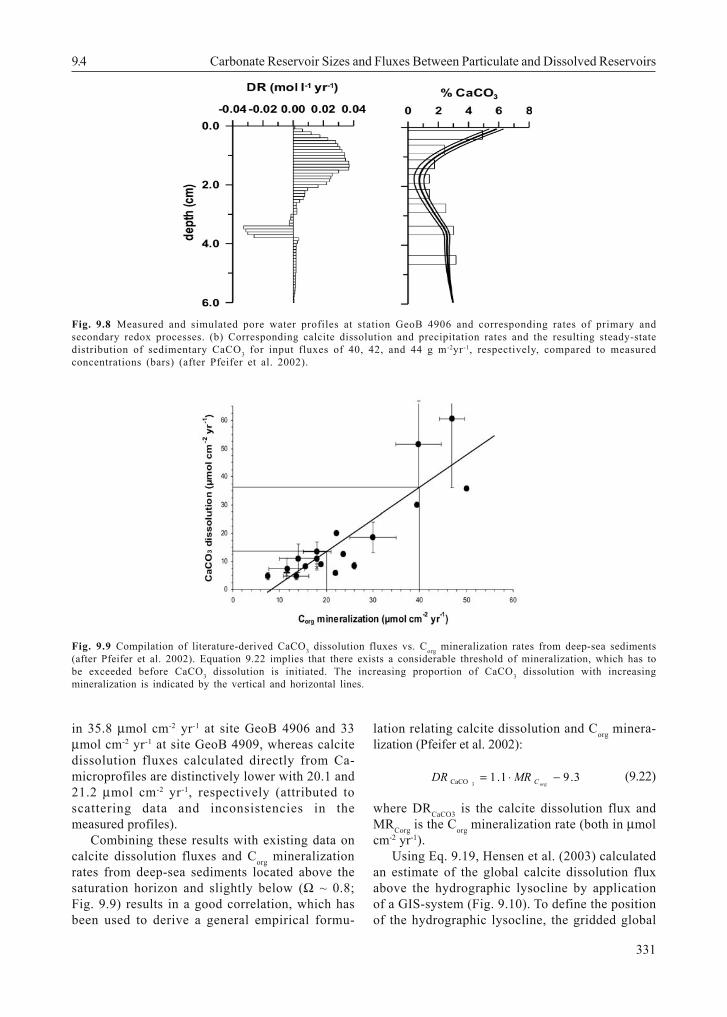
Combining these results with existing data oncalcite dissolution fluxes and Corg mineralizationrates from deep-sea sediments located above thesaturation horizon and slightly below (Ω ~ 0.8;Fig. 9.9) results in a good correlation, which hasbeen used to derive a general empirical formu-
lation relating calcite dissolution and Corg minera-lization (Pfeifer et al. 2002):
(9.22)
where DRCaCO3 is the calcite dissolution flux andMRCorg is the Corg mineralization rate (both in µmolcm-2 yr-1).
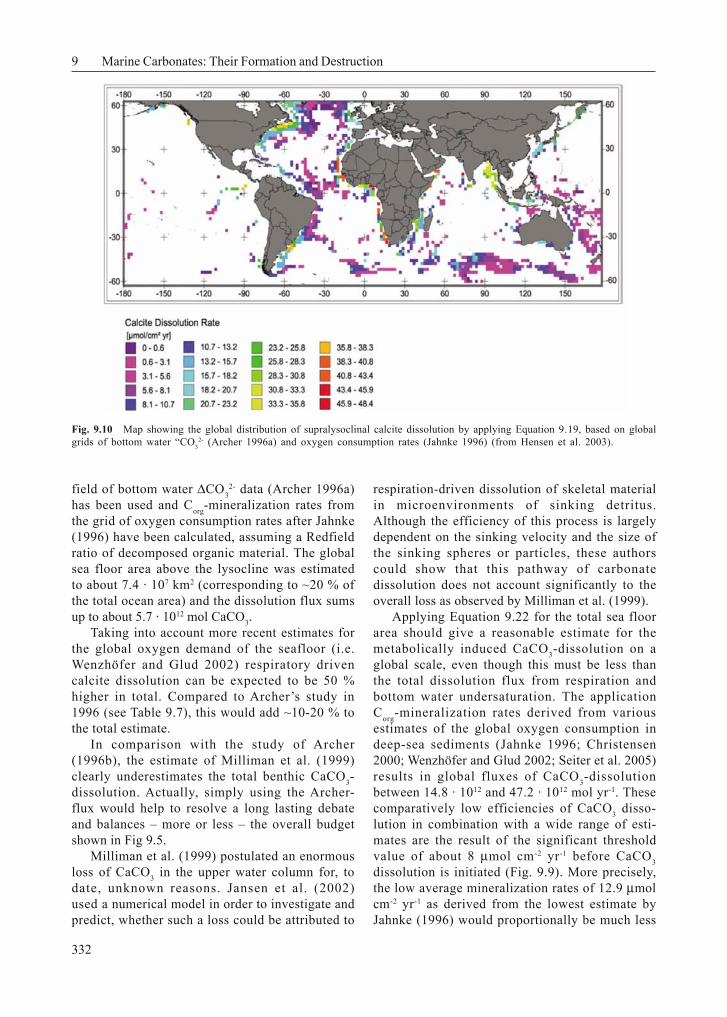
Using Eq. 9.19, Hensen et al. (2003) calculatedan estimate of the global calcite dissolution fluxabove the hydrographic lysocline by applicationof a GIS-system (Fig. 9.10). To define the positionof the hydrographic lysocline, the gridded global
Fig. 9.8 Measured and simulated pore water profiles at station GeoB 4906 and corresponding rates of primary andsecondary redox processes. (b) Corresponding calcite dissolution and precipitation rates and the resulting steady-statedistribution of sedimentary CaCO3 for input fluxes of 40, 42, and 44 g m-2yr-1, respectively, compared to measuredconcentrations (bars) (after Pfeifer et al. 2002).
3.91.13CaCO −⋅=
orgCMRDR
Fig. 9.9 Compilation of literature-derived CaCO3 dissolution fluxes vs. Corg mineralization rates from deep-sea sediments(after Pfeifer et al. 2002). Equation 9.22 implies that there exists a considerable threshold of mineralization, which has tobe exceeded before CaCO3 dissolution is initiated. The increasing proportion of CaCO3 dissolution with increasingmineralization is indicated by the vertical and horizontal lines.
9 Marine Carbonates: Their Formation and Destruction
332
field of bottom water ∆CO32- data (Archer 1996a)
has been used and Corg-mineralization rates fromthe grid of oxygen consumption rates after Jahnke(1996) have been calculated, assuming a Redfieldratio of decomposed organic material. The globalsea floor area above the lysocline was estimatedto about 7.4 · 107 km2 (corresponding to ~20 % ofthe total ocean area) and the dissolution flux sumsup to about 5.7 · 1012 mol CaCO3.
Taking into account more recent estimates forthe global oxygen demand of the seafloor (i.e.Wenzhöfer and Glud 2002) respiratory drivencalcite dissolution can be expected to be 50 %higher in total. Compared to Archer’s study in1996 (see Table 9.7), this would add ~10-20 % tothe total estimate.
In comparison with the study of Archer(1996b), the estimate of Milliman et al. (1999)clearly underestimates the total benthic CaCO3-dissolution. Actually, simply using the Archer-flux would help to resolve a long lasting debateand balances – more or less – the overall budgetshown in Fig 9.5.
Milliman et al. (1999) postulated an enormousloss of CaCO3 in the upper water column for, todate, unknown reasons. Jansen et al. (2002)used a numerical model in order to investigate andpredict, whether such a loss could be attributed to
respiration-driven dissolution of skeletal materialin microenvironments of sinking detritus.Although the efficiency of this process is largelydependent on the sinking velocity and the size ofthe sinking spheres or particles, these authorscould show that this pathway of carbonatedissolution does not account significantly to theoverall loss as observed by Milliman et al. (1999).
Applying Equation 9.22 for the total sea floorarea should give a reasonable estimate for themetabolically induced CaCO3-dissolution on aglobal scale, even though this must be less thanthe total dissolution flux from respiration andbottom water undersaturation. The applicationCorg-mineralization rates derived from variousestimates of the global oxygen consumption indeep-sea sediments (Jahnke 1996; Christensen2000; Wenzhöfer and Glud 2002; Seiter et al. 2005)results in global fluxes of CaCO3-dissolutionbetween 14.8 · 1012 and 47.2 · 1012 mol yr-1. Thesecomparatively low efficiencies of CaCO3 disso-lution in combination with a wide range of esti-mates are the result of the significant thresholdvalue of about 8 µmol cm-2 yr-1 before CaCO3dissolution is initiated (Fig. 9.9). More precisely,the low average mineralization rates of 12.9 µmolcm-2 yr-1 as derived from the lowest estimate byJahnke (1996) would proportionally be much less
Fig. 9.10 Map showing the global distribution of supralysoclinal calcite dissolution by applying Equation 9.19, based on globalgrids of bottom water “CO3
2- (Archer 1996a) and oxygen consumption rates (Jahnke 1996) (from Hensen et al. 2003).
333
9.4 Carbonate Reservoir Sizes and Fluxes Between Particulate and Dissolved Reservoirs
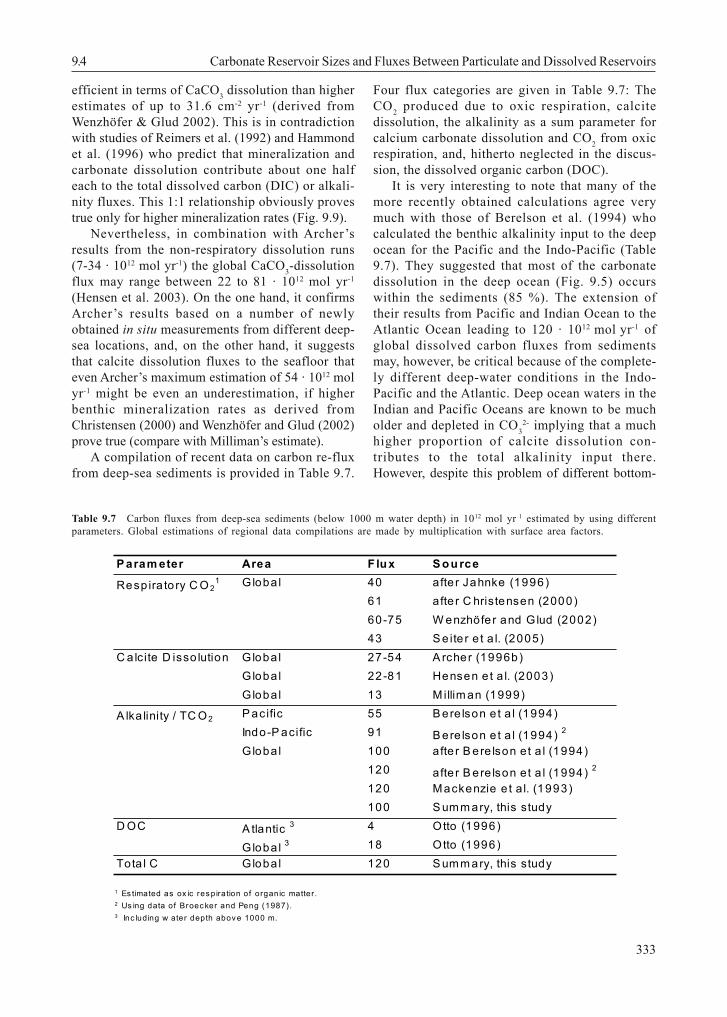
Table 9.7 Carbon fluxes from deep-sea sediments (below 1000 m water depth) in 1012 mol yr 1 estimated by using differentparameters. Global estimations of regional data compilations are made by multiplication with surface area factors.
efficient in terms of CaCO3 dissolution than higherestimates of up to 31.6 cm-2 yr-1 (derived fromWenzhöfer & Glud 2002). This is in contradictionwith studies of Reimers et al. (1992) and Hammondet al. (1996) who predict that mineralization andcarbonate dissolution contribute about one halfeach to the total dissolved carbon (DIC) or alkali-nity fluxes. This 1:1 relationship obviously provestrue only for higher mineralization rates (Fig. 9.9).
Nevertheless, in combination with Archer’sresults from the non-respiratory dissolution runs(7-34 · 1012 mol yr-1) the global CaCO3-dissolutionflux may range between 22 to 81 · 1012 mol yr-1
(Hensen et al. 2003). On the one hand, it confirmsArcher’s results based on a number of newlyobtained in situ measurements from different deep-sea locations, and, on the other hand, it suggeststhat calcite dissolution fluxes to the seafloor thateven Archer’s maximum estimation of 54 · 1012 molyr-1 might be even an underestimation, if higherbenthic mineralization rates as derived fromChristensen (2000) and Wenzhöfer and Glud (2002)prove true (compare with Milliman’s estimate).
A compilation of recent data on carbon re-fluxfrom deep-sea sediments is provided in Table 9.7.
Four flux categories are given in Table 9.7: TheCO2 produced due to oxic respiration, calcitedissolution, the alkalinity as a sum parameter forcalcium carbonate dissolution and CO2 from oxicrespiration, and, hitherto neglected in the discus-sion, the dissolved organic carbon (DOC).
It is very interesting to note that many of themore recently obtained calculations agree verymuch with those of Berelson et al. (1994) whocalculated the benthic alkalinity input to the deepocean for the Pacific and the Indo-Pacific (Table9.7). They suggested that most of the carbonatedissolution in the deep ocean (Fig. 9.5) occurswithin the sediments (85 %). The extension oftheir results from Pacific and Indian Ocean to theAtlantic Ocean leading to 120 · 1012 mol yr-1 ofglobal dissolved carbon fluxes from sedimentsmay, however, be critical because of the complete-ly different deep-water conditions in the Indo-Pacific and the Atlantic. Deep ocean waters in theIndian and Pacific Oceans are known to be mucholder and depleted in CO3
2- implying that a muchhigher proportion of calcite dissolution con-tributes to the total alkalinity input there.However, despite this problem of different bottom-
P aram eter Area F lux S ou rce
Resp ira to ry C O 21 Globa l 40 afte r Jahnke (1996)
61 afte r C hristensen (2000)60-75 W enzhöfer and Glud (2002)43 S e ite r e t a l. (2005)
C a lcite D isso lution Globa l 27-54 A rcher (1996b)Globa l 22-81 Hensen e t a l. (2003)Globa l 13 M illim an (1999)
A lka linity / TC O 2 P acific 55 B ere lson e t a l (1994)Indo-P acific 91 B ere lson e t a l (1994) 2
100 afte r B ere lson et a l (1994)120 afte r B ere lson et a l (1994) 2
120 Mackenzie e t a l. (1993)100 S umm ary, this study
D OC A tlantic 3 4 Otto (1996)
Globa l 3 18 Otto (1996)Tota l C Globa l 120 S umm ary, this study
1 Es timated as ox ic res piration of organic matter. 2 Us ing data of Broec ker and Peng (1987) . 3 Inc luding w ater depth abov e 1000 m.
G loba l
9 Marine Carbonates: Their Formation and Destruction
334
water saturation conditions the global estimateextending the Berelson et al. (1994) approach is inagreement to that of Mackenzie et al. (1993). Basedon Eq. 9.22 and assuming an total mineralization of55 · 1012 mol C yr-1 as well as an average contributionof 15 · 1012 mol yr-1 from non-respiratory dissolution(Archer 1996b) we may come up with a totalalkalinity flux of about 100 · 1012 mol yr-1 as a bestcurrent estimate.
In combination with the flux of dissolvedorganic carbon (DOC), which may add another20 · 1012 mol yr -1 (Otto 1996; Table 9.7), a totalcarbon release from deep-sea sediments ofabout 120 · 1012 mol yr-1 seems to be the bestrecent approximation regarding all sources ofuncertainty.
Summary
The main subjects addressed in Chapter 9 arelisted below:
• The major site of marine carbonate accumula-tion is the neritic environment, including coralreefs, banks and continental shelves, andpelagic calcite-rich sediments. In total, about35⋅1012 mol CaCO3 accumulate per annum inthe marine realm.
• Based on budget calculations of calcium car-bonate, reservoir sizes in the world ocean andexchange fluxes between reservoirs the car-bonate system is not in steady state.
• However, calcium carbonate budget calcula-tions are strongly biased by inexact estima-tions of calcite production in the surface oceanand of the dissolution of pelagic biogenic cal-cite in the water column and in sedimentsabove the calcite lysocline. In addition, the un-certainty is enhanced by the difficulty to esti-mate dissolved inorganic carbon release fromsediments.
• The total carbon release from deep-sea sedi-ments is estimated to be about 120⋅1012 mol yr-1,but is subject to great uncertainty due to thecomplexity of processes controlling carbonremobilization.
• Both bottom water undersaturation and or-ganic matter decay are responsible for calcium
carbonate dissolution in the sediments at moreor less equal levels.
• The efficiency of calcium carbonate dissolu-tion by metabolic CO2 strongly depends on theorganic carbon / calcium carbonate rain ratio atthe sediment surface, the oxidation rate oforganic matter (and the depth horizon, whereoxidation occurs), as well as the saturationstate of bottom water (Ω) and the dissolutionrate constant kd.
9.5 Problems
Problem 1
Where would you expect more CaCO3 production:On the continental shelves, on the slopes, or inthe deep sea?
Problem 2
Explain the difference between CaCO3 productionand CaCO3 accumulation. Discuss the differencebetween both in connection with the processes ofCaCO3 dissolution in the water column and insediment.
Problem 3
At which water depth would you expect the calcitecompensation depth (CCD) in waters of high latitu-des and in which water depth in waters of low lati-tudes? Explain your answer.
Problem 4
Which carbonate species has the highest concen-trations in sea-water? How much of the totalcalcium concentration in normal sea-water existsas CaSO4 complex? Under which conditions is thiscomplex rather insignificant in anoxic pore-water?
Problem 5
CaCO3 dissolution fluxes from sediment to oceanbottom water can be estimated from Corg minerali-zation rates. What are the geochemical processesbehind this correlation? Which calcite dissolutionrate would you expect for sediments in an upwel-ling area, and which for deep-sea sediments?
335
References
Adler, M., Hensen, C., Kasten, S. and Schulz, H.D., 2000.Computer simulation of deep-sulfate reduction insediments off the Amazon Fan. International Journalof Earth Sciences (Geol. Rdsch.), 88: 619-629.
Adler, M., Hensen, C., Wenzhöfer, F., Pfeifer, K. andSchulz, H.D., 2001. Modeling of calcite dissolution byoxic respiration in supralysoclinal deep-sea sedi-ments. Marine Geology, 177: 167-189.
Andersen, N.R. and Malahoff, A., 1977. The fate of fossilfuel CO2 in the Oceans. Plenum Press, NY, 749 pp.
Archer, D.E., 1991. Modeling the calcite lysocline. Jour-nal of Geological Research, 96: 17037-17050.
Archer, D. and Maier-Reimer, E., 1994. Effect of deep-sea sedimentary calcite preservation on atmosphericCO2 concentration. Nature, 367: 260-263.
Archer, D.E., 1996a. An atlas of the distribution of cal-cium carbonate in sediments of the deep sea. GlobalBiochemical Cycles, 10: 159-174.
Archer, D.E., 1996b. A data-driven model of the global cal-cite lysocline. Global Biochemical Cycles, 10: 511-526.
Berelson, W.M., Hammond, D.E. and Cutter, G.A., 1990.In situ measurements of calcium carbonate dissolutionrates in deep-sea sediments. Geochimica et Cosmo-chimica Acta, 54: 3013-3020.
Berelson, W.M., Hammond, D.E., McManus, J. andKilgore, T.E., 1994. Dissolution kinetics of calciumcarbonate in equatorial Pacific sediments. GlobalBiogeochemical Cycles, 8: 219-235.
Berger, W.H., 1976. Biogenic deep-sea sediments: Pro-duction, preservation and interpretation. In: Riley,J.P. and Chester, R. (eds) Chemical Oceanography, 5,Academic Press, London, pp. 266-388.
Berger, W.H., 1982. Increase of carbon dioxide in the at-mosphere during deglaciation: The coral reef hypoth-esis. Naturwissenschaften, 69, 87.
Broecker, W.S. and Peng, T.-H., 1982. Tracers in theSea. Lamont-Doherty Geol. Observation, EldigoPress, Palisades, NY, 690 pp.
Broecker, W.S. and Peng, T.-H., 1987. The Role ofCaCO3 compensation in the glacial to interglacialatmospheric CO2 change. Global BiogeochemicalCycles, 1: 15-29.
DeBaar, H.J.W. and Suess, E., 1993. Ocean carbon cycleand climate change - An introduction to the interdis-ciplinary Union Symposium. Global and PlaneteryChange, 8: VII-XI.
Dittert, N., Baumann, K.H., Bickert, T., Henrich, R.,Huber, R., Kinkel, H., Meggers, H. and Müller, P.,1999. Carbonate dissolution in the Deep-Sea:Methods, quantification and paleoceanography appli-cation. In: Fischer, G. and Wefer, G. (eds) Use ofproxies in paleoceanography: examples from theSouth Atlantic, Springer, Berlin, Heidelberg, 255-284.
Emerson, S.R., Jahnke, R., Bender, M., Froelich, P.,Klinkhammer, G., Bowser, C. and Setlock, G., 1980.Early diagenesis in sediments from the easternequatorial Pacific. 1. Pore water nutrient and carbon-ate results. Earth Planet Science Letters, 49: 57-80.
Emerson, S. and Bender, M., 1981. Carbon fluxes at thesediment-water interface of the deep-sea: calciumcarbonate preservation. Journal of Marine Research,39: 139-162.
Emerson, S., Grundmanis, V. and Graham, D., 1982. Car-bonate chemistry in marine pore waters: MANOPsites C and S. Earth and Planetary Science Letters,61: 220-232.
Feely, R.A., Sabine, C.L., Lee, K., Berelson, W., Kleypas,J., Fabry, V.J. and Millero, F.J., 2004. Impact ofAnthropogenic CO2 on the CaCO3 System in theOceans. Science, 305: 362-366.
Fischer, G., Wefer, G., Romero, O., Dittert, N., Ratmeyer,V. and Donner, B., 2004. Transfer of Particles into theDeep Atlantic and the Global Ocean. In: Wefer, G.,Mulitza, S. and Ratmeyer, V. (eds) The South Atlanticin the Late Quaternary. Springer Berlin, Heidelberg,New York, pp. 21-46.
Freiwald, A., 2002. Reef-forming cold-water corals. In:Wefer, G., Billet, D., Hebbeln, D., Jørgensen, B.B.,Schlüter, M., and Van Weering, T. (eds) Ocean marginsystems, Springer, Berlin, Heidelberg, 365-385.
Goyet, C. and Poisson, A., 1989. New determination ofcarbonic acid dissociation constants in seawater as afunction of temperature and salinity. Deep-Sea-Re-search, 36: 1635-1654.
Hales, B. and Emerson, S., 1996. Calcite dissolution insediments of the Ontong-Java Plateau: In situ meas-urements of pore water O2 and pH. Global Biogeo-chemical Cycles, 10: 527-541.
Hales, B. and Emerson, S., 1997a. Calcite dissolution insediments of the Ceara Rise: In situ measurements ofporewater O2, pH, and CO2(aq). Geochimica etCosmochimica Acta, 61: 501-514.
Hales, B. and Emerson, S., 1997b. Evidence in support offirst-order dissolution kinetics of calcite in seawater.Earth and Planetary Science Letters, 148: 317-327.
Hammond, D.E., McManus, J., Berelson, W.M., Kilgore,T.E. and Pope, R.H., 1996. Early diagenesis oforganic material in equatorial Pacific sediments:stoichiometry and kinetics. Deep-Sea Research, 43:1365-1412.
Hay, W.W. and Southam, J.R., 1977. Modulation of marinesedimentation by continental shelves. In: Andersen,N.R. and Malahoff, A. (eds) The fate of fossil fuel CO2in the Oceans. Plenum Press, NY, pp. 564-604.
Hensen, C., Landenberger, H., Zabel, M., Gundersen, J.K.,Glud, R.N. and Schulz, H.D., 1997. Simulation ofearly diagenetic processes in continental slopesediments in Southwest Africa: The computer modelCoTAM tested. Marine Geology, 144: 191-210.
Hensen, C., Landenberger, H., Zabel, M. and Schulz,H.D., 1998. Quantification of diffusive benthic fluxesof nitrate, phosphate and silicate in the SouthernAtlantic Ocean. Global Biogeochemical Cycles, 12:193-210.
Jahnke, R.A., Craven, D.B. and Gaillard, J.-F., 1994. Theinfluence of organic matter diagenesis on CaCO3 dis-solution at the deep-sea floor. Geochimica et Cos-mochimica Acta, 58: 2799-2809.
Jahnke, R.A., 1996. The global ocean flux of particulate
References
9 Marine Carbonates: Their Formation and Destruction
336
organic carbon: Areal distribution and magnitude. Glo-bal Biogeochemical Cycles, 10: 71-88.
Jahnke, R.A., Craven, D.B., McCorkle, D.C. and Reimers,C.E., 1997. CaCO3 dissolution in California conti-nental margin sediments: The influence of organicmatter remineralization. Geochimica et Cosmochi-mica Acta, 61: 3587-3604.
James, N.P. and Clarke, J.A.D., 1997. Cool-water carbon-ates, SEPM Spec. Publ., 56, Tulsa, Oklahoma, 440 pp.
Jansen, H., R.E., Z. and Wolf-Gladrow, D.A., 2002.Modeling the dissolution of settling CaCO3 in theOcean. Glob. Biogeochem. Cycles, 16(2): 11, 1-16.Keir, R.S., 1983. Variation in the carbonate reac-tivity of deep-sea sediments: determination from fluxexperiments. Deep-Sea Res., 30(3A): 279-296.
Keir, R.S., 1980. The dissolution kinetics of biogenic cal-cium carbonates in seawater. Geochimica et Cos-mochimica Acta, 44: 241-252.
Kharaka, Y.K., Gunter, W.D., Aggarwal, P.K., Perkins,E.H. and DeBraal, J.D., 1988. SOLMINEQ88: a com-puter program for geochemical modeling of water-rock-interactions. Water-Resources Invest. Report,88-4227, US Geol. Surv., 207 pp.
Lindberg, B. and Mienert, J., 2005. Postglacial carbonateproduction by cold-water corals on the NorwegianShelf and their role in the global carbonate budget.Geology, 33(7): 537-540, doi: 10.1130/G21577.1.
Lisitzin, A.P., 1996. Oceanic sedimentation: Lithologyand Geochemistry (English Translation edited byKennett, J.P.). Amer. Geophys. Union, Washington,D.C., 400 pp.
Luff, R., Wallmann, K., 2003. Fluid flow, methane fluxes,carbonate precipitation and biogeochemical turnover ingas hydrate-bearing sediments at Hydrate Ridge, CascadiaMargin: Numerical modeling and mass balances. Geochim.Cosmochim. Acta 67 (18), 3403-3421.
Luff, R., Wallmann, K., Aloisi, G., 2004. Numericalmodeling of carbonate crust formation at cold ventsites: significance for fluid and methane budgets andchemosynthetic biological communities. EarthPlanet. Sci. Lett. 221, 337-353.
Mackenzie, F.T., Ver, L.M., Sabine, C., Lane, M. andLerman, A., 1993. C, N, P, S global biogeochemical cy-cles and modeling of global change. In : Wollast, R.,Mackenzie, F.T. and Chou, L. (eds), Interactions of C,N, P and S biogeochemical cycles and global change.NATO ASI Series, 14, Springer Verlag, pp 1-61.
Maier-Reimer, E. and Bacastow, R., 1990. Modelling ofgeochemical tracers in the ocean. Climate-Ocean In-teraction. In: Schlesinger, M.E. (ed), Climate-oceaninteractions, Kluwer, pp. 233-267.
Martin, W.R. and Sayles, F.L., 1996. CaCO3 dissolutionin sediments of the Ceara Rise, western equatorialAtlantic. Geochimica et Cosmochimica Acta, 60:243-263.
Mehrbach, C., Culberson, C., Hawley, J.E. and Pytkowicz,R.M., 1973. Measurement of the apparent dissoci-ation constants of carbonic acid in seawater at atmo-spheric pressure. Limnology and Oceanography, 18:897-907.
Millero, F.J., 1995. Thermodynamics of the carbon diox-ide systems in the oceans. Geochimica et
Cosmochimica Acta, 59: 661-677.Milliman, J.D., 1993. Production and accumulation of
calcium carbonate in the ocean: budget of anonsteady state. Global Biogeochemical Cycles, 7:927-957.
Milliman, J.D. and Droxler, A.W., 1996. Neritic andpelagic carbonate sedimentation in the marine envi-ronment: ignorance is not a bliss. GeologischeRundschau, 85: 496-504.
Milliman J. D., Troy P. J., Balch W. M., Adams A. K., LiY.-H., and Mackenzie F. T., 1999. Biologicallymediated dissolution of calcium carbonate above thechemical lysocline? Deep-Sea Res. I 46, 1653–1669.
Morse, J.W., 1978. Dissolution kinetics of calcium carbon-ate in sea water: VI. The near-equilibrium dissolutionkinetics of calcium carbonate-rich deep-sea sediments.American Journal of Science, 278: 344-353.
Morse, J.W. and Berner, R.A., 1979. Chemistry of cal-cium carbonate in the deep ocean. In: Jenne, E.A.(ed), Chemical modelling in aqueous systems. Am.Chem. Soc., Symp. Ser., 93, pp. 499-535.
Morse, J.W. and Mackenzie, F.T., 1990. Geochemistry ofsedimentary carbonates. Elsevier, Amsterdam, 707 pp.
Mucci, A., Sundby, B., Gehlen, M., Arakaki, T., Zhong, S.,Silverberg, N., 2000. The fate of carbon incontinental shelf sediments of eastern Canada: a casestudy. Deep-Sea Res. II 47, 733-760.
Murray, J.W., 1897. On the distribution of the pelagicforaminifera at the surface and on the sea floor ofthe ocean. Nat. Sci., 11: 17-27.
Murray, J.W., Emerson, S. and Jahnke, R.A., 1980. Carbon-ate saturation and the effect of pressure on thealkalinity of interstitial waters from the GuatemalaBasin. Geochimica et Cosmochimica Acta, 44: 963-972.
Nordstrom, D.K., Plummer, L.N., Wigley, T.M.L., Wolery,T.J., Ball, J.W., Jenne, E.A., Basset, R.L., Crerar, D.A.,Florence, T.M., Fritz, B., Hoffman, M., Holdren, G.R.Jr., Lafon, G.M., Mattigod, S.V. McDuff, R.E., Morel,F., Reddy, M.M., Sposito, G. and Thrailkill, J., 1979. Acomparision of computerized chemical models forequilibrium calculations in aqueous systems. In: Jenne,E.A. (ed), Chemical modeling in aqueous systems,speciation, sorption, solubility, and kinetics, 93,American Chemical Society, pp. 857-892.
Opdyke, B.D. and Walker, J.C.G., 1992. Return of thecoral reef hypothesis: basin to shelf partitioning ofCaCO3 and its effects on atmospheric CO2. Geology,20: 733-736.
Orr, J.C., Fabry, V.J., Aumont, O., Bopp, L., Doney, S.C.,Feely, R.A., Gnanadesikan, A., Gruber, N., Ishida, A.,Joos, F., Key, R.M., Lindsay, K., Maier-Reimer, E.,Matear, R., Monfray, P., Mouchet, A., Najjar, R.G.,Plattner G.-K., Rodgers, K.B., Sabine, C.L.,Sarmiento, J.L., Schlitzer, R., Slater, R.D., Totterdell,I.J., Weirig, M.-F., Yamanaka, Y. and Yool, A., 2005.Anthropogenic ocean acidification over the twenty-first century and its impact on calcifying organisms.Nature 437: 681-686, doi:10.1038/nature04095.
Otto, S., 1996. Die Bedeutung von gelöstem organischenKohlenstoff (DOC) für den Kohlenstofffluß imOzean. Berichte, 87, Fachbereich Geowissenschaften,Universität Bremen, 150 pp.
337
References
Palmer, A.N., 1991. The origin and morphology of lime-stone caves. Geological Society American Bulletin,103: 1-21.
Parkhurst, D.L., Thorstensen, D.C. and Plummer, L.N.,1980. PHREEQE - a computer program for geo-chemical calculations. Water-Resources Invest. Re-port, 80-96, US Geol. Surv., 219 pp.
Parkhurst, D.L., 1995. User’s guide to PHREEQC: a com-puter model for speciation, reaction-path, advective-transport, and inverse geochemical calculation. Wa-ter-Resources Invest. Report, 95-4227, US Geol.Surv., 143 pp.
Pfeifer, K., Hensen, C., Adler, M., Wenzhöfer, F., Weber,B. and Schulz, H.D., 2002. Modeling of subsurfacecalcite dissolution, including the respiration andreoxidation processes of marine sediments in theregion of equatorial upwelling off Gabon. Geochim.Cosmochim. Acta, 66(24): 4247-4259.
Plummer, L.N., Wigley, T.M.L. and Parkhurst, D.L., 1978.The kinetics of calcite dissolution in CO2-watersystems at 5°C to 60°C and 0.0 to 1.0 atm CO2. Am.J. Sci., 278: 179-216.
Plummer, L.N., Wigley, T.M.L. and Parkhurst, D.L.,1979. Critical review of the kinetics of calcite disso-lution and precipitation. In: Jenne, E.A. (ed), Chemi-cal modelling in aqueous systems. Am. Chem. Soc.,Symp. Ser., 93, pp. 537-572.
Raiswell, R., Fisher, Q.J. (2004) Rates of carbonatecementation associated with sulphate reduction inDSDP/ODP sediments: implications for theformation of concretions. Chem. Geol. 211, 71-85.
Redfield, A.C., 1958. The biological control of chemical fac-tors in the environment. Am. Scientist, 46: 206-2226.
Reimers, C.E., Jahnke, R.H. and McCorkle, D.C., 1992.Carbon fluxes and burial rates over the continentalslope and rise off central California with implicationsfor the global carbon cycle. Global BiogeochemicalCycles, 6: 199-224.
Roberts, H.H. and Macintyre, I.G. (eds), 1988. Special is-sue: Halimeda. Coral Reefs, 6(3/4), 121-280.
Roy, R.N., Roy, L.N., Vogel, K.M., Moore, C.P., Pearson,T., Good, C.E., Millero, F.J. and Campbell, D.M.,1993. Determination of the ionization constance ofcarbonic acid in seawater. Marine Chemistry, 44: 249-268.
Seiter, K., Hensen, C. and Zabel, M., 2005. Benthiccarbon mineralization on a global scale. Glob.Biogeochem. Cycles, 19: GB1010, doi:10.1029/2004GB002225.
Siegenthaler, H.H. and Wenk, T., 1984. Rapid atmos-pheric CO2 variations and ocean circulation. Nature,308: 624-626.
Sundquist, E.T. and Broeker, W.S., 1985. The carbon cy-cles and atmospheric CO2: natural variations archeanto present. American Geophysical Union, Washing-ton, D.C., 627 pp.
Svensson, U. and Dreybrodt, W., 1992. Dissolution kinet-ics of natural calcite minerals in CO2-water systemsapproaching calcite equilibrium. Chemical Geology,100: 129-145.
Takahashi, T., Broecker, W.S., Bainbridge, A.E. and
Weiss, R.F., 1980. Carbonate chemistry of theAtlantic, Pacific and Indian Oceans: The results ofthe Geosecs expeditions, 1972-1978, Natl. Sci.Found., Washington D. C.
Vecsei, A., 2004. A new estimate of global reefalcarbonate production including fore-reefs. Global andPlanetary Change, 43: 1-18.
Wenzhöfer, F., Adler, M., Kohls, O., Hensen, C.,Strotmann, B., Boehme, S. and Schulz, H.D., 2001.Calcite dissolution driven by benthic mineralizationin the deep-sea: in situ measurements of Ca2+, pH,pCO2, O2. Geochim. Cosmochim. Acta, 65(16): 2677-2690.
Wolf-Gladrow, D., 1994. The ocean as part of the globalcarbon cycle. Environ. Sci. & Pollut. Res., 1: 99-106.
Wollast, R., 1994. The relativ importance ofbiomineralisation and dissolution of CaCO3 in theglobal carbon cycle. In: Doumenge, F., Allemand, D.and Toulemont, A. (eds), Past and present biomi-neralisation processes: Considerations about thecarbonate cycle. Bull. de l’Institute océanographique,13, Monaco, pp. 13-35.
Zeebe, R.E. and Wolf-Gladrow D.A., 2001. CO2 inSeawater: Equilibrium, Kinetics, Isotopes. ElsevierOceanography Series, 65, 346 pp.