Embed Size (px)
Citation preview

245
9 Effects of stress relaxation on the microstructure of fresh
Pd thin films
9.1 Introduction
The deposition (by CVD, sputtering, electro and electroless methods) of Pd onto a
substrate leads to a composite structure including large amounts of extra energy. Part of
the excess energy in these fine grain films is stored as microstrains and surface energy,
which is released by the growth of Pd grains at high temperatures. Tschöpe at al. (1992)
showed, by calorimetric measurements, that thermal relaxation in freestanding Pt and Pd
nanocrystalline samples prepared by inert gas condensation occurred in two stages. The
first reduction in the total Gibbs free energy corresponded to the relaxation of internal
strains and/or non equilibrium grain boundaries. The second reduction in the total Gibbs
free energy corresponded to grain growth. The remnant excess energy in composite struc-
tures is due to film/substrate interactions and is stored as “intrinsic” stresses within the
film. Intrinsic stresses are also released at high temperatures.
Yet, at high temperatures, new stresses (thermal stresses) appear due to the difference
in the thermal expansion coefficient of the metal and the substrate. In addition to thermal
stresses, H2 stresses will appear upon H2 dissolution within the Pd lattice when the mem-
brane is exposed to H2 atmosphere. The resulting Pd lattice expansion is constrained by
the support, which does not expand, and stresses build up within the film. Thermal
Introduction
246
stresses and H2 stresses are “extrinsic” stresses since they involve parameters outside the
boundaries limiting the Pd thin film.
When the appropriate amount of energy is given to the composite system (Pd/substrate
+ H2), microstrains, “intrinsic” and “extrinsic” stresses are released inducing changes in
the microstructure within the Pd thin film. The changes in microstructure resulting from
stress release can cause a composite Pd membrane to fail.
The main objective of the experiments described in this chapter was to investigate the
stresses and their release occurring in composite Pd-PH structures. Specifically, the pa-
rameters affecting H2 stresses were studied. In addition, the Pd microstructure and its
changes with temperature were correlated with Pd grain growth, microstrains and stress
release using diffraction techniques. Finally, the total stress in a composite Pd membrane
was calculated for temperature and pressure conditions similar to conditions during mem-
brane characterization.
9.2 Stress theory
9.2.1 Thermal stresses
The coefficients of thermal expansion of Pd and the substrate can be considered as lin-
ear functions of temperature within the temperature range (20-600ºC) considered in this
study. Hence, the thermal stress (σth) along the Pd/substrate interface direction to which
the thin film is subjected can be approximated by Equation (9-1) (Koch, 1994).
!
" th =(Lsub # Lfilm ) $ %T $ E film
1#& (9-1)
where Lsub and Lfilm are the thermal expansion coefficients of the substrate and the thin
film respectively, ΔT the increment in temperature from a reference T0 (T0 = 20ºC), Efilm
Stress theory
247
is Young’s modulus and ν the Poisson’s ratio of the metal film. According to Equation
(9-1), thermal stresses are a linear function of temperature. However, the linear character
of thermal stresses with temperature is only observed in the elastic region of the metal.
When the thermal stresses exceed the elastic limit of the film they are released by plastic
deformations.
9.2.2 H2 stresses
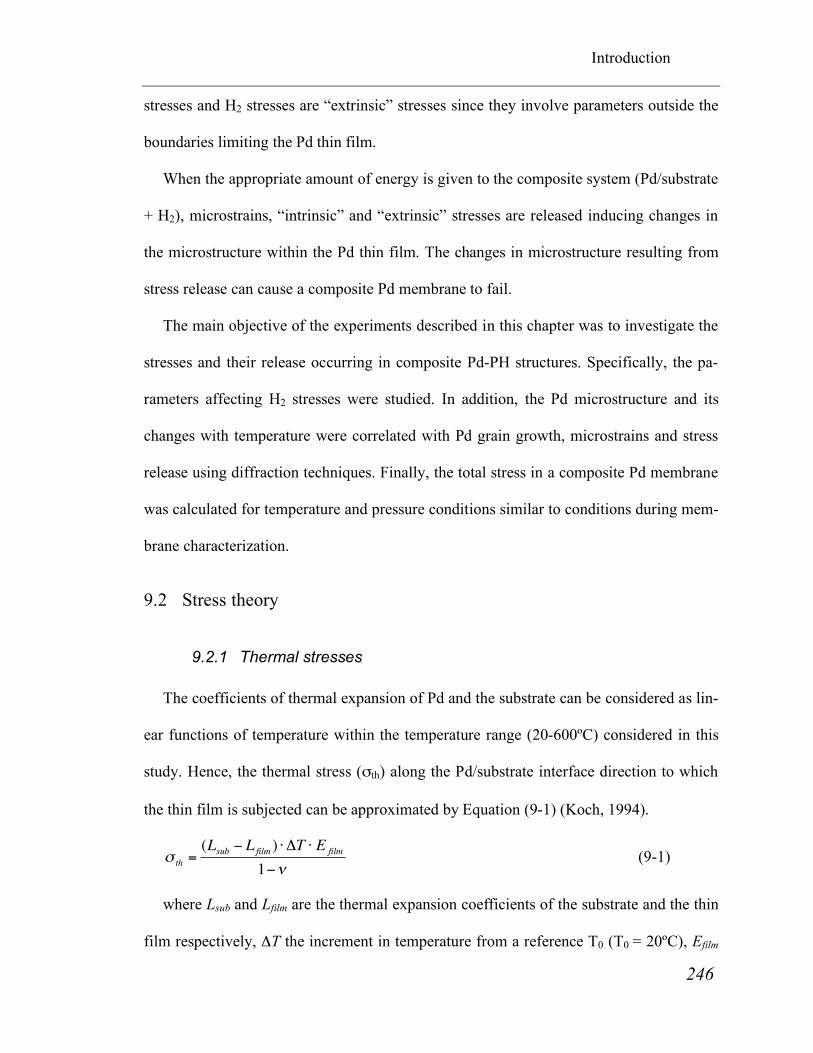
H2 stresses are equal to the H2 strain times Pd Young’s modulus (Efilm) and are given
by Equation (9-2)
!
" H = #H $ E film (9-2)
where εH, is the H2 strain, which was derived from experimental data reported by
(Baranowski et al., 1971). Baranowski et al. (1971) found the volume increase due to in-
terstitial H2 to be a unique and linear function of n(H/Pd) for many fcc metals and alloys
(Pd, Pd-Ir, Pd-Au, Pd-Ag, Pd-Pt and Pd-Cu) regardless of the initial lattice volume and
the hydride phase (α or β). The linear volume increase as a function of n(H/Pd) holds for
0<n<0.7 and is shown in Equation (9-3).
!
"V = (a3# a0
3) =11.56 $ n(H /Pd)
1 (9-3)
where ΔV is the volume increase of the lattice cell in Å3, a is the lattice parameter in Å
and n(H/Pd) the H2 content. a0 is the metal lattice parameter in inert atmosphere. Hence,
the increase in the lattice parameter is given by Equation (9-4)
!
a = (11.56 " n(H /Pd) + a03)1/ 3 (9-4)
1 Equation (9-3) was derived by measuring ΔV and n(H/Pd) on the graphic reported by Baranowski et al. (1971)

Stress theory
248
Performing a Taylor expansion around n(H/Pd)=0 to the first order leads to Equation
(9-5)
!
a " a0 +1
3#11.56
(a03)
2
3
# n(H /Pd) + o(n(H /Pd)) (9-5)
Substituting a0 with the value for Pd (a0=3.889Å) leads to Equation (9-6)
!
a " a0
a0
=1
3# 0.19 # n(H /Pd) (9-6)
Equation (9-6) was also derived by Eastman et al. (1993), which found the same ex-
pression for εH vs. n(H/Pd). Hence, the H2 stress is a linear function of the H2 content,
n(H/Pd) within an elastic region. Stresses will also be released if the elastic limit of the
metal is exceeded.
9.2.3 Stresses in a composite Pd/substrate structure
The total stress in a composite Pd/substrate structure is the sum of all stresses. A com-
posite Pd membrane under reaction conditions will be subjected to the total stress (σtotal)
given by Equation (9-7)
!
" total =" th +" H = [(Lsub # Lfilm ) $ %T
1#&+kH
3$ n(H /Pd)] $ E film
with
kh = 0.19 ± 0.01
(9-7)
249
9.3 Experimental
9.3.1 The preparation of samples
The composite Pd membranes listed in Table 3-2 have a very small thickness com-
pared to the outside diameter (OD) of the cylindrical substrate. Hence, any composite Pd
membrane can be considered as a flat thin film and the study of stresses can be under-
taken using small flat porous plates covered with a Pd film with the same thickness.
0.2µm grade PSS plates (1.5cm2, 1mm thick), 0.5µm grade PH plates (1.5cm2, 1mm
thick) and α Al2O3 supports (1.5cm2, 2mm thick) were cleaned according to the proce-
dure described in Section 3.1.1. PSS plates were oxidized at 600ºC for 12 hr. PH plates
were oxidized at 900ºC for 12 hr to ensure the formation of a thick Cr2O3 layer. Activa-
tion and Pd deposition were performed as described in Section 3.1.1. For the bimetallic
Cu-Pd-PH samples, Cu was deposited by the electroless plating method using plating
baths listed in Table 7-1. The thickness and Cu content of each layer was determined by
the gravimetric method. After the metal deposition the Pd-Cu samples were annealed in
UHP H2 atmosphere at 650ºC for 24 hr. Two different Cu-Pd-PH samples were consid-
ered for stress calculation: Pd/Cu-40wt% (sample Pd-Cu-4), Pd/Cu-41wt% (sample Pd-
Cu-5) and Pd/Cu-13wt% (sample Pd-Cu-6). Samples studied in this chapter are listed in
Table 9-1.

250
Table 9-1 List of samples studied in this chapter. Sample Pd thick-
ness, L (µm)
Pressure (bar), at-mosphere
Temp. range (ºC)
Experiment description
PH-1a (“fresh”)
12 1, He 25-600 Measurement of microstrains, Pd grain size, Pd lattice parameter (a) and stresses as temperature was increased
PH-1b 12 1, He 60-400 Measurement of microstrains and stresses of a heat-treated sample as tem-perature was increased
PH-1c 12 1.5, H2 60-500 Measurement of stresses as a function of H2 concentration in the Pd layer (n=H/Pd)
PH-2a (Pre-treated in He at
400ºC for 1 hr)
12 1, He 60-400 Measurement of stresses in a pre annealed sample. Comparison with PH-1b
PH-3a (Pre-treated in He at
400ºC for 1 hr)
12 1, He 300-500 Measurement of stresses in a pre annealed sample at T>400.
PH-4a (Pre-treated in He at
400ºC for 1 hr)
12 1, He1.5 H2 5 times switching
50 Effect of atmosphere switching on microstrains and Pd morphology
Al2O3-1a (“fresh”)
10 1, He 20-500 Microstrains release as a function of temperature in He
Al2O3-2a (“fresh”)
10 1, H2 20-500 Microstrains release as a function of temperature in H2
Al2O3-3a/4a/5a/6a (“fresh”)
6 1, H2 300/400/500/600 Pd microstructure after annealing in H2 for 48 hr at 300 (Al2O3-3), 400 (Al2O3-4), 500 (Al2O3-5) and 600ºC (Al2O3-6)
PSS-1a (“fresh”)
10 - - Pd microstructure of a fresh Pd thin film
PSS-1a (“fresh”)
10 1, H2 500 Pd microstructure after heat-treatment at 500ºC for 48 hr in H2
Pd-Cu-5 PH 1, He 20-400 Stress measurements in PdCu –PH composite structures (β phase) Pd-Cu-6 PH 1, He 20-400 Stress measurements in PdCu –PH composite structures (α phase)
Microstructure of freshly deposited films
251
The letter following the sample number designates the experiment. For instance, PH-
1b stands for “sample PH-1, second experiment”. “Fresh” samples are the ones which
were only dried at 120ºC overnight before any experiment. Only samples PH-2a, PH-3a
and PH-4a were pre-treated in He atmosphere at 400ºC for one hour to release initial mi-
crostrains and “intrinsic” stresses present in every “fresh” Pd film.
9.3.2 X-ray diffraction procedures
9.3.2.1 X-ray diffractometers
Diffraction data were collected using Cu-Kα radiation on a PANalytical X’Pert Pro
MPD located at the High Temperature Materials Laboratory (HTML) in Oak Ridge Na-
tional Laboratory (ORNL), Oak Ridge, Tennessee. Parallel-beam optics, consisting of an
incident-side graded multilayer parabolic X-ray mirror and a diffracted-side 0.09° paral-
lel-plate flat collimator, were used to alleviate errors associated with sample
displacement. Samples were loaded into an Anton Paar XRK900 reaction chamber which
allowed the temperature to be varied between 25 and 900 °C and the gas environment to
be varied between 1 and 1.5 atm of He or He-4%H2 (static or flowing).
All experiments listed in Table 9-1 were performed on the PANalytical diffractometer
except for Al2O3-1a and Al2O3-2a. Diffraction data of experiments Al2O3-1a and Al2O3-
2a were collected with the time resolved HTXRD diffractometer already described in sec-
tion 3.4.2.1.
9.3.2.2 Microstrains-size separation: the Williamson-Hall method
In metals, two types of strains (% of elongation, (d-d0)/d0) can be encountered: non-
uniform strains (microstrains) and uniform strains (macrostrains). Non-uniform strains

Microstructure of freshly deposited films
252
are pictured as a distribution of d-spacings and lead to XRD peak broadening while uni-
form strains, which arise from “intrinsic” and “extrinsic” stresses, lead to XRD peak
shifting. This section deals with the determination of microstrains and grain size by XRD
peak broadening measurements.
Not only microstrains lead to the broadening of XRD peaks (βtotal) but also small grain
sizes (<100nm), stacking faults and twins, and machine limitations contribute to the
broadening of XRD peaks according to Equation (9-8)
!
"total = "size + "microstrains + " faulting + "machine (9-8)
The density of stacking faults and twins in fcc metals can be determined by measuring
the shift of two pairs of reflections such as the (111)-(200) pair and the (222)-(400) pair
(Warren and Averbach, 1950). However, several reports showed (by Transmission Elec-
tron Microscope (TEM) techniques) that thin films formed with a gentle deposition
method such as electrodeposition, cold condensation and sputtering did not include se-
vere defects in the atomic layers. Since electroless deposition involves a gentle chemical
process the density of stacking faults and twins was considered to be negligible. There-
fore, XRD peak broadening was considered to be only a function of crystallite size,
microstrains and machine broadening according to Equation (9-9)
!
"total
= "size
+ "microstrains
+ "machine
(9-9)
The contribution of machine broadening (βmachine) to the total peak broadening is read-
ily measured using a standard Si or LaB6 powder supplied by NIST. Equation (9-9) can
then be easily reduced to Equation (9-10)
!
"total
= "size
+ "microstrains
(9-10)

Microstructure of freshly deposited films
253
Two approaches can then be undertaken to determine crystallite size and microstrains:
the use of Williamson-Hall’s method (Williamson and Hall, 1953) to separate grain size
contribution from microstrains contribution or the use of the Warren-Averbach’s method
(Warren and Averbach, 1950) to measure simultaneously grain size, grain size distribu-
tion and microstrains. Warren-Averbach’s method leads to consistent data when several
orders of diffraction can be collected for a given set of planes, for instance when reflec-
tions (111), (222), (333) etc. are available. In conventional X-ray diffractometers with a
Cu radiation source only 2 orders of diffraction are available for Pd making the use of
Warren-Averbach’s method unworthy. Therefore, microstrains-size separation in Pd de-
posits was performed using Williamson-Hall’s method described in detail by Williamson
and Hall (1953).
In Williamson-Hall’s method the peak broadening (β), expressed in radians, was as-
sumed to be the sum of a tan(θ) term for the microstrains, and a 1/cos(θ) term for the
grain size as given in Equation (9-11)
!
" = 4e # tan($) + %Cu/(t # cos($)) (9-11)
where e ≈( Δd/d)hkl is an approximate upper limit of the maximum distortion, λCu the
Cu X-ray wavelength, t the grain size and θ the half peak position. Equation (9-11) can
also be written as Equation (9-12)
!
" # cos($) =%
t+ 4e # sin($)
with
e =1.25 # < &2 >
(9-12)
where √<ε>2 is the root mean square strain (rms), which is a measurement of the Pd
lattice distortion. Peak width (β) was determined by fitting every reflection with a Lor-

Microstructure of freshly deposited films
254
entz peak function after subtracting the Kα2 component and the background. β·cos(θ)
was then plotted as a function of sin(θ) for all available reflections: (111), (200), (220),
(311), (222), (400), (331) and (420). The plotted data were then fitted with a straight line,
where the slope equaled 4e and the intercept with the “y” axis equaled λCu/t.
9.3.2.3 Stress measurement: lattice strain Vs. Sin2ψ method
Diffraction data were collected from the (422) peak of Pd between 146 and 157°2θ at ψ
tilts of 0, ±28.2, ±42, ±55°psi. The peak position, and ultimately the total stress in the
sample, was determined using PANalytical X’Pert Stress by performing a routine which
included absorption intensity correction, subtraction of linear background, Lorentz-
Polarization correction, stripping of the Cu-Kα2 peak, and then determining the peak po-
sition using a Lorentz fitting method. The variation of peak positions as a function of ψ
tilt were then analyzed using a uniaxial sin2ψ plot to determine the macrostrain within the
plane of the coating. This macrostrain was converted to a stress using a Young’s modulus
of 133.52 GPa and a Poisson’s ratio of 0.3847. The sin2 ψ plot uses the change in peak
position at different tilts of ψ to determine the macrostrain to which the sample is sub-
jected within the surface plane of the sample.

Microstructure of freshly deposited films
255
9.4 Results and discussion
9.4.1 Microstructure of a fresh electroless plated thin Pd film
9.4.1.1 The morphology of fresh electroless Pd deposits
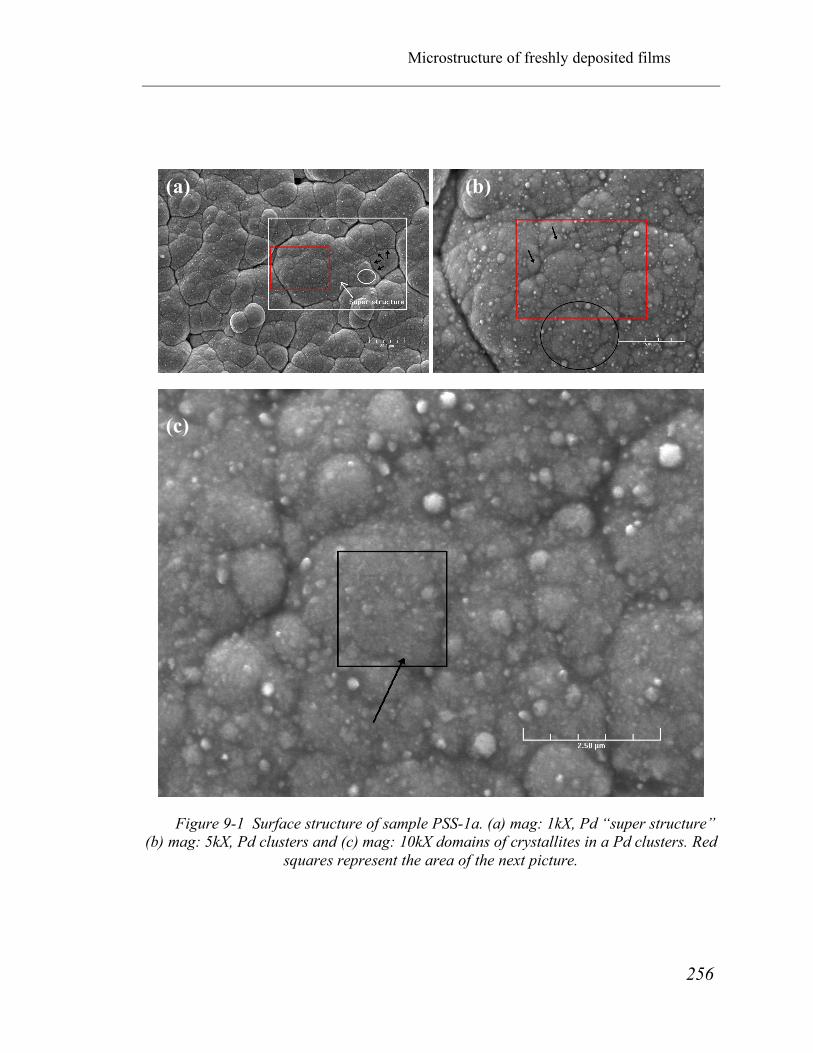
Figure 9-1 shows top view SEM micrographs of sample PSS-1a. The fresh, i.e. dried
at 120ºC overnight, Pd coating had a “cauliflower” type of structure with different fea-
tures. In the low magnification picture, Figure 9-1(a), shows large (70µm50µm)
agglomerates delimited by pronounced dark boundaries. One of these features, called
“super structure” was framed in Figure 9-1(a). Figure 9-1(a) also shows that the “super
structure” is characterized by features delimited with dark boundaries (black arrows) or
light boundaries (circle). Figure 9-1(b) shows a high magnification SEM micrograph
within the “super structure” framed in Figure 9-1(a). The “super structure” included Pd
clusters, pointed by arrows in Figure 9-1(b), with sizes in the order of one micron. Pd
clusters merged to form larger globules (encircled in Figure 9-1(b)) having sizes within
3-5µm. Most important was the very fine grain structure within a Pd cluster shown by
Figure 9-1(c). The surface of a large Pd cluster (framed with a black square in Figure
9-1(c)) was in fact constituted of many small grains, which were considered to be Pd
crystallites due to their small size (50-100 nm). The black arrow in Figure 9-1(c) points to
a group of Pd crystallites.
Microstructure of freshly deposited films
256
Figure 9-1 Surface structure of sample PSS-1a. (a) mag: 1kX, Pd “super structure” (b) mag: 5kX, Pd clusters and (c) mag: 10kX domains of crystallites in a Pd clusters. Red
squares represent the area of the next picture.
(a) (b)
(c)

Microstructure of freshly deposited films
257
Hence, fresh Pd deposits were characterized by a “cauliflower” structure with large
structures delimited by pronounced boundaries, characterized by agglomerates of Pd
clusters, which consisted of thousands of Pd crystallites having 50-100nm in diameter.
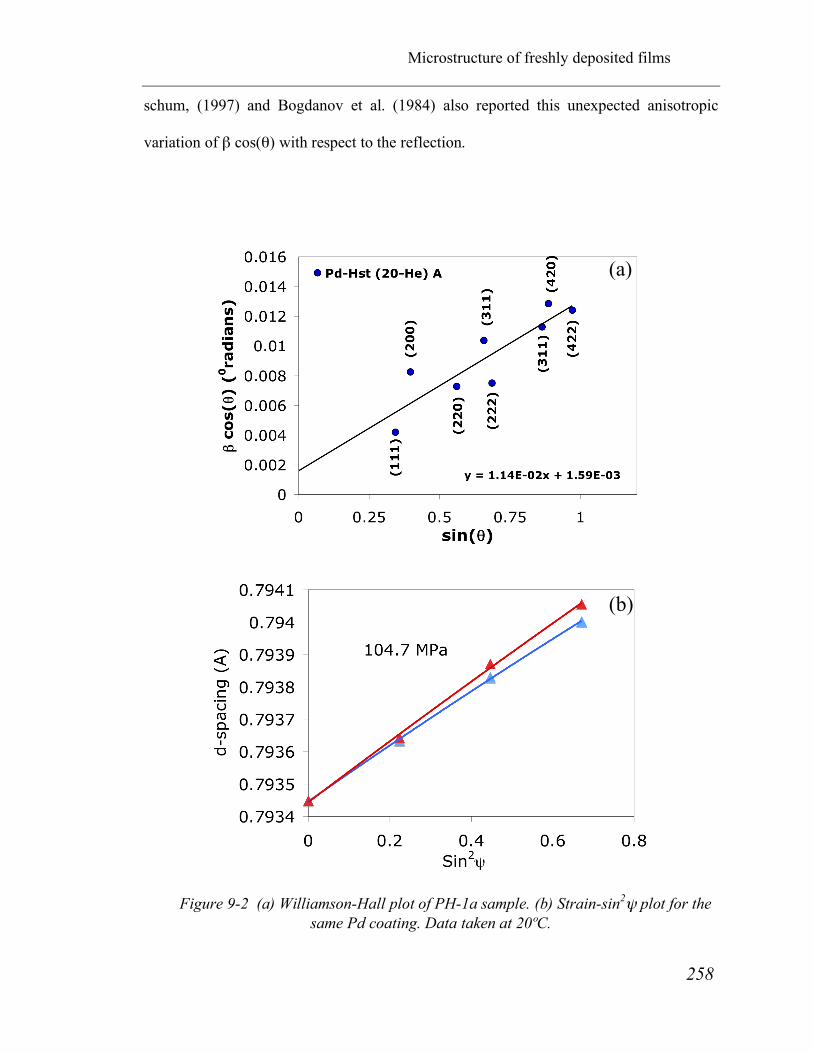
9.4.1.2 Initial Pd grain size, microstrains and “intrinsic” stresses
Using only Scherrer equation (thkl=0.9λ/βcosθ) on the (111) and (222) reflections led
to t222 higher than t111 by a factor of two, which was also reported on Pd black when mi-
crostrains were not accounted for (Bogdanov et al., 1984). Hence, microstrains were also
present in electroless Pd deposits. Therefore, the initial microstrains present in the fresh
Pd film and initial Pd grain size were estimated by performing a strain-size separation on
sample PH-1a using Williamson-Hall plot, shown in Figure 9-2(a). Initial rms equaled
2.9·10-3 and initial Pd grain size equaled 97nm, which was in agreement with Pd grain
size measured on SEM micrographs. It has been shown in the case of nanocrystalline Pd
that microstrains decreased from 0.5% to 0.05% as crystallite size increased from 10nm
to 100 nm (Sanders et al., 1995; Weissmuller et al., 1995). Based on Sander’s and
Weissmuller’s findings it was hypothesized that since microstrains decreased with in-
creasing grain size, microstrains were confined to small crystallites and/or shells adjacent
to the interfaces within the crystallites (Reimann and Wurschum, 1997). The initial mi-
crostrains measured in PH-1a (0.29%) appeared to be higher than the values reported in
the literature (0.05%) when the Pd grain size measured with SEM and XRD was around
100nm.
Figure 9-2(a) also shows that the (111) and the (222) reflections were considerably
sharper than the (200) and (400) reflections, which was also noted by other researchers
(Bogdanov et al., 1984; Reimann and Wurschum, 1997). Indeed, Reimann and Wur-
Microstructure of freshly deposited films
258
schum, (1997) and Bogdanov et al. (1984) also reported this unexpected anisotropic
variation of β cos(θ) with respect to the reflection.
Figure 9-2 (a) Williamson-Hall plot of PH-1a sample. (b) Strain-sin2ψ plot for the same Pd coating. Data taken at 20ºC.
(a)
(b)

Microstructure of freshly deposited films
259
The anisotropic variation of β cos(θ) indicated that either grains were longer along the
[111] direction than along the [200] direction or that a high density of stacking faults and
twins was present along the [200] direction. According to Reimann and Wurschum,
(1997) neither the high density faults nor the anisotropic grain shape hypothesis were
compatible with Pd crystallite shape from high resolution TEM investigations. Hence,
they postulated that the large variations of β⋅cos(θ) with respect to the peak reflection
were due to the anisotropic elasticity factor of Pd. They plotted β⋅cos(θ) as a function of
sin(θ)/Ehkl (Ehkl is the Pd Young’s modulus for the hkl reflection) and found a straight
line. Therefore, the anisotropy seen in Figure 9-2(a) was due to the anisotropy in Pd elas-
ticity.
The initial “intrinsic” stresses of the fresh PH-1a sample were determined using d-
sin2ψ experimental data plotted in Figure 9-2(b). An initial tensile stress of 104.7±9 MPa
was measured along the y direction. The tensile nature of the initial stress can be ex-
plained by the high melting point of Pd and the low temperature (60ºC) at which the
deposition was carried out.
Indeed, during Volmer-Weber growth, the nature of the initial “intrinsic” stresses de-
pends on the mobility of the metal being deposited. The mobility of the metal depends on
its melting point (the concept of Tamman temperature) and the temperature of the sub-
strate at which the deposition is performed. Therefore, the initial “intrinsic” stress of a
fresh coating depends on the Tsubstrate/Tmelt ratio and, given a substrate temperature, metals
are categorized in low-mobility (T/Tm<0.2) and high mobility (T/Tm>0.2) metals (Koch,
1994). Low mobility metals show tensile stresses during deposition. Moreover, the tensile
stress increased linearly with film thickness. These stresses are mostly located at the grain

Microstructure of freshly deposited films
260
boundaries. In the particular case of Pd deposited at a temperature of 60ºC, the T/Tm ratio
(333K/1823K) equaled 0.18, so that Pd can be considered as a low mobility metal, which
was in agreement with the tensile nature of the initial stress of the coating.
Grain boundaries are known to be sources of intrinsic stresses and according to
Hoffman “the inter-atomic forces at the grain boundaries tend to close any existing gap,
with the result that the neighboring crystallites are strained in tension”1. Weissmuller
and Lemier, (1994) also reported that grain boundary stress in Pd-H tended to expand the
crystal lattice.
1 Citation from Koch (1994).

261
9.4.2 Pd microstructure changes with temperature
9.4.2.1 Morphology changes with temperature
Figure 9-3(a), (c) and (e) show the Pd morphology of PSS-1a at 1000X, 5000X and
10000X respectively. Figure 9-3(b), (d) and (f) show the Pd morphology, at the same
magnifications, of a thin Pd film after heat-treatment at 500ºC for 48 hr in H2 (PSS-2a).
Figure 9-3(b) shows that after treatment at 500ºC the boundaries between “super struc-
tures” were less pronounced than the same boundaries in the fresh sample. The change in
appearance of pronounced boundaries between large structures can be better seen in
Figure 9-3(d). The black arrows in Figure 9-3(d) point to boundaries between large struc-
tures, where some sintering can be clearly seen. Figure 9-3(d) also shows that Pd clusters,
and Pd grains inside “super structures” sintered after heat-treatment leading to a relatively
uniform microstructure within each “super structure” having Pd grains as large as 0.5-
1µm. The large Pd grains formed upon heating can be clearly seen in Figure 9-3(f)
pointed out by the arrows.

Microstructure changes with temperature
262
Figure 9-3 surface pictures of PSS-1a (a) mag.: 1kX, (c) mag.: 5kX and (e) mag.: 10kX. Surface microstructure of PSS-2a (upon heating at 500ºC for 48 hr) is shown at (b) mag.: 1kX, (d) mag.: 5kX and (f) mag.: 5kX. mag1KX, scale bar: 20 µm, mag 5KX scale
bar: 5 µm and mag 10KX scale bar:2.5 µm.
(a) (b)
(c) (d)
(e) (f)

Microstructure changes with temperature
263
Pd layers (6µm thick) were deposited on α-Al2O3 supports and annealed at different
temperatures (300, 400, 500 and 600ºC) for 48 hr in H2. The morphology of the annealed
Pd layers (samples Al2O3-3a/4a/5a/6a), studied by SEM, is shown in Figure 9-4(a)(b)(c)
and (d) respectively. No significant changes were noticed in the shape of clusters for the
samples annealed at 300 and 400ºC. Indeed, the clusters in both samples had similar size
and sharp edges. Pd clusters in the 500ºC annealed sample did not show sharp edges indi-
cating that Pd grain and Pd cluster sintering process started at a temperature between 400
and 500ºC. At 600ºC Pd clusters were hardly discerned, instead, a distinguished uniform
Pd layer with Pd grains as large as 5µm were present.
9.4.2.2 Grain growth and microstrains release with temperature
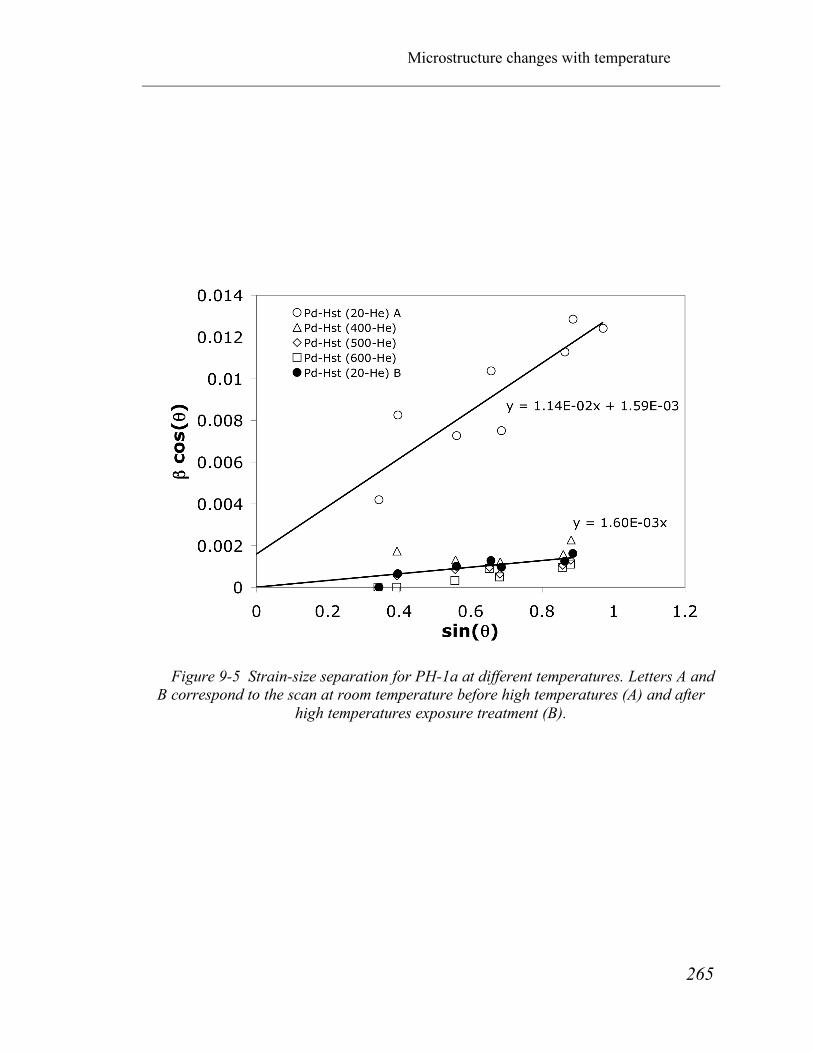
Figure 9-5 shows the Williamson-Hall plot of sample PH-1a annealed in He atmos-
phere at different temperatures (400, 500 and 600ºC). Experimental data obtained at
20ºC, “(20-He) A”, was also added for comparison purposes. At high temperatures
(>400ºC), plotting β·cos(θ) as a function of sin(θ) led to a straight line having a very low
slope value (rms=3.2·10-4) and passing through the origin indicating that microstrains,
initially present in the Pd deposit, were released (0.03% at high temp.) and that grains
grew very large. Performing the microstrains-size separation at room temperature after
heat-treatment, “(20-He) B” filled circles, led to the same results found at high tempera-
tures. Therefore, initial microstrains were irreversibly released after treatment in He
atmosphere at 400ºC for one hour.

Microstructure changes with temperature
264
Figure 9-4 Pd-α -Al2O3 deposits annealed in H2 at (a) 300 (Al2O3-3a), (b) 400 (Al2O3-4a), (c) 500 (Al2O3-5a) and (d) 600ºC (Al2O3-6a) for 48 hr (Mag 5000)
(a) (b)
(c) (d)
Microstructure changes with temperature
265
Figure 9-5 Strain-size separation for PH-1a at different temperatures. Letters A and B correspond to the scan at room temperature before high temperatures (A) and after
high temperatures exposure treatment (B).

Microstructure changes with temperature
266
Since Pd grains were initially large (100nm) peak broadening was primarily due to
microstrains in the Pd lattice. The peak broadening (FWHM or β) of the (111), (200),
(220), (311) and the (222) reflections was followed as a function of temperature in He
atmosphere for sample Al2O3-1a (pure Pd thin film). The experiment consisted of collect-
ing x-ray data for all reflections while the temperature was increased at a rate of 3ºC/min.
Figure 9-6 shows that the FWHM of all reflection, except the (111) reflection, reached
the machine-broadening limit (0.1°) at temperatures higher than 350ºC, that is, above
350ºC in He atmosphere, all microstrains initially present in the thin film were released,
which was in agreement with experiment PH-1a.
Microstrains release in H2 atmosphere is shown in Figure 9-7 as a function of time at
200, 300, 400 and 500ºC for sample Al2O3-2a (pure Pd thin film). The experiment con-
sisted of collecting x-ray data for all reflections as a function of time at a given
temperature. The temperature was increased by 100ºC increments. In H2 atmosphere, Pd
reflection peaks (except the (111) reflection) were still broad at 400ºC, however, at 500ºC
peaks sharpened readily and the FWHM of all peaks reached the machine broadening
limit. Moreover, at each temperature equal to or below 400ºC, some microstrains release
occurred in the first 60 minutes after which strains reached a constant value. Therefore, it
appeared that microstrains release mechanism took place at a faster rate in He atmosphere
than in H2 atmosphere, which was due to the adsorbed H atoms along the grain bounda-
ries.

Microstructure changes with temperature
267
Figure 9-6 Microstrains release in He atmosphere in sample Al2O3-1a as a function of temperature. Heating rate 3ºC/min.
Figure 9-7 Microstrains release as a function time for sample Al2O3-2a in H2 at-mosphere at 200, 300, 400 and 500ºC.

Microstructure changes with temperature
268
The study of Pd grain growth was not possible since their size was already large
(100nm) at the “fresh” stage. However, according to Tschöpe et al. (1992), grain growth
occurs after microstrains are released, therefore, Pd grain growth in electroless plated
films started to occur at temperatures ranging between 350-400ºC depending on the at-
mosphere. The hypothesis that Pd grains started to grow at T>350-400ºC can be
substantiated by the fact that, as seen in Figure 9-4(b), no significant structure modifica-
tion occurred at 400ºC in H2 atmosphere.
9.4.2.3 “Intrinsic” and “extrinsic” stresses release with temperature
Upon heating sample PH-1a, “extrinsic” thermal stresses were added to the already ex-
isting “intrinsic” stress. The total stress in sample PH-1a was measured at several
temperatures (250, 400, 500 and 600ºC) in He atmosphere. Figure 9-8 shows the total
stress to which the thin Pd film was subjected as a function of temperature. Initially, be-
fore any treatment at high temperatures, the film was under a tensile stress of 104.7 MPa.
At temperatures higher than 250ºC, the thin film was subjected to compressive stresses.
The magnitude of the compressive stresses was equal to 25 MPa at 250ºC and 400ºC and
13MPa at 500ºC and 600ºC as seen in Figure 9-8. When cooled to room temperature
(25°C), after the high temperature treatment, the thin film was back under a tensile stress
although the magnitude of the tensile stress was lower (41 MPa) than the value at the
“fresh” state (104.7 MPa).
The difference in the tensile stress before and after exposure to high temperatures in-
dicated that the initial “intrinsic” stress was released. In fact, stress release started at a
temperature between 250 and 400ºC since the film was under the same compressive
stress at those two temperatures.

Thermal stresses/thermal stress release
269
Figure 9-8 Stress release in sample PH-1a as a function of temperature

Thermal stresses/thermal stress release
270
Further stress release occurred at 500ºC since the film was under a less compressive
stress than at 400ºC. The stress-temperature plot seen in Figure 9-8 was characteristic of
the first high temperature treatment of the “fresh” PH-1a sample where the initial stresses
were released by dislocations in the metal.
The stress-temperature plot during the temperature treatment of sample PH-1b is
shown in Figure 9-9 (diamonds). During the heat-treatment of sample PH-1b, the stress
was found to be, within the temperature-range studied (60-400ºC), a linear function of the
temperature as predicted by Equation (9-1). The negative slope indicated that the thin Pd
film expanded more than the PH substrate by 1.25·10-6 m/(m K). Since, the thermal stress
was a linear function of temperature, the elastic region for a Pd sample annealed at 600ºC
was found to be 60-400ºC.
In order to better understand the release of stresses that occurred during the heat-
treatment of sample PH-1a, sample PH-2a was pre-treated in He atmosphere at 400ºC for
one hour to release the initial microstrains and the initial stress present in the film. The
total stress of sample PH-2a was then measured at 60, 200 and 400ºC and is also plotted
in Figure 9-9 (squares). As seen in Figure 9-9, the total stress-temperature function of
PH-2a corresponded to the same stress-temperature function of sample PH-1b, which in-
dicated that the heat-treatment at 400ºC was sufficient to release the initial tensile stress.
Furthermore, the elastic region of a thin Pd film annealed at 400ºC was also found to be
60-400ºC. Sample PH-3a, also pre-treated at 400ºC for one hour in He, was studied in
order to elucidate the thermal stress at temperatures higher than 400ºC.

Thermal stresses/thermal stress release
271
Figure 9-9 Stress in thin Pd films as a function of temperature. () PH-1b, () PH-2a and () PH-3a.
Thermal stresses/thermal stress release
272
Figure 9-9 shows the thermal stress vs. temperature behavior shown by sample PH-3a
(triangles) in the 350-500ºC temperature range. The stress at 350 and 400ºC was similar
to the stress shown by samples PH-1b and PH-2a at the same temperatures.
However, at 450ºC thermal stress started to relax and at 500ºC compressive stresses
were totally released (-2.7MPa) as a result of plastic deformations. Hence, the elastic re-
gion of thin Pd films annealed at 400ºC was found to be 20-400ºC and thermal stress
within the determined elastic region were given by Equation (9-13) with T in ºC.
!
"th
= #0.157 $T + 44.8 (9-13)
It is interesting to note that if a “fresh” composite Pd-PH structure was taken and pre-
treated at 400ºC for one hour in He, its initial microstrains and initial stress were relaxed
although its general microstructure was hardly affected (see Figure 9-4 (b)). Moreover,
plastic deformations occurred at temperatures higher than 400ºC that also corresponded
to temperatures at which significant changes in microstructure were observed as seen in
Figure 9-4 (c). The decrease of microstrains at elevated temperatures with minor crystal-
lite growth was also reported in earlier works (Reimann and Wurschum, 1997).
9.4.3 “Extrinsic” stresses upon H2 loading
9.4.3.1 The determination of n (H/Pd) at T and P
The amount of H2 absorbed, n (H/Pd), can be determined from Pd lattice parameter us-
ing Equation (9-6). However, the use of Equation (9-6) gives n(H/Pd) only up to ± 0.05.
All membranes throughout this study were characterized at a maximum H2 pressure of 5
bar and a minimum temperature of 250ºC. Figure 9-10 shows in blue the pres-
sure/n(H/Pd) region where all membranes were characterized.

Extrinsic stresses upon H2 absorption
273
Figure 9-10 Pd-H system in the high pressure and moderate temperature region. The
blue dashed line represents the H2 content (mol H/mol Pd) at 243ºC and an absolute pressure of 5 bar.
The maximum H2 content, n(H/Pd), was reached at the highest pressure (5 bar) and the
lowest temperature (250ºC) and estimated to be 0.06. Hence, any experiment performed
with the goal of understanding the influence of H2 concentration on H2 stress was carried
out at temperature and pressure conditions so that n(H/Pd) would lie within the region of
interest (0-0.06). Therefore, due to low accuracy of Equation (9-6) (±0.05) and the nar-
row window of n(H/Pd) at which the experiments in this section were carried out, the use
of Equation (9-6) to determine n(H/Pd) appeared inappropriate.
Extrinsic stresses upon H2 absorption
274
The H2 content, n(H/Pd), had to be determined from temperature and pressure values
using Sieverts’ constant, which relates P0.5 to n(H/Pd) by the following linear equation
!
PH2
1/ 2= K(T) " n(H /Pd) (9-14)
where Κ is the Sieverts’ constant in Pa0.5 or Torr0.5 determined from the H2 absorption
isotherm at the temperature T. Κ was determined for temperatures ranging from 0 to
300ºC from experimental data (H2 pressure, n(H/Pd)) reported by Gillespie and Hall
(1926), Gillespie and Galstaun (1936) and Wicke and Nersnt (1964). The experimental
data reported by Gillespie and Hall (1926) and Gillespie and Galstaun (1936) were avail-
able in a tabular form so that H2 absorption isotherms were plotted at 0, 30, 80, 160, 180,
200, 250, 290 and 300ºC and Κ was determined by considering only the linear portion of
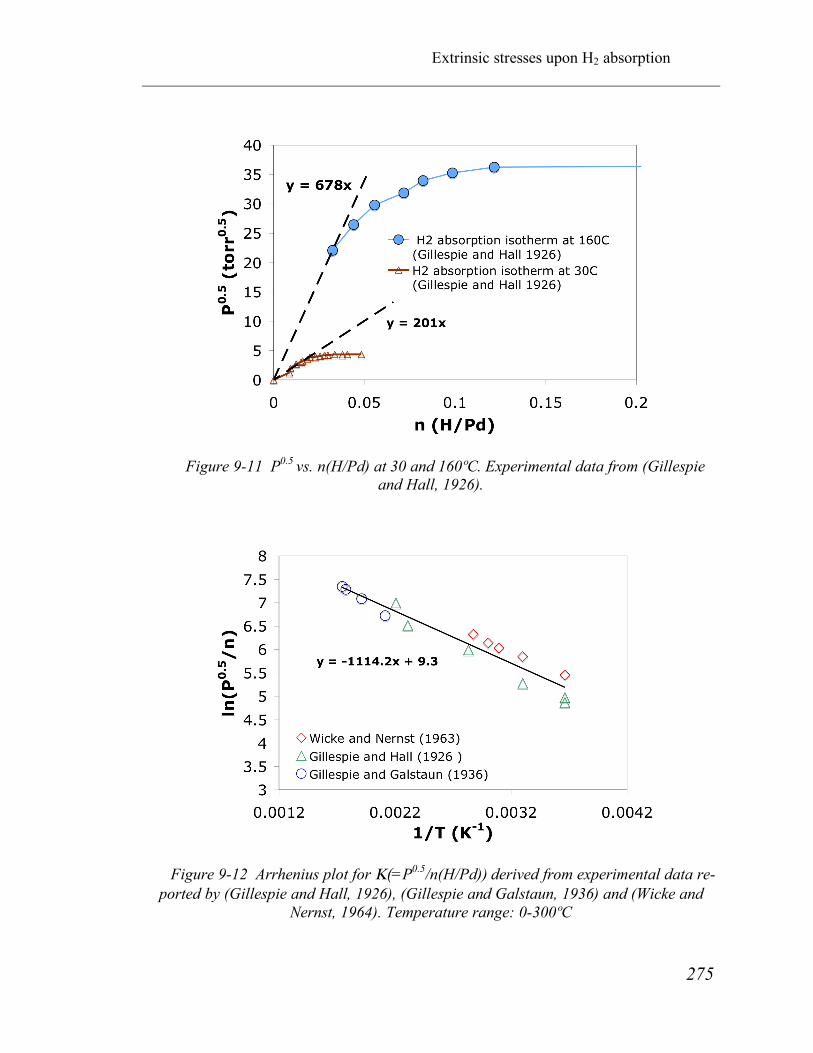
P0.5 vs. n(H/Pd) as shown in Figure 9-11 for the 30 and 160ºC isotherms. Data of Wicke
and Nersnt (1964) were only available in a high quality graph, and Κ was determined
with graphical methods for the 0, 30, 50, 60 and 75ºC isotherms. The natural logarithm of
Κ was then plotted as a function of the inverse temperature for all Κ values. The resulting
Arrhenius type of plot is shown in Figure 9-12. Hence, the H2 content, n(H/Pd), was de-
termined from the following equation
!
n(H /Pd) =P0.5
Exp("1114.2
T+ 9.3)
(9-15)
with P in torr and T in K. Equation (9-15) in only valid in the stability domain of the α
phase and, for a given temperature, in a pressure range where P0.5 is a linear function of
n(H/Pd).
Extrinsic stresses upon H2 absorption
275
Figure 9-11 P0.5 vs. n(H/Pd) at 30 and 160ºC. Experimental data from (Gillespie and Hall, 1926).
Figure 9-12 Arrhenius plot for Κ(=P0.5/n(H/Pd)) derived from experimental data re-ported by (Gillespie and Hall, 1926), (Gillespie and Galstaun, 1936) and (Wicke and
Nernst, 1964). Temperature range: 0-300ºC
Extrinsic stresses upon H2 absorption
276
Figure 9-13 shows a comparison between H2 concentration n(H/Pd) determined from
250 and 300ºC isotherms equations reported by Gillespie and Galstaun, (1936) and H2
concentration, n(H/Pd), determined from Equation (9-15) for the same temperatures and
pressures.
The model lines (dashed lines) overestimated by 0.001-0.002 n(H/Pd) the true H2 con-
centration at low values of n(H/Pd). At higher pressures, which corresponded to higher
values of n(H/Pd), the P0.5 vs. n(H/Pd) relation is no longer linear (specially for the
250ºC) and Equation (9-15) underestimates the true value of n(H/Pd).
At each temperature there is a pressure range where the relation P0.5 vs. n(H/Pd) is
linear. The higher the temperature the wider the pressure-range within which the relation
P0.5 vs. n(H/Pd) is linear. Therefore at temperatures higher than 300ºC the model fits
adequately the isotherms as seen in Figure 9-13. The accuracy on the H2 concentration
n(H/Pd) given by Equation (9-15) was estimated to be 0.002, which is significant higher
than the accuracy on n(H/Pd) given by Equation (9-6).
9.4.3.2 The presence of compressive stresses upon H2 loading
The expansion of the Pd lattice as a result of H2 absorption led to large compressive
stresses that can cause a composite Pd membrane to fail. Therefore, it was of great inter-
est to estimate the maximum compressive stresses a composite Pd membrane would be
subjected to during membrane characterization and/or membrane operation. This section
aims at the fundamental relation between H2 stress and n(H/Pd).

Extrinsic stresses upon H2 absorption
277
Figure 9-13 Comparison in H2 concentration n from isotherms and using Equation (9-15)

Extrinsic stresses upon H2 absorption
278
The total stress of sample PH-1c was measured in a flowing 4% H2-balance N2 mix-
ture atmosphere at a temperature of 60ºC and a pressure of 1.5 bar (H2 partial pressure of
6 kPa). Therefore, the initial H2 content corresponded to a H2 solubility c.a. 0.017 (H/Pd)
represented by the blue line in Figure 9-14. The use of Equation (9-15) taking P equal to
45.6 torr and T equal to 333K led to n= 0.0177, which supports the validity of Equation
(9-15). The total stress of sample PH-1c was then measured at 60, 100, 150, 200, 300 and
500ºC along with the lattice parameter of Pd. Increasing the temperature led to the
desorption of H2 and consequently to the decrease of compressive stresses.
Figure 9-15 shows Pd lattice expansion (Δa/a0 in %) as a function of temperature in He
atmosphere (open circles) and in the 4%H2-N2 balance atmosphere (solid circles). As ex-
pected, at 60ºC, the absorption of H2 led to an expansion of the lattice in addition to the
one caused by dilation. As the temperature was increased and the pressure kept constant,
H2 desorbed from the Pd film leading to the asymptotical approach of the lattice parame-
ter to the lattice parameter values measured in He atmosphere. The Pd lattice expansion
solely due to the contribution of H2 content ((aH-a0)/a0) was determined by subtracting the
contribution of lattice dilation due to temperature from the measured lattice parameter.
The H2 content n(H/Pd) was then determined making use of Equation (9-15) with P equal
to 45.6 torr and T ranging from 60 to 500ºC. The values of (aH-a0)/a0 were then plotted as
a function of n(H/Pd) as shown in Figure 9-16 and fitted with a straight line.

Extrinsic stresses upon H2 absorption
279
Figure 9-14 Pd-H system in the low pressure and low temperature region. The red line represents the α/(α+β) boundary. The blue line represents the H2 loading (mol
H/mol Pd) at 60ºC and an absolute H2 pressure of 0.06 bars. The green line represents the H2 loading (mol H/mol Pd) at 50ºC and an absolute H2 pressure of 0.04 bar.

Extrinsic stresses upon H2 absorption
280
Figure 9-15 Pd lattice expansion due to H2 uptake and temperature in sample PH-1c
Figure 9-16 Lattice increase due to interstitial H2 for sample PH-1c.

Extrinsic stresses upon H2 absorption
281
Pd lattice parameter increased linearly with n(H/Pd) according to Equation (9-16) with
a slightly different n(H/Pd) coefficient than Equation (9-6).
!
3 "a # a
0
a0
= 0.30 " n(H /Pd) (9-16)
Indeed, in this case kH equals to 0.3 and not 0.19, which is due to the fact that the film
is adhered to the substrate and can only expand perpendicularly (Zabel and Hjorvarsson,
2001).
The total stress induced by the Pd lattice expansion due to H2 loading and thermal
stresses is shown in Figure 9-17 for sample PH-1c. H2 absorption at 60ºC (n=0.017 H/Pd)
led to a 0.17% expansion in addition to temperature. The large Pd lattice parameter ex-
pansion, constrained by the support, caused the switch from a 40MPa tensile stress in He
to a 60MPa compressive stress in H2 as seen in Figure 9-17. As the temperature was in-
creased the compressive stress slowly decreased from 60MPa at 60ºC to 0MPa at
temperatures higher than 200ºC, which corresponded to stress values recorded in He at-
mosphere. The H2 stress component was derived by subtracting the elastic thermal stress
given by Equation (9-13) from the total measured stress Equation (9-7). The H2 content,
n(H/Pd), was calculated using Equation (9-15) with P equal to 45.6 torr and T ranging
from 60 to 500ºC. Figure 9-18 shows the H2 stress component (σH) as a function of
n(H/Pd). As expected σH was a linear function of n(H/Pd) in the 60-400ºC temperature
range. At 500ºC Equation (9-13) was no longer valid due to the stress relaxation by plas-
tic deformations, and the 500ºC experimental data point fell outside the predicted stress
line.

Extrinsic stresses upon H2 absorption
282
Figure 9-17 Stresses arisen in the Pd thin film due to H2 uptake
Figure 9-18 H2 stress as a function H2 content n(H/Pd)

Extrinsic stresses upon H2 absorption
283
Therefore, for any composite Pd-PH structure pre-treated at 400ºC, the H2 stress is
given by Equation (9-17)
!
"H
= #5146.0 $ n(H /Pd) (9-17)
The total stress in the composite Pd structure is given by the sum of Equation (9-13)
and Equation (9-17)
!
"total
= #0.157 $T # 5146.0 $ n(H /Pd) + 44.8 (9-18)
where σtotal is in MPa, T is in ºC and n in mol H/mol Pd. Equation (9-18) is only valid
within the elastic region of Pd, which was shown to be 20-400ºC. At temperatures above
400ºC, the elastic energy accumulated in stresses was released by dislocation or grain
boundary diffusional creep.
9.4.4 Estimation of stresses during membrane characterization
Knowing the fundamental principles and equations of thermal and H2 stresses it was
possible to estimate the total stress a composite Pd-PH membrane is subjected to by using
Equation (9-18). The use of Equation (9-18) implied that the composite Pd membrane
was already preanneled in He at 400ºC for one hour. To determine the total stress at 250
and 300ºC, n (H/Pd) was determined by using the experimental isotherms at 250 and
300ºC reported by Gillespie and Galstaun (1936) but also using Equation (9-15) in order
to see the differences between the stress values calculated from the model (Equation (9-
18)) and those calculated using the Pd-H isotherms.
Figure 9-19 shows the total stress calculated at 250, 300, 400 and 500ºC using
Equation (9-15) (dashed lines) and the experimental isotherms from Gillespie and
Galstaun (1936) (solid lines).

Stress estimation during membrane characterization
284
Figure 9-19 Total stress calculations for a Pd composite membrane as a function of pressure difference at 250, 300, 400 and 500ºC. Solid lines at 250 and 300C represent stress calculation using the actual isotherms at 250 and 300C (Gillespie and Galstaun (1936) for the determination of n (H/Pd). Dashed lines represent stress calculations using Equation 5.19 for the determination of n
(H/Pd)
Stress estimation during membrane characterization
285
In the low pressure range the model overestimates the stress value since Equation (9-
15) overstimates n(H/Pd) at low H2 content values. However, in the high pressure range
the model sligtly underestimates the stress value. Moreover, at high pressures and low
temperatures, for instance 5 bar at 250ºC, the difference in total stress between the model
and the true stress value is quite high (26MPa) since at 250ºC the relation P0.5 vs. n is not
linear in the 0-5bar pressure range and the model undersestimates the H2 content. As the
temperature is increased to 300ºC, the difference between the model and the true stress
value is smaller (6MPa) since at 300ºC the experimental P0.5 vs. n(H/Pd) relation could be
fitted quite well with a straight line in the 0-5 bar pressure range.
Therefore, the model will always slightly overestimate the stress at low pressure.
However, at high temperatures (T>300ºC) Equation (9-15) can estimate the stress very
well due to the linearity of P0.5 vs. n(H/Pd) in the 0-5 bar pressure range.
Figure 9-19 also shows that a composite Pd-PH membrane pre-annealed at 400ºC will
always be under compressive stresses. The calculated stress values at 500ºC are obvi-
ously an indication of what would be the stress without relaxation. Indeed, at
temperatures higher than 400ºC the elasticity region of Pd is exceeded and stresses relax
leading to lower values than the predicted ones. However, experiments on samples PH-
1a, PH-2a, PH-3a and especially PH-1c suggested that at 500ºC composite Pd-PH struc-
tures were still under small compression stresses. Finally, the maximum stress to which
these composite Pd membranes were subjected at 250ºC and 5 bar was estimated to be
compressive with a magnitude of 265 MPa (see Figure 9-19).
The experimental data collected for all membranes at 250ºC in He and H2 atmosphere
suggested that holding a composite Pd membrane at 250ºC in H2 atmosphere did not lead

Stress estimation during membrane characterization
286
to leakages. That is, even after excursion up to H2 pressures equal to 4.5 bar at 250ºC,
where compressive stresses are the highest and equaled 260MPa, no leaks were measured
in the composite Pd membrane. At 500ºC and at 2 bar H2 pressure in the shell side the
total stress was calculated to be compressive 100MPa if no stress release occurs. There-
fore, it appears that stresses do not have a crucial role in leak development.
9.4.5 The effect of atmosphere cycling
During membrane operation, H2 was introduced at 250ºC at a ΔP of 1 bar, which cor-
responded to a change in total stress from 6MPa tensile to 150 MPa compressive. It was
of interest to understand how critical this change in nature and magnitude of the total
stress was to the composite Pd membranes. Figure 9-20 shows the Williamson-Hall plot
of sample PH-4a pre-annealed at 400ºC in He for 1 hr. The atmosphere was changed five
times at 50ºC using UHP He and 4% H2-balance N2 at a 1bar pressure. Therefore, ten sets
of data were plotted in Figure 9-20, five in He atmosphere and five in H2 atmosphere.
The experimental temperature and H2 pressure parameters allowed us to study the intro-
duction of microstrains by changing H2 concentration in Pd between 0 and 0.015 n
(H/Pd) (see green line in Figure 9-14). The changes in the H2 concentration corresponded
to changes in total stress between 40 MPa tensile in He and 40 MPa compressive in H2.
For the atmospheres, He and H2, no trend has been seen as a result of cycle number,
that is, microstrains or the slope of the lines β·cos(θ) vs. sin(θ) did not increase system-
atically with cycle number.

Stress estimation during membrane characterization
287
Figure 9-20 Microstrains in He and H2 atmosphere for sample PH-4a pre-annealed in He at 400ºC for one hour

Stress estimation during membrane characterization
288
As a consequence, an average microstrains value was estimated for the five H2 lines
and a second microstrains value was considered for the five He lines. As seen on Figure
9-20, the average microstrains (0.025%) in He atmosphere was smaller than in H2
(0.029%) and both were very small compared to the initial microstrains present in the
layer (0.29%).
Consequently, the heat-treatment of Pd thin films at 400ºC for one hour in He led to
the irreversible release of microstrains. Once the microstrains were released, even by ap-
plying large stresses to the composite Pd-PH structure did not reintroduce microstrains.
Microstrains only exist in freshly deposited samples.
9.4.6 Stress measurements in Pd-Cu –PH composite structures
The thermal stresses in composite Pd-Cu-PH were measured for the α phase and the β
phase. Figure 9-21 shows the thermal stresses as a function of temperature for samples
Pd-Cu-5 and Pd-Cu-6. The H2 for pure Pd samples was also plotted for comparison pur-
poses. Figure 9-21 shows that Pd-Cu layers on PH were subjected to higher tensile
stresses in the 20-400ºC temperature range than Pd layers on PH. Higher tensile stresses
in Pd-Cu alloys were consistent with the fact that Pd-Cu alloys have a larger thermal ex-
pansion coefficient than Pd. The thermal expansion coefficient of Pd-Cu alloys increases
with Cu content, therefore, higher tensile stresses were expected for the Pd-Cu 40wt% (β
phase) than for the Pd-Cu 10wt% alloy (α phase). Unfortunately, the thermal stresses on
sample Pd-Cu-6 with the Pd-Cu α phase were measured with a low accuracy due to the
low 2θ reflection considered. Figure 9-21 also indicates, by extrapolation to higher tem-
peratures, that thermal stresses in the Pd-Cu layer were tensile at 500ºC if no stress
release occurred.

289
Figure 9-21 Thermal stresses as a function of temperature for the β phase (open circles) and the α phase (open diamonds)

290
The H2 solubility in Pd-Cu alloys is very low. For instance, for the same H2 pressure
and temperature, the H2 solubility is 100 times lower in Pd-Cu 40wt% than in pure Pd
(Völkl and Alefeld, 1978). Therefore, H2 stresses in a composite Pd-Cu 40wt% – PH
structure should be 100 times lower than H2 stresses in a composite Pd-PH structures.
The maximum H2 stress in a composite Pd-PH structures (at T=250ºC and P=4.5 bar) was
estimated to be equal to 300MPA, therefore in a composite Pd-Cu 40wt% – PH structure
the maximum H2 stress would be equal to 3MPa. In fact, in composite Pd-Cu-PH struc-
tures H2 stresses are negligible and the total stress equals the thermal stress. Hence,
composite Pd-Cu 40wt% – PH structures are subjected to tensile stresses in the 20-400ºC
temperature range regardless of the atmosphere. At temperatures higher than 400ºC,
thermal stresses may become compressive with further stress release.
9.5 Conclusions
Freshly prepared composite Pd-PH structures were characterized by small Pd grains
(50-100nm), an initial tensile intrinsic stress of 104.7MPa and an initial microstrains
value of 0.29%. Initial microstrains and stress were released by heat-treatment in He at
400ºC for one hour with no visible change in microstructure. After annealing at 400ºC,
thermal stresses were found to be a linear function of temperature in the 20-400ºC elastic-
ity region in agreement with the literature. At temperatures higher than 400ºC stress
relaxation occurred with visible changes in microstructure. Pd lattice parameter and H2
stresses were found to be linear functions of H2 concentration n (H/Pd) also in agreement
with previous works. Stress estimations for pre-treated composite Pd membranes at
400ºC showed that the Pd thin films were always under compressive stresses. During
membrane characterization the maximum compressive stress was reached at 250ºC and a
291
pressure of 5 bar and equaled 265 MPa. In addition stress did not play an important role
in leak formation.