Embed Size (px)
Citation preview
9
Chapter 9 – Air quality
Air quality
This chapter describes the methodology used to assess the impacts of the project on regional, local and in-tunnel air quality, the results of that assessment, proposed mitigation measures to avoid or reduce the impacts and how the desired performance outcomes have been met. Appendix E (Air quality technical report) provides greater detail on the monitoring and modelling methodologies and results. Table 9-1 sets out the SEARs relevant to air quality and identifies where the requirements have been addressed in this EIS.
Table 9-1 SEARs - Air quality
Assessment requirements Where addressed in this EIS 1. The Proponent must undertake an air quality impact assessment (AQIA) addressing local and regional air quality impacts for construction and operation of the project in accordance with the current guidelines.
The full AQIA is reported in Appendix E (Air quality technical report).
2. The Proponent must ensure the AQIA also includes the Section 9.5 and section 9.6 and Appendix E (Air quality following: technical report). (a) demonstrated ability to comply with the relevant
regulatory framework, specifically the Protection of the Environment Operations Act 1997 and the Protection of the Environment Operations (Clean Air) Regulation 2010;
(b) the identification of all potential sources of air pollution including details of the location, configuration and design of all potential emission sources including ventilation systems and tunnel portals;
Section 9.5 and section 9.6 and Appendix E (Air quality technical report).
(c) a review of vehicle emission trends and an assessment that uses or sources best available information on vehicle emission factors;
Section 9.4.3, Appendix E and Annexure K (Ventilation report) of Appendix E (Air quality technical report).
(d) an assessment of impacts (including human health impacts) from potential emissions of PM10, PM2.5, CO, NO2 and other nitrogen oxides and volatile organic compounds (e.g. BTEX) including consideration of short and long-term exposure periods;
Section 9.5 and section 9.6 and Appendix E (Air quality technical report). Refer to Appendix F (Human health technical report) for human health impacts.
(e) consider the impacts from the dispersal of these air Section 9.5 and section 9.6 and Appendix E (Air quality pollutants on the ambient air quality along the proposal technical report). route, proposed ventilation outlets and portals, surface roads, ramps and interchanges and the alternative surface road routes;
(f) a qualitative assessment of the redistribution of ambient air quality impacts compared with existing conditions, due to the predicted changes in traffic volumes;
Section 9.6.7
(g) assessment of worst case scenarios for in-tunnel and ambient air quality, including a range of potential ventilation scenarios and range of traffic scenarios, including worst case design maximum traffic flow scenario (variable speed) and worst case breakdown scenario, and discussion of the likely occurrence of each;
Section 9.6 and Annexure K (Ventilation report) of Appendix E (Air quality technical report).
(h) details of the proposed tunnel design and mitigation measures to address in-tunnel air quality and the air quality in the vicinity of portals and any mechanical ventilation systems (i.e. ventilation outlets and air inlets) including details of proposed air quality monitoring (including frequency and criteria);
Chapter 5 (Project development and alternatives), Chapter 6 (Project description) and Appendix E (Air quality technical report).
F6 Extension Stage 1 from New M5 Motorway at Arncliffe to President Avenue at Kogarah 9-1
Chapter 9 – Air quality
Assessment requirements Where addressed in this EIS (i) a demonstration of how the project and ventilation
design ensures that concentrations of air emissions meet NSW, national and international best practice for in-tunnel and ambient air quality, and taking into consideration the approved criteria for the New M5 project and the In-Tunnel Air Quality (Nitrogen Dioxide) Policy;
Section 9.6 and Appendix E (Air quality technical report).
(j) details of any emergency ventilation systems, such as air intake/ exhaust outlets, including protocols for the operation of these systems in emergency situations, potential emission of air pollutants and their dispersal, and safety procedures;
The ventilation facilities, including emergency systems and their operation, are described in Chapter 6 (Project description).
(k) details of in-tunnel air quality control measures considered, including air filtration, and justification of the proposed measures or for the exclusion of other measures;
The in-tunnel air quality control measures and their justification are described in section 9.7 and Appendix E (Air quality technical report).
(l) a description and assessment of the impacts of potential emissions sources relating to construction, including details of the proposed mitigation measures to prevent the generation and emission of dust (particulate matter and TSP) and air pollutants (including odours) during the construction of the project, particularly in relation to ancillary facilities (such as concrete batching plants), tunnel spoil handling and cut and cover earthworks, the use of mobile plant, stockpiles and the processing and movement of spoil; and
Section 9.5
(m) a cumulative assessment of the in-tunnel, local and regional air quality impacts from the operation of the project and due to the operation of and potential continuous travel through existing and committed future motorway tunnels and surface roads.
Section 9.6.8 and Appendix E (Air quality technical report). An analysis of the potential cumulative impacts is provided in section 9.6.10.
9.1 Background
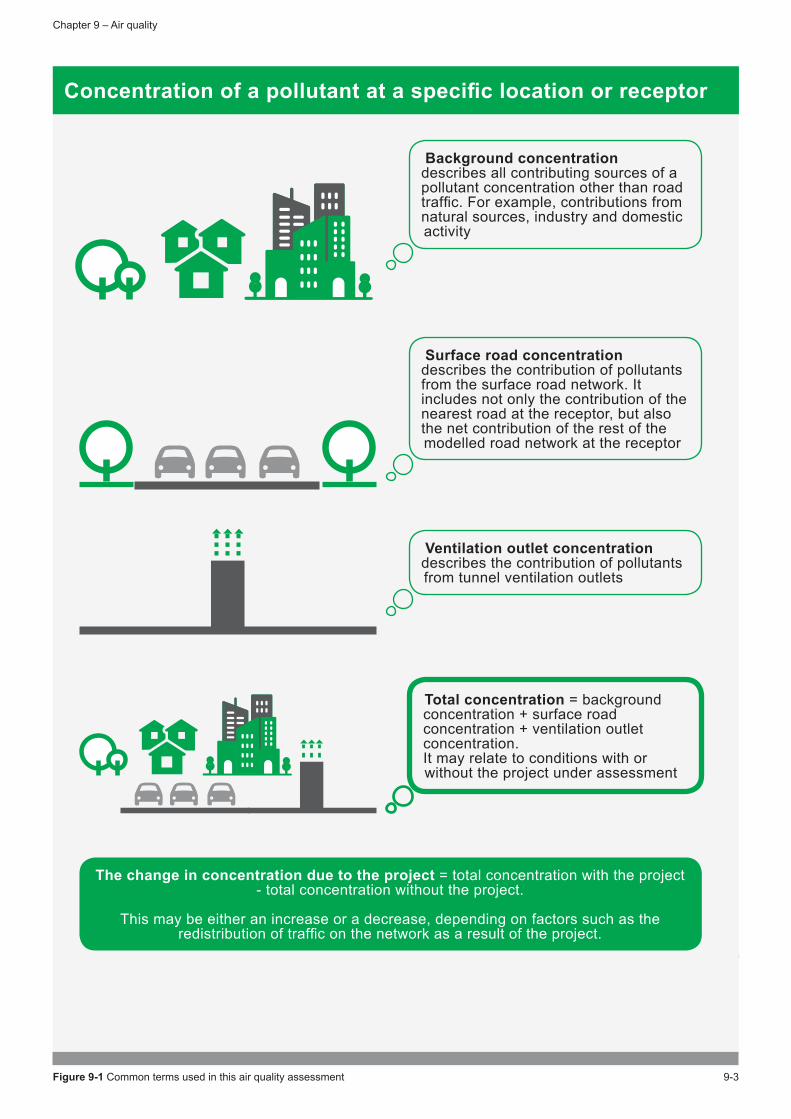
9.1.1 Terminology The concentration of a pollutant at a given location includes contributions from various sources.
Figure 9-1 shows the terms used in this assessment to describe the concentration of a pollutant at a specific location or receptor.
F6 Extension Stage 1 from New M5 Motorway at Arncliffe to President Avenue at Kogarah 9-2
Chapter 9 – Air quality
9.1.2 In-tunnel air quality This section outlines the various air filtration and ventilation options for in-tunnel air quality, and outlines the approach adopted for the project and therefore used in this assessment.
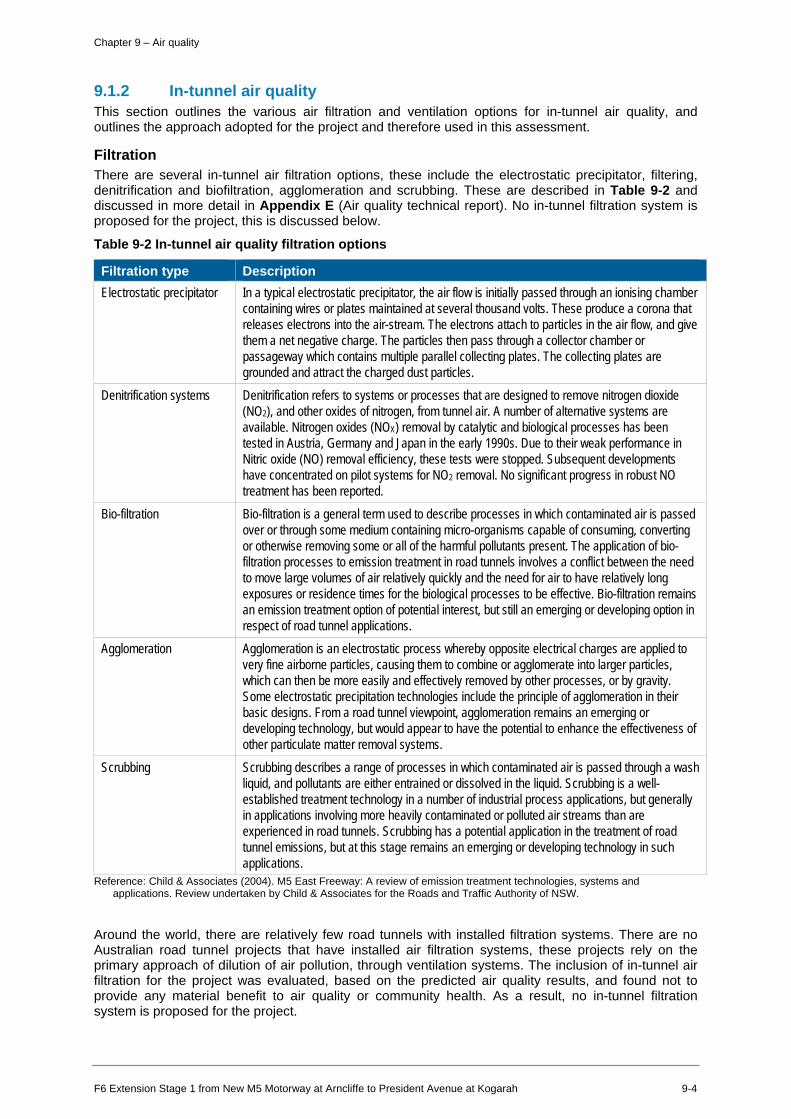
Filtration There are several in-tunnel air filtration options, these include the electrostatic precipitator, filtering, denitrification and biofiltration, agglomeration and scrubbing. These are described in Table 9-2 and discussed in more detail in Appendix E (Air quality technical report). No in-tunnel filtration system is proposed for the project, this is discussed below.
Table 9-2 In-tunnel air quality filtration options
Filtration type Description Electrostatic precipitator In a typical electrostatic precipitator, the air flow is initially passed through an ionising chamber
containing wires or plates maintained at several thousand volts. These produce a corona that releases electrons into the air-stream. The electrons attach to particles in the air flow, and give them a net negative charge. The particles then pass through a collector chamber or passageway which contains multiple parallel collecting plates. The collecting plates are grounded and attract the charged dust particles.
Denitrification systems Denitrification refers to systems or processes that are designed to remove nitrogen dioxide (NO2), and other oxides of nitrogen, from tunnel air. A number of alternative systems are available. Nitrogen oxides (NOX) removal by catalytic and biological processes has been tested in Austria, Germany and Japan in the early 1990s. Due to their weak performance in Nitric oxide (NO) removal efficiency, these tests were stopped. Subsequent developments have concentrated on pilot systems for NO2 removal. No significant progress in robust NO treatment has been reported.
Bio-filtration Bio-filtration is a general term used to describe processes in which contaminated air is passed over or through some medium containing micro-organisms capable of consuming, converting or otherwise removing some or all of the harmful pollutants present. The application of bio-filtration processes to emission treatment in road tunnels involves a conflict between the need to move large volumes of air relatively quickly and the need for air to have relatively long exposures or residence times for the biological processes to be effective. Bio-filtration remains an emission treatment option of potential interest, but still an emerging or developing option in respect of road tunnel applications.
Agglomeration Agglomeration is an electrostatic process whereby opposite electrical charges are applied to very fine airborne particles, causing them to combine or agglomerate into larger particles, which can then be more easily and effectively removed by other processes, or by gravity. Some electrostatic precipitation technologies include the principle of agglomeration in their basic designs. From a road tunnel viewpoint, agglomeration remains an emerging or developing technology, but would appear to have the potential to enhance the effectiveness of other particulate matter removal systems.
Scrubbing Scrubbing describes a range of processes in which contaminated air is passed through a wash liquid, and pollutants are either entrained or dissolved in the liquid. Scrubbing is a well-established treatment technology in a number of industrial process applications, but generally in applications involving more heavily contaminated or polluted air streams than are experienced in road tunnels. Scrubbing has a potential application in the treatment of road tunnel emissions, but at this stage remains an emerging or developing technology in such applications.
Reference: Child & Associates (2004). M5 East Freeway: A review of emission treatment technologies, systems and applications. Review undertaken by Child & Associates for the Roads and Traffic Authority of NSW.
Around the world, there are relatively few road tunnels with installed filtration systems. There are no Australian road tunnel projects that have installed air filtration systems, these projects rely on the primary approach of dilution of air pollution, through ventilation systems. The inclusion of in-tunnel air filtration for the project was evaluated, based on the predicted air quality results, and found not to provide any material benefit to air quality or community health. As a result, no in-tunnel filtration system is proposed for the project.
F6 Extension Stage 1 from New M5 Motorway at Arncliffe to President Avenue at Kogarah 9-4
Chapter 9 – Air quality
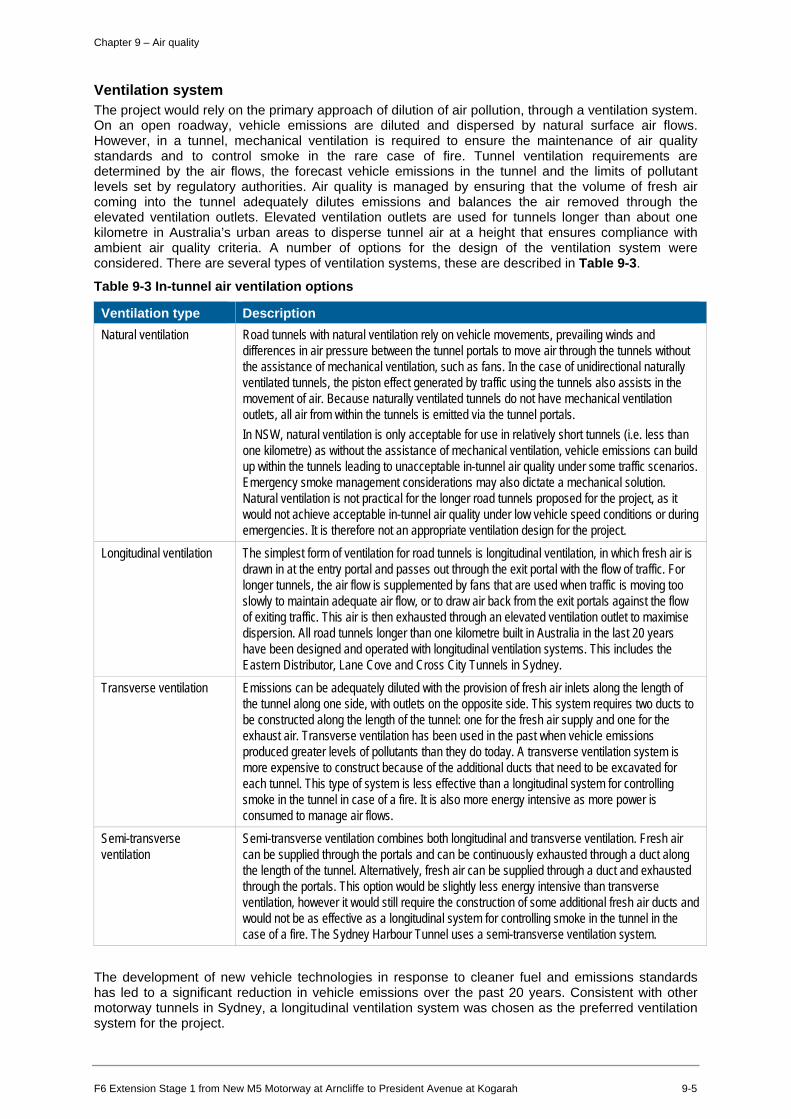
Ventilation system The project would rely on the primary approach of dilution of air pollution, through a ventilation system. On an open roadway, vehicle emissions are diluted and dispersed by natural surface air flows. However, in a tunnel, mechanical ventilation is required to ensure the maintenance of air quality standards and to control smoke in the rare case of fire. Tunnel ventilation requirements are determined by the air flows, the forecast vehicle emissions in the tunnel and the limits of pollutant levels set by regulatory authorities. Air quality is managed by ensuring that the volume of fresh air coming into the tunnel adequately dilutes emissions and balances the air removed through the elevated ventilation outlets. Elevated ventilation outlets are used for tunnels longer than about one kilometre in Australia’s urban areas to disperse tunnel air at a height that ensures compliance with ambient air quality criteria. A number of options for the design of the ventilation system were considered. There are several types of ventilation systems, these are described in Table 9-3.
Table 9-3 In-tunnel air ventilation options
Ventilation type Description Natural ventilation Road tunnels with natural ventilation rely on vehicle movements, prevailing winds and
differences in air pressure between the tunnel portals to move air through the tunnels without the assistance of mechanical ventilation, such as fans. In the case of unidirectional naturally ventilated tunnels, the piston effect generated by traffic using the tunnels also assists in the movement of air. Because naturally ventilated tunnels do not have mechanical ventilation outlets, all air from within the tunnels is emitted via the tunnel portals. In NSW, natural ventilation is only acceptable for use in relatively short tunnels (i.e. less than one kilometre) as without the assistance of mechanical ventilation, vehicle emissions can build up within the tunnels leading to unacceptable in-tunnel air quality under some traffic scenarios. Emergency smoke management considerations may also dictate a mechanical solution. Natural ventilation is not practical for the longer road tunnels proposed for the project, as it would not achieve acceptable in-tunnel air quality under low vehicle speed conditions or during emergencies. It is therefore not an appropriate ventilation design for the project.
Longitudinal ventilation The simplest form of ventilation for road tunnels is longitudinal ventilation, in which fresh air is drawn in at the entry portal and passes out through the exit portal with the flow of traffic. For longer tunnels, the air flow is supplemented by fans that are used when traffic is moving too slowly to maintain adequate air flow, or to draw air back from the exit portals against the flow of exiting traffic. This air is then exhausted through an elevated ventilation outlet to maximise dispersion. All road tunnels longer than one kilometre built in Australia in the last 20 years have been designed and operated with longitudinal ventilation systems. This includes the Eastern Distributor, Lane Cove and Cross City Tunnels in Sydney.
Transverse ventilation Emissions can be adequately diluted with the provision of fresh air inlets along the length of the tunnel along one side, with outlets on the opposite side. This system requires two ducts to be constructed along the length of the tunnel: one for the fresh air supply and one for the exhaust air. Transverse ventilation has been used in the past when vehicle emissions produced greater levels of pollutants than they do today. A transverse ventilation system is more expensive to construct because of the additional ducts that need to be excavated for each tunnel. This type of system is less effective than a longitudinal system for controlling smoke in the tunnel in case of a fire. It is also more energy intensive as more power is consumed to manage air flows.
Semi-transverse ventilation
Semi-transverse ventilation combines both longitudinal and transverse ventilation. Fresh air can be supplied through the portals and can be continuously exhausted through a duct along the length of the tunnel. Alternatively, fresh air can be supplied through a duct and exhausted through the portals. This option would be slightly less energy intensive than transverse ventilation, however it would still require the construction of some additional fresh air ducts and would not be as effective as a longitudinal system for controlling smoke in the tunnel in the case of a fire. The Sydney Harbour Tunnel uses a semi-transverse ventilation system.
The development of new vehicle technologies in response to cleaner fuel and emissions standards has led to a significant reduction in vehicle emissions over the past 20 years. Consistent with other motorway tunnels in Sydney, a longitudinal ventilation system was chosen as the preferred ventilation system for the project.
F6 Extension Stage 1 from New M5 Motorway at Arncliffe to President Avenue at Kogarah 9-5
Chapter 9 – Air quality
Although other mechanical ventilation systems (such as natural ventilation, transverse ventilation and semi-transverse ventilation as discussed above) could be designed to meet in-tunnel air quality criteria, a well-designed longitudinal ventilation system is considered most suitable as it can maintain acceptable air quality in long tunnels, has proven effectiveness for smoke management in the case of fire, and would provide the most efficient and effective tunnel ventilation1.
The effectiveness of elevated ventilation outlets in dispersing emissions is well established.
Monitoring and management of the ventilation system Detailed design of the in-tunnel monitoring system will be undertaken in future project development phases and will comprise the following;
NOx, NO2, CO and visibility: Monitoring of each pollutant will be undertaken throughout the tunnel. Locations for monitoring equipment will generally be at the beginning and end of each ventilation section. For example, at each entry ramp, exit ramp, merge point, diverge point and ventilation exhaust and supply points. The location of monitors will be governed by the need to meet the in-tunnel air quality criteria for all possible journeys, especially in the case of NO2. This will require sufficient monitors to calculate a journey average exposure and they will be integrated with the monitoring system for the adjoining WestConnex tunnels for this purpose.
Velocity monitors will be placed in each tunnel ventilation section and at portal entry and exit points. The velocity monitors in combination with the air quality monitors will be used to modulate the ventilation system to manage air quality and to ensure net inflow at the tunnel portals.
9.1.3 Ambient air quality The inclusion of filtration would result in no material change in air quality in the surrounding community as compared to the current project ventilation system and outlet design. Any predicted changes in the concentration of pollutants would be driven by changes in the surface road traffic.
Section 9.6 presents the air quality assessments for both in-tunnel and ambient air quality.
9.2 Construction assessment methodology The main air pollution and amenity considerations at demolition/construction sites are:
• Annoyance due to dust depositing on surfaces (e.g. soiling of surface at residences) and visible dust plumes
• Elevated particulate matter less than or equal to 10 micrometre (PM10) concentrations due to on-site dust generating activities
• Increased concentrations of airborne particles and nitrogen dioxide (NO2) due to exhaust emissions from on-site diesel-powered vehicles and construction equipment. Exhaust emissions from on-site plant and site traffic are unlikely to have a significant impact on local air quality, and in the majority of cases they would not need to be quantitatively assessed.
Construction activities can be categorised into four types to reflect their potential impacts. The potential for dust emissions has been assessed for each likely activity in each category:
• Demolition is any activity that involves the removal of existing structures
• Earthworks covers the processes of soil stripping, ground levelling, excavation and landscaping. Earthworks primarily involve excavating material, haulage, tipping and stockpiling
• Construction is any activity that involves the provision of new structures, or modification or refurbishment of existing structures. ‘Structures’ include buildings, ventilation outlets and roads
• Track-out involves the transport of dust and dirt from the construction/demolition site onto the public road network on construction vehicles. These materials may then be deposited and re-suspended by vehicles using the network.
There are other potential impacts of demolition and construction, such as the release of heavy metals, asbestos fibres, silica dust or other pollutants during the demolition of certain buildings such as former chemical works, or the removal of contaminated soils. Specific regulatory procedures govern the actions taken to minimise the risk of harm from release and removal of these materials.
1 Advisory Committee on Tunnel Air Quality (2014). Technical Paper 04: Road Tunnel Ventilation Systems NSW Government
F6 Extension Stage 1 from New M5 Motorway at Arncliffe to President Avenue at Kogarah 9-6
Chapter 9 – Air quality
The risk of dust impacts from a demolition/construction site causing loss of amenity and/or health or ecological impacts is related to the following:
• The nature and duration of the activities being undertaken
• The size of the site
• The meteorological conditions (wind speed, direction and rainfall). Adverse impacts are more likely to occur downwind of the site and during drier periods
• The proximity of receptors to the activities
• The sensitivity of the receptors to dust
• The adequacy of the mitigation measures applied to reduce or eliminate dust.
It is difficult to reliably quantify dust emissions from construction activities, due to the variability of the weather at times when specific construction activities are undertaken. Any effects of construction on airborne particle concentrations would also generally be temporary and relatively short-lived.
Construction activities would occur at several sites, as described in Chapter 7 (Construction), section 9.5 and Table 9-16. Many of these activities would be transitory (i.e. not permanent). The majority of the project would be underground; however, surface works would be required to support tunnelling activities and to construct surface infrastructure.
The guidance published by the Institute of Air Quality Management (IAQM)2 was used for the assessment of air quality during construction (Appendix E (Air quality technical report)). The IAQM guidance has been adapted for use in NSW, taking into account factors such as the assessment criteria for ambient PM10 concentrations. The potential construction air quality impacts were assessed based on the proposed works, plant and equipment, and the potential emission sources and levels.
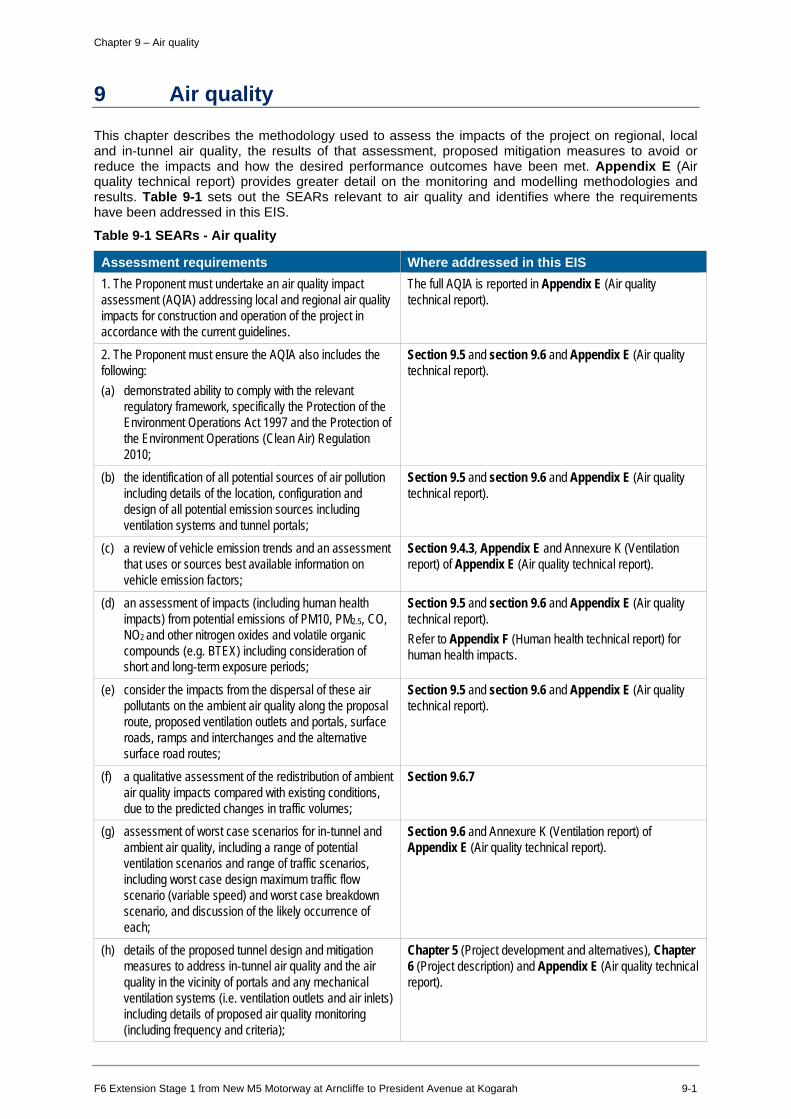
The assessment of construction dust using the IAQM procedure is outlined in Figure 9-2.
2 IAQM (2014) Guidance on the assessment of dust from demolition and construction. Institute of Air Quality Management, London. http://iaqm.co.uk/text/guidance/construction-dust-2014.pdf
F6 Extension Stage 1 from New M5 Motorway at Arncliffe to President Avenue at Kogarah 9-7
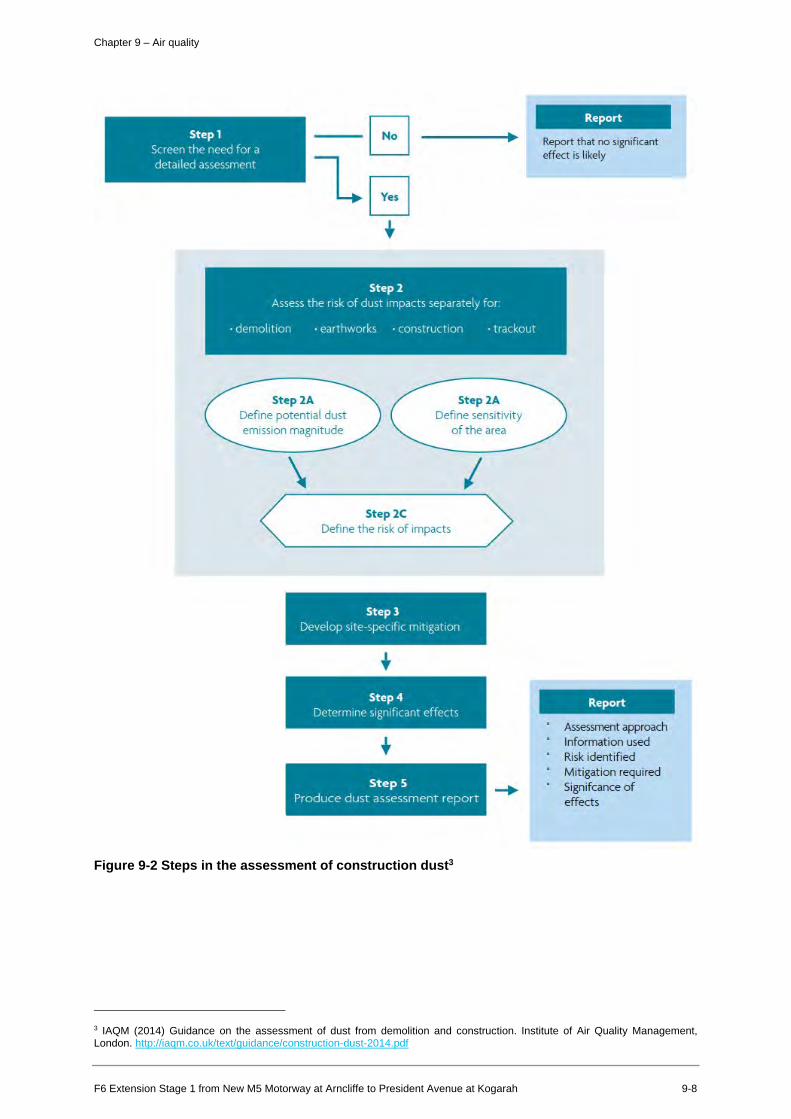
1 Screen the need for a detailed assessment
-B --iB
+ Step 2
Assess the risk of dust impacts separately for:
• demolition · earthworks · construction
Step 2A Define potential dust emission magnitude
\ Step 2C
Defi ne the risk of impacts
Step 3 Develop s1te-spec1f1c m1t1gat1on
+ Step4
Determine significant effects
+ Step 5
I
Pro duce dust assessment report
· t rackout
Report
Report that no significant effect is likely
Report
Assessment approach Information used Risk identified Mit igation required Signifcance of effects
Chapter 9 – Air quality
Figure 9-2 Steps in the assessment of construction dust3
3 IAQM (2014) Guidance on the assessment of dust from demolition and construction. Institute of Air Quality Management, London. http://iaqm.co.uk/text/guidance/construction-dust-2014.pdf
F6 Extension Stage 1 from New M5 Motorway at Arncliffe to President Avenue at Kogarah 9-8
Chapter 9 – Air quality
9.3 Operation assessment methodology The assessment of operational air quality impacts took into account the emissions from motor vehicles on both surface roads and tunnel roads.
Two types of criteria were used to assess the air quality for the operation of the project. These are ambient or outdoor air quality criteria and in-tunnel criteria. Compliance with both criteria is an essential consideration during road tunnel design and operation. An ambient air quality standard defines a metric (measure) relating to the concentration of an air pollutant in the outdoor air. Standards are usually designed to protect human health, including sensitive people such as children, the elderly and people suffering from respiratory disease. Air quality standards are typically a concentration limit for a given averaging period (e.g. annual mean, 24-hour mean), which may be stated as a ‘not-to-be-exceeded’ value or with some exceedances permitted (see section 9.3.2). Several different averaging periods may be used for the same pollutant to address long-term and short-term exposure.
In NSW, air pollutants are divided into ‘criteria’ pollutants and ‘air toxics’. Criteria pollutants tend to be ubiquitous, i.e. found everywhere, and emitted in relatively large quantities, and their health effects are relatively well known. Air toxics are gaseous or particulate organic pollutants that are present in the air in low concentrations, but are defined on the basis that they are, for example, highly toxic or last a long time in the environment so as to be a hazard to humans, plants or animal life.
9.3.1 In-tunnel air quality assessment In-tunnel traffic, air flows, pollution levels, and temperatures for the project were modelled using the IDA Tunnel software4. The criteria, scenarios, data and detailed method that were used in the tunnel ventilation simulations, and the detailed results of the simulations, are provided in full in Annexure K of Appendix E (Air quality technical report).
Air quality criteria The air quality criteria used to assess and manage air quality in tunnels have changed in recent years as a result of significant changes in vehicle emissions. Traditionally, CO was the key criterion used to protect the health of tunnel users. Following reductions in CO in vehicle emissions, there is relatively more NO2 in tunnel air than in the past. NO2 is a respiratory irritant with identified health effects at levels that may be encountered in road tunnels. An extensive review of the scientific literature commissioned by NSW Health found some evidence of health effects from short-term (20 to 30 minutes) exposure to NO2 concentrations between 0.2 and 0.5 parts per million (ppm). No health effects were identified from short-term (20–30 minutes) exposure at NO2 levels below 0.2 ppm in this review.
For the operating years of the project, NO2 would be the pollutant that determines the required airflow and drives the design of the tunnel ventilation system for in-tunnel pollution. DP&E issued a report in January 2015 that included discussion on this topic for the NorthConnex project. The Planning Secretary’s Environmental Assessment Report for the NorthConnex project states:
‘The Department considers that nitrogen dioxide (NO2) is now the key pollutant of concern for in-tunnel air quality. While carbon monoxide has historically been the basis for in-tunnel criteria in NSW and internationally, improvements in modern vehicle technology mean that NorthConnex will comply with existing health based carbon monoxide standards. By contrast, vehicle emissions of NO2 have fallen less quickly, and uptake of diesel vehicles (which produce more NO2 than petrol based vehicles) has risen … Accordingly, it is recommended that the Proponent’s design criteria for NO2 of 0.5 ppm (averaged over 15 minutes) be applied as an average across the tunnel under all operating conditions.’
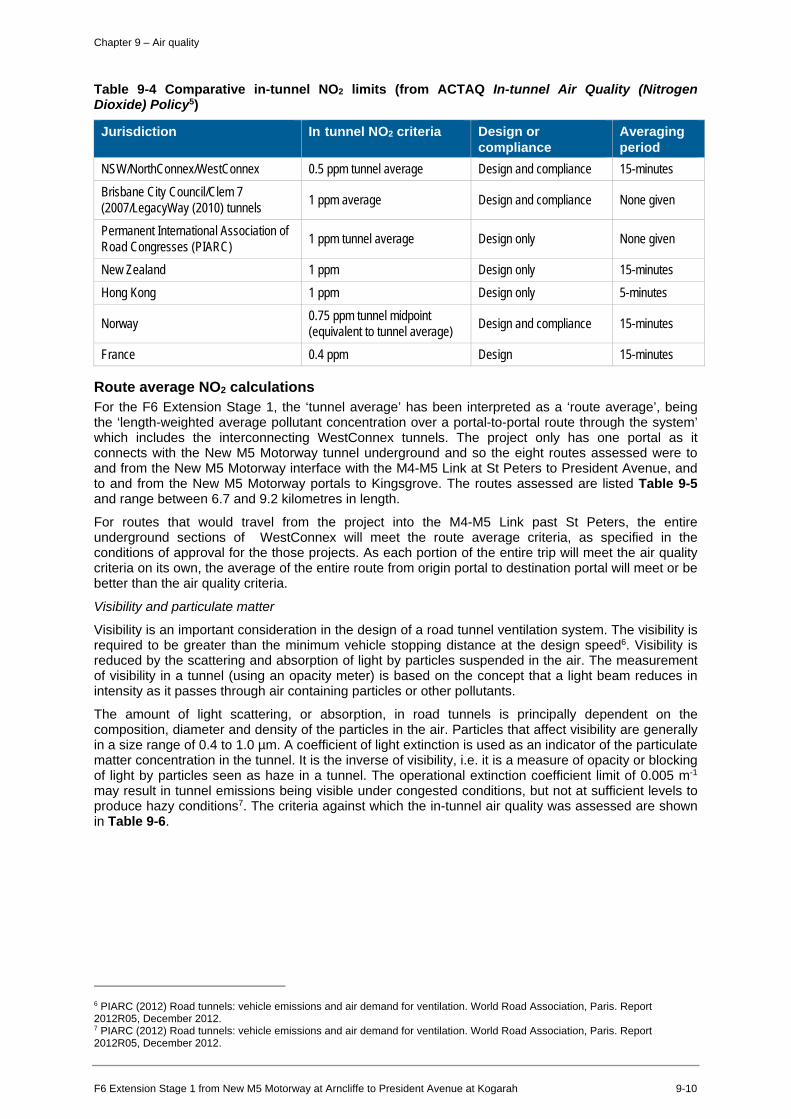
In February 2016, the NSW Government Advisory Committee on Tunnel Air Quality (ACTAQ) issued a document entitled In-tunnel Air Quality (Nitrogen Dioxide) Policy5 . The policy wording requires tunnels to be ‘designed and operated so that the tunnel average nitrogen dioxide (NO2) concentration is less than 0.5 ppm as a rolling 15-minute average’. This criterion compares favourably to the international in-tunnel guidelines which range between 0.4 and 1.0 ppm. Examples of in-tunnel NO2 values for ventilation control from other projects across several countries are summarised in Table 9-4.
4 http://www.equa.se/en/tunnel/ida-tunnel/road-tunnels. 5 ACTAQ (2016) In-tunnel air quality (nitrogen dioxide) policy. Advisory Committee on Tunnel Air Quality. NSW Government, Sydney, February 2016. http://www.chiefscientist.nsw.gov.au/__data/assets/pdf_file/0004/81778/In-Tunnel-Air-Quality-Policy-FINAL.pdf
F6 Extension Stage 1 from New M5 Motorway at Arncliffe to President Avenue at Kogarah 9-9
-
Chapter 9 – Air quality
Table 9-4 Comparative in-tunnel NO2 limits (from ACTAQ In-tunnel Air Quality (Nitrogen Dioxide) Policy5)
Jurisdiction In tunnel NO2 criteria Design or compliance
Averaging period
NSW/NorthConnex/WestConnex 0.5 ppm tunnel average Design and compliance 15-minutes Brisbane City Council/Clem 7 (2007/LegacyWay (2010) tunnels 1 ppm average Design and compliance None given
Permanent International Association of Road Congresses (PIARC) 1 ppm tunnel average Design only None given
New Zealand 1 ppm Design only 15-minutes Hong Kong 1 ppm Design only 5-minutes
Norway 0.75 ppm tunnel midpoint (equivalent to tunnel average) Design and compliance 15-minutes
France 0.4 ppm Design 15-minutes
Route average NO2 calculations For the F6 Extension Stage 1, the ‘tunnel average’ has been interpreted as a ‘route average’, being the ‘length-weighted average pollutant concentration over a portal-to-portal route through the system’ which includes the interconnecting WestConnex tunnels. The project only has one portal as it connects with the New M5 Motorway tunnel underground and so the eight routes assessed were to and from the New M5 Motorway interface with the M4-M5 Link at St Peters to President Avenue, and to and from the New M5 Motorway portals to Kingsgrove. The routes assessed are listed Table 9-5 and range between 6.7 and 9.2 kilometres in length.
For routes that would travel from the project into the M4-M5 Link past St Peters, the entire underground sections of WestConnex will meet the route average criteria, as specified in the conditions of approval for the those projects. As each portion of the entire trip will meet the air quality criteria on its own, the average of the entire route from origin portal to destination portal will meet or be better than the air quality criteria.
Visibility and particulate matter
Visibility is an important consideration in the design of a road tunnel ventilation system. The visibility is required to be greater than the minimum vehicle stopping distance at the design speed6. Visibility is reduced by the scattering and absorption of light by particles suspended in the air. The measurement of visibility in a tunnel (using an opacity meter) is based on the concept that a light beam reduces in intensity as it passes through air containing particles or other pollutants.
The amount of light scattering, or absorption, in road tunnels is principally dependent on the composition, diameter and density of the particles in the air. Particles that affect visibility are generally in a size range of 0.4 to 1.0 µm. A coefficient of light extinction is used as an indicator of the particulate matter concentration in the tunnel. It is the inverse of visibility, i.e. it is a measure of opacity or blocking of light by particles seen as haze in a tunnel. The operational extinction coefficient limit of 0.005 m-1
may result in tunnel emissions being visible under congested conditions, but not at sufficient levels to produce hazy conditions7. The criteria against which the in-tunnel air quality was assessed are shown in Table 9-6.
6 PIARC (2012) Road tunnels: vehicle emissions and air demand for ventilation. World Road Association, Paris. Report 2012R05, December 2012. 7 PIARC (2012) Road tunnels: vehicle emissions and air demand for ventilation. World Road Association, Paris. Report 2012R05, December 2012.
F6 Extension Stage 1 from New M5 Motorway at Arncliffe to President Avenue at Kogarah 9-10
Chapter 9 – Air quality
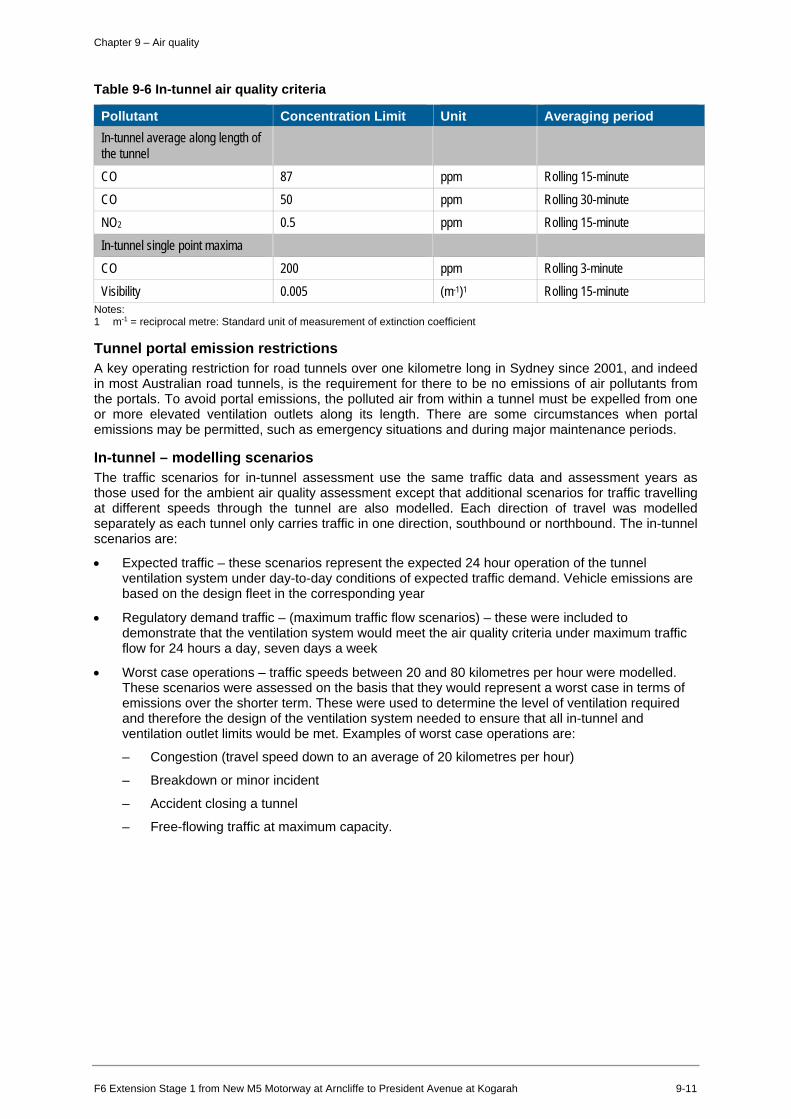
Table 9-6 In-tunnel air quality criteria
Pollutant Concentration Limit Unit Averaging period In-tunnel average along length of the tunnel CO 87 ppm Rolling 15-minute CO 50 ppm Rolling 30-minute NO2 0.5 ppm Rolling 15-minute In-tunnel single point maxima CO 200 ppm Rolling 3-minute Visibility 0.005 (m-1)1 Rolling 15-minute
Notes: m-1 1 = reciprocal metre: Standard unit of measurement of extinction coefficient
Tunnel portal emission restrictions A key operating restriction for road tunnels over one kilometre long in Sydney since 2001, and indeed in most Australian road tunnels, is the requirement for there to be no emissions of air pollutants from the portals. To avoid portal emissions, the polluted air from within a tunnel must be expelled from one or more elevated ventilation outlets along its length. There are some circumstances when portal emissions may be permitted, such as emergency situations and during major maintenance periods.
In-tunnel – modelling scenarios The traffic scenarios for in-tunnel assessment use the same traffic data and assessment years as those used for the ambient air quality assessment except that additional scenarios for traffic travelling at different speeds through the tunnel are also modelled. Each direction of travel was modelled separately as each tunnel only carries traffic in one direction, southbound or northbound. The in-tunnel scenarios are:
• Expected traffic – these scenarios represent the expected 24 hour operation of the tunnel ventilation system under day-to-day conditions of expected traffic demand. Vehicle emissions are based on the design fleet in the corresponding year
• Regulatory demand traffic – (maximum traffic flow scenarios) – these were included to demonstrate that the ventilation system would meet the air quality criteria under maximum traffic flow for 24 hours a day, seven days a week
• Worst case operations – traffic speeds between 20 and 80 kilometres per hour were modelled. These scenarios were assessed on the basis that they would represent a worst case in terms of emissions over the shorter term. These were used to determine the level of ventilation required and therefore the design of the ventilation system needed to ensure that all in-tunnel and ventilation outlet limits would be met. Examples of worst case operations are:
– Congestion (travel speed down to an average of 20 kilometres per hour)
– Breakdown or minor incident
– Accident closing a tunnel
– Free-flowing traffic at maximum capacity.
F6 Extension Stage 1 from New M5 Motorway at Arncliffe to President Avenue at Kogarah 9-11
Chapter 9 – Air quality
9.3.2 Ambient air quality assessment methodology
Air quality criteria NSW Environment Protection Authority (NSW EPA) approved methods
The Australian states and territories manage emissions and air quality. In NSW the statutory methods used for assessing air pollution from stationary sources are listed in the NSW EPA Approved Methods8.
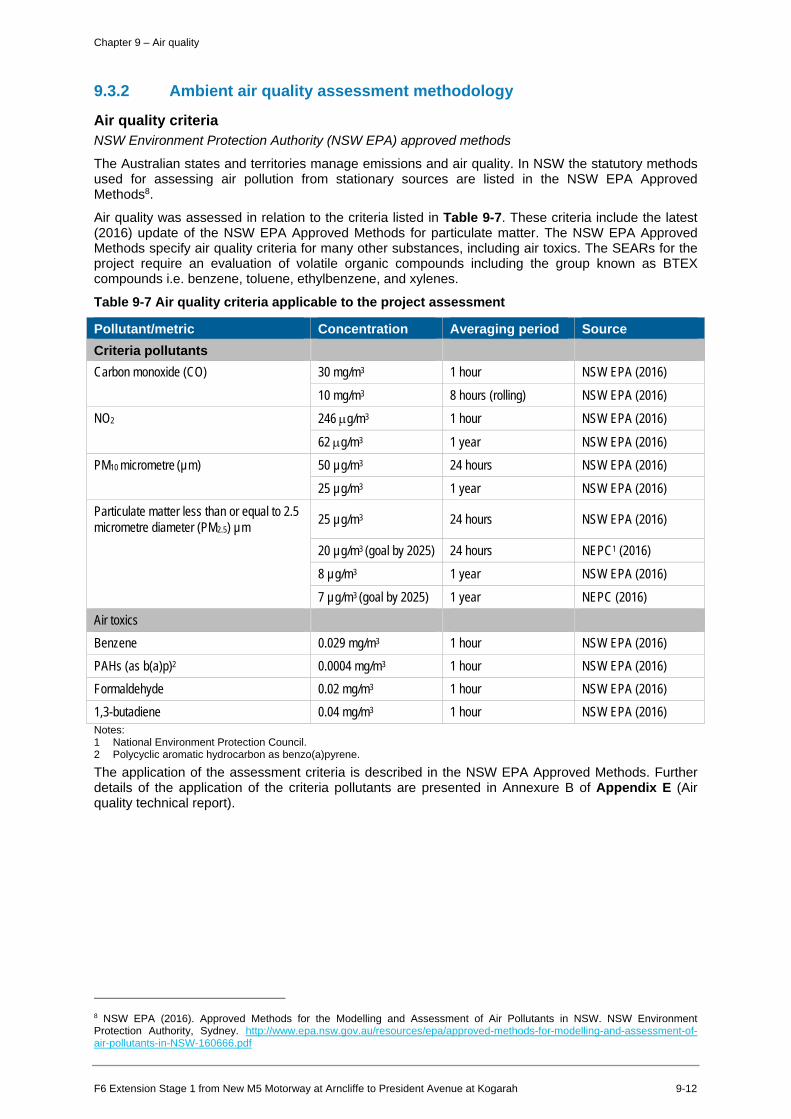
Air quality was assessed in relation to the criteria listed in Table 9-7. These criteria include the latest (2016) update of the NSW EPA Approved Methods for particulate matter. The NSW EPA Approved Methods specify air quality criteria for many other substances, including air toxics. The SEARs for the project require an evaluation of volatile organic compounds including the group known as BTEX compounds i.e. benzene, toluene, ethylbenzene, and xylenes.
Table 9-7 Air quality criteria applicable to the project assessment
Pollutant/metric Concentration Averaging period Source Criteria pollutants Carbon monoxide (CO) 30 mg/m3 1 hour NSW EPA (2016)
10 mg/m3 8 hours (rolling) NSW EPA (2016) NO2 246 µg/m3 1 hour NSW EPA (2016)
62 µg/m3 1 year NSW EPA (2016) PM10 micrometre (µm) 50 µg/m3 24 hours NSW EPA (2016)
25 µg/m3 1 year NSW EPA (2016) Particulate matter less than or equal to 2.5 micrometre diameter (PM2.5) µm 25 µg/m3 24 hours NSW EPA (2016)
20 µg/m3 (goal by 2025) 24 hours NEPC1 (2016)
8 µg/m3 1 year NSW EPA (2016)
7 µg/m3 (goal by 2025) 1 year NEPC (2016) Air toxics Benzene 0.029 mg/m3 1 hour NSW EPA (2016) PAHs (as b(a)p)2 0.0004 mg/m3 1 hour NSW EPA (2016) Formaldehyde 0.02 mg/m3 1 hour NSW EPA (2016) 1,3-butadiene 0.04 mg/m3 1 hour NSW EPA (2016) Notes: 1 National Environment Protection Council. 2 Polycyclic aromatic hydrocarbon as benzo(a)pyrene.
The application of the assessment criteria is described in the NSW EPA Approved Methods. Further details of the application of the criteria pollutants are presented in Annexure B of Appendix E (Air quality technical report).
8 NSW EPA (2016). Approved Methods for the Modelling and Assessment of Air Pollutants in NSW. NSW Environment Protection Authority, Sydney. http://www.epa.nsw.gov.au/resources/epa/approved-methods-for-modelling-and-assessment-of-air-pollutants-in-NSW-160666.pdf
F6 Extension Stage 1 from New M5 Motorway at Arncliffe to President Avenue at Kogarah 9-12
Chapter 9 – Air quality
Comparison of NSW ambient air quality criteria with national and international standards
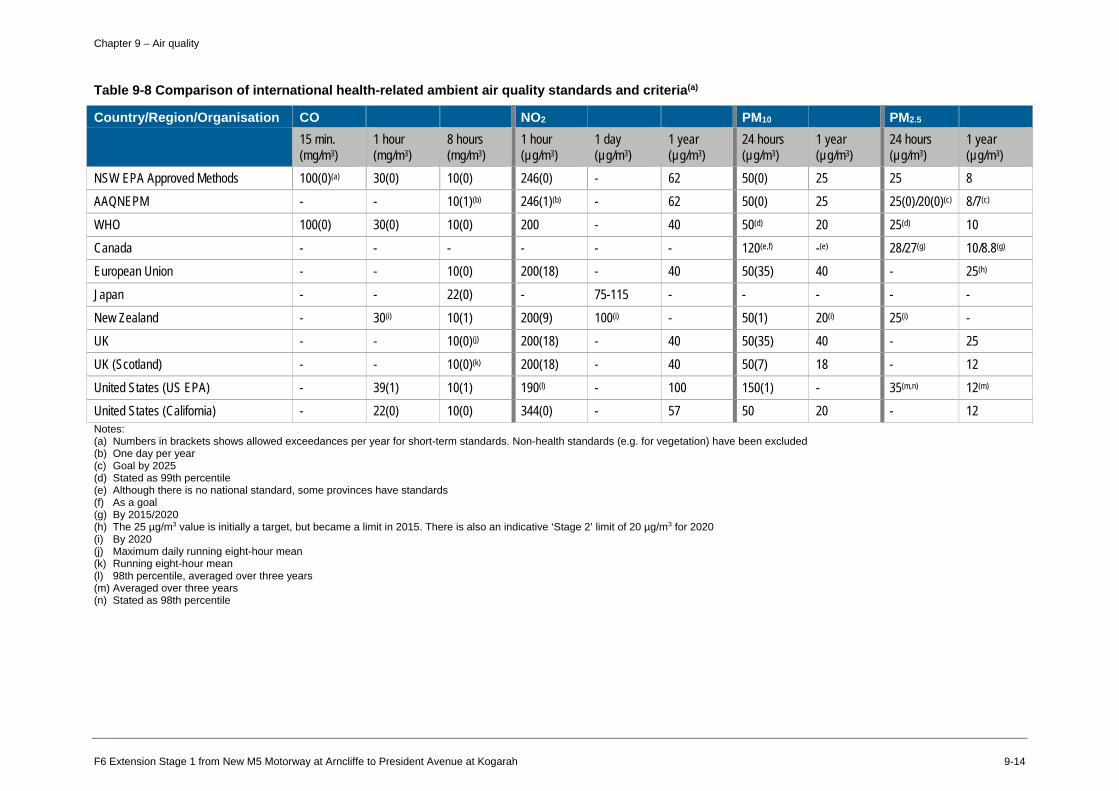
For the criteria pollutants included in the assessment, the impact assessment criteria in the NSW EPA Approved Methods9 and the National Environment Protection (Ambient Air Quality) Measure (AAQNEPM) from February 2016 are compared with the World Health Organisation (WHO) guidelines and the standards in other countries/organisations in Table 9-8. The comparison found:
• For CO, the NSW standards are similar to those in most other countries and organisations
• The NSW standards for NO2 are more stringent than Canada and the United States Environmental Protection Agency (US EPA), but less stringent than California (USA). The standards in the European Union are numerically lower but the European Union allows 18 exceedances compared to one in NSW
• In the case of PM10, the NSW standard for the 24 hour mean is lower than or equivalent to the standards in force elsewhere, whereas the annual mean standard is in the middle of the range of values for other locations
• The NSW annual average standard for PM2.5 is numerically lower than or equivalent to those used elsewhere.
There are differences in implementation of standards regarding where they apply and how many exceedances are permitted. For example, 35 exceedances per year of the 24-hour PM10 standard are permitted in the European Union. In comparison, the 24-hour PM10 standard may be exceeded on up to five days a year in NSW.
9 NSW EPA (2016). Approved Methods for the Modelling and Assessment of Air Pollutants in NSW. NSW Environment Protection Authority, Sydney. http://www.epa.nsw.gov.au/resources/epa/approved-methods-for-modelling-and-assessment-of-air-pollutants-in-NSW-160666.pdf
F6 Extension Stage 1 from New M5 Motorway at Arncliffe to President Avenue at Kogarah 9-13
Chapter 9 – Air quality
Table 9-8 Comparison of international health-related ambient air quality standards and criteria(a)
Country/Region/Organisation CO NO2 PM10 PM2.5
15 min. (mg/m3)
1 hour (mg/m3)
8 hours (mg/m3)
1 hour (µg/m3)
1 day (µg/m3)
1 year (µg/m3)
24 hours (µg/m3)
1 year (µg/m3)
24 hours (µg/m3)
1 year (µg/m3)
NSW EPA Approved Methods 100(0)(a) 30(0) 10(0) 246(0) - 62 50(0) 25 25 8
AAQNEPM - - 10(1)(b) 246(1)(b) - 62 50(0) 25 25(0)/20(0)(c) 8/7(c)
WHO 100(0) 30(0) 10(0) 200 - 40 50(d) 20 25(d) 10
Canada - - - - - - 120(e,f) -(e) 28/27(g) 10/8.8(g)
European Union - - 10(0) 200(18) - 40 50(35) 40 - 25(h)
Japan - - 22(0) - 75-115 - - - - -
New Zealand - i)30( 10(1) 200(9) i)100( - 50(1) i)20( i)25( -
UK - - j)10(0)( 200(18) - 40 50(35) 40 - 25
UK (Scotland) - - 10(0)(k) 200(18) - 40 50(7) 18 - 12
United States (US EPA) - 39(1) 10(1) l)190( - 100 150(1) - 35(m,n) 12(m)
United States (California) - 22(0) 10(0) 344(0) - 57 50 20 - 12 Notes: (a) Numbers in brackets shows allowed exceedances per year for short-term standards. Non-health standards (e.g. for vegetation) have been excluded (b) One day per year (c) Goal by 2025 (d) Stated as 99th percentile (e) Although there is no national standard, some provinces have standards (f) As a goal (g) By 2015/2020 (h) The 25 µg/m3 value is initially a target, but became a limit in 2015. There is also an indicative ‘Stage 2’ limit of 20 µg/m3 for 2020 (i) By 2020 (j) Maximum daily running eight-hour mean (k) Running eight-hour mean (l) 98th percentile, averaged over three years (m) Averaged over three years (n) Stated as 98th percentile
F6 Extension Stage 1 from New M5 Motorway at Arncliffe to President Avenue at Kogarah 9-14
Chapter 9 – Air quality
Ambient Modelling scenarios Two types of scenarios were used for the assessment of ambient air quality:
• Expected traffic scenarios for surface roads and ventilation outlets
• Regulatory worst case scenarios for tunnel ventilation outlets.
Expected traffic scenarios
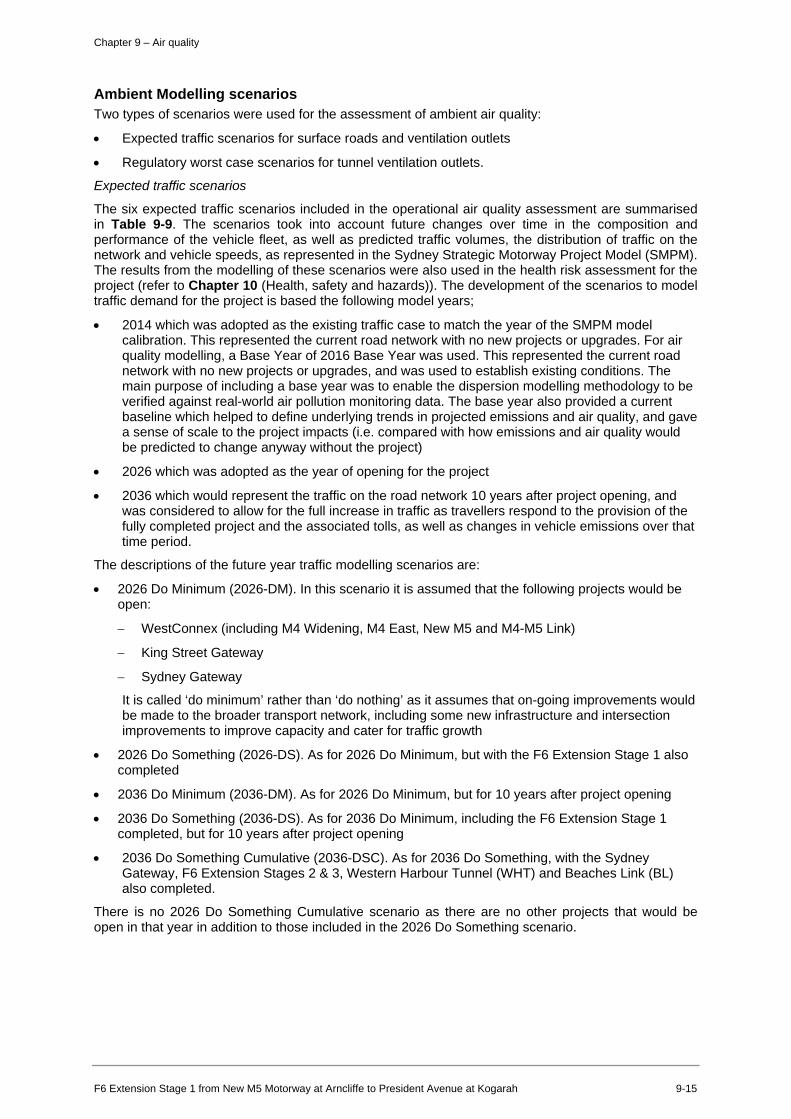
The six expected traffic scenarios included in the operational air quality assessment are summarised in Table 9-9. The scenarios took into account future changes over time in the composition and performance of the vehicle fleet, as well as predicted traffic volumes, the distribution of traffic on the network and vehicle speeds, as represented in the Sydney Strategic Motorway Project Model (SMPM). The results from the modelling of these scenarios were also used in the health risk assessment for the project (refer to Chapter 10 (Health, safety and hazards)). The development of the scenarios to model traffic demand for the project is based the following model years;
• 2014 which was adopted as the existing traffic case to match the year of the SMPM model calibration. This represented the current road network with no new projects or upgrades. For air quality modelling, a Base Year of 2016 Base Year was used. This represented the current road network with no new projects or upgrades, and was used to establish existing conditions. The main purpose of including a base year was to enable the dispersion modelling methodology to be verified against real-world air pollution monitoring data. The base year also provided a current baseline which helped to define underlying trends in projected emissions and air quality, and gave a sense of scale to the project impacts (i.e. compared with how emissions and air quality would be predicted to change anyway without the project)
• 2026 which was adopted as the year of opening for the project
• 2036 which would represent the traffic on the road network 10 years after project opening, and was considered to allow for the full increase in traffic as travellers respond to the provision of the fully completed project and the associated tolls, as well as changes in vehicle emissions over that time period.
The descriptions of the future year traffic modelling scenarios are:
• 2026 Do Minimum (2026-DM). In this scenario it is assumed that the following projects would be open:
− WestConnex (including M4 Widening, M4 East, New M5 and M4-M5 Link)
− King Street Gateway
− Sydney Gateway
It is called ‘do minimum’ rather than ‘do nothing’ as it assumes that on-going improvements would be made to the broader transport network, including some new infrastructure and intersection improvements to improve capacity and cater for traffic growth
• 2026 Do Something (2026-DS). As for 2026 Do Minimum, but with the F6 Extension Stage 1 also completed
• 2036 Do Minimum (2036-DM). As for 2026 Do Minimum, but for 10 years after project opening
• 2036 Do Something (2036-DS). As for 2036 Do Minimum, including the F6 Extension Stage 1 completed, but for 10 years after project opening
• 2036 Do Something Cumulative (2036-DSC). As for 2036 Do Something, with the Sydney Gateway, F6 Extension Stages 2 & 3, Western Harbour Tunnel (WHT) and Beaches Link (BL) also completed.
There is no 2026 Do Something Cumulative scenario as there are no other projects that would be open in that year in addition to those included in the 2026 Do Something scenario.
F6 Extension Stage 1 from New M5 Motorway at Arncliffe to President Avenue at Kogarah 9-15
Chapter 9 – Air quality
Table 9-9 Expected traffic scenarios for the operational air quality assessment
Scenari o code
Scenario description Inclusion s Existing network
F6 Extension
Other projects
Stage 1 Future stages
NorthConnex WestConnex program of works
Sydney Gateway
King Street Gateway
Western Harbour Tunnel and Beaches Link program of works
2016 Base case (2016)
DM 2026 Operation ‘do minimum’ (DM 2026)
DS 2026 Operation ‘do something’ (DS 2026)
DM 2036 Operation ‘do minimum’ (DM 2036)
DS 2036 Operation ‘do something’ (DS 2036)
DSC 2036 Operation ‘cumulative’ (DSC 2036)
F6 Extension Stage 1 from New M5 Motorway at Arncliffe to President Avenue at Kogarah 9-16
Chapter 9 – Air quality
Ventilation outlets only - Regulatory worst case scenarios
The objective of these scenarios was to demonstrate that compliance with the concentration limits for the tunnel ventilation outlets would deliver acceptable ambient air quality. The scenarios assessed were the 2026 and 2036 cumulative emissions from the ventilation outlets only, with concentrations fixed at the limits for 24 hours, i.e. the maximum pollutant concentrations permitted. This represented the theoretical maximum changes in air quality for all potential traffic operations in the tunnel, including unconstrained and worst case traffic conditions (including heavy congestion) from an emissions perspective, as well as vehicle breakdown situations. The results of the analysis demonstrate the air quality performance of the project if it operates continuously at the limits, which is very unlikely. In reality, ventilation outlet concentrations would vary over a daily cycle due to changing traffic volumes and the responsive operation of the ventilation system. Further information, including the modelled results of the regulatory worst case scenarios is provided in Appendix E (Air quality technical report).
GRAMM/GRAL modelling system The atmosphere is a complex physical system, and the movement of air in a given location is dependent on a number of variables, including temperature, topography and land use, as well as larger-scale weather patterns. Dispersion modelling is a method of simulating the movement of air pollutants in the atmosphere using mathematical equations.
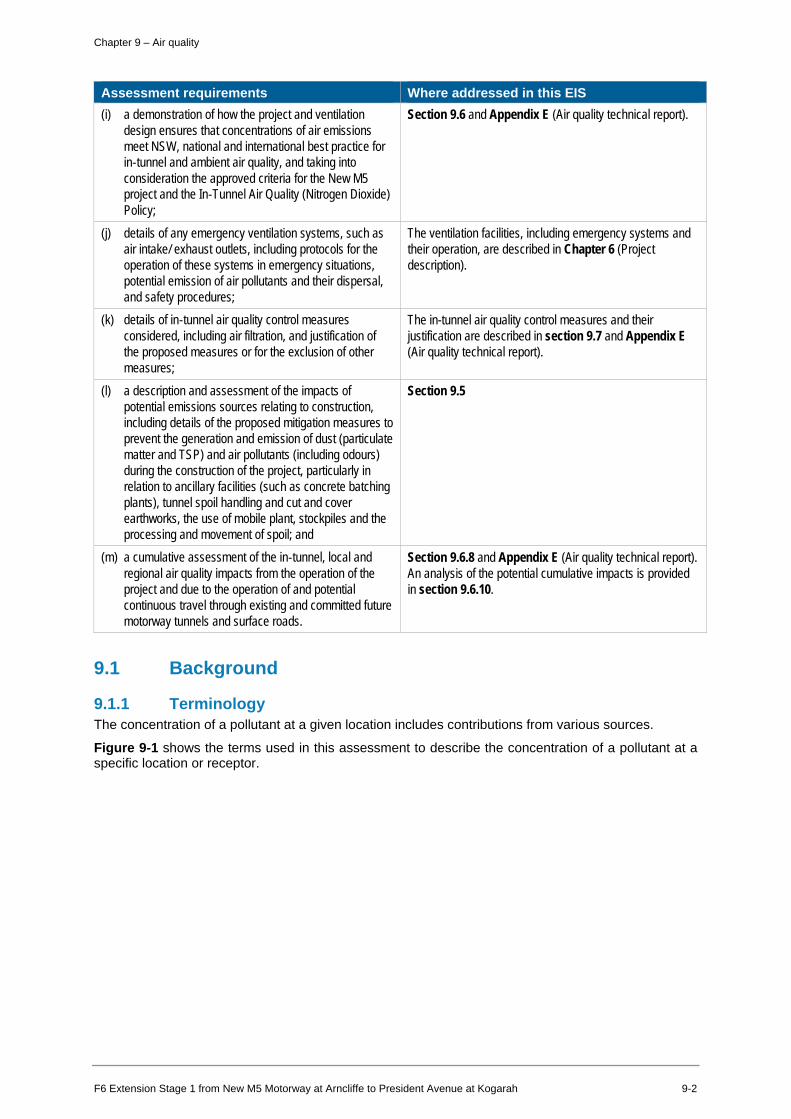
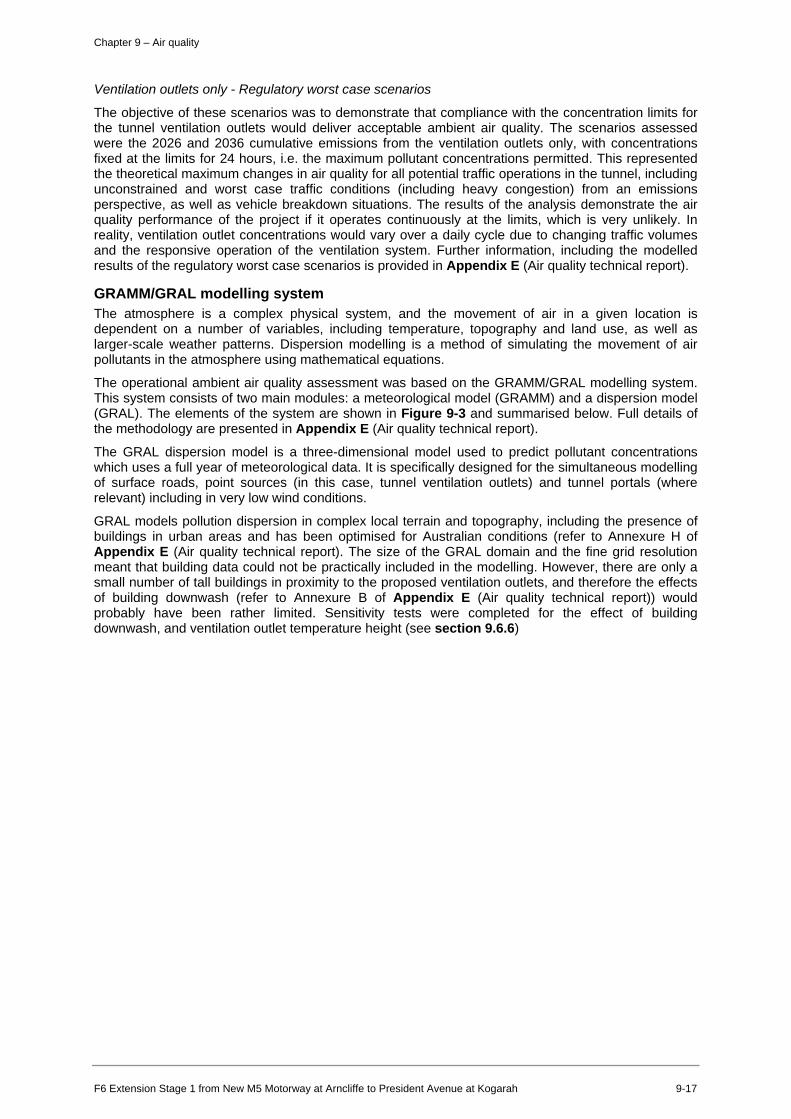
The operational ambient air quality assessment was based on the GRAMM/GRAL modelling system. This system consists of two main modules: a meteorological model (GRAMM) and a dispersion model (GRAL). The elements of the system are shown in Figure 9-3 and summarised below. Full details of the methodology are presented in Appendix E (Air quality technical report).
The GRAL dispersion model is a three-dimensional model used to predict pollutant concentrations which uses a full year of meteorological data. It is specifically designed for the simultaneous modelling of surface roads, point sources (in this case, tunnel ventilation outlets) and tunnel portals (where relevant) including in very low wind conditions.
GRAL models pollution dispersion in complex local terrain and topography, including the presence of buildings in urban areas and has been optimised for Australian conditions (refer to Annexure H of Appendix E (Air quality technical report). The size of the GRAL domain and the fine grid resolution meant that building data could not be practically included in the modelling. However, there are only a small number of tall buildings in proximity to the proposed ventilation outlets, and therefore the effects of building downwash (refer to Annexure B of Appendix E (Air quality technical report)) would probably have been rather limited. Sensitivity tests were completed for the effect of building downwash, and ventilation outlet temperature height (see section 9.6.6)
F6 Extension Stage 1 from New M5 Motorway at Arncliffe to President Avenue at Kogarah 9-17
System modules Ou pub
Traffic data
Emission model Emissions by link
( Network layout I Met data GRAMM
[Me eo ological Wind fields;
( ] m odel] Terrain
( ] Builldings GRA
ispersio model)
Predicted Air quality
------►------- co ncentrarlions measurements
Modlel evaluolion
Chapter 9 – Air quality
Figure 9-3 Overview of the GRAMM/GRAL modelling system
Further detail of the GRAMM/GRAL modelling system and its performance is provided in Appendix E (Air quality technical report).
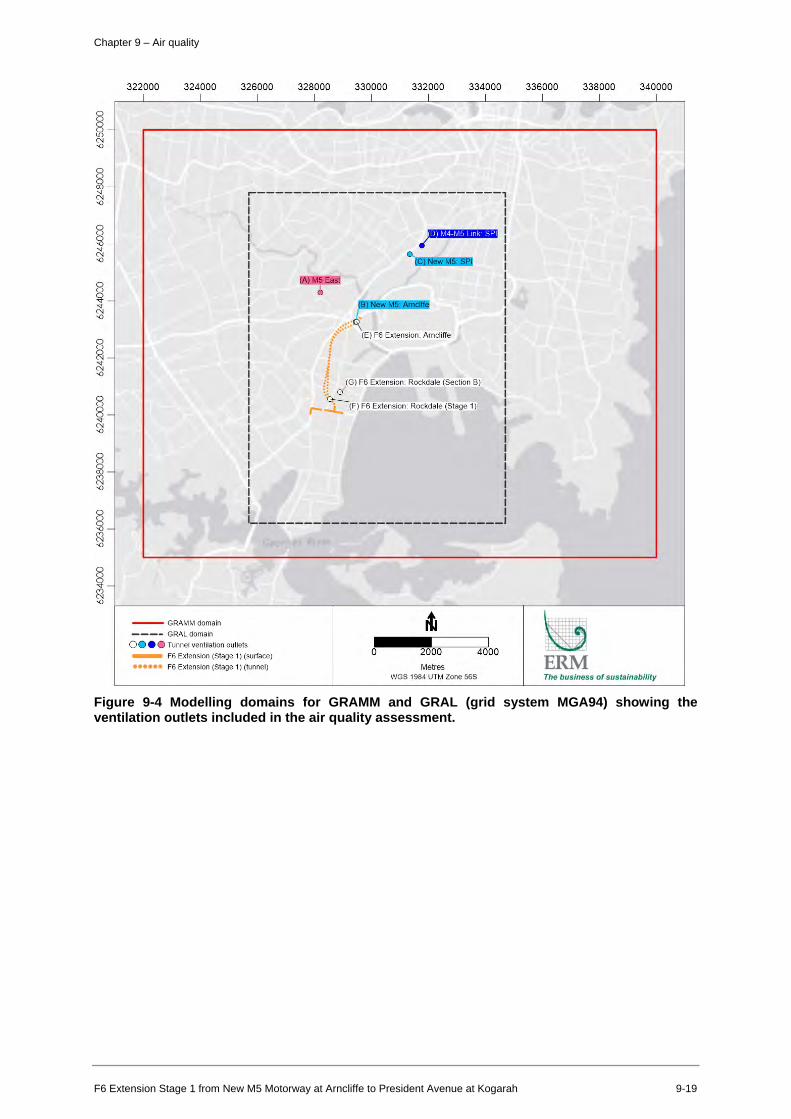
Definition of modelling domain Separate domains were required for the meteorological modelling and dispersion modelling, and these domains are shown relative to the project and all modelled tunnel ventilation outlets in Figure 9-4.
The GRAMM domain (also referred to as the ‘study area’ in places) for the modelling of meteorology is shown by the red boundary in Figure 9-4. The domain covered a substantial part of Sydney, extending 18 kilometres in the east–west (x) direction and 15 kilometres in the north–south (y) direction.
The F6 Extension Stage 1 GRAL domain for dispersion modelling is shown by the dashed grey boundary in Figure 9-4. Every dispersion model run was undertaken for this domain, which extended 9.0 kilometres in the east–west direction and 11.6 kilometres in the north–south direction. The domain extended well beyond the project itself to allow for the traffic interactions between the F6 Extension Stage 1 and other projects (M4-M5 Link, New M5 and Sydney Gateway), as well as effects on all affected roads. Having a relatively large GRAMM and GRAL domain also increased the number of meteorological and air quality monitoring stations that could be included for model evaluation purposes.
F6 Extension Stage 1 from New M5 Motorway at Arncliffe to President Avenue at Kogarah 9-18
324000 326000 328000 330000 332000 334000
~---------------------------,
--- GRAMM domain
---- GRAL domain
0 e Tunnel venlllatlon outlets
- FG Extension (Stage 1) (surface)
•••••• F6 Extension (Stage 1) (tunnel)
1 dl011~11G1Mlill •
.. -:=··· r• (E) F6 Extension: Arncliffe
:
(G) F6 Extension: Rockdale (Section B)
0' G--,--L. (F) F6 Extension: Rockdale (Stage 1)
0 2000 Metres
WGS 1984 UTM Zone 56S
4000
336000 338000 340000
~ ERM The business of sustainability
Chapter 9 – Air quality
Figure 9-4 Modelling domains for GRAMM and GRAL (grid system MGA94) showing the ventilation outlets included in the air quality assessment.
F6 Extension Stage 1 from New M5 Motorway at Arncliffe to President Avenue at Kogarah 9-19
■
Chapter 9 – Air quality
Background air quality Background concentrations were based on measurements from air quality monitoring stations at urban background locations in the study area, but well away from roads (as defined in Australian Standard AS/NZS 350.1.1:2007 – Methods for sampling and analysis of ambient air – Guide to siting air monitoring equipment). These stations are located in urban areas to provide information on air quality away from specific sources of pollution such as major roads or industry.
The approaches used to determine long-term and short-term background concentrations are explained in Annexure D of Appendix E (Air quality technical report). It was considered that the concentrations in 2016 would represent typical (but probably slightly conservative) background concentrations in the future.
Discrete receptors Receptors are defined by NSW EPA as anywhere people work or reside, including residential areas, hospitals, hotels, shopping centres, playgrounds and recreational centres. Due to its location in a highly built-up area, the project modelling domain contains a large number of sensitive receptors. Many of these sensitive receptors are located immediately adjacent to the existing major road network.
Receptors locations are identified on a geographical information system (GIS) and a remote sensing method termed LiDAR (light detection and ranging) was used to identify structures within the air quality modelling domain to represent buildings. Not all the structures identified by LiDAR are habitable buildings, so that for example, fuel tanks and containers are included in the dots on the map that represent discrete receptors. For this reason, receptor locations where any pollutant levels of concern are identified, were further examined to determine whether or not they represent real world exposure of people.
Two types of discrete receptor locations were defined for use in the assessment:
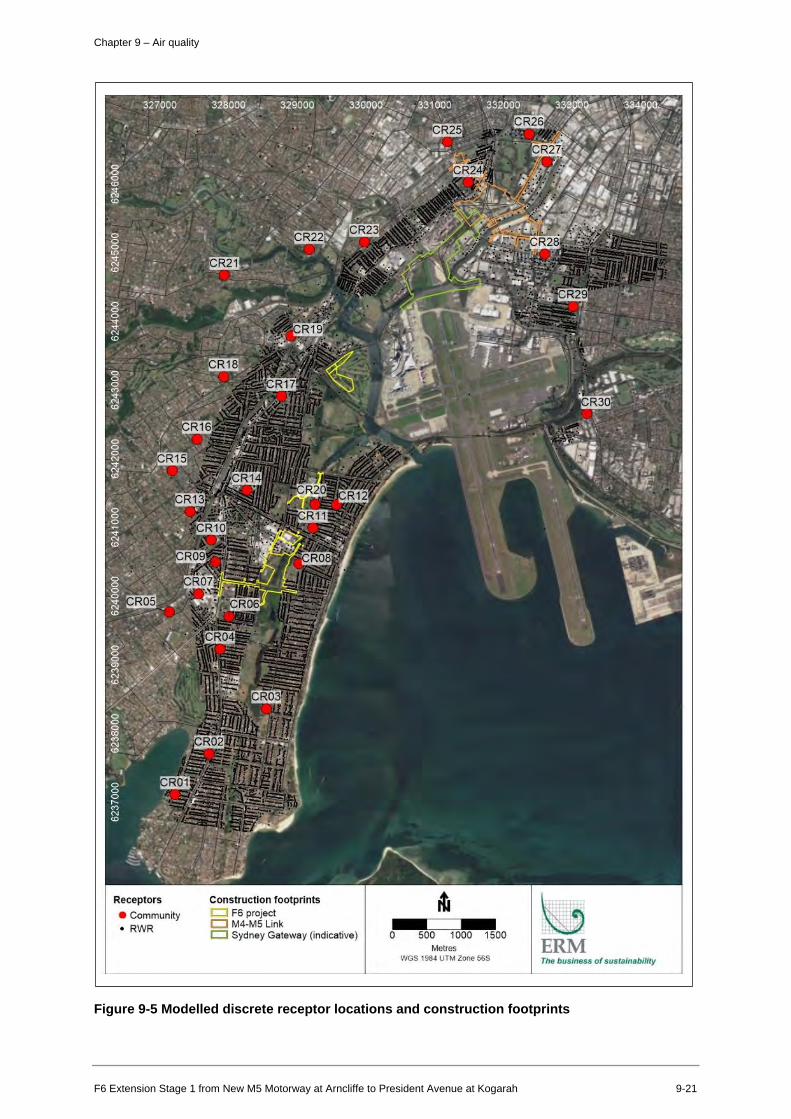
• ‘Community receptors’ (CR): These were taken to be representative of particularly sensitive locations such as schools, childcare centres and hospitals within the vicinity of the project, and generally near affected roadways. For these receptors, a more detailed method was used to calculate the total concentration of each pollutant. In total, 30 community receptors were included in the assessment and these are listed in Table 9-10. Thirty community receptors were selected due to the time required to complete additional detailed modelling of community receptors for the assessment. They were selected as representative of the community, or sensitive, receptors across the study area and in consultation with the receptor organisations and the Roads and Maritime communications team. Schools located closest to the project were selected, and some receptors to the north were chosen due to the potential for cumulative impacts from the M4-M5 Link and New M5 Motorway projects. All sensitive receptors, including the 30 selected for more detailed analysis, are included in the 17,509 receptors modelled in the assessment.
• Residential, workplace and recreational (RWR) receptors’: These were all discrete receptor locations within the vicinity of the project, and were generally residential and commercial land uses. For these receptors a simpler10 statistical approach was used to combine a concentration statistic for the modelled roads and outlets (e.g. maximum 24 hour mean PM10) with an appropriate background statistic. In total, 17,509 RWR receptors were included in the assessment (this included the 30 community receptors). The RWR receptors are discrete points at ground level – where people are likely to be present for some period of the day – classified according to the land use identified at that location. The RWR receptors do not identify the number of residential (or other) properties at the location; the residential land use at an RWR receptor location may range from a single-storey dwelling to a multi-storey, multi-dwelling building.
The RWR receptors are not designed for the assessment of changes in total population exposure. The Human health technical report (Appendix F) combines the air quality information with the highest resolution population data available from the Australian Bureau of Statistics to calculate key health indicators that reflect varying population density across the study area.
Figure 9-5 shows the locations of the discrete receptors.
10 The simplification only related to short-term metrics. Annual mean concentrations were equally valid for both types of receptor.
F6 Extension Stage 1 from New M5 Motorway at Arncliffe to President Avenue at Kogarah 9-20
• Community • RWR
Construction footprints r:::J F6 project CJ M4-M5 Link CJ Sydney Gateway (indicative) ~
Metres ERM WGS 1984 UTM Zone 56S The business of sustainability
Chapter 9 – Air quality
Figure 9-5 Modelled discrete receptor locations and construction footprints
F6 Extension Stage 1 from New M5 Motorway at Arncliffe to President Avenue at Kogarah 9-21
Chapter 9 – Air quality
The types of RWR receptors are listed by category in Table 9-11. Further discussion of the assessment of the receptors is in Appendix E (Air quality technical report).
Receptors locations in proximity to the WestConnex program of works (such as St Peters Public School at St Peters, Frobel Alexandria Early Learning Centre at Alexandria and Active Kids Mascot at Mascot) and indicative Sydney Gateway designs were included to enable an assessment of the cumulative impacts of these projects. The following were excluded:
• Any receptors outside the GRAL domain for the F6 Extension Stage 1
• Any receptor locations that would be removed for construction of surface roads and facilities.
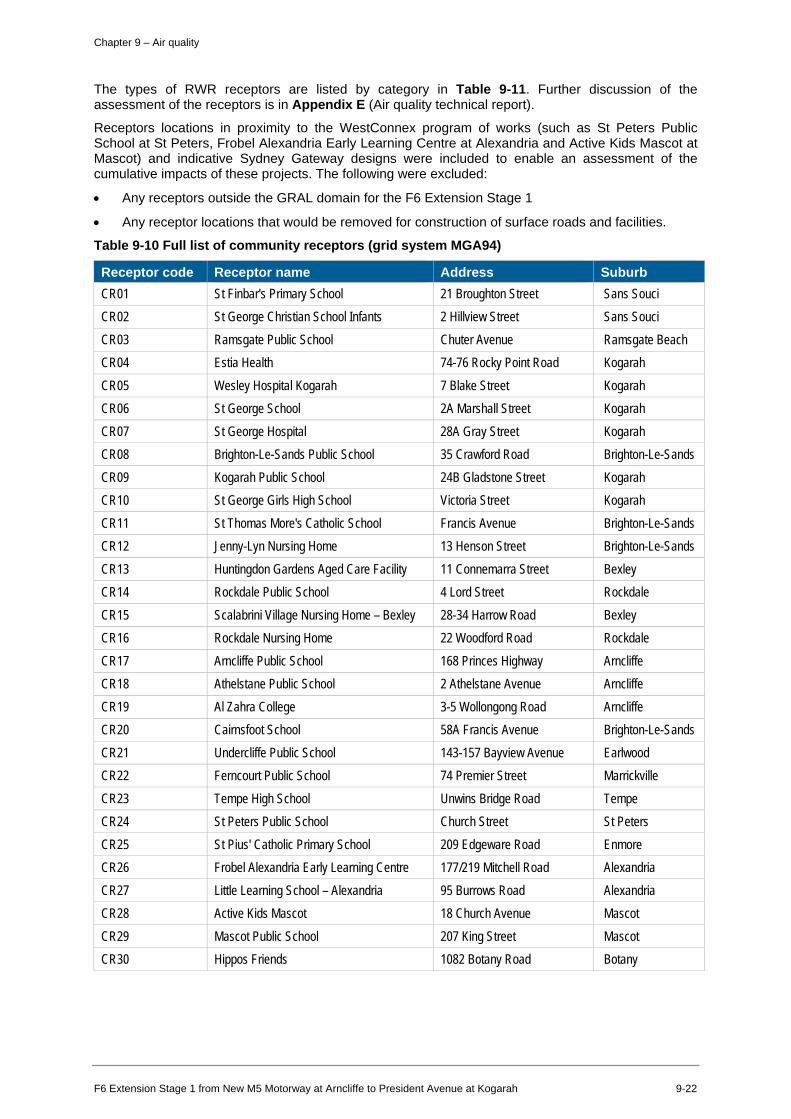
Table 9-10 Full list of community receptors (grid system MGA94)
Receptor code Receptor name Address Suburb CR01 St Finbar's Primary School 21 Broughton Street Sans Souci CR02 St George Christian School Infants 2 Hillview Street Sans Souci CR03 Ramsgate Public School Chuter Avenue Ramsgate Beach CR04 Estia Health 74-76 Rocky Point Road Kogarah CR05 Wesley Hospital Kogarah 7 Blake Street Kogarah CR06 St George School 2A Marshall Street Kogarah CR07 St George Hospital 28A Gray Street Kogarah CR08 Brighton-Le-Sands Public School 35 Crawford Road Brighton-Le-Sands CR09 Kogarah Public School 24B Gladstone Street Kogarah CR10 St George Girls High School Victoria Street Kogarah CR11 St Thomas More's Catholic School Francis Avenue Brighton-Le-Sands CR12 Jenny-Lyn Nursing Home 13 Henson Street Brighton-Le-Sands CR13 Huntingdon Gardens Aged Care Facility 11 Connemarra Street Bexley CR14 Rockdale Public School 4 Lord Street Rockdale CR15 Scalabrini Village Nursing Home – Bexley 28-34 Harrow Road Bexley CR16 Rockdale Nursing Home 22 Woodford Road Rockdale CR17 Arncliffe Public School 168 Princes Highway Arncliffe CR18 Athelstane Public School 2 Athelstane Avenue Arncliffe CR19 Al Zahra College 3-5 Wollongong Road Arncliffe CR20 Cairnsfoot School 58A Francis Avenue Brighton-Le-Sands CR21 Undercliffe Public School 143-157 Bayview Avenue Earlwood CR22 Ferncourt Public School 74 Premier Street Marrickville CR23 Tempe High School Unwins Bridge Road Tempe CR24 St Peters Public School Church Street St Peters CR25 St Pius' Catholic Primary School 209 Edgeware Road Enmore CR26 Frobel Alexandria Early Learning Centre 177/219 Mitchell Road Alexandria CR27 Little Learning School – Alexandria 95 Burrows Road Alexandria CR28 Active Kids Mascot 18 Church Avenue Mascot CR29 Mascot Public School 207 King Street Mascot CR30 Hippos Friends 1082 Botany Road Botany
F6 Extension Stage 1 from New M5 Motorway at Arncliffe to President Avenue at Kogarah 9-22
Chapter 9 – Air quality
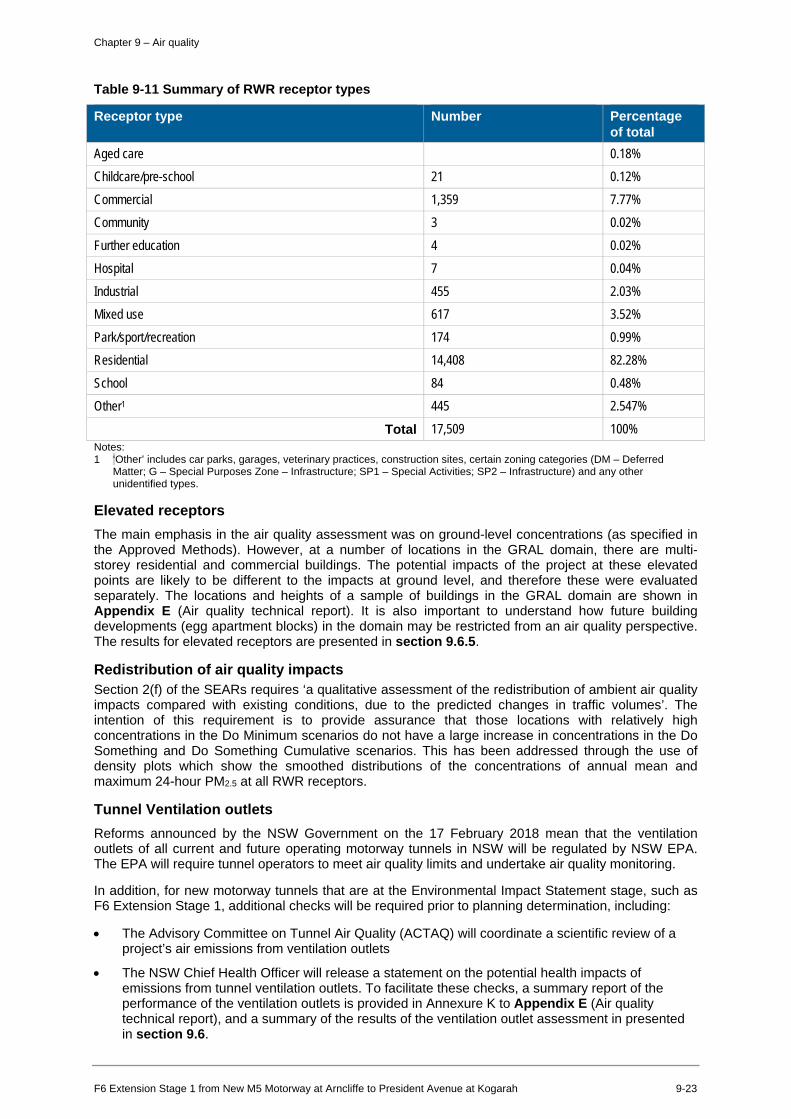
Table 9-11 Summary of RWR receptor types
Receptor type Number Percentage of total
Aged care 0.18% Childcare/pre-school 21 0.12% Commercial 1,359 7.77% Community 3 0.02% Further education 4 0.02% Hospital 7 0.04% Industrial 455 2.03% Mixed use 617 3.52% Park/sport/recreation 174 0.99% Residential 14,408 82.28% School 84 0.48% Other1 445 2.547%
Total 17,509 100% Notes: 1 ‘Other’ includes car parks, garages, veterinary practices, construction sites, certain zoning categories (DM – Deferred
Matter; G – Special Purposes Zone – Infrastructure; SP1 – Special Activities; SP2 – Infrastructure) and any other unidentified types.
Elevated receptors The main emphasis in the air quality assessment was on ground-level concentrations (as specified in the Approved Methods). However, at a number of locations in the GRAL domain, there are multi-storey residential and commercial buildings. The potential impacts of the project at these elevated points are likely to be different to the impacts at ground level, and therefore these were evaluated separately. The locations and heights of a sample of buildings in the GRAL domain are shown in Appendix E (Air quality technical report). It is also important to understand how future building developments (egg apartment blocks) in the domain may be restricted from an air quality perspective. The results for elevated receptors are presented in section 9.6.5.
Redistribution of air quality impacts Section 2(f) of the SEARs requires ‘a qualitative assessment of the redistribution of ambient air quality impacts compared with existing conditions, due to the predicted changes in traffic volumes’. The intention of this requirement is to provide assurance that those locations with relatively high concentrations in the Do Minimum scenarios do not have a large increase in concentrations in the Do Something and Do Something Cumulative scenarios. This has been addressed through the use of density plots which show the smoothed distributions of the concentrations of annual mean and maximum 24-hour PM2.5 at all RWR receptors.
Tunnel Ventilation outlets Reforms announced by the NSW Government on the 17 February 2018 mean that the ventilation outlets of all current and future operating motorway tunnels in NSW will be regulated by NSW EPA. The EPA will require tunnel operators to meet air quality limits and undertake air quality monitoring.
In addition, for new motorway tunnels that are at the Environmental Impact Statement stage, such as F6 Extension Stage 1, additional checks will be required prior to planning determination, including:
• The Advisory Committee on Tunnel Air Quality (ACTAQ) will coordinate a scientific review of a project’s air emissions from ventilation outlets
• The NSW Chief Health Officer will release a statement on the potential health impacts of emissions from tunnel ventilation outlets. To facilitate these checks, a summary report of the performance of the ventilation outlets is provided in Annexure K to Appendix E (Air quality technical report), and a summary of the results of the ventilation outlet assessment in presented in section 9.6.
F6 Extension Stage 1 from New M5 Motorway at Arncliffe to President Avenue at Kogarah 9-23
Chapter 9 – Air quality
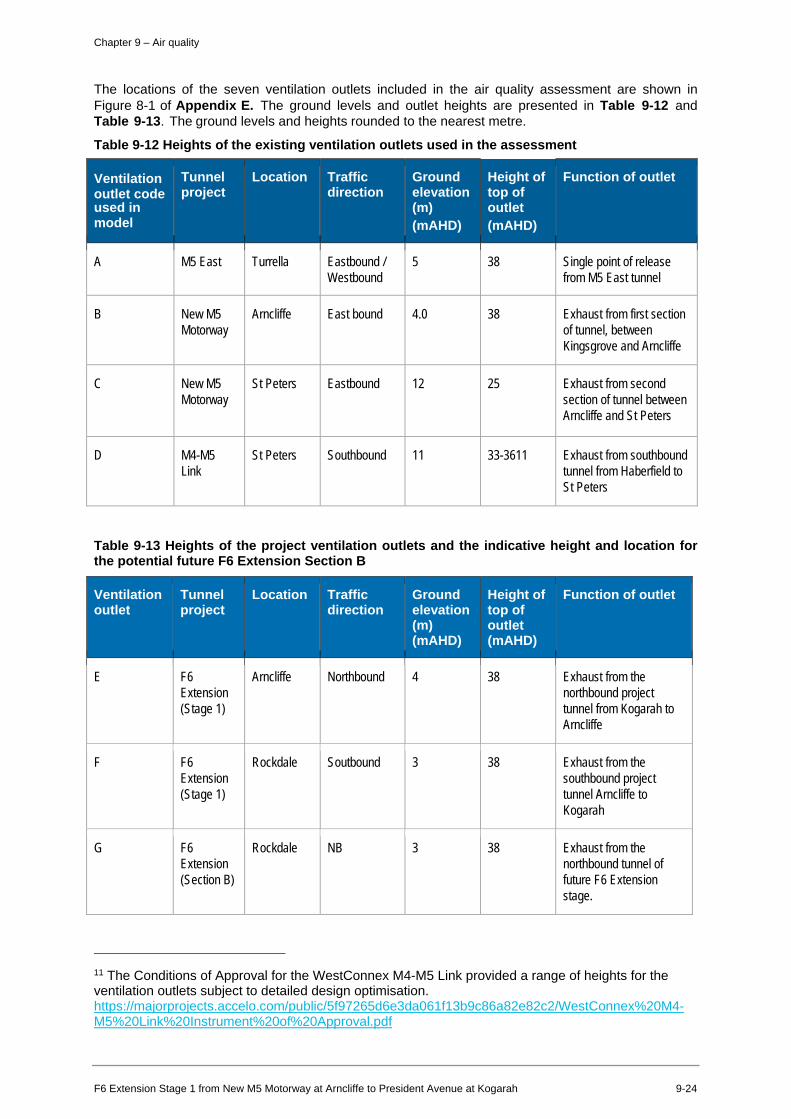
The locations of the seven ventilation outlets included in the air quality assessment are shown in Figure 8-1 of Appendix E. The ground levels and outlet heights are presented in Table 9-12 and Table 9-13. The ground levels and heights rounded to the nearest metre.
Table 9-12 Heights of the existing ventilation outlets used in the assessment
Ventilationoutlet codeused in model
Tunnel project
Location Traffic direction
Ground elevation (m) (mAHD)
Height of top of outlet (mAHD)
Function of outlet
A M5 East Turrella Eastbound / Westbound
5 38 Single point of release from M5 East tunnel
B New M5 Arncliffe East bound 4.0 38 Exhaust from first section Motorway of tunnel, between
Kingsgrove and Arncliffe
C New M5 St Peters Eastbound 12 25 Exhaust from second Motorway section of tunnel between
Arncliffe and St Peters
D M4-M5 St Peters Southbound 11 33-3611 Exhaust from southbound Link tunnel from Haberfield to
St Peters
Table 9-13 Heights of the project ventilation outlets and the indicative height and location for the potential future F6 Extension Section B
Ventilation outlet
Tunnel project
Location Traffic direction
Ground elevation (m) (mAHD)
Height of top of outlet (mAHD)
Function of outlet
E F6 Extension (Stage 1)
Arncliffe Northbound 4 38 Exhaust from the northbound project tunnel from Kogarah to Arncliffe
F F6 Extension (Stage 1)
Rockdale Soutbound 3 38 Exhaust from the southbound project tunnel Arncliffe to Kogarah
G F6 Extension (Section B)
Rockdale NB 3 38 Exhaust from the northbound tunnel of future F6 Extension stage.
11 The Conditions of Approval for the WestConnex M4-M5 Link provided a range of heights for the ventilation outlets subject to detailed design optimisation. https://majorprojects.accelo.com/public/5f97265d6e3da061f13b9c86a82e82c2/WestConnex%20M4-M5%20Link%20Instrument%20of%20Approval.pdf
F6 Extension Stage 1 from New M5 Motorway at Arncliffe to President Avenue at Kogarah 9-24
Chapter 9 – Air quality
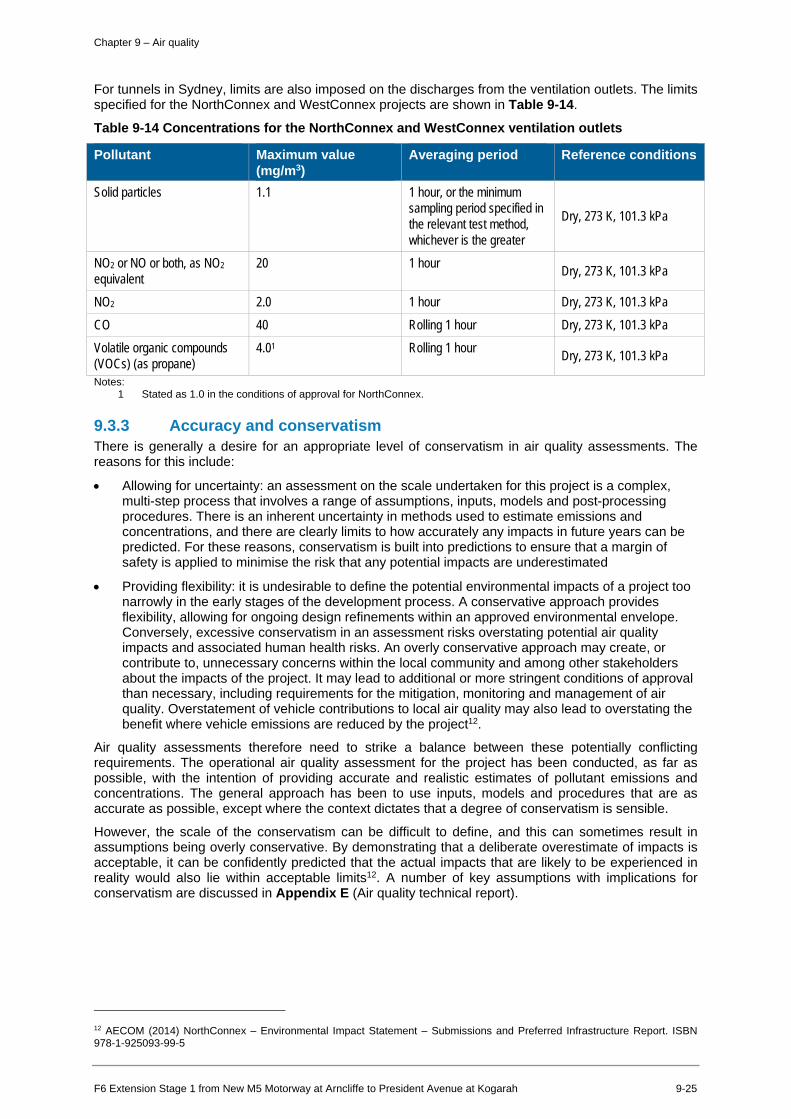
For tunnels in Sydney, limits are also imposed on the discharges from the ventilation outlets. The limits specified for the NorthConnex and WestConnex projects are shown in Table 9-14.
Table 9-14 Concentrations for the NorthConnex and WestConnex ventilation outlets
Pollutant Maximum value (mg/m3)
Averaging period Reference conditions
Solid particles 1.1 1 hour, or the minimum sampling period specified in the relevant test method, whichever is the greater
Dry, 273 K, 101.3 kPa
NO2 or NO or both, as NO2
equivalent 20 1 hour Dry, 273 K, 101.3 kPa
NO2 2.0 1 hour Dry, 273 K, 101.3 kPa CO 40 Rolling 1 hour Dry, 273 K, 101.3 kPa Volatile organic compounds (VOCs) (as propane)
4.01 Rolling 1 hour Dry, 273 K, 101.3 kPa
Notes: 1 Stated as 1.0 in the conditions of approval for NorthConnex.
9.3.3 Accuracy and conservatism There is generally a desire for an appropriate level of conservatism in air quality assessments. The reasons for this include:
• Allowing for uncertainty: an assessment on the scale undertaken for this project is a complex, multi-step process that involves a range of assumptions, inputs, models and post-processing procedures. There is an inherent uncertainty in methods used to estimate emissions and concentrations, and there are clearly limits to how accurately any impacts in future years can be predicted. For these reasons, conservatism is built into predictions to ensure that a margin of safety is applied to minimise the risk that any potential impacts are underestimated
• Providing flexibility: it is undesirable to define the potential environmental impacts of a project too narrowly in the early stages of the development process. A conservative approach provides flexibility, allowing for ongoing design refinements within an approved environmental envelope. Conversely, excessive conservatism in an assessment risks overstating potential air quality impacts and associated human health risks. An overly conservative approach may create, or contribute to, unnecessary concerns within the local community and among other stakeholders about the impacts of the project. It may lead to additional or more stringent conditions of approval than necessary, including requirements for the mitigation, monitoring and management of air quality. Overstatement of vehicle contributions to local air quality may also lead to overstating the benefit where vehicle emissions are reduced by the project12 .
Air quality assessments therefore need to strike a balance between these potentially conflicting requirements. The operational air quality assessment for the project has been conducted, as far as possible, with the intention of providing accurate and realistic estimates of pollutant emissions and concentrations. The general approach has been to use inputs, models and procedures that are as accurate as possible, except where the context dictates that a degree of conservatism is sensible.
However, the scale of the conservatism can be difficult to define, and this can sometimes result in assumptions being overly conservative. By demonstrating that a deliberate overestimate of impacts is acceptable, it can be confidently predicted that the actual impacts that are likely to be experienced in reality would also lie within acceptable limits12 . A number of key assumptions with implications for conservatism are discussed in Appendix E (Air quality technical report).
12 AECOM (2014) NorthConnex – Environmental Impact Statement – Submissions and Preferred Infrastructure Report. ISBN 978-1-925093-99-5
F6 Extension Stage 1 from New M5 Motorway at Arncliffe to President Avenue at Kogarah 9-25
Chapter 9 – Air quality
9.4 Existing Environment This section describes the existing environment and conditions in the study area. The meteorological inputs and background pollutant concentrations required for the operational air-quality assessment are described in more detail in Appendix E (Air quality technical report).
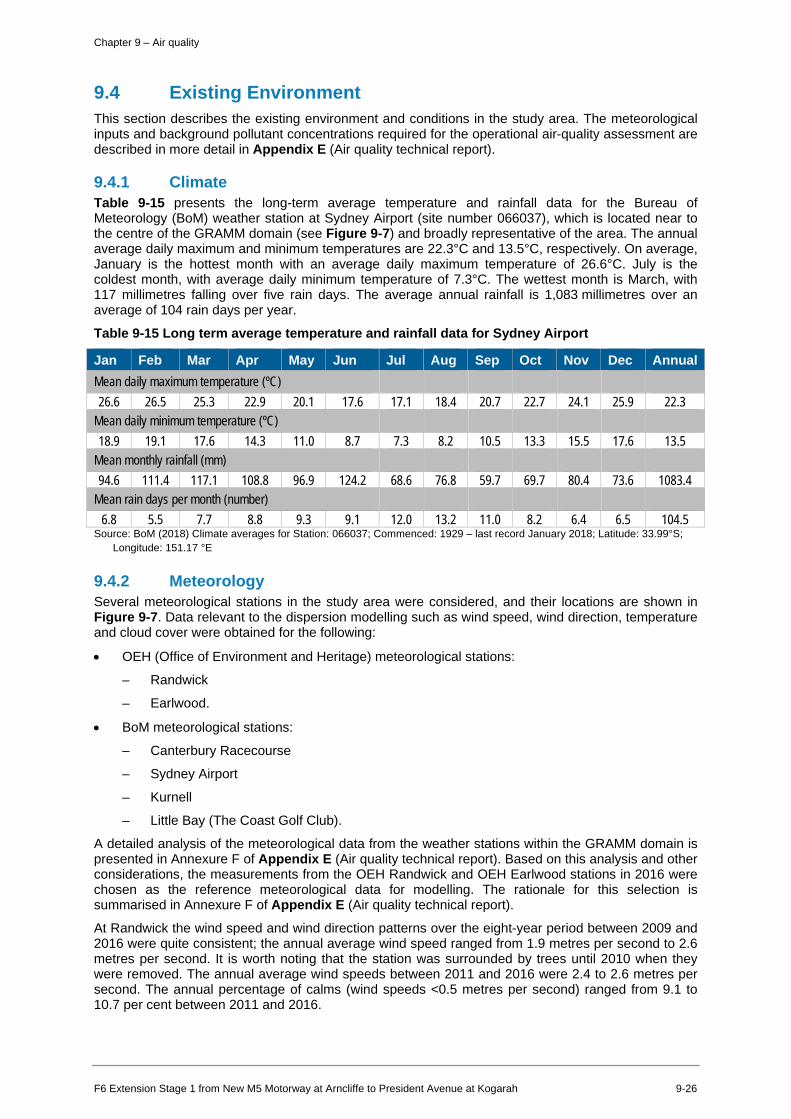
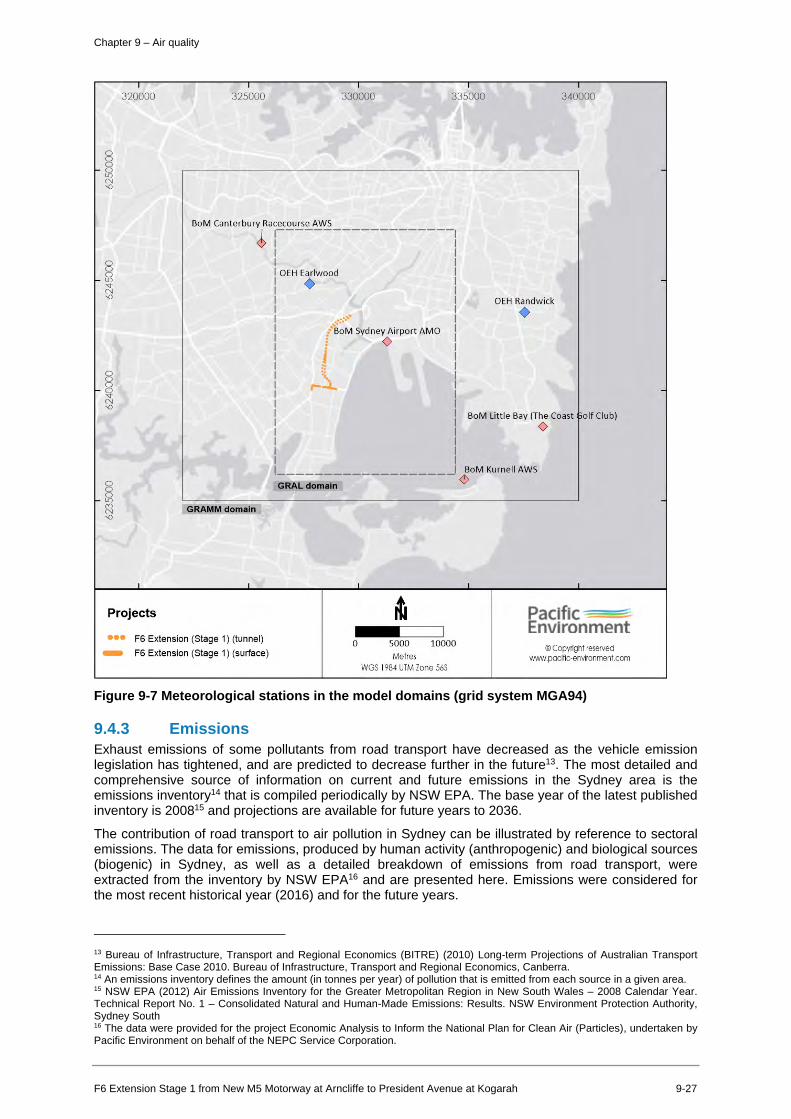
9.4.1 Climate Table 9-15 presents the long-term average temperature and rainfall data for the Bureau of Meteorology (BoM) weather station at Sydney Airport (site number 066037), which is located near to the centre of the GRAMM domain (see Figure 9-7) and broadly representative of the area. The annual average daily maximum and minimum temperatures are 22.3°C and 13.5°C, respectively. On average, January is the hottest month with an average daily maximum temperature of 26.6°C. July is the coldest month, with average daily minimum temperature of 7.3°C. The wettest month is March, with 117 millimetres falling over five rain days. The average annual rainfall is 1,083 millimetres over an average of 104 rain days per year.
Table 9-15 Long term average temperature and rainfall data for Sydney Airport
Jan Feb Mar Apr May Jun Jul Aug Sep Oct Nov Dec Annual Mean daily maximum temperature (ºC) 26.6 26.5 25.3 22.9 20.1 17.6 17.1 18.4 20.7 22.7 24.1 25.9 22.3
Mean daily minimum temperature (ºC) 18.9 19.1 17.6 14.3 11.0 8.7 7.3 8.2 10.5 13.3 15.5 17.6 13.5
Mean monthly rainfall (mm) 94.6 111.4 117.1 108.8 96.9 124.2 68.6 76.8 59.7 69.7 80.4 73.6 1083.4
Mean rain days per month (number) 6.8 5.5 7.7 8.8 9.3 9.1 12.0 13.2 11.0 8.2 6.4 6.5 104.5
Source: BoM (2018) Climate averages for Station: 066037; Commenced: 1929 – last record January 2018; Latitude: 33.99°S; Longitude: 151.17 °E
9.4.2 Meteorology Several meteorological stations in the study area were considered, and their locations are shown in Figure 9-7. Data relevant to the dispersion modelling such as wind speed, wind direction, temperature and cloud cover were obtained for the following:
• OEH (Office of Environment and Heritage) meteorological stations:
– Randwick
– Earlwood.
• BoM meteorological stations:
– Canterbury Racecourse
– Sydney Airport
– Kurnell
– Little Bay (The Coast Golf Club).
A detailed analysis of the meteorological data from the weather stations within the GRAMM domain is presented in Annexure F of Appendix E (Air quality technical report). Based on this analysis and other considerations, the measurements from the OEH Randwick and OEH Earlwood stations in 2016 were chosen as the reference meteorological data for modelling. The rationale for this selection is summarised in Annexure F of Appendix E (Air quality technical report).
At Randwick the wind speed and wind direction patterns over the eight-year period between 2009 and 2016 were quite consistent; the annual average wind speed ranged from 1.9 metres per second to 2.6 metres per second. It is worth noting that the station was surrounded by trees until 2010 when they were removed. The annual average wind speeds between 2011 and 2016 were 2.4 to 2.6 metres per second. The annual percentage of calms (wind speeds <0.5 metres per second) ranged from 9.1 to 10.7 per cent between 2011 and 2016.
F6 Extension Stage 1 from New M5 Motorway at Arncliffe to President Avenue at Kogarah 9-26
325000 330000 335000 340000
BoM Canterbury Racecourse AWS
J i I I I OEH Earlwood
GRAMM domain
Projects
••• - FG Extension (Stage 1) (tunnel)
FG Extension (Stage 1) (surface)
♦ OEH Randwick
~:: ..... •'B oM Sydney Airport AMO
♦
◊
BoM Litt le Bay (The Coast olf Club)
◊
_I BoM Kurnell AWS ------------------ ~
GRALdomaln
0 5000 10000
Metres WGS 1984 UTM Zone 56S
Pacific --===:::::::::::::;: Environment
@ Copyright reserved www.pacitic-environment.com
Chapter 9 – Air quality
Figure 9-7 Meteorological stations in the model domains (grid system MGA94)
9.4.3 Emissions Exhaust emissions of some pollutants from road transport have decreased as the vehicle emission legislation has tightened, and are predicted to decrease further in the future13 . The most detailed and comprehensive source of information on current and future emissions in the Sydney area is the emissions inventory14 that is compiled periodically by NSW EPA. The base year of the latest published inventory is 200815 and projections are available for future years to 2036.
The contribution of road transport to air pollution in Sydney can be illustrated by reference to sectoral emissions. The data for emissions, produced by human activity (anthropogenic) and biological sources (biogenic) in Sydney, as well as a detailed breakdown of emissions from road transport, were extracted from the inventory by NSW EPA16 and are presented here. Emissions were considered for the most recent historical year (2016) and for the future years.
13 Bureau of Infrastructure, Transport and Regional Economics (BITRE) (2010) Long-term Projections of Australian Transport Emissions: Base Case 2010. Bureau of Infrastructure, Transport and Regional Economics, Canberra.14 An emissions inventory defines the amount (in tonnes per year) of pollution that is emitted from each source in a given area. 15 NSW EPA (2012) Air Emissions Inventory for the Greater Metropolitan Region in New South Wales – 2008 Calendar Year. Technical Report No. 1 – Consolidated Natural and Human-Made Emissions: Results. NSW Environment Protection Authority, Sydney South16 The data were provided for the project Economic Analysis to Inform the National Plan for Clean Air (Particles), undertaken by Pacific Environment on behalf of the NEPC Service Corporation.
F6 Extension Stage 1 from New M5 Motorway at Arncliffe to President Avenue at Kogarah 9-27
Chapter 9 – Air quality
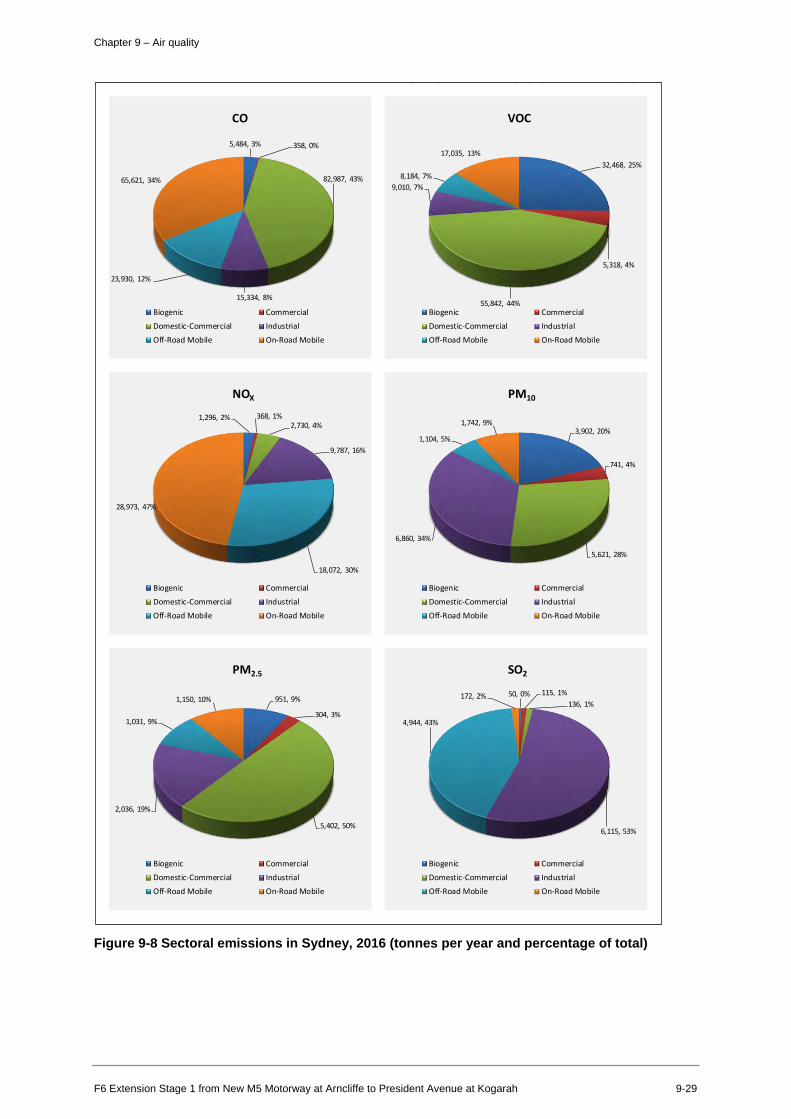
Figure 9-8 shows that road transport was the single largest sectoral contributor to emissions of CO (34 per cent) and NOx (47 per cent) in Sydney during 2016. It was also responsible for a proportion of emissions of VOCs (13 per cent), PM10 (nine per cent) and PM2.5 (10 per cent). The main contributors to VOCs were domestic-commercial activity and biogenic sources. The most important sources of PM10 and PM2.5 emissions were the domestic-commercial sector and industry. The contribution to PM from the domestic sector in Sydney was due largely to wood burning for heating in winter. Emissions from natural sources, such as bushfires, dust storms and marine aerosol, will have contributed significantly to ambient PM concentrations.
The EPA projections of sectoral emissions show that the road transport contribution to emissions CO, VOCs and NOX is projected to decrease substantially between 2011 and 2036 due to improvements in emission-control technology. For PM10, PM2.5 and SO2 the road transport contributions are also expected to decrease, but their smaller contributions to these pollutants mean that these decreases would have only a minor impact on total emissions. In addition, although exhaust emissions can be reduced through emissions technology, non-exhaust emissions (dust from brake wear, road dust and so) are more difficult to reduce and would become a growing proportion of the overall particulate emissions from roads. Further detail of road transport emissions are provided in Appendix E (Air quality technical report).
F6 Extension Stage 1 from New M5 Motorway at Arncliffe to President Avenue at Kogarah 9-28
Iii
Iii
Iii
Iii
Iii
Iii
Iii
Iii
Ii
Iii
II
Iii
II
Ii
Iii
Iii
Iii
Iii
Iii
Iii
Ii
II
Iii
Iii
Iii
Iii
Iii
Iii
II
Iii
II
Ii
Ii
II
Iii
Iii
Chapter 9 – Air quality
Figure 9-8 Sectoral emissions in Sydney, 2016 (tonnes per year and percentage of total)
5,484, 3% 358, 0%
82,987, 43%
15,334, 8%
23,930, 12%
65,621, 34%
CO
Biogenic Commercial
Domestic-Commercial Industrial
Off-Road Mobile On-Road Mobile
32,468, 25%
5,318, 4%
55,842, 44%
9,010, 7% 8,184, 7%
17,035, 13%
VOC
Biogenic Commercial
Domestic-Commercial Industrial
Off-Road Mobile On-Road Mobile
1,296, 2% 368, 1% 2,730, 4%
9,787, 16%
18,072, 30%
28,973, 47%
NOX
Biogenic Commercial
Domestic-Commercial Industrial
Off-Road Mobile On-Road Mobile
3,902, 20%
741, 4%
5,621, 28%
6,860, 34%
1,104, 5%
1,742, 9%
PM10
Biogenic Commercial
Domestic-Commercial Industrial
Off-Road Mobile On-Road Mobile
951, 9%
304, 3%
5,402, 50%
2,036, 19%
1,031, 9%
1,150, 10%
PM2.5
Biogenic Commercial
Domestic-Commercial Industrial
Off-Road Mobile On-Road Mobile
50, 0% 115, 1% 136, 1%
6,115, 53%
4,944, 43%
172, 2%
SO2
Biogenic Commercial
Domestic-Commercial Industrial
Off-Road Mobile On-Road Mobile
F6 Extension Stage 1 from New M5 Motorway at Arncliffe to President Avenue at Kogarah 9-29
Chapter 9 – Air quality
9.4.4 Ambient air quality In order to understand the likely and potential impacts of the project on air quality, a good understanding of the existing air quality in Sydney is essential. A thorough analysis of the air quality monitoring data that were available for the study area was undertaken and is provided in Annexure D of Appendix E (Air quality technical report). The analysis was based mainly on measurements conducted between 2004 and 2016, the principal aim being to establish background pollutant concentrations for use in the assessment. The analysis dealt with temporal and spatial patterns in the data, and contributed to the general understanding of air quality in Sydney.
Air quality in the Sydney region has improved over the last few decades. The improvements have been attributed to initiatives to reduce emissions from industry, motor vehicles, businesses and residences.
Since the introduction of unleaded petrol and catalytic converters in 1985, peak CO concentrations in central Sydney declined rapidly, and the last exceedance of the air quality standard for CO in NSW was recorded in 199817 . Levels of NO2, SO2 and CO also continue to be below national standards across Sydney.
Levels of ozone and particles (PM10 and PM2.5) can still exceed the standards on occasion. Ozone and PM levels are affected by the annual variability in the weather, natural events such as bushfires and dust storms, hazard reduction burns and temperature inversions in winter and the location and intensity of local emission sources, such as wood heaters, transport and industry18 .
9.4.5 Data from monitoring sites in the study area A detailed analysis of the historical trends in Sydney’s air quality (2004-2016), and the current situation, is provided in Annexure D of Appendix E (Air quality technical report). The analysis was based upon hourly data from long-term monitoring stations operated by OEH and Roads and Maritime. Consideration was also given to the shorter-term data from other Roads and Maritime air quality monitoring stations.
The location of the monitoring stations and a summary of the results are provided in Annexure D of Appendix E (Air quality technical report). The data from these stations were also used to define appropriate background concentrations of pollutants for the project assessment.
9.4.6 Project-specific air quality monitoring Two project-specific monitoring stations were established for the F6 Extension by Roads and Maritime in 2017. One of these (station F6:01) was at a background location, and the other at a roadside location. Given the date of deployment, the time period covered was too short for these to be included in the development of background concentrations and model evaluation. However, the data from the stations are presented in Annexure D of Appendix E (Air quality technical report).
The F6 Extension stations were designed to:
• Supplement the existing OEH and Roads and Maritime stations in Sydney
• Establish the representativeness of the data from these stations that were used to characterise air quality in the F6 Extension modelling domain
• Provide a time series of air quality data in the vicinity of the project.
For background air quality, the data from the F6:01 station have been compared with the range of measurements at OEH/Roads and Maritime stations. These comparisons are provided in Annexure D of Appendix E (Air quality technical report). In summary, F6:01 measurements of CO, NOx, NO2, O3
and PM2.5 were generally comparable with the OEH/Roads and Maritime stations. The PM10
measurements at F6:01 were generally towards the lower end of the range of values at the OEH/Roads and Maritime sites.
17 NSW Department of Environment, Climate Change and Water (DECCW) (2009) New South Wales State of the Environment 2009. New South Wales and Department of Environment, Climate Change and Water, Sydney. 18 OEH (2015) New South Wales Air Quality Statement 2014. NSW and Office of Environment and Heritage, Sydney, January 2015.
F6 Extension Stage 1 from New M5 Motorway at Arncliffe to President Avenue at Kogarah 9-30
Chapter 9 – Air quality
9.4.7 Assumed background concentrations Assumed background concentrations were identified, to be used as a base against which impacts on air quality as a result of the project are assessed. The detailed methods for calculating the background concentration and the resulting assumed background concentrations are provided in Annexure D of Appendix E (Air quality technical report).
9.5 Potential impacts – construction
9.5.1 Overview The construction activities for the project are described in Chapter 7 (Construction). This section addresses the potential impacts of the construction phase of the project, in particular this section:
• Identifies the construction boundary and construction scenarios
• Identifies the risk associated with the various construction activities
• Discusses the significance of the identified risks.
In the absence of specific direction for road and tunnel projects in NSW, the potential impacts of the construction phase of the project were assessed using guidance published by the UK Institute of Air Quality Management. The UK guidance was adapted for use in NSW, taking into account factors such as the assessment criteria for ambient PM10 concentrations.
The risks associated with construction dust emissions were assessed for four types of activity: demolition, earthworks, construction, and track-out. The assessment methodology considered three separate dust impacts: annoyance due to dust soiling, the risk of health effects due to an increase in exposure to PM10, and harm to ecological receptors.
For the F6 Extension Stage 1, above-ground construction activities would take place at a number of separate locations, and these were grouped into 2 distinct zones for the purpose of the assessment.
For dust soiling impacts, the sensitivity of assessment zones and all relevant activities was determined to be ‘medium’ for Zone 1 and ‘high’ for Zone 2. For human health impacts, the sensitivity for each area and all relevant activities was determined to be ‘medium’ for Zone 1 and ‘high’ for Zone 2. For ecological impacts, the sensitivity of activities and areas was ‘high’.
Several locations and activities were determined to be of high risk. Consequently, a wide range of management measures has been recommended to mitigate the effects of construction works on local air quality at the nearest receptors. Most of the recommended measures are routinely employed as ‘good practice’ on construction sites.
The power line has not been included in either of the construction zones. This line would be underground for its entire length, either by trenching or, where required, under-boring to avoid sensitive features. Where the power line crosses waterways or railways, conduits would be attached to existing bridges. The trench would require very minor earth works, which would be backfilled at the end of each day. It is not expected to be a significant source of dust and is not included in this assessment of construction.
F6 Extension Stage 1 from New M5 Motorway at Arncliffe to President Avenue at Kogarah 9-31
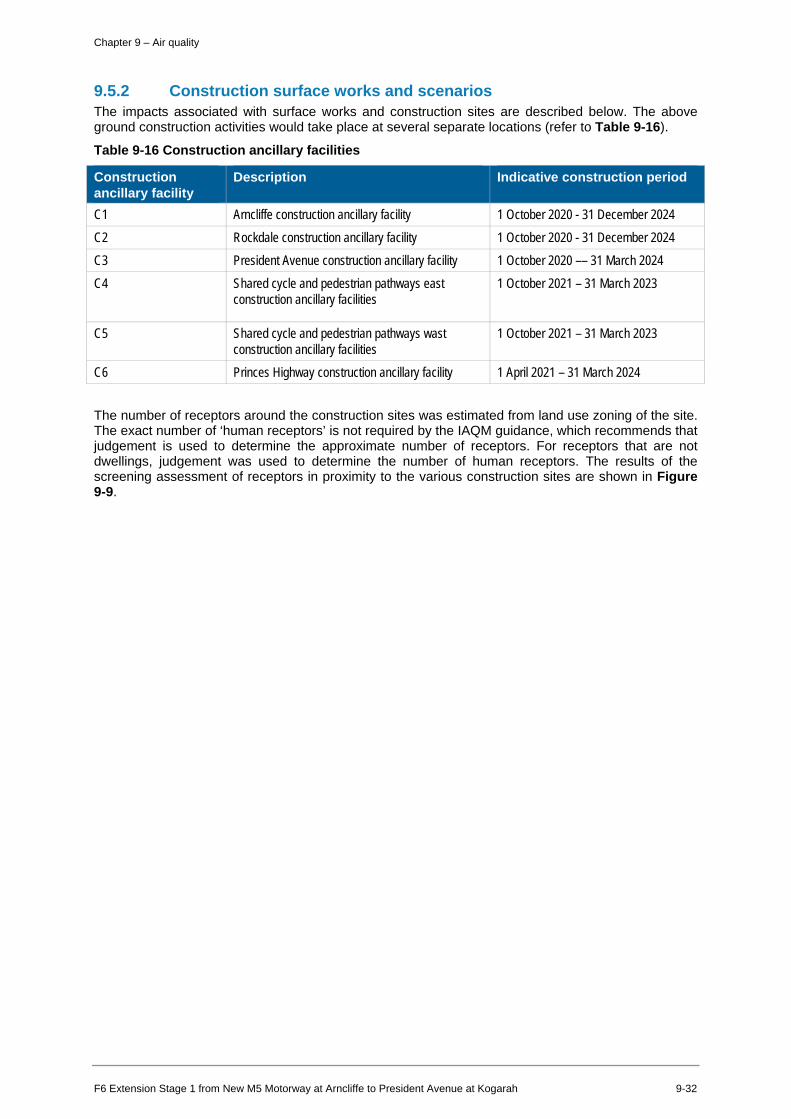
Chapter 9 – Air quality
9.5.2 Construction surface works and scenarios The impacts associated with surface works and construction sites are described below. The above ground construction activities would take place at several separate locations (refer to Table 9-16).
Table 9-16 Construction ancillary facilities
Construction ancillary facility
Description Indicative construction period
C1 Arncliffe construction ancillary facility 1 October 2020 - 31 December 2024 C2 Rockdale construction ancillary facility 1 October 2020 - 31 December 2024 C3 President Avenue construction ancillary facility 1 October 2020 –– 31 March 2024 C4 Shared cycle and pedestrian pathways east
construction ancillary facilities 1 October 2021 – 31 March 2023
C5 Shared cycle and pedestrian pathways wast construction ancillary facilities
1 October 2021 – 31 March 2023
C6 Princes Highway construction ancillary facility 1 April 2021 – 31 March 2024
The number of receptors around the construction sites was estimated from land use zoning of the site. The exact number of ‘human receptors’ is not required by the IAQM guidance, which recommends that judgement is used to determine the approximate number of receptors. For receptors that are not dwellings, judgement was used to determine the number of human receptors. The results of the screening assessment of receptors in proximity to the various construction sites are shown in Figure 9-9.
F6 Extension Stage 1 from New M5 Motorway at Arncliffe to President Avenue at Kogarah 9-32
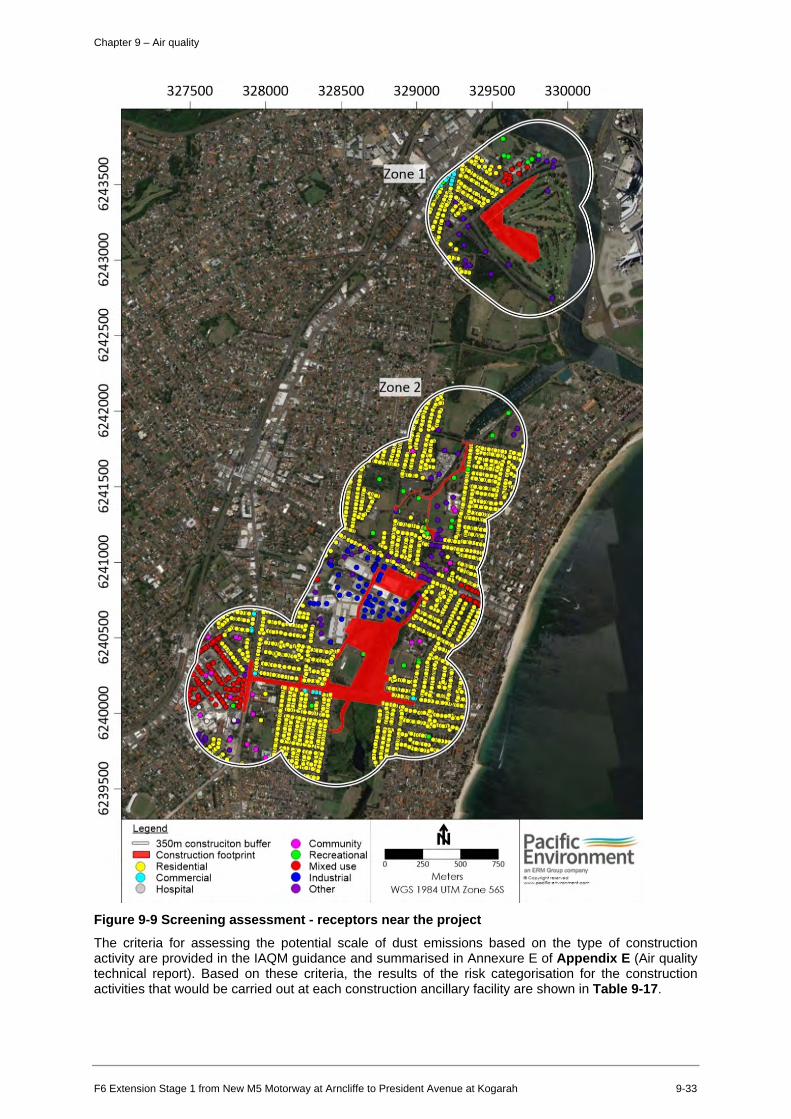
0 L/) ("()
~ N I.O
0 0 0 ("()
~ N I.O
0 0 L/) N ~ N I.O
0 0 0 N ~ N I.O
0 0 L/) rl ~ N I.O
0 0 0 rl ~ N I.O
0 0 L/)
0 ~ N I.O
0 0 0 0 ~ N I.O
0 0 L/) (j\ ("() N I.O
327500 328000
~ = 350m construciton buffer - Construction footprint
Residential e Commercial
Hospital
328500
e Community e Recreational e Mixed use e Industrial e Other
329000 329500
0 250 500 750
Me ters WGS 1984 UTM Zo ne 56S
330000
Paclf IC ~~ Environment 1n ERM Group oompany •c~, .. ....,.., - .pcx.k-e ... "-"fc....,
0
Chapter 9 – Air quality
Figure 9-9 Screening assessment - receptors near the project
The criteria for assessing the potential scale of dust emissions based on the type of construction activity are provided in the IAQM guidance and summarised in Annexure E of Appendix E (Air quality technical report). Based on these criteria, the results of the risk categorisation for the construction activities that would be carried out at each construction ancillary facility are shown in Table 9-17.
F6 Extension Stage 1 from New M5 Motorway at Arncliffe to President Avenue at Kogarah 9-33
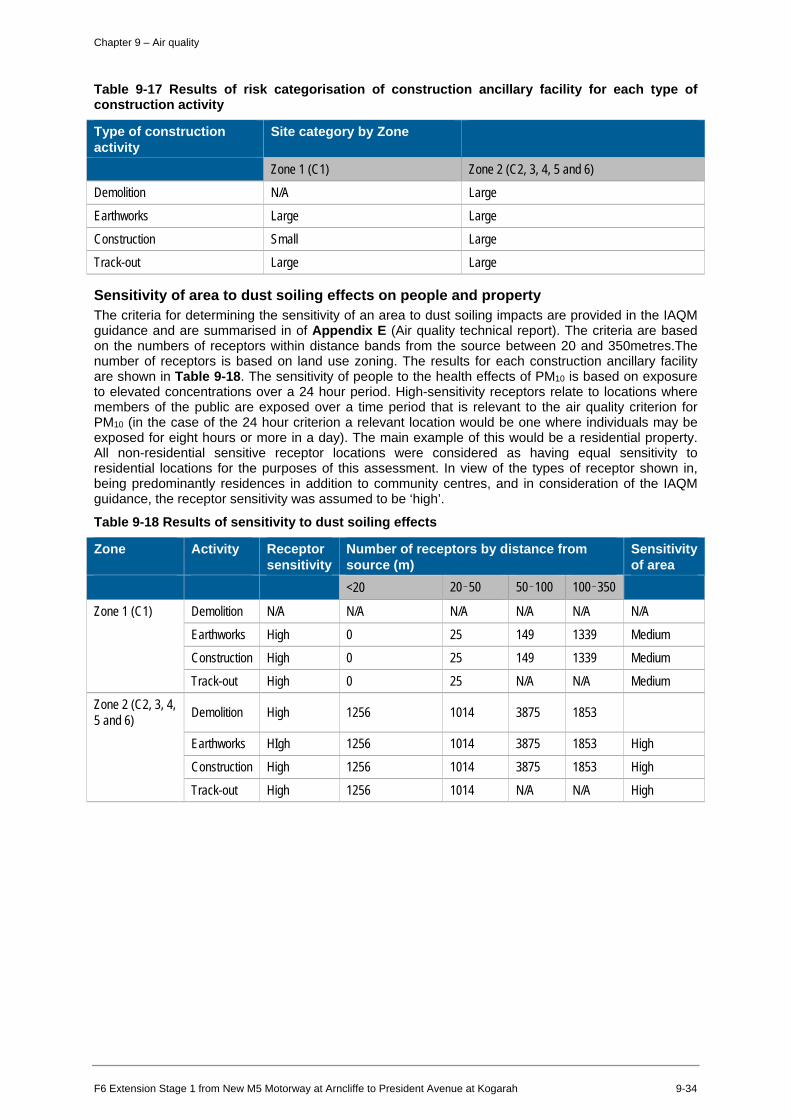
----
Chapter 9 – Air quality
Table 9-17 Results of risk categorisation of construction ancillary facility for each type of construction activity
Type of construction activity
Site category by Zone
Zone 1 (C1) Zone 2 (C2, 3, 4, 5 and 6)
Demolition N/A Large
Earthworks Large Large
Construction Small Large
Track-out Large Large
Sensitivity of area to dust soiling effects on people and property The criteria for determining the sensitivity of an area to dust soiling impacts are provided in the IAQM guidance and are summarised in of Appendix E (Air quality technical report). The criteria are based on the numbers of receptors within distance bands from the source between 20 and 350metres.The number of receptors is based on land use zoning. The results for each construction ancillary facility are shown in Table 9-18. The sensitivity of people to the health effects of PM10 is based on exposure to elevated concentrations over a 24 hour period. High-sensitivity receptors relate to locations where members of the public are exposed over a time period that is relevant to the air quality criterion for PM10 (in the case of the 24 hour criterion a relevant location would be one where individuals may be exposed for eight hours or more in a day). The main example of this would be a residential property. All non-residential sensitive receptor locations were considered as having equal sensitivity to residential locations for the purposes of this assessment. In view of the types of receptor shown in, being predominantly residences in addition to community centres, and in consideration of the IAQM guidance, the receptor sensitivity was assumed to be ‘high’.
Table 9-18 Results of sensitivity to dust soiling effects
Zone Activity Receptor sensitivity
Number of receptors by distance from source (m)
Sensitivity of area
<20 20–50 50–100 100–350
Zone 1 (C1) Demolition N/A N/A N/A N/A N/A N/A
Earthworks High 0 25 149 1339 Medium
Construction High 0 25 149 1339 Medium
Track-out High 0 25 N/A N/A Medium
Zone 2 (C2, 3, 4, 5 and 6) Demolition High 1256 1014 3875 1853
Earthworks HIgh 1256 1014 3875 1853 High
Construction High 1256 1014 3875 1853 High
Track-out High 1256 1014 N/A N/A High
F6 Extension Stage 1 from New M5 Motorway at Arncliffe to President Avenue at Kogarah 9-34
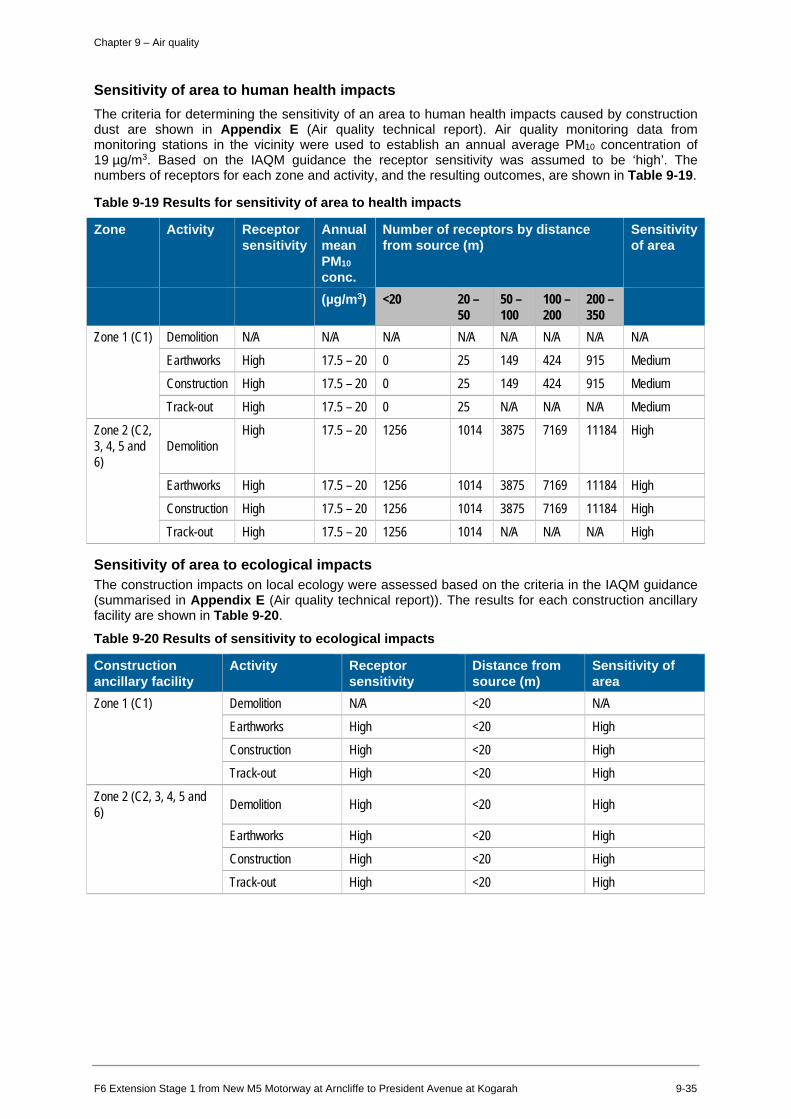
Chapter 9 – Air quality
Sensitivity of area to human health impacts The criteria for determining the sensitivity of an area to human health impacts caused by construction dust are shown in Appendix E (Air quality technical report). Air quality monitoring data from monitoring stations in the vicinity were used to establish an annual average PM10 concentration of 19 µg/m3. Based on the IAQM guidance the receptor sensitivity was assumed to be ‘high’. The numbers of receptors for each zone and activity, and the resulting outcomes, are shown in Table 9-19.
Table 9-19 Results for sensitivity of area to health impacts
Zone Activity Receptor sensitivity
Annual mean PM10
conc.
Number of receptors by distance from source (m)
Sensitivity of area
(µg/m3) <20 20 – 50
50 – 100
100 – 200
200 – 350
Zone 1 (C1) Demolition N/A N/A N/A N/A N/A N/A N/A N/A
Earthworks High 17.5 – 20 0 25 149 424 915 Medium
Construction High 17.5 – 20 0 25 149 424 915 Medium
Track-out High 17.5 – 20 0 25 N/A N/A N/A Medium
Zone 2 (C2, 3, 4, 5 and 6)
Demolition High 17.5 – 20 1256 1014 3875 7169 11184 High
Earthworks High 17.5 – 20 1256 1014 3875 7169 11184 High
Construction High 17.5 – 20 1256 1014 3875 7169 11184 High
Track-out High 17.5 – 20 1256 1014 N/A N/A N/A High
Sensitivity of area to ecological impacts The construction impacts on local ecology were assessed based on the criteria in the IAQM guidance (summarised in Appendix E (Air quality technical report)). The results for each construction ancillary facility are shown in Table 9-20.
Table 9-20 Results of sensitivity to ecological impacts
Construction ancillary facility
Activity Receptor sensitivity
Distance from source (m)
Sensitivity of area
Zone 1 (C1) Demolition N/A <20 N/A
Earthworks High <20 High
Construction High <20 High
Track-out High <20 High
Zone 2 (C2, 3, 4, 5 and 6) Demolition High <20 High
Earthworks High <20 High
Construction High <20 High
Track-out High <20 High
F6 Extension Stage 1 from New M5 Motorway at Arncliffe to President Avenue at Kogarah 9-35
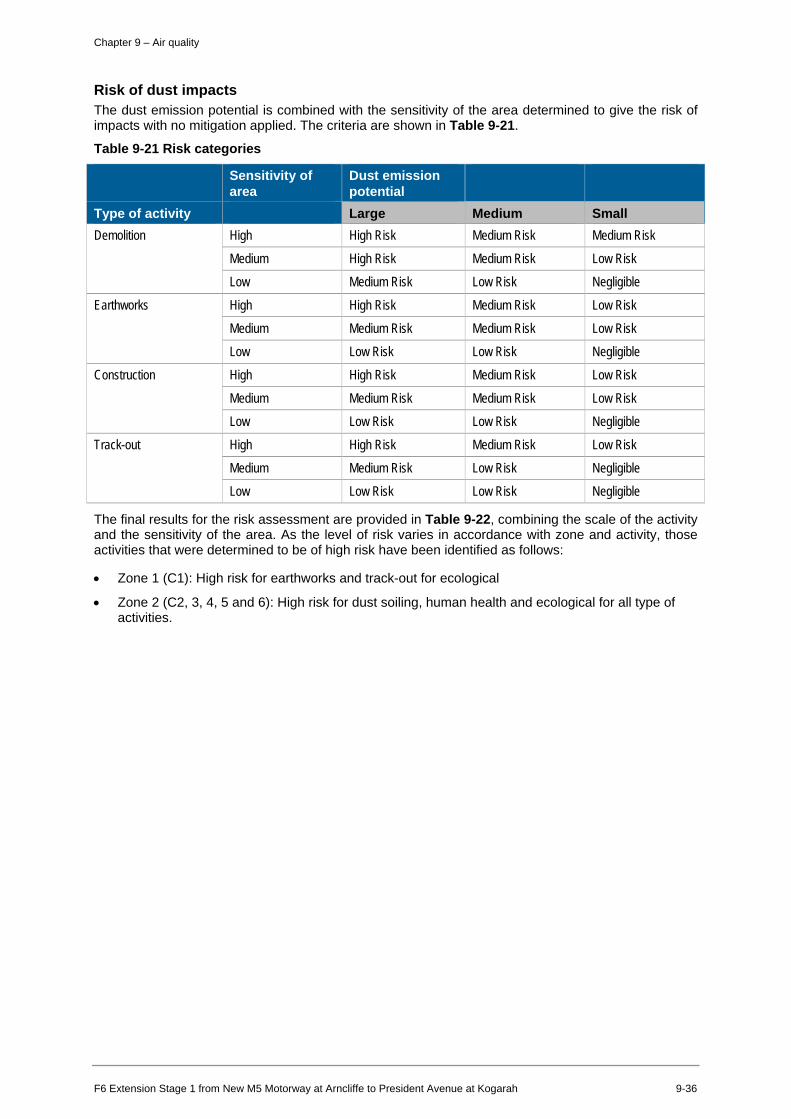
Chapter 9 – Air quality
Risk of dust impacts The dust emission potential is combined with the sensitivity of the area determined to give the risk of impacts with no mitigation applied. The criteria are shown in Table 9-21.
Table 9-21 Risk categories
Sensitivity of area
Dust emission potential
Type of activity Large Medium Small Demolition High High Risk Medium Risk Medium Risk
Medium High Risk Medium Risk Low Risk
Low Medium Risk Low Risk Negligible
Earthworks High High Risk Medium Risk Low Risk
Medium Medium Risk Medium Risk Low Risk
Low Low Risk Low Risk Negligible
Construction High High Risk Medium Risk Low Risk
Medium Medium Risk Medium Risk Low Risk
Low Low Risk Low Risk Negligible
Track-out High High Risk Medium Risk Low Risk
Medium Medium Risk Low Risk Negligible
Low Low Risk Low Risk Negligible
The final results for the risk assessment are provided in Table 9-22, combining the scale of the activity and the sensitivity of the area. As the level of risk varies in accordance with zone and activity, those activities that were determined to be of high risk have been identified as follows:
• Zone 1 (C1): High risk for earthworks and track-out for ecological
• Zone 2 (C2, 3, 4, 5 and 6): High risk for dust soiling, human health and ecological for all type of activities.
F6 Extension Stage 1 from New M5 Motorway at Arncliffe to President Avenue at Kogarah 9-36
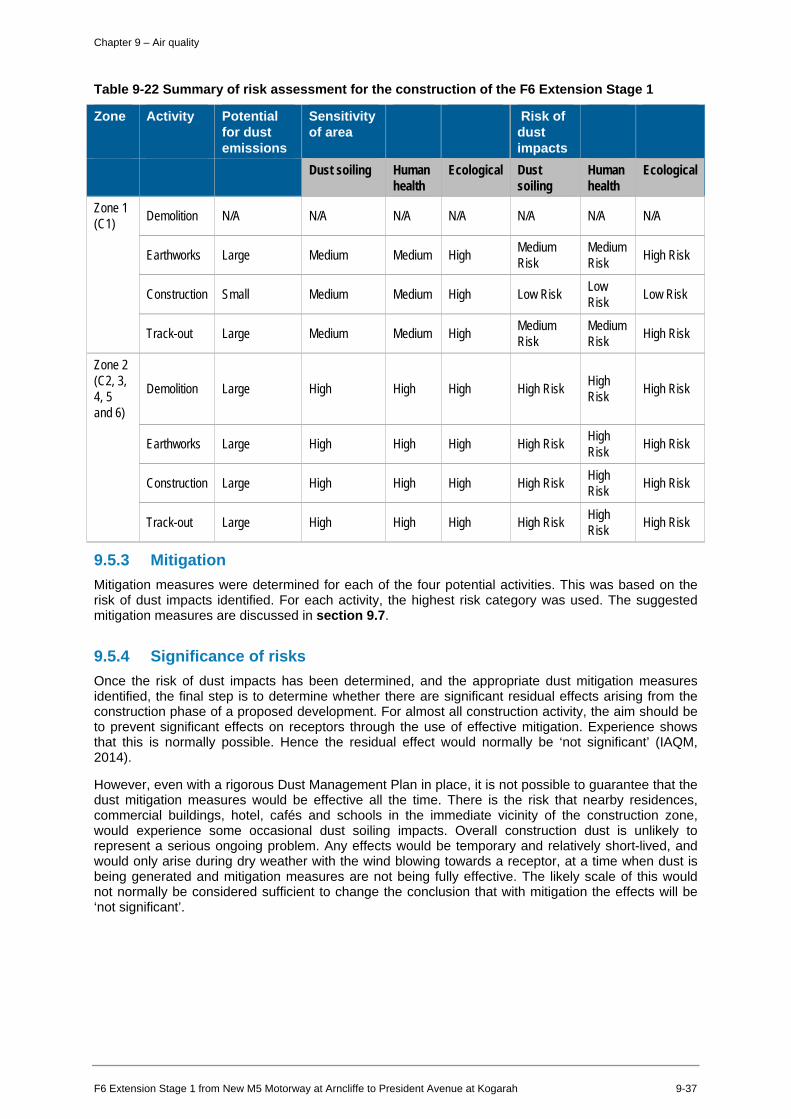
Chapter 9 – Air quality
Table 9-22 Summary of risk assessment for the construction of the F6 Extension Stage 1
Zone Activity Potential for dust emissions
Sensitivity of area
Risk of dust impacts
Dust soiling Human health
Ecological Dust soiling
Human health
Ecological
Zone 1 (C1) Demolition N/A N/A N/A N/A N/A N/A N/A
Earthworks Large Medium Medium High Medium Risk
Medium Risk High Risk
Construction Small Medium Medium High Low Risk Low Risk Low Risk
Track-out Large Medium Medium High Medium Risk
Medium Risk High Risk
Zone 2 (C2, 3, 4, 5 and 6)
Demolition Large High High High High Risk High Risk High Risk
Earthworks Large High High High High Risk High Risk High Risk
Construction Large High High High High Risk High Risk High Risk
Track-out Large High High High High Risk High Risk High Risk
9.5.3 Mitigation Mitigation measures were determined for each of the four potential activities. This was based on the risk of dust impacts identified. For each activity, the highest risk category was used. The suggested mitigation measures are discussed in section 9.7.
9.5.4 Significance of risks Once the risk of dust impacts has been determined, and the appropriate dust mitigation measures identified, the final step is to determine whether there are significant residual effects arising from the construction phase of a proposed development. For almost all construction activity, the aim should be to prevent significant effects on receptors through the use of effective mitigation. Experience shows that this is normally possible. Hence the residual effect would normally be ‘not significant’ (IAQM, 2014).
However, even with a rigorous Dust Management Plan in place, it is not possible to guarantee that the dust mitigation measures would be effective all the time. There is the risk that nearby residences, commercial buildings, hotel, cafés and schools in the immediate vicinity of the construction zone, would experience some occasional dust soiling impacts. Overall construction dust is unlikely to represent a serious ongoing problem. Any effects would be temporary and relatively short-lived, and would only arise during dry weather with the wind blowing towards a receptor, at a time when dust is being generated and mitigation measures are not being fully effective. The likely scale of this would not normally be considered sufficient to change the conclusion that with mitigation the effects will be ‘not significant’.
F6 Extension Stage 1 from New M5 Motorway at Arncliffe to President Avenue at Kogarah 9-37
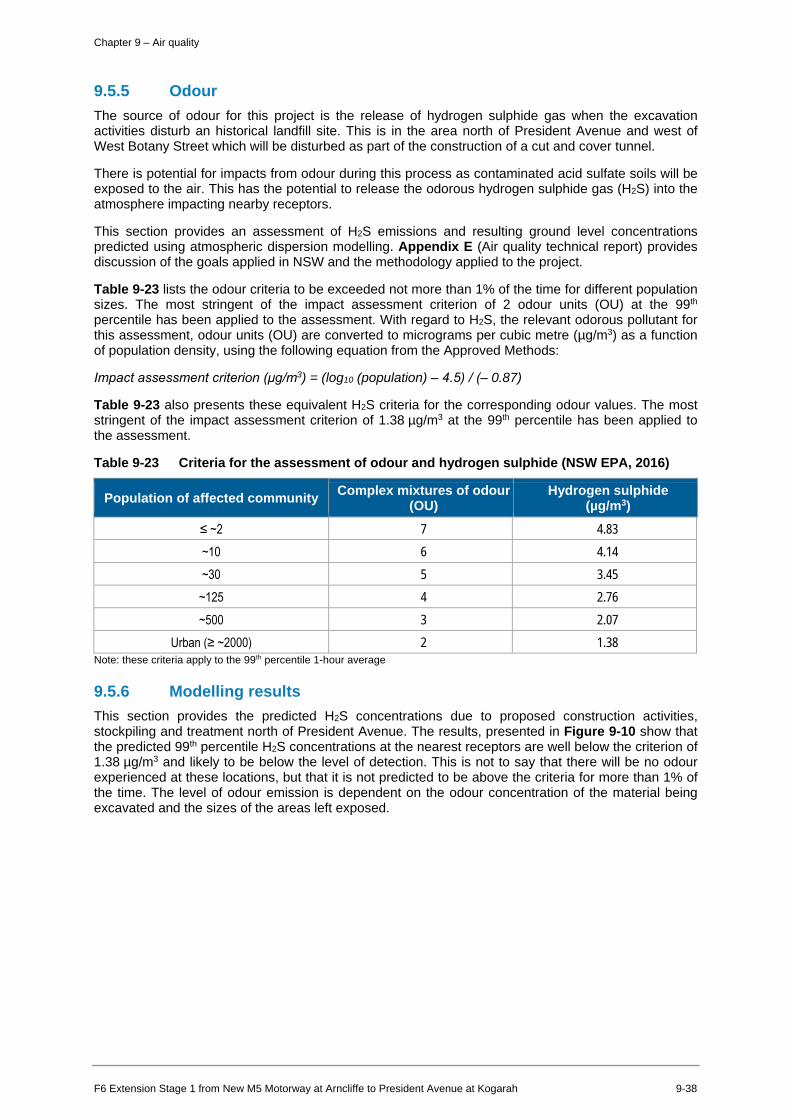
Chapter 9 – Air quality
9.5.5 Odour The source of odour for this project is the release of hydrogen sulphide gas when the excavation activities disturb an historical landfill site. This is in the area north of President Avenue and west of West Botany Street which will be disturbed as part of the construction of a cut and cover tunnel.
There is potential for impacts from odour during this process as contaminated acid sulfate soils will be exposed to the air. This has the potential to release the odorous hydrogen sulphide gas (H2S) into the atmosphere impacting nearby receptors.
This section provides an assessment of H2S emissions and resulting ground level concentrations predicted using atmospheric dispersion modelling. Appendix E (Air quality technical report) provides discussion of the goals applied in NSW and the methodology applied to the project.
Table 9-23 lists the odour criteria to be exceeded not more than 1% of the time for different population sizes. The most stringent of the impact assessment criterion of 2 odour units (OU) at the 99th
percentile has been applied to the assessment. With regard to H2S, the relevant odorous pollutant for this assessment, odour units (OU) are converted to micrograms per cubic metre (µg/m3) as a function of population density, using the following equation from the Approved Methods:
Impact assessment criterion (μg/m3) = (log10 (population) – 4.5) / (– 0.87)
Table 9-23 also presents these equivalent H2S criteria for the corresponding odour values. The most stringent of the impact assessment criterion of 1.38 µg/m3 at the 99th percentile has been applied to the assessment.
Table 9-23 Criteria for the assessment of odour and hydrogen sulphide (NSW EPA, 2016)
Population of affected community Complex mixtures of odour (OU)
Hydrogen sulphide (µg/m3)
≤ ~2 7 4.83 ~10 6 4.14 ~30 5 3.45 ~125 4 2.76 ~500 3 2.07
Urban (≥ ~2000) 2 1.38 Note: these criteria apply to the 99th percentile 1-hour average
9.5.6 Modelling results This section provides the predicted H2S concentrations due to proposed construction activities, stockpiling and treatment north of President Avenue. The results, presented in Figure 9-10 show that the predicted 99th percentile H2S concentrations at the nearest receptors are well below the criterion of 1.38 µg/m3 and likely to be below the level of detection. This is not to say that there will be no odour experienced at these locations, but that it is not predicted to be above the criteria for more than 1% of the time. The level of odour emission is dependent on the odour concentration of the material being excavated and the sizes of the areas left exposed.
F6 Extension Stage 1 from New M5 Motorway at Arncliffe to President Avenue at Kogarah 9-38
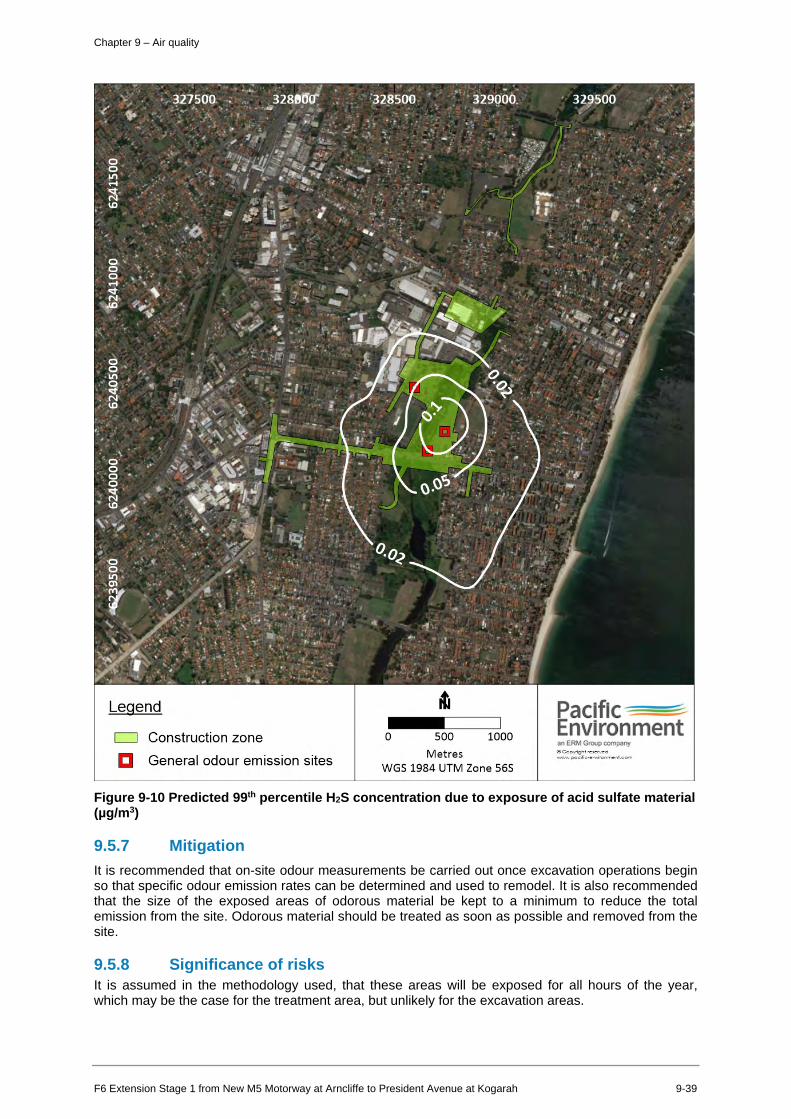
c::::J Construction zone 0 500 1000
Cl General odour emission sites Metres WGS 1984 UTM Zone 56S
Pacific , Environment an ERM Group company ® C opyri9hi ,.._,-d www.po cfflc-en-..;ronment.com
Chapter 9 – Air quality
Figure 9-10 Predicted 99th percentile H2S concentration due to exposure of acid sulfate material (µg/m3)
9.5.7 Mitigation It is recommended that on-site odour measurements be carried out once excavation operations begin so that specific odour emission rates can be determined and used to remodel. It is also recommended that the size of the exposed areas of odorous material be kept to a minimum to reduce the total emission from the site. Odorous material should be treated as soon as possible and removed from the site.
9.5.8 Significance of risks It is assumed in the methodology used, that these areas will be exposed for all hours of the year, which may be the case for the treatment area, but unlikely for the excavation areas.
F6 Extension Stage 1 from New M5 Motorway at Arncliffe to President Avenue at Kogarah 9-39
Chapter 9 – Air quality
9.6 Potential impacts – operation
9.6.1 In-tunnel air quality In-tunnel air quality for the project was modelled using the IDA Tunnel software and Australia-specific emission factors from PIARC. Consideration was given to peak in-tunnel concentrations of CO and NO2, as well as the peak extinction coefficient (for visibility). The work covered expected traffic, regulatory demand, and worst case operations scenarios.
In addition, all possible travel routes through the F6 Extension Stage 1 and the adjoining tunnels were identified for each direction of travel, and these were assessed against the in-tunnel criterion for NO2
assessed as an average along any route through the tunnel network.
The information presented in the report has confirmed that the tunnel ventilation system will be designed to maintain in-tunnel air quality well within operational limits for all scenarios.
Expected traffic The results are shown in the form of graphs, depicting graphs, individual lines for each period of the day with major tunnel features (intersections, interface locations) added for reference. The results for the 2026 and 2036 Do Something and Cumulative scenarios are provided in graphs for the routes from President Avenue to the mainline interface point between M4-M5 Link and New M5 in both directions of travel. Further detail including the tables showing the in-tunnel maximum values for NO2,
CO and visibility and the outlet emissions are provided in Annexure K of Appendix E (Air quality technical report).
The route average NO2, CO and visibility, measured as the extinction coefficient, are all within the criteria for all sections of the journeys between President Avenue on ramps and the interface with the M4-M5 Link tunnel at St Peters in both northbound and southbound directions. The list of routes assessed is shown in Table 9-24.
F6 Extension Stage 1 from New M5 Motorway at Arncliffe to President Avenue at Kogarah 9-40
Chapter 9 – Air quality
Table 9-24 List of routes assessed
Route ID Start at Finish at Approx. length
Southbound (M4 to M5) direction 1A New M5
Motorway St Peters F6 Extension
Stage 1 President Ave 6.7 km
1B New M5 Motorway
St Peters New M5 Motorway
New M5 Motorway portal (Kingsgrove)
9.1 km
1C New M5 Motorway
M4-M5 Link interface
F6 Extension Stage 1
President Ave 6.7 km
1D New M5 Motorway
M4-M5 Link interface
New M5 Motorway
New M5 Motorway portal (Kingsgrove)
9.0 km
Northbound (M5 to M4) direction 2A F6 Extension
Stage 1 President Ave New M5
Motorway St Peters 6.8 km
2B F6 Extension Stage 1
President Ave New M5 Motorway
M4-M5 Link interface
6.7 km
2C New M5 Motorway
M5 portal (Kingsgrove)
New M5 Motorway
M4-M5 Link interface
9.0 km
2D New M5 Motorway
M5 portal (Kingsgrove)
New M5 Motorway
St Peters 9.2 km
Each line in the graph represents a traffic period of the 24 hours as shown in Table 9-25.
Table 9-25 Daily traffic periods
ID Description Period of the day AM Morning Peak 7am to 9am
IP Inter peak 9am to 3pm
PM Afternoon peak 3pm to 6pm
EV Evening 6pm to 7am
F6 Extension Stage 1 from New M5 Motorway at Arncliffe to President Avenue at Kogarah 9-41
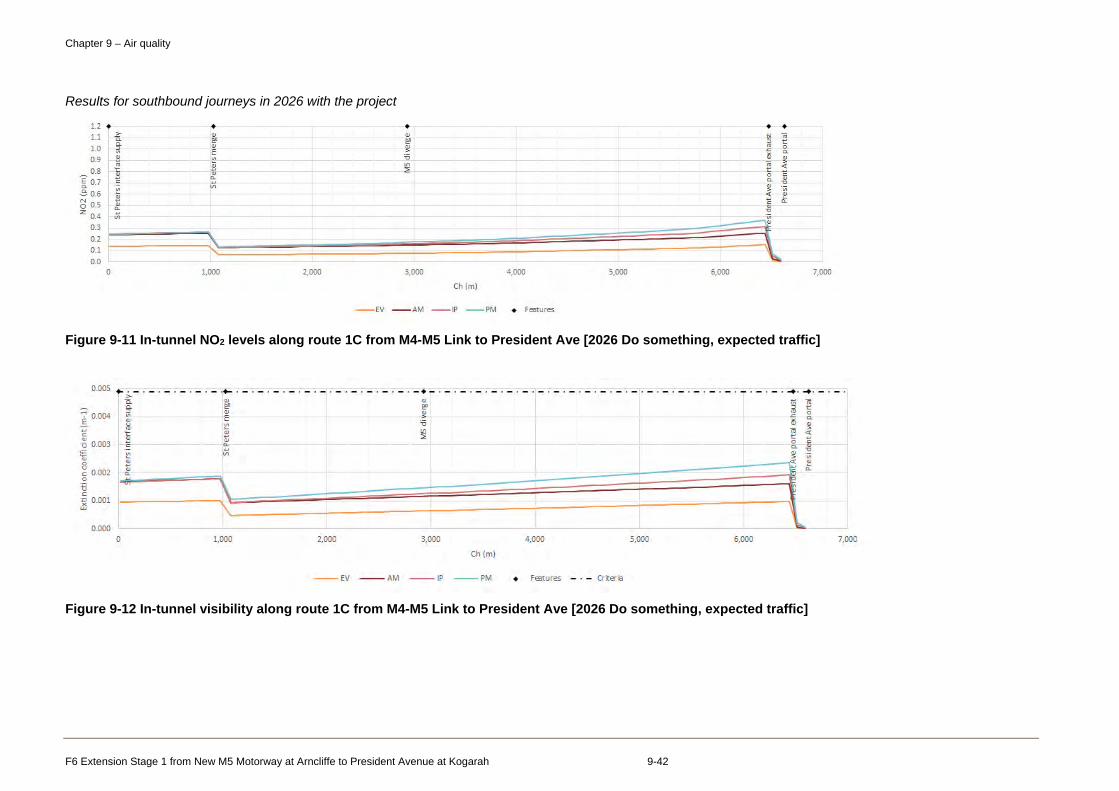
1.2 • 1.1
1.0 0.9
0.8
I 0.1 ~ 0.6 "' 0 0.5 z
0.4 0.3
0.2 0.1
0.0 0
0.005
-;::;-i 0.004
C
•a o.oos ~ 0 u C 0.002 0
tl C
~ 0.001 uJ
0.000
• • • • >-a. 0. ;;: 8 "' I "'
CJ CJ ti 'lii e!' e!' ::, ~ CJ 'a " 0 E tl 0.
"' i:i CJ
ci 111 'lii ~ CJ ::;; li C. 0. CJ
~ 'O
~ 'vi
fl CJ Q.
~
~ " Ir. CJ 'C
1,000 2,000 3,000 4,000 5,000 6,000 7,000
Ch(m)
--EV --AM --IP --PM ♦ Fffitures
~ - - · - · - · - · - · - ·+- · - · - · - · - · - · - · - · - · - · - · - · -•- · - · - · - · - · - · - · - · - · - · - · - · - · - · - · - · - · - · - · - · - · - • - · ➔ · ➔ · - · - ·
0
>-a. ~ 8 " 'c:
~
1,000 2,000 3,000
Ch Im)
-- EV --AM -- IP -- PM
l 4,000 5,000 6,000 7,000
+ Fffitures - • - Crleria
Chapter 9 – Air quality
Results for southbound journeys in 2026 with the project
Figure 9-11 In-tunnel NO2 levels along route 1C from M4-M5 Link to President Ave [2026 Do something, expected traffic]
Figure 9-12 In-tunnel visibility along route 1C from M4-M5 Link to President Ave [2026 Do something, expected traffic]
F6 Extension Stage 1 from New M5 Motorway at Arncliffe to President Avenue at Kogarah 9-42
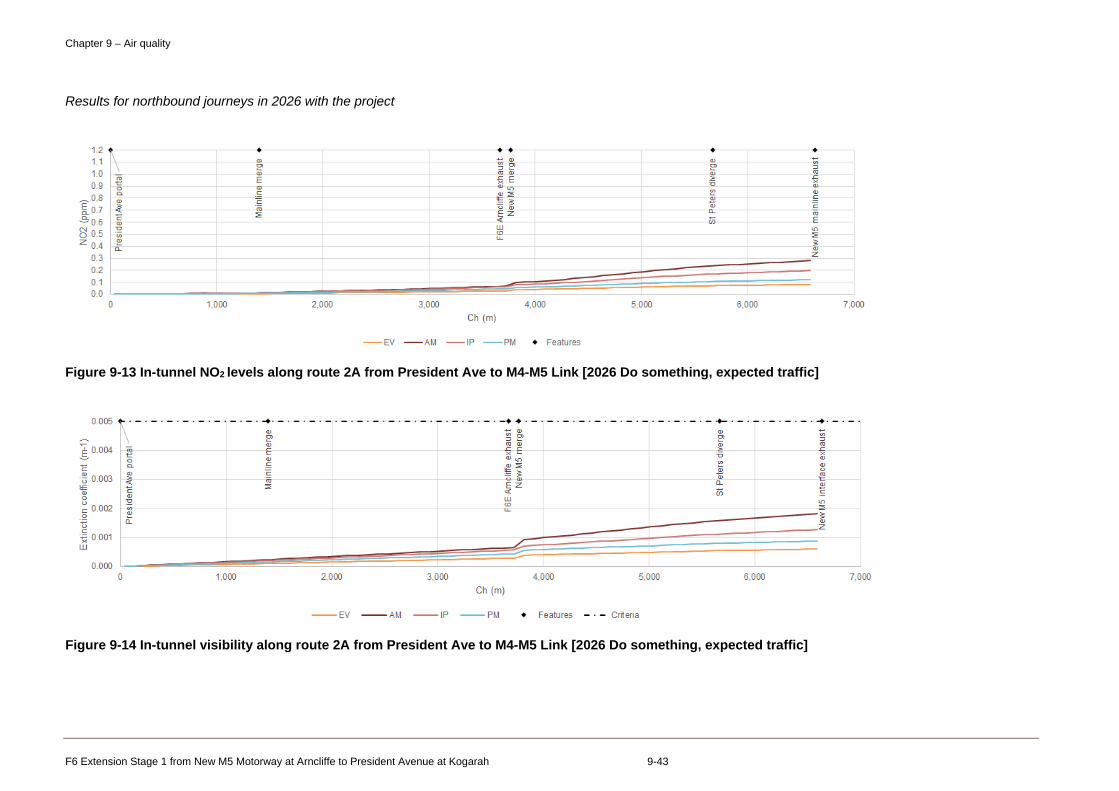
1.2 j\ 1.1
1.0 ro 0.9
~0.8 [ 07 5 06 8 05 z 0. 4
0.3
0.2
0.1 00
t 0 C.
Q)
~ c "' ~ "' Q)
a:
0
• Q)
~ Q)
E Q)
~ C ·.; :a
1,000 2,000
• • • • "'
Q) Q)
"' :::, Cl) ~ :::,
CD Q) Q) CD .c E ·" .c X X Q) .-, "' Q)
,lg :a "' Q)
Q) C = ,:: cii ~ ~ Q)
(1-E z "' <( 1n E w .-, (D
LL :a ,:: Q)
z
3,000 4,000 5,000 6,000 7,000
Ch (m)
--EV --AM --IP --PM ♦ Features
oom • - - - - - - - - - - - - - - - - - ➔ - - - - - - - - - - - - - - - - - - - - - - - - - - - - - -•• - - - - - - - - - - - - - - - - - - - - - - - -- - - - - - - - - - - - ~ - - - - -\ ~ 1,;~ ~ ~ .... ~.... .... ~
...---- Q) (1J Q.) Q) C'C
_g, 0.004 ~ ~ ~ ~ ~ ~
C ~ ~ ~i : ~ -~ 0.003 ~ ·co u ru ~ ~ ij:: C 2 ~ z 00 ~
~ 0.002 ~ ~ ~ 0 Q) ----============,:: ti r1. z C
·~ 0.001 w
0.000 0 1,000 2,000 3,000
Ch (m)
--EV --AM -- IP -- PM
4,000 5,000 6,000
• Features - · - Crtteria
7,000
Chapter 9 – Air quality
Results for northbound journeys in 2026 with the project
Figure 9-13 In-tunnel NO2 levels along route 2A from President Ave to M4-M5 Link [2026 Do something, expected traffic]
Figure 9-14 In-tunnel visibility along route 2A from President Ave to M4-M5 Link [2026 Do something, expected traffic]
F6 Extension Stage 1 from New M5 Motorway at Arncliffe to President Avenue at Kogarah 9-43
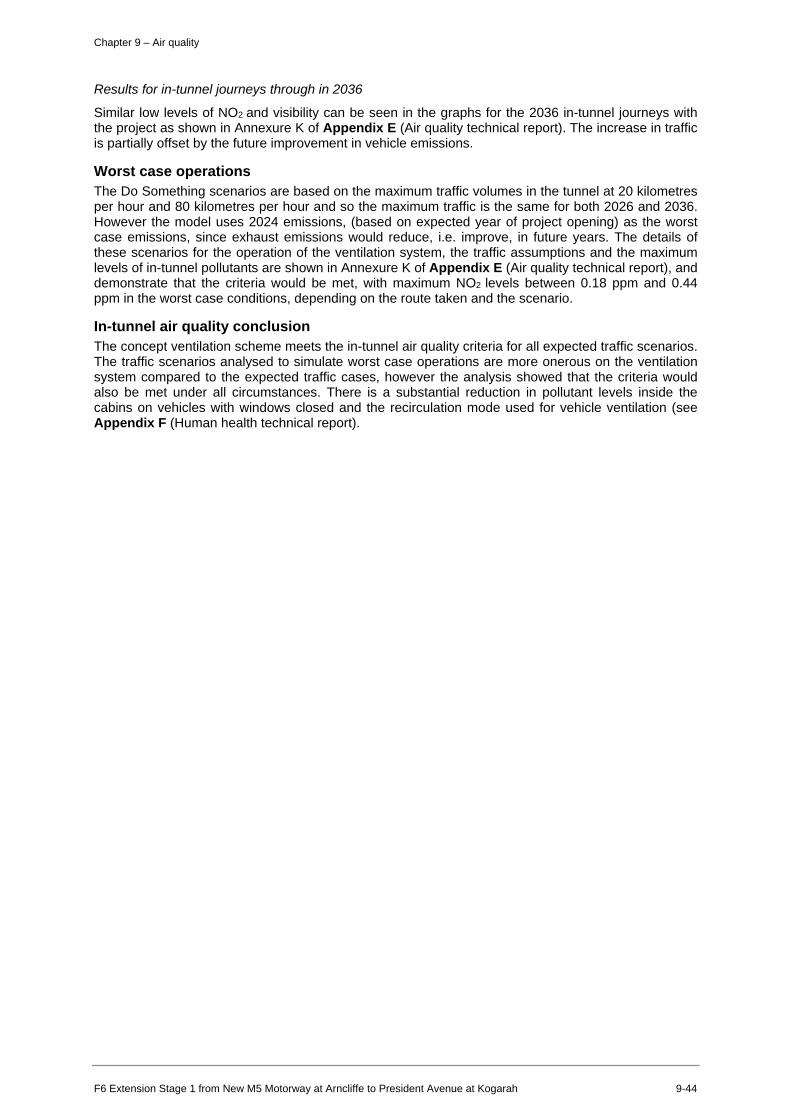
Chapter 9 – Air quality
Results for in-tunnel journeys through in 2036
Similar low levels of NO2 and visibility can be seen in the graphs for the 2036 in-tunnel journeys with the project as shown in Annexure K of Appendix E (Air quality technical report). The increase in traffic is partially offset by the future improvement in vehicle emissions.
Worst case operations The Do Something scenarios are based on the maximum traffic volumes in the tunnel at 20 kilometres per hour and 80 kilometres per hour and so the maximum traffic is the same for both 2026 and 2036. However the model uses 2024 emissions, (based on expected year of project opening) as the worst case emissions, since exhaust emissions would reduce, i.e. improve, in future years. The details of these scenarios for the operation of the ventilation system, the traffic assumptions and the maximum levels of in-tunnel pollutants are shown in Annexure K of Appendix E (Air quality technical report), and demonstrate that the criteria would be met, with maximum NO2 levels between 0.18 ppm and 0.44 ppm in the worst case conditions, depending on the route taken and the scenario.
In-tunnel air quality conclusion The concept ventilation scheme meets the in-tunnel air quality criteria for all expected traffic scenarios. The traffic scenarios analysed to simulate worst case operations are more onerous on the ventilation system compared to the expected traffic cases, however the analysis showed that the criteria would also be met under all circumstances. There is a substantial reduction in pollutant levels inside the cabins on vehicles with windows closed and the recirculation mode used for vehicle ventilation (see Appendix F (Human health technical report).
F6 Extension Stage 1 from New M5 Motorway at Arncliffe to President Avenue at Kogarah 9-44
Chapter 9 – Air quality
9.6.2 Ambient air quality
9.6.3 Results for expected traffic scenarios (ground-level concentrations)
Overview • The predicted total concentrations of all criteria pollutants at receptors were nearly always
dominated by the existing background contribution
• For some pollutants and metrics (such as annual mean NO2) there was also predicted to be a significant contribution from the modelled surface road traffic
• Under expected traffic conditions, the predicted contribution of tunnel ventilation outlets to pollutant concentrations was negligible for all receptors
• Any predicted changes in concentrations were driven by changes in the traffic volumes on the modelled surface road network, not by the tunnel ventilation outlets
• For some metrics (one-hour NO2 and 24-hour PM10), exceedances of the criteria were predicted to occur both with and without the project. However, where this was the case the total numbers of receptors with exceedances decreased slightly with the project and in the cumulative scenario
• Where increases in pollutant concentrations at receptors were predicted, these were mostly small and a very small proportion of receptors were predicted to have larger, but acceptable increases. Refer to the pollutant specific results in this section.
• The spatial changes in air quality as a result of the project were quite complex, reflecting the complex changes in traffic on the network. For example:
– There were noticeable decreases in PM2.5 along several roads with the project, including Botany Street, Southern Cross Drive, General Holmes Drive, The Grand Parade to the north of President Avenue, President Avenue to the east of the project, and Marsh Street. These changes reflected reductions in traffic of between 2 per cent and 22 per cent on these roads. There were increases in concentration along President Avenue to the west of the F6 Extension Stage 1 project and Princes Highway to the south of the junction with Rocky Point Road
– For the cumulative scenario (2036-DSC) there were some additional changes associated with the introduction of the later stages F6 Extension. These included reductions in PM2.5
concentration along The Grand Parade to the south of President Avenue, Sandringham Street and Rocky Point Road. In addition, the increase in concentration on Princes Highway in the Do Something scenarios changed to a reduction in concentration in the Cumulative scenario
– With respect to the overall concentration distributions, there was no marked redistribution of air quality impacts. There was no significant increase in concentration at receptor locations which already had a relatively high concentration in the Do Minimum cases
– Contour plots were developed to illustrate the spatial distribution of pollutant concentrations (from all sources) across the GRAL domain. Some plots are provided here to illustrate the most important results. All other contour plots are provided in Annexure I of Appendix E (Air quality technical report). The plots illustrate the strong links between the spatial distribution of air pollution and the traffic on the road network.
Pollutant specific results Results for all pollutants and metrics are summarised below graphs and contour plots are shown for the key pollutants of NO2, PM10 and PM2.5 to illustrate the most important air quality results, and the changes as a result of the project. All other graphs and contour plots are shown in Appendix E (Air quality technical report) and Annexure I to Appendix E.
Contour plots were developed to illustrate the spatial distribution of pollutant concentrations (from all sources) across the GRAL domain. As noted earlier, to avoid a large amount of duplication only the contour plots showing the change in pollutants concentrations for 2036 Do Something and the corresponding Do Minimum case, 2036-Do Minimum, where applicable. For all other scenarios the contour plots are given in Annexure I of Appendix E (Air quality technical report). The plots illustrate the strong links between the spatial distribution of air pollution and the traffic on the road network.
F6 Extension Stage 1 from New M5 Motorway at Arncliffe to President Avenue at Kogarah 9-45
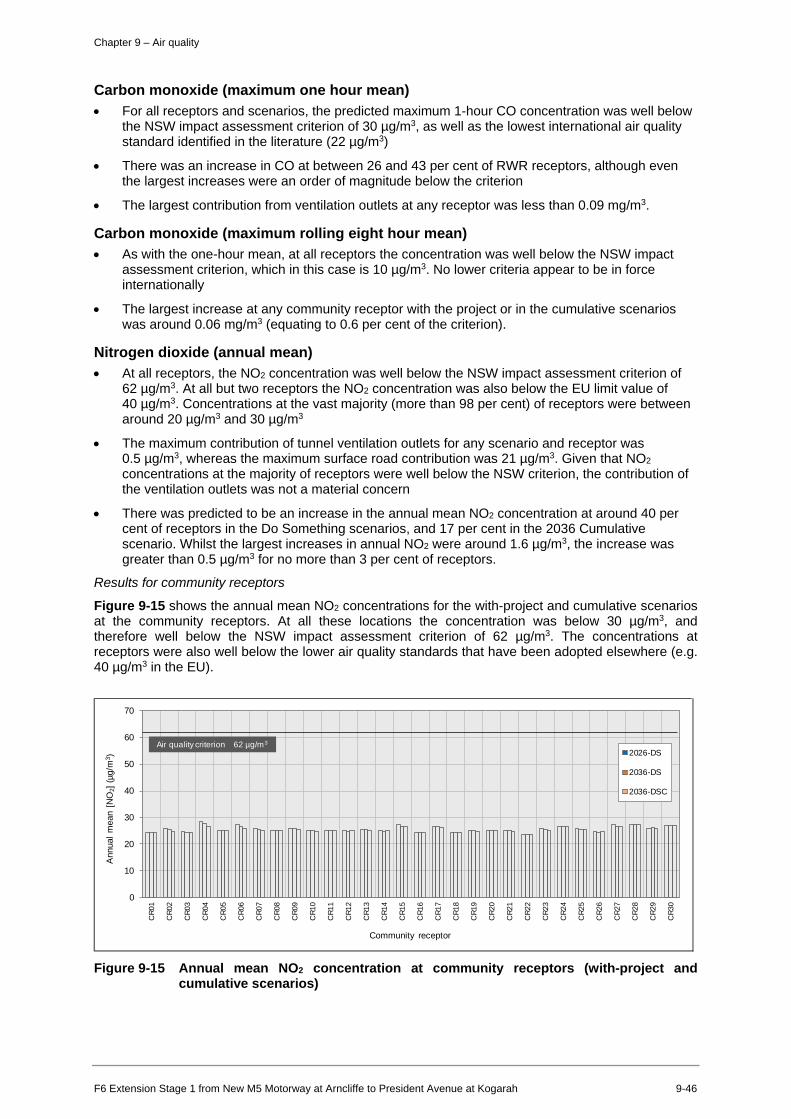
=
Chapter 9 – Air quality
Carbon monoxide (maximum one hour mean) • For all receptors and scenarios, the predicted maximum 1-hour CO concentration was well below
the NSW impact assessment criterion of 30 µg/m3, as well as the lowest international air quality standard identified in the literature (22 µg/m3)
• There was an increase in CO at between 26 and 43 per cent of RWR receptors, although even the largest increases were an order of magnitude below the criterion
• The largest contribution from ventilation outlets at any receptor was less than 0.09 mg/m3.
Carbon monoxide (maximum rolling eight hour mean) • As with the one-hour mean, at all receptors the concentration was well below the NSW impact
assessment criterion, which in this case is 10 µg/m3. No lower criteria appear to be in force internationally
• The largest increase at any community receptor with the project or in the cumulative scenarios was around 0.06 mg/m3 (equating to 0.6 per cent of the criterion).
Nitrogen dioxide (annual mean) • At all receptors, the NO2 concentration was well below the NSW impact assessment criterion of
62 µg/m3. At all but two receptors the NO2 concentration was also below the EU limit value of 40 µg/m3. Concentrations at the vast majority (more than 98 per cent) of receptors were between around 20 µg/m3 and 30 µg/m3
• The maximum contribution of tunnel ventilation outlets for any scenario and receptor was 0.5 µg/m3, whereas the maximum surface road contribution was 21 µg/m3. Given that NO2
concentrations at the majority of receptors were well below the NSW criterion, the contribution of the ventilation outlets was not a material concern
• There was predicted to be an increase in the annual mean NO2 concentration at around 40 per cent of receptors in the Do Something scenarios, and 17 per cent in the 2036 Cumulative scenario. Whilst the largest increases in annual NO2 were around 1.6 µg/m3, the increase was greater than 0.5 µg/m3 for no more than 3 per cent of receptors.
Results for community receptors
Figure 9-15 shows the annual mean NO2 concentrations for the with-project and cumulative scenarios at the community receptors. At all these locations the concentration was below 30 µg/m3, and therefore well below the NSW impact assessment criterion of 62 µg/m3. The concentrations at receptors were also well below the lower air quality standards that have been adopted elsewhere (e.g. 40 µg/m3 in the EU).
0
10
20
30
40
50
60
70
CR
01
CR
02
CR
03
CR
04
CR
05
CR
06
CR
07
CR
08
CR
09
CR
10
CR
11
CR
12
CR
13
CR
14
CR
15
CR
16
CR
17
CR
18
CR
19
CR
20
CR
21
CR
22
CR
23
CR
24
CR
25
CR
26
CR
27
CR
28
CR
29
CR
30
Ann
ual
mea
n [N
O2 ]
(µg
/m3 )
Community receptor
2026-DS
2036-DS
2036-DSC
Air quality criterion 62 µg/m3
Figure 9-15 Annual mean NO2 concentration at community receptors (with-project and cumulative scenarios)
F6 Extension Stage 1 from New M5 Motorway at Arncliffe to President Avenue at Kogarah 9-46
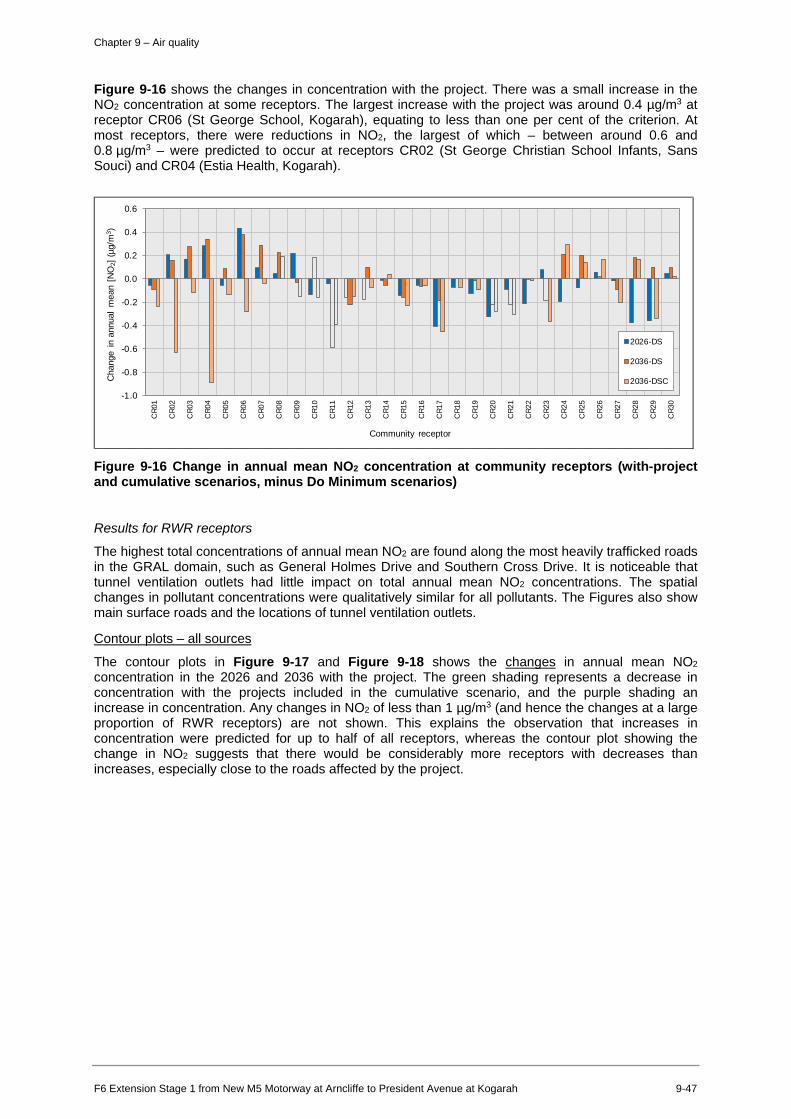
□
Chapter 9 – Air quality
Figure 9-16 shows the changes in concentration with the project. There was a small increase in the NO2 concentration at some receptors. The largest increase with the project was around 0.4 µg/m3 at receptor CR06 (St George School, Kogarah), equating to less than one per cent of the criterion. At most receptors, there were reductions in NO2, the largest of which – between around 0.6 and 0.8 µg/m3 – were predicted to occur at receptors CR02 (St George Christian School Infants, Sans Souci) and CR04 (Estia Health, Kogarah).
-1.0
-0.8
-0.6
-0.4
-0.2
0.0
0.2
0.4
0.6
CR
01
CR
02
CR
03
CR
04
CR
05
CR
06
CR
07
CR
08
CR
09
CR
10
CR
11
CR
12
CR
13
CR
14
CR
15
CR
16
CR
17
CR
18
CR
19
CR
20
CR
21
CR
22
CR
23
CR
24
CR
25
CR
26
CR
27
CR
28
CR
29
CR
30
Cha
nge
in a
nnua
l m
ean
[NO
2 ] (
µg/m
3 )
Community receptor
2026-DS
2036-DS
2036-DSC
Figure 9-16 Change in annual mean NO2 concentration at community receptors (with-project and cumulative scenarios, minus Do Minimum scenarios)
Results for RWR receptors
The highest total concentrations of annual mean NO2 are found along the most heavily trafficked roads in the GRAL domain, such as General Holmes Drive and Southern Cross Drive. It is noticeable that tunnel ventilation outlets had little impact on total annual mean NO2 concentrations. The spatial changes in pollutant concentrations were qualitatively similar for all pollutants. The Figures also show main surface roads and the locations of tunnel ventilation outlets.
Contour plots – all sources
The contour plots in Figure 9-17 and Figure 9-18 shows the changes in annual mean NO2
concentration in the 2026 and 2036 with the project. The green shading represents a decrease in concentration with the projects included in the cumulative scenario, and the purple shading an increase in concentration. Any changes in NO2 of less than 1 µg/m3 (and hence the changes at a large proportion of RWR receptors) are not shown. This explains the observation that increases in concentration were predicted for up to half of all receptors, whereas the contour plot showing the change in NO2 suggests that there would be considerably more receptors with decreases than increases, especially close to the roads affected by the project.
F6 Extension Stage 1 from New M5 Motorway at Arncliffe to President Avenue at Kogarah 9-47
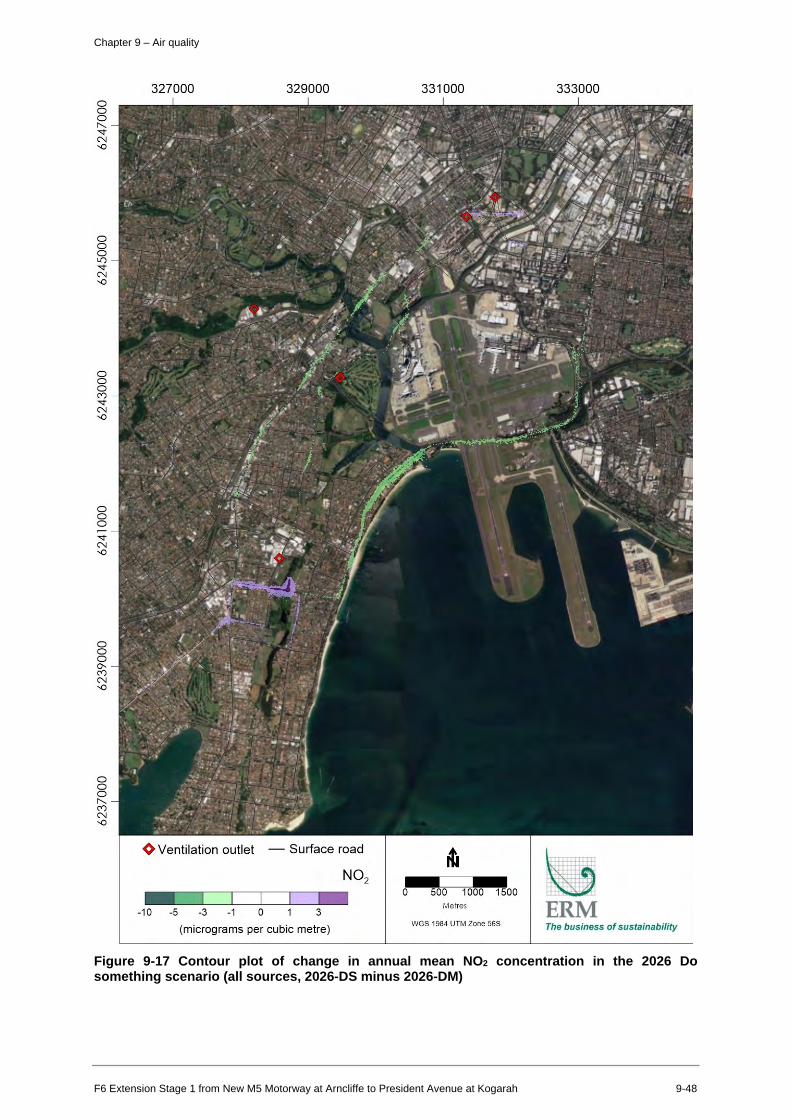
0 0 I.() --.;f" N
'°
0 0 0 CV) --.;f" N
'°
0 0 0
'<I" N
'°
0 0 0 0-(V") N
'°
0 0 0 r--... CV) N
'°
327000 329000
~ Ventilation outlet - Surface road
-10 -5 -3 -1 0 3
(micrograms per cubic metre)
331000 333000
M etres ERM WGS 1984 UTM Zone 56S The business of sustainability
0
Chapter 9 – Air quality
Figure 9-17 Contour plot of change in annual mean NO2 concentration in the 2026 Do something scenario (all sources, 2026-DS minus 2026-DM)
F6 Extension Stage 1 from New M5 Motorway at Arncliffe to President Avenue at Kogarah 9-48

0 0 lf) "'SI' ('J '-0
0 0 0 (')
--s:('J '-0
0 0 0
"'SI' ('J '-0
0 0 0
°' (') ('J '-0
0 0 0 I'-... (') ('J '-0
327000 329000
~ Ventilation outlet - Surface road
-10 -5 -3 -1 0 3
(micrograms per cubic metre)
331000 333000
Metres ERM WGS 1984 UTM Zone 56S The business of sustainability
0
Chapter 9 – Air quality
Figure 9-18 Contour plot of change in annual mean NO2 concentration in the 2036 Do Something scenario (2036-DS minus 2036-DM)
F6 Extension Stage 1 from New M5 Motorway at Arncliffe to President Avenue at Kogarah 9-49
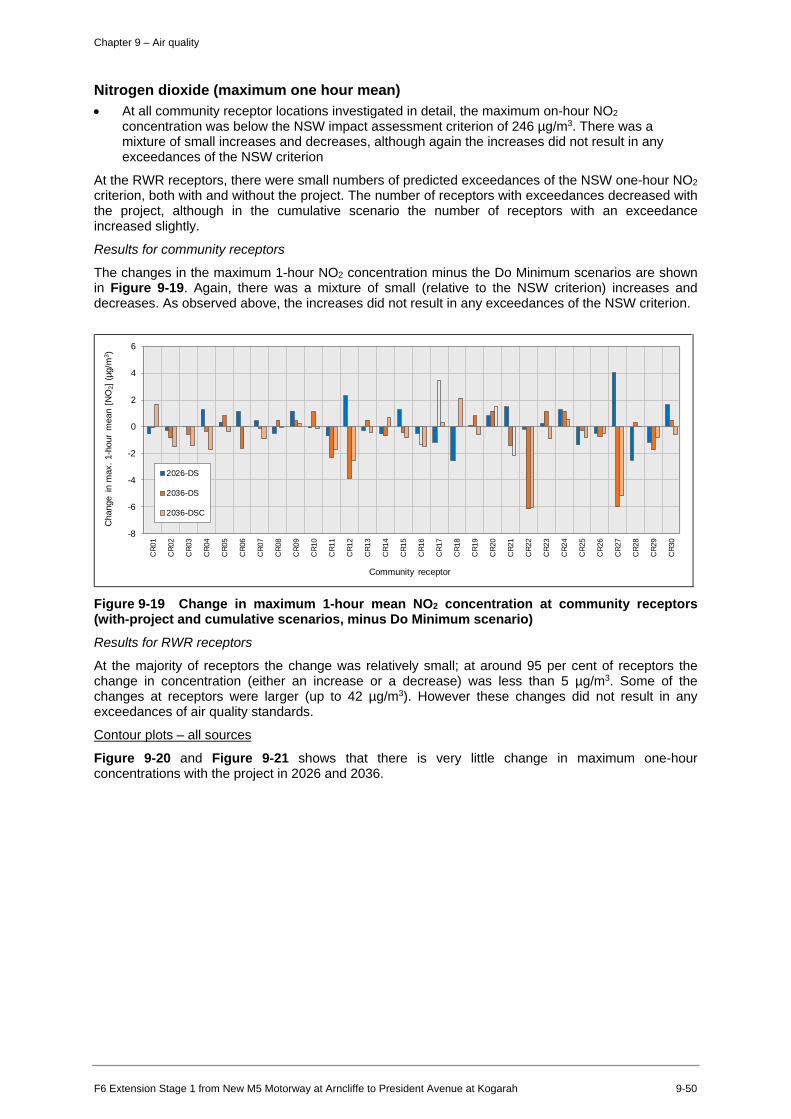
□
Chapter 9 – Air quality
Nitrogen dioxide (maximum one hour mean) • At all community receptor locations investigated in detail, the maximum on-hour NO2
concentration was below the NSW impact assessment criterion of 246 µg/m3. There was a mixture of small increases and decreases, although again the increases did not result in any exceedances of the NSW criterion
At the RWR receptors, there were small numbers of predicted exceedances of the NSW one-hour NO2
criterion, both with and without the project. The number of receptors with exceedances decreased with the project, although in the cumulative scenario the number of receptors with an exceedance increased slightly.
Results for community receptors
The changes in the maximum 1-hour NO2 concentration minus the Do Minimum scenarios are shown in Figure 9-19. Again, there was a mixture of small (relative to the NSW criterion) increases and decreases. As observed above, the increases did not result in any exceedances of the NSW criterion.
-8
-6
-4
-2
0
2
4
6
CR
01
CR
02
CR
03
CR
04
CR
05
CR
06
CR
07
CR
08
CR
09
CR
10
CR
11
CR
12
CR
13
CR
14
CR
15
CR
16
CR
17
CR
18
CR
19
CR
20
CR
21
CR
22
CR
23
CR
24
CR
25
CR
26
CR
27
CR
28
CR
29
CR
30
Cha
nge
in m
ax.
1-ho
ur m
ean
[NO
2 ] (
µg/m
3 )
Community receptor
2026-DS
2036-DS
2036-DSC
Figure 9-19 Change in maximum 1-hour mean NO2 concentration at community receptors (with-project and cumulative scenarios, minus Do Minimum scenario)
Results for RWR receptors
At the majority of receptors the change was relatively small; at around 95 per cent of receptors the change in concentration (either an increase or a decrease) was less than 5 µg/m3. Some of the changes at receptors were larger (up to 42 µg/m3). However these changes did not result in any exceedances of air quality standards.
Contour plots – all sources
Figure 9-20 and Figure 9-21 shows that there is very little change in maximum one-hour concentrations with the project in 2026 and 2036.
F6 Extension Stage 1 from New M5 Motorway at Arncliffe to President Avenue at Kogarah 9-50

0 0 I.() --.;f" N
'°
0 0 0 CV) --.;f" N
'°
0 0 0
'<I" N
'°
0 0 0 0-(V") N
'°
0 0 0 r--... CV) N
'°
327000 329000
~ Ventilation outlet - Surface road
-400 -200 -50 -20 0 20 50
(micrograms per cubic metre)
331000 333000
M etres ERM WGS 1984 UTM Zone 56S The business of sustainability
0
Chapter 9 – Air quality
Figure 9-20 Contour plot of change in maximum one-hour mean NO2 concentration in the 2026 Do Something scenario (all sources, 2026-DS minus 2026-DM)
F6 Extension Stage 1 from New M5 Motorway at Arncliffe to President Avenue at Kogarah 9-51

0 0 lf) "'SI' ('J '-0
0 0 0 (')
--s:('J '-0
0 0 0
"'SI' ('J '-0
0 0 0
°' (') ('J '-0
0 0 0 I'-... (') ('J '-0
327000 329000
~ Ventilation outlet - Surface road
-400 -200 -50 -20 0 20 50
(micrograms per cubic metre)
331000 333000
Metres ERM WGS 1984 UTM Zone 56S The business of sustainability
0
Chapter 9 – Air quality
Figure 9-21 Contour plot of change in maximum one-hour NO2 concentration in the 2036 Do Something scenario (2036-DS minus 2036-DM)
F6 Extension Stage 1 from New M5 Motorway at Arncliffe to President Avenue at Kogarah 9-52
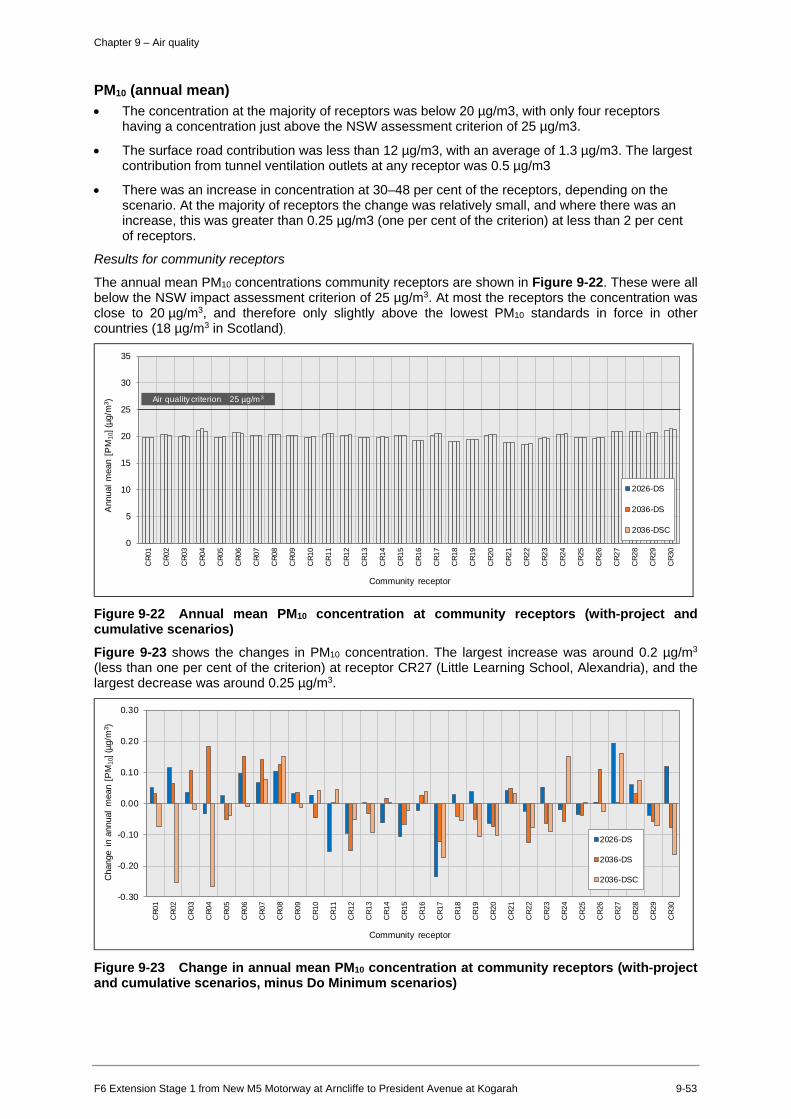
=~ I I
I I I I I
I I I I t ' I
I I I I t • ' I I ■
I ■
I I I I • • ' I I
□
□
Chapter 9 – Air quality
PM10 (annual mean) • The concentration at the majority of receptors was below 20 µg/m3, with only four receptors
having a concentration just above the NSW assessment criterion of 25 µg/m3.
• The surface road contribution was less than 12 µg/m3, with an average of 1.3 µg/m3. The largest contribution from tunnel ventilation outlets at any receptor was 0.5 µg/m3
• There was an increase in concentration at 30–48 per cent of the receptors, depending on the scenario. At the majority of receptors the change was relatively small, and where there was an increase, this was greater than 0.25 µg/m3 (one per cent of the criterion) at less than 2 per cent of receptors.
Results for community receptors
The annual mean PM10 concentrations community receptors are shown in Figure 9-22. These were all below the NSW impact assessment criterion of 25 µg/m3. At most the receptors the concentration was close to 20 µg/m3, and therefore only slightly above the lowest PM10 standards in force in other countries (18 µg/m3 in Scotland).
0
5
10
15
20
25
30
35
CR
01
CR
02
CR
03
CR
04
CR
05
CR
06
CR
07
CR
08
CR
09
CR
10
CR
11
CR
12
CR
13
CR
14
CR
15
CR
16
CR
17
CR
18
CR
19
CR
20
CR
21
CR
22
CR
23
CR
24
CR
25
CR
26
CR
27
CR
28
CR
29
CR
30
Ann
ual
mea
n [P
M10
] (µg
/m3 )
Community receptor
2026-DS
2036-DS
2036-DSC
Air quality criterion 25 µg/m3
Figure 9-22 Annual mean PM10 concentration at community receptors (with-project and cumulative scenarios)
Figure 9-23 shows the changes in PM10 concentration. The largest increase was around 0.2 µg/m3
(less than one per cent of the criterion) at receptor CR27 (Little Learning School, Alexandria), and the largest decrease was around 0.25 µg/m3.
-0.30
-0.20
-0.10
0.00
0.10
0.20
0.30
CR
01
CR
02
CR
03
CR
04
CR
05
CR
06
CR
07
CR
08
CR
09
CR
10
CR
11
CR
12
CR
13
CR
14
CR
15
CR
16
CR
17
CR
18
CR
19
CR
20
CR
21
CR
22
CR
23
CR
24
CR
25
CR
26
CR
27
CR
28
CR
29
CR
30
Cha
nge
in a
nnua
l m
ean
[PM
10] (
µg/m
3 )
Community receptor
2026-DS
2036-DS
2036-DSC
Figure 9-23 Change in annual mean PM10 concentration at community receptors (with-project and cumulative scenarios, minus Do Minimum scenarios)
F6 Extension Stage 1 from New M5 Motorway at Arncliffe to President Avenue at Kogarah 9-53
Chapter 9 – Air quality
Results for RWR receptors
Contour plots – all sources
The contour plots for changes in annual mean PM10 in the 2026-DS and 2036-DSC scenarios aregiven in Figure 9-25 and Figure 9-26. As in the case of NO2, elevated concentrations are evident atthe ramps to the project tunnel at President Avenue.
F6 Extension Stage 1 from New M5 Motorway at Arncliffe to President Avenue at Kogarah 9-54
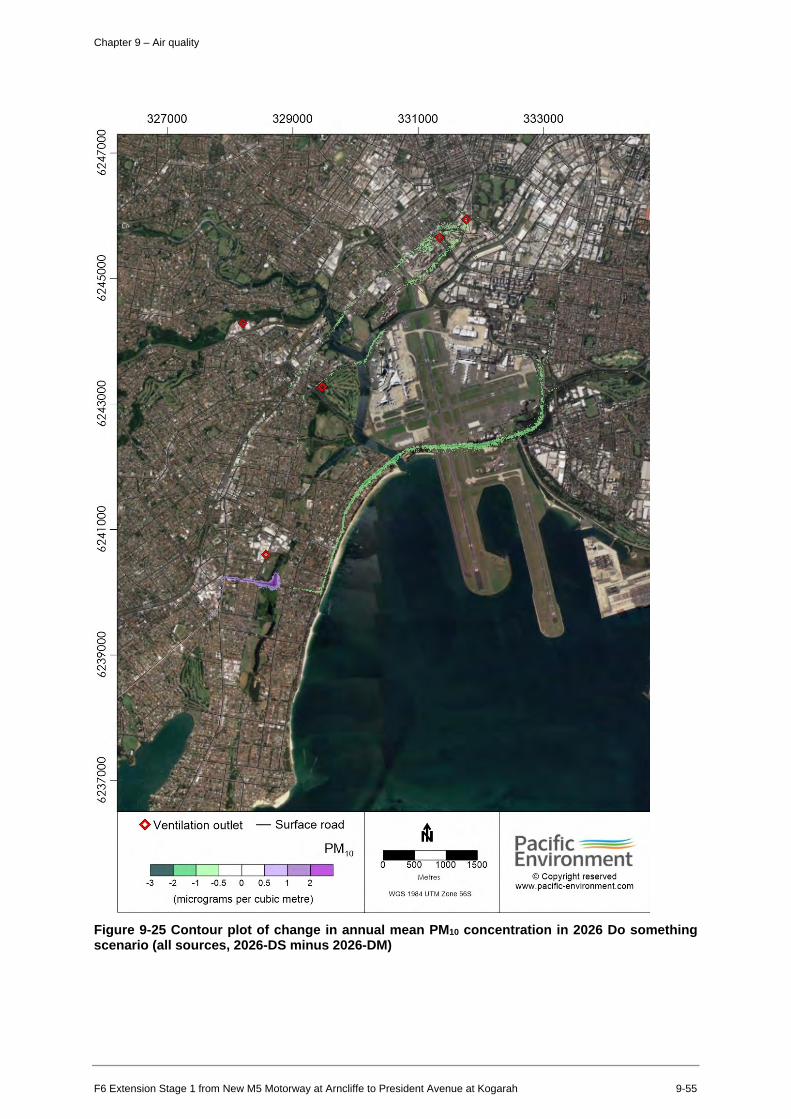
0 0 r---.. '<I" N --0
0 0 0 l/) '<I" N --0
0 0 0 C0 '<I" N --0
0 0 0
'<I" N --0
0 0 0 0-C') N --0
0 0 0 r---.. C0 N --0
327000 329000
~ Ventilation outlet - Surface road
PM10
-3 -2 -1 -0 .5 0 0.5 2
(micrograms per cubic metre)
331000
Metres
WGS 1984 UTM Zone 56S
333000
Pacific Environment
© Copyright reserved www.pacific-environment.com
0
Chapter 9 – Air quality
Figure 9-25 Contour plot of change in annual mean PM10 concentration in 2026 Do something scenario (all sources, 2026-DS minus 2026-DM)
F6 Extension Stage 1 from New M5 Motorway at Arncliffe to President Avenue at Kogarah 9-55
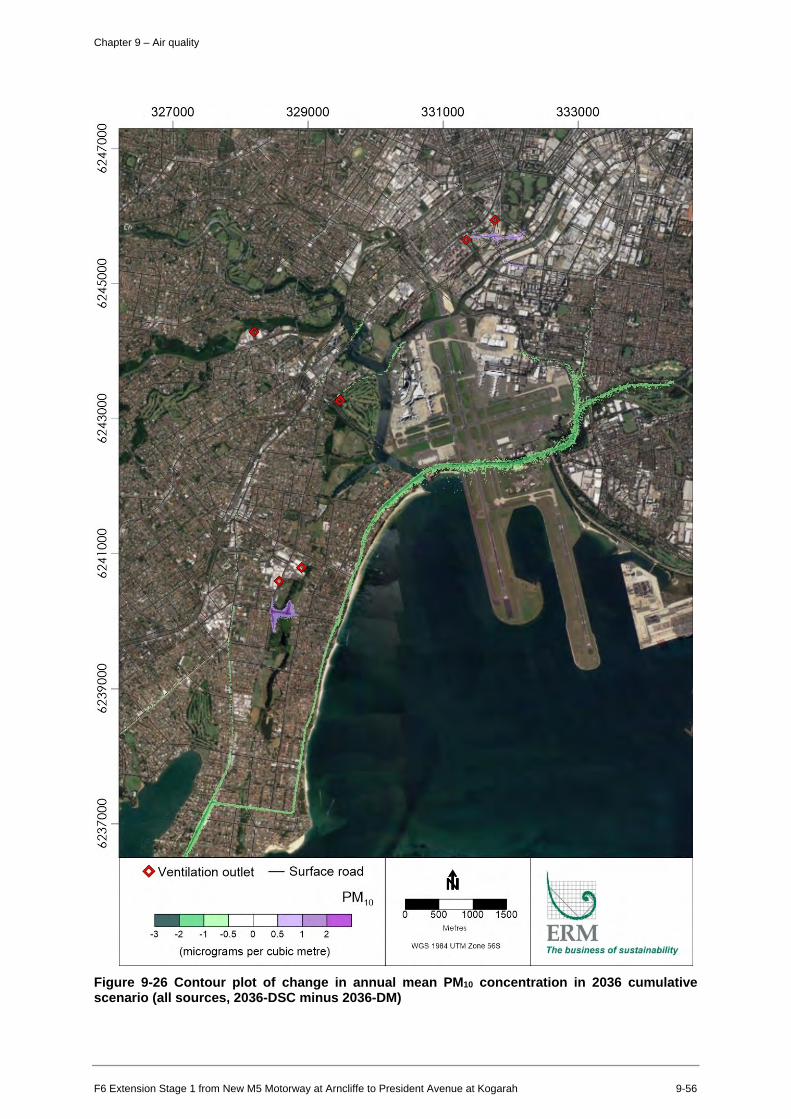
0 0 If) '<I" ('J '-0
0 0 0 (") '<I" ('J '-0
0 0 0
'<I" ('J '-0
0 0 0 0-(") ('J '-0
0 0 0
" (") ('J
'-0
327000
~ Ventilation outlet
-3 -2 -1 -0 .5 0
329000
- Surface road
PM 10
I ™·1 0.5 2
(micrograms per cubic metre)
331000 333000
~ Metres ERM
WGS 1984 UTM Zone 56S The business of sustainability
0
Chapter 9 – Air quality
Figure 9-26 Contour plot of change in annual mean PM10 concentration in 2036 cumulative scenario (all sources, 2036-DSC minus 2036-DM)
F6 Extension Stage 1 from New M5 Motorway at Arncliffe to President Avenue at Kogarah 9-56
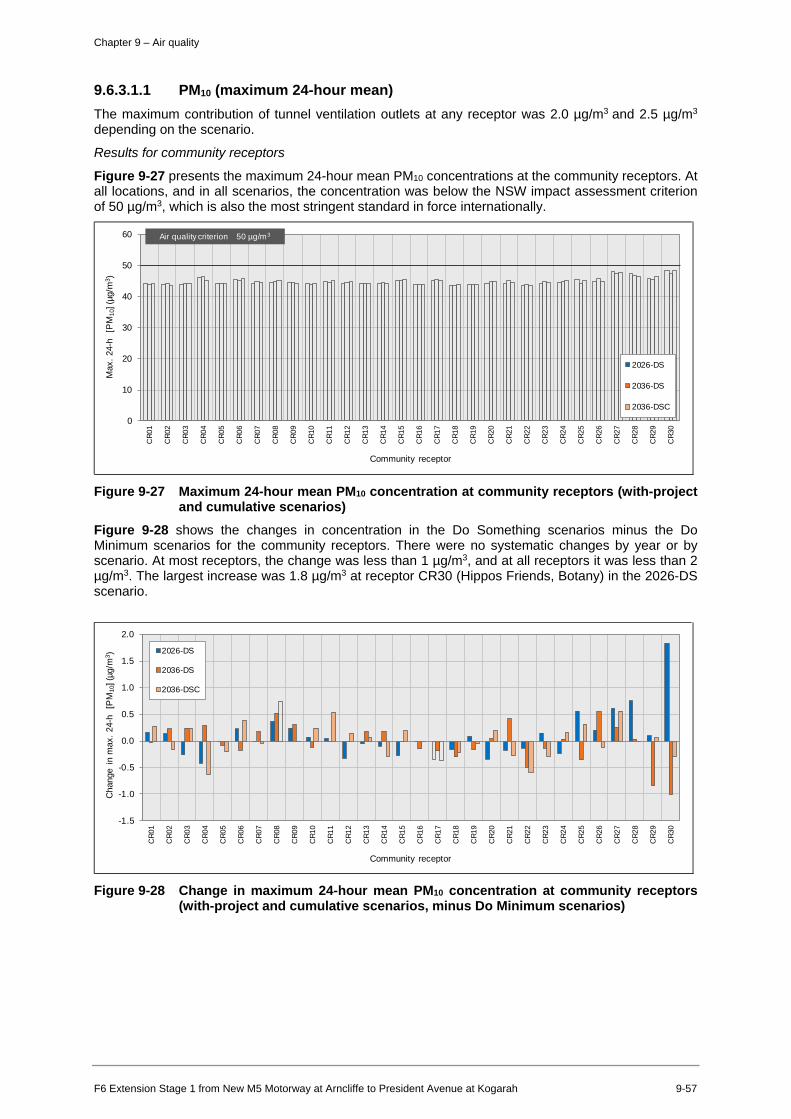
=.......,., I I I I I I I I I I
17 n n {1 h
It It ,, ,, ■
1, 1, I , 1, ■
□
□ l
l l
Chapter 9 – Air quality
9.6.3.1.1 PM10 (maximum 24-hour mean) The maximum contribution of tunnel ventilation outlets at any receptor was 2.0 µg/m3 and 2.5 µg/m3
depending on the scenario.
Results for community receptors
Figure 9-27 presents the maximum 24-hour mean PM10 concentrations at the community receptors. At all locations, and in all scenarios, the concentration was below the NSW impact assessment criterion of 50 µg/m3, which is also the most stringent standard in force internationally.
0
10
20
30
40
50
60
CR
01
CR
02
CR
03
CR
04
CR
05
CR
06
CR
07
CR
08
CR
09
CR
10
CR
11
CR
12
CR
13
CR
14
CR
15
CR
16
CR
17
CR
18
CR
19
CR
20
CR
21
CR
22
CR
23
CR
24
CR
25
CR
26
CR
27
CR
28
CR
29
CR
30
Max
. 24
-h
[PM
10] (
µg/m
3 )
Community receptor
2026-DS
2036-DS
2036-DSC
Air quality criterion 50 µg/m3
Figure 9-27 Maximum 24-hour mean PM10 concentration at community receptors (with-project and cumulative scenarios)
Figure 9-28 shows the changes in concentration in the Do Something scenarios minus the Do Minimum scenarios for the community receptors. There were no systematic changes by year or by scenario. At most receptors, the change was less than 1 µg/m3, and at all receptors it was less than 2 µg/m3. The largest increase was 1.8 µg/m3 at receptor CR30 (Hippos Friends, Botany) in the 2026-DS scenario.
-1.5
-1.0
-0.5
0.0
0.5
1.0
1.5
2.0
CR
01
CR
02
CR
03
CR
04
CR
05
CR
06
CR
07
CR
08
CR
09
CR
10
CR
11
CR
12
CR
13
CR
14
CR
15
CR
16
CR
17
CR
18
CR
19
CR
20
CR
21
CR
22
CR
23
CR
24
CR
25
CR
26
CR
27
CR
28
CR
29
CR
30
Cha
nge
in m
ax.
24-h
[P
M10
] (µg
/m3 )
Community receptor
2026-DS
2036-DS
2036-DSC
Figure 9-28 Change in maximum 24-hour mean PM10 concentration at community receptors (with-project and cumulative scenarios, minus Do Minimum scenarios)
F6 Extension Stage 1 from New M5 Motorway at Arncliffe to President Avenue at Kogarah 9-57
Chapter 9 – Air quality
Results for RWR receptors • The results for the RWR receptors were highly dependent on the assumption for the background
concentration. Because this was quite high (43.6 µg/m3), the total concentration in the with-project and cumulative scenarios was above the NSW impact assessment criterion of 50µg/m3 at between 8 and 11 per cent of receptors. However, the proportion of receptors with a concentration above the criterion decreased slightly as a result of the project
• There was an increase in concentration between 29 and 45 per cent of receptors, depending on the scenario. There was an increase of 0.50 µg/m3 (one per cent of the criterion) at four to eight per cent of receptors, depending on the scenario.
Contour plots – all sources
The contour plots for changes in maximum 24-hour average PM10 in the 2026-D5 and 2036-DS scenarios are given in Figure 9-29 and Figure 9-30.
F6 Extension Stage 1 from New M5 Motorway at Arncliffe to President Avenue at Kogarah 9-58

0 0 I.() --.;f" N
'°
0 0 0 CV) --.;f" N
'°
0 0 0
'<I" N
'°
0 0 0 0-(V") N
'°
0 0 0 r--... CV) N
'°
327000 329000
~ Ventilation outlet - Surface road
PM 10
I -20 -10 -6 -4 -2 0 2 4
(micrograms per cubic metre)
331000 333000
M etres ERM WGS 1984 UTM Zone 56S The business of sustainability
0
Chapter 9 – Air quality
Figure 9-29 Contour plot of change in maximum 24-hour mean PM10 concentration in 2026 Do Something scenario (all sources, 2026-DS minus 2026-DM)
F6 Extension Stage 1 from New M5 Motorway at Arncliffe to President Avenue at Kogarah 9-59

0 0 lf) "'SI' ('J '-0
0 0 0 (')
--s:('J '-0
0 0 0
"'SI' ('J '-0
0 0 0
°' (') ('J '-0
0 0 0 I'-... (') ('J '-0
327000 329000
~ Ventilation outlet - Surface road
-20 -10 -6 -4 -2 0 2 4
(micrograms per cubic metre)
331000 333000
Metres ERM WGS 1984 UTM Zone 56S The business of sustainability
0
Chapter 9 – Air quality
Figure 9-30 Contour plot of change in maximum 24-hour mean PM10 concentration in the 2036 Do Something scenario (2036-DS minus 2036-DM)
F6 Extension Stage 1 from New M5 Motorway at Arncliffe to President Avenue at Kogarah 9-60
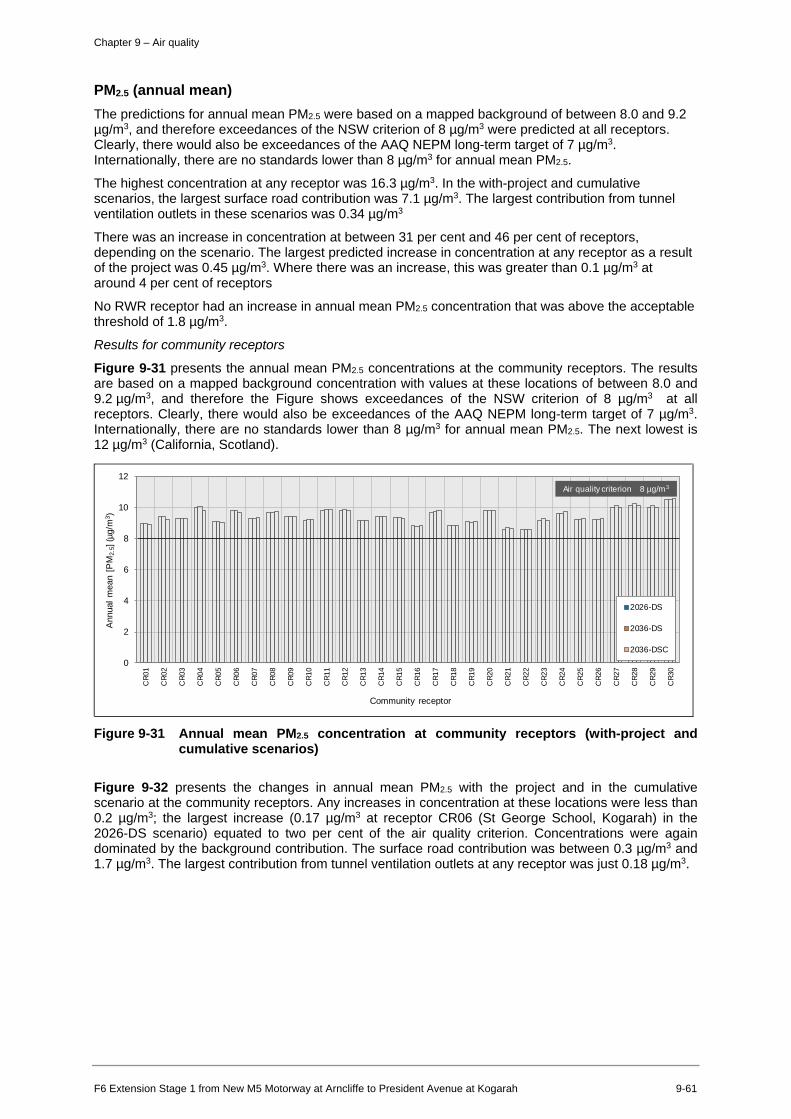
=I I
( ~ I I I I
I j n
..I...
II m l .... ... .. ... . ... . ... .... ... .. ... . ... .... . ... .... ... . ... .... ... ... ..... . ...
11 . ... . ... .... ... . ... ... ... .....
II I 1 1
■
■
□ l I 11
Chapter 9 – Air quality
PM2.5 (annual mean) The predictions for annual mean PM2.5 were based on a mapped background of between 8.0 and 9.2 µg/m3, and therefore exceedances of the NSW criterion of 8 µg/m3 were predicted at all receptors. Clearly, there would also be exceedances of the AAQ NEPM long-term target of 7 µg/m3. Internationally, there are no standards lower than 8 µg/m3 for annual mean PM2.5.
The highest concentration at any receptor was 16.3 µg/m3. In the with-project and cumulative scenarios, the largest surface road contribution was 7.1 µg/m3. The largest contribution from tunnel ventilation outlets in these scenarios was 0.34 µg/m3
There was an increase in concentration at between 31 per cent and 46 per cent of receptors, depending on the scenario. The largest predicted increase in concentration at any receptor as a result of the project was 0.45 µg/m3. Where there was an increase, this was greater than 0.1 µg/m3 at around 4 per cent of receptors
No RWR receptor had an increase in annual mean PM2.5 concentration that was above the acceptable threshold of 1.8 µg/m3.
Results for community receptors
Figure 9-31 presents the annual mean PM2.5 concentrations at the community receptors. The results are based on a mapped background concentration with values at these locations of between 8.0 and 9.2 µg/m3, and therefore the Figure shows exceedances of the NSW criterion of 8 µg/m3 at all receptors. Clearly, there would also be exceedances of the AAQ NEPM long-term target of 7 µg/m3. Internationally, there are no standards lower than 8 µg/m3 for annual mean PM2.5. The next lowest is 12 µg/m3 (California, Scotland).
0
2
4
6
8
10
12
CR
01
CR
02
CR
03
CR
04
CR
05
CR
06
CR
07
CR
08
CR
09
CR
10
CR
11
CR
12
CR
13
CR
14
CR
15
CR
16
CR
17
CR
18
CR
19
CR
20
CR
21
CR
22
CR
23
CR
24
CR
25
CR
26
CR
27
CR
28
CR
29
CR
30
Ann
ual
mea
n [P
M2.
5] (µ
g/m
3 )
Community receptor
2026-DS
2036-DS
2036-DSC
Air quality criterion 8 µg/m3
Figure 9-31 Annual mean PM2.5 concentration at community receptors (with-project and cumulative scenarios)
Figure 9-32 presents the changes in annual mean PM2.5 with the project and in the cumulative scenario at the community receptors. Any increases in concentration at these locations were less than 0.2 µg/m3; the largest increase (0.17 µg/m3 at receptor CR06 (St George School, Kogarah) in the 2026-DS scenario) equated to two per cent of the air quality criterion. Concentrations were again dominated by the background contribution. The surface road contribution was between 0.3 µg/m3 and 1.7 µg/m3. The largest contribution from tunnel ventilation outlets at any receptor was just 0.18 µg/m3.
F6 Extension Stage 1 from New M5 Motorway at Arncliffe to President Avenue at Kogarah 9-61
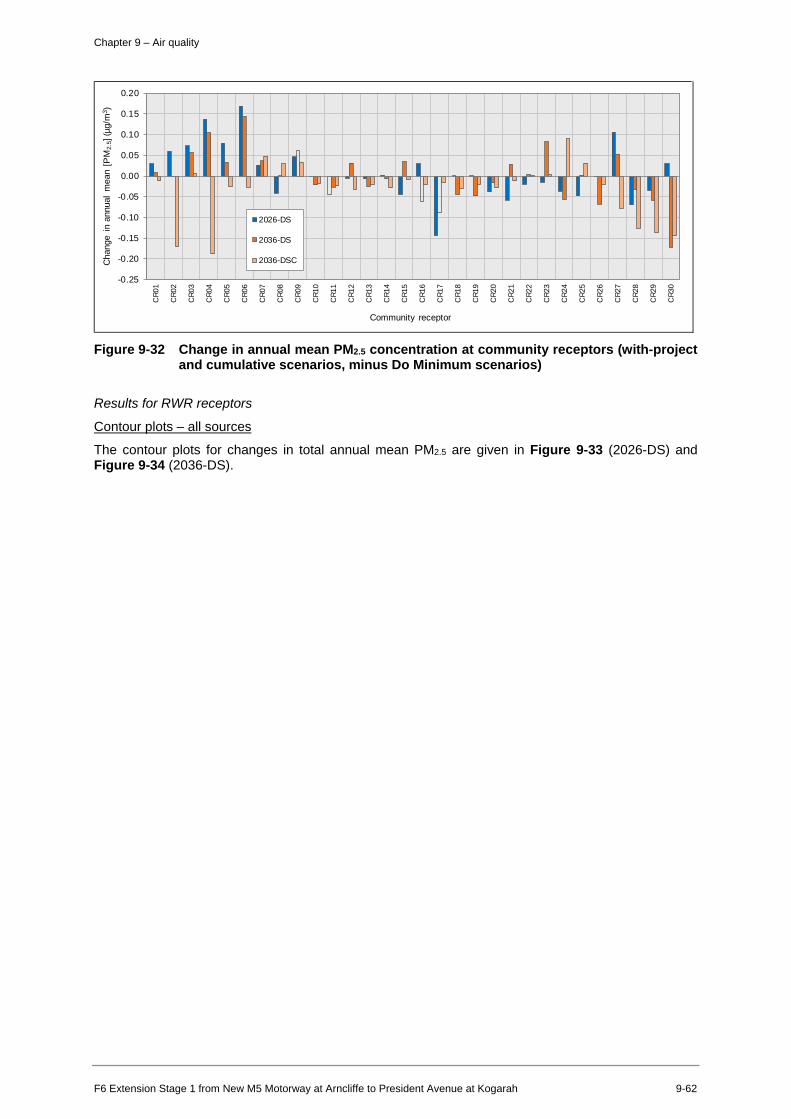
□
Chapter 9 – Air quality
-0.25
-0.20
-0.15
-0.10
-0.05
0.00
0.05
0.10
0.15
0.20
CR
01
CR
02
CR
03
CR
04
CR
05
CR
06
CR
07
CR
08
CR
09
CR
10
CR
11
CR
12
CR
13
CR
14
CR
15
CR
16
CR
17
CR
18
CR
19
CR
20
CR
21
CR
22
CR
23
CR
24
CR
25
CR
26
CR
27
CR
28
CR
29
CR
30
Cha
nge
in a
nnua
l m
ean
[PM
2.5]
(µg/
m3 )
Community receptor
2026-DS
2036-DS
2036-DSC
Figure 9-32 Change in annual mean PM2.5 concentration at community receptors (with-project and cumulative scenarios, minus Do Minimum scenarios)
Results for RWR receptors
Contour plots – all sources
The contour plots for changes in total annual mean PM2.5 are given in Figure 9-33 (2026-DS) and Figure 9-34 (2036-DS).
F6 Extension Stage 1 from New M5 Motorway at Arncliffe to President Avenue at Kogarah 9-62

0 0 If) "'SI' ('J '-0
0 0 0 C'0 "'SI' ('J '-0
0 0 0
"'SI' ('J '-0
0 0 0 0-(") ('J '-0
0 0 0 I'-... C'0 ('J
'-0
327000 329000
~ Ventilation outlet - Surface road
-4 -2 -1 -0.8 -0.2 0 0.2 0.8 1.8
(micrograms per cubic metre)
331000 333000
~ Metres ERM
WGS 1984 UTM Zone 56S The business of sustainability
0
Chapter 9 – Air quality
Figure 9-33 Contour plot of change in annual mean PM2.5 concentration in 2026 Do Something scenario (all sources, 2026-DS minus 2026-DM)
F6 Extension Stage 1 from New M5 Motorway at Arncliffe to President Avenue at Kogarah 9-63

0 0 I.() --.;f" N
'°
0 0 0 CV) --.;f" N
'°
0 0 0
'<I" N
'°
0 0 0 0-(V") N
'°
0 0 0 r--... CV) N
'°
327000 329000
~ Ventilation outlet - Surface road
PM2s
-4 -2 -1 -0.8 -0.2 0 0.2 0.8 1.8
(micrograms per cubic metre)
331000
M etres
WGS 1984 UTM Zone 56S
333000
Pacific Environment
© Copyrig ht reserved www.pacific-environment.com
0
Chapter 9 – Air quality
Figure 9-34 Contour plot of change in annual mean PM2.5 concentration in 2036 Do Something scenario (all sources, 2036-DS minus 2036-DM)
F6 Extension Stage 1 from New M5 Motorway at Arncliffe to President Avenue at Kogarah 9-64
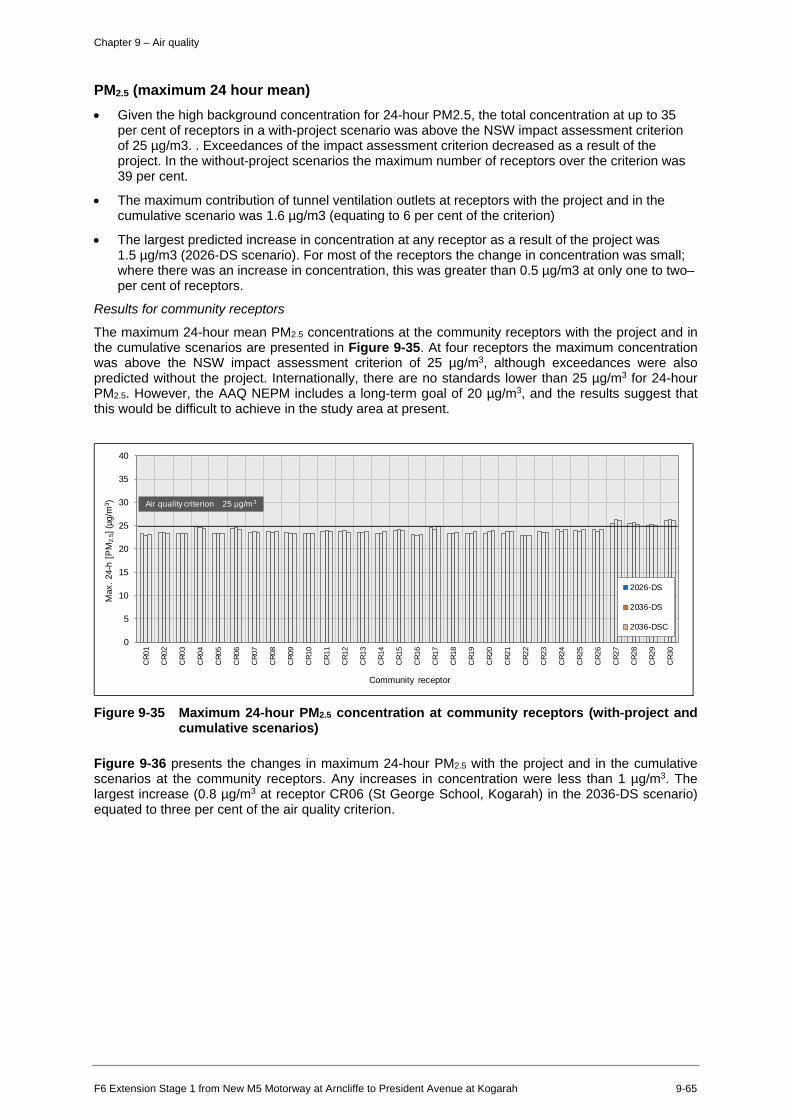
=
~ ~ I ...................... .... .... . .. ...
I<
I I<
■
■
□ - - -
Chapter 9 – Air quality
PM2.5 (maximum 24 hour mean) • Given the high background concentration for 24-hour PM2.5, the total concentration at up to 35
per cent of receptors in a with-project scenario was above the NSW impact assessment criterion of 25 µg/m3. . Exceedances of the impact assessment criterion decreased as a result of the project. In the without-project scenarios the maximum number of receptors over the criterion was 39 per cent.
• The maximum contribution of tunnel ventilation outlets at receptors with the project and in the cumulative scenario was 1.6 µg/m3 (equating to 6 per cent of the criterion)
• The largest predicted increase in concentration at any receptor as a result of the project was 1.5 µg/m3 (2026-DS scenario). For most of the receptors the change in concentration was small; where there was an increase in concentration, this was greater than 0.5 µg/m3 at only one to two– per cent of receptors.
Results for community receptors
The maximum 24-hour mean PM2.5 concentrations at the community receptors with the project and in the cumulative scenarios are presented in Figure 9-35. At four receptors the maximum concentration was above the NSW impact assessment criterion of 25 µg/m3, although exceedances were also predicted without the project. Internationally, there are no standards lower than 25 µg/m3 for 24-hour PM2.5. However, the AAQ NEPM includes a long-term goal of 20 µg/m3, and the results suggest that this would be difficult to achieve in the study area at present.
0
5
10
15
20
25
30
35
40
CR
01
CR
02
CR
03
CR
04
CR
05
CR
06
CR
07
CR
08
CR
09
CR
10
CR
11
CR
12
CR
13
CR
14
CR
15
CR
16
CR
17
CR
18
CR
19
CR
20
CR
21
CR
22
CR
23
CR
24
CR
25
CR
26
CR
27
CR
28
CR
29
CR
30
Max
. 24
-h [
PM
2.5]
(µg/
m3 )
Community receptor
2026-DS
2036-DS
2036-DSC
Air quality criterion 25 µg/m3
Figure 9-35 Maximum 24-hour PM2.5 concentration at community receptors (with-project and cumulative scenarios)
Figure 9-36 presents the changes in maximum 24-hour PM2.5 with the project and in the cumulative scenarios at the community receptors. Any increases in concentration were less than 1 µg/m3. The largest increase (0.8 µg/m3 at receptor CR06 (St George School, Kogarah) in the 2036-DS scenario) equated to three per cent of the air quality criterion.
F6 Extension Stage 1 from New M5 Motorway at Arncliffe to President Avenue at Kogarah 9-65
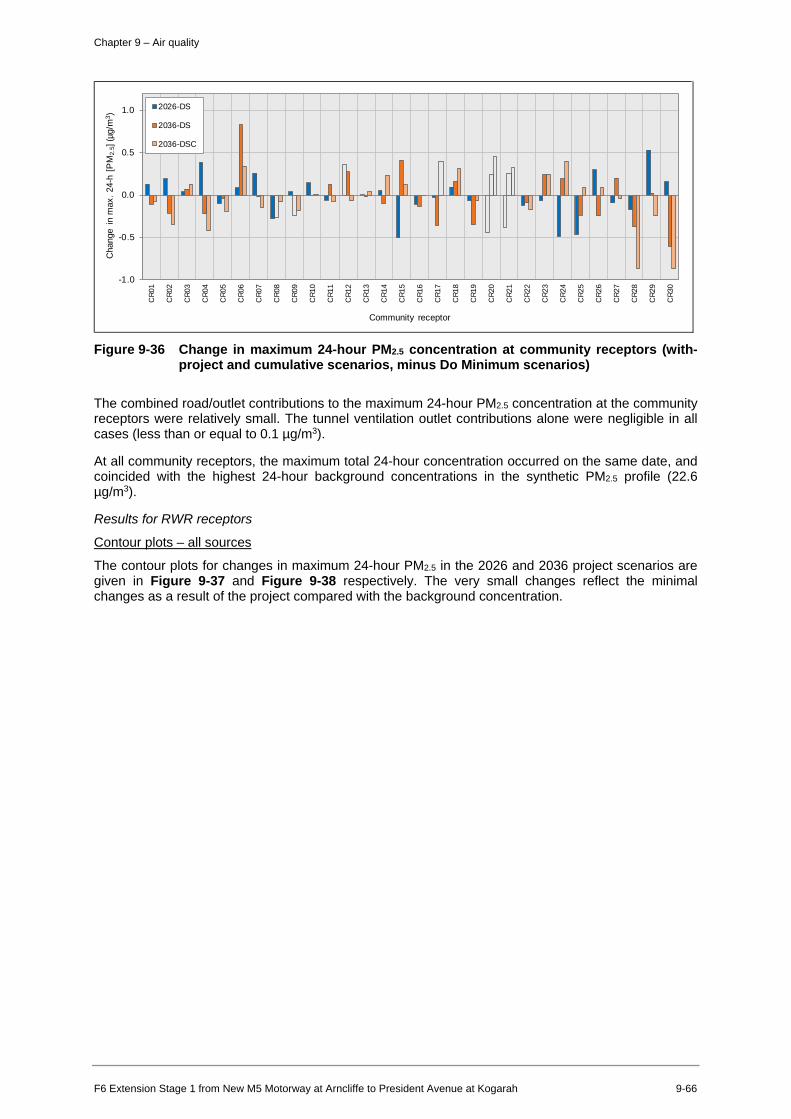
□ 1
Chapter 9 – Air quality
-1.0
-0.5
0.0
0.5
1.0
CR
01
CR
02
CR
03
CR
04
CR
05
CR
06
CR
07
CR
08
CR
09
CR
10
CR
11
CR
12
CR
13
CR
14
CR
15
CR
16
CR
17
CR
18
CR
19
CR
20
CR
21
CR
22
CR
23
CR
24
CR
25
CR
26
CR
27
CR
28
CR
29
CR
30
Cha
nge
in m
ax.
24-h
[P
M2.
5] (µ
g/m
3 )
Community receptor
2026-DS
2036-DS
2036-DSC
Figure 9-36 Change in maximum 24-hour PM2.5 concentration at community receptors (with-project and cumulative scenarios, minus Do Minimum scenarios)
The combined road/outlet contributions to the maximum 24-hour PM2.5 concentration at the community receptors were relatively small. The tunnel ventilation outlet contributions alone were negligible in all cases (less than or equal to 0.1 µg/m3).
At all community receptors, the maximum total 24-hour concentration occurred on the same date, and coincided with the highest 24-hour background concentrations in the synthetic PM2.5 profile (22.6 µg/m3).
Results for RWR receptors
Contour plots – all sources
The contour plots for changes in maximum 24-hour PM2.5 in the 2026 and 2036 project scenarios are given in Figure 9-37 and Figure 9-38 respectively. The very small changes reflect the minimal changes as a result of the project compared with the background concentration.
F6 Extension Stage 1 from New M5 Motorway at Arncliffe to President Avenue at Kogarah 9-66

0 0 I.() --.;f" N
'°
0 0 0 CV) --.;f" N
'°
0 0 0
'<I" N
'°
0 0 0 0-(V") N
'°
0 0 0 r--... CV) N
'°
327000 329000
~ Ventilation outlet - Surface road
-12 -9 -6 -3 -1.5 0 1.5 3
(micrograms per cubic metre)
331000 333000
M etres ERM WGS 1984 UTM Zone 56S The business of sustainability
0
Chapter 9 – Air quality
Figure 9-37 Contour plot of change in maximum 24-hour mean PM2.5 concentration in 2026 Do Something scenario (all sources, 2026-DS minus 2026-DM)
F6 Extension Stage 1 from New M5 Motorway at Arncliffe to President Avenue at Kogarah 9-67
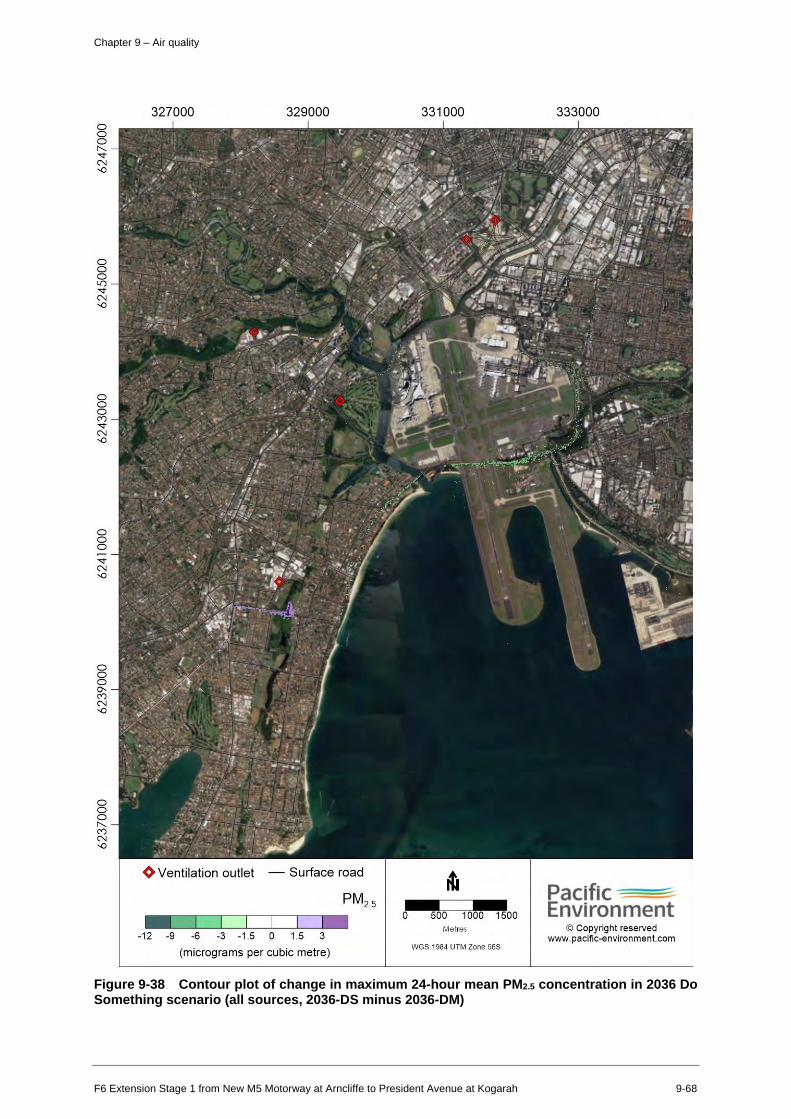
0 0 LI) --s:N --0
0 0 0 C'0 --s:N --0
0 0 0
--s:N --0
0 0 0 0-C") N --0
0 0 0 I'-... C'0 N --0
327000 329000
~ Ventilation outlet - Surface road
-12 -9 -6 -3 -1 .5 0 1.5 3
(micrograms per cubic metre)
331000
M e tres
WGS 1984 UTM Zone 56S
333000
Pacific Environment
© Copyright reserved www.pacific-environment.com
0
Chapter 9 – Air quality
Figure 9-38 Contour plot of change in maximum 24-hour mean PM2.5 concentration in 2036 Do Something scenario (all sources, 2036-DS minus 2036-DM)
F6 Extension Stage 1 from New M5 Motorway at Arncliffe to President Avenue at Kogarah 9-68
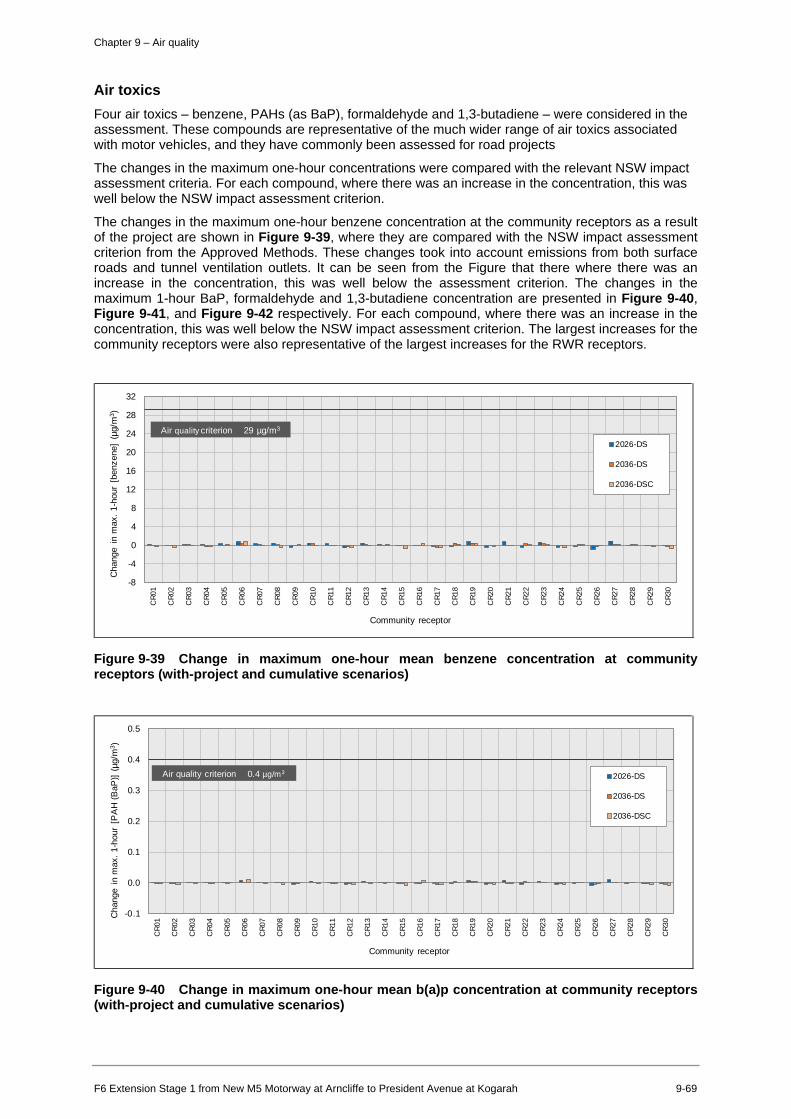
=
0.5
Cha
nge
in m
ax.
1-ho
ur [
PA
H (
BaP
)] (
µg/m
3 )
0.4
0.3
0.2
0.1
0.0
-0.1
Air quality criterion 0.4 µg/m3 2026-DS
20
20
36-D
36-D
S
SC
CR
01
CR
02
CR
03
CR
04
CR
05
CR
06
CR
07
CR
08
CR
09
CR
10
CR
11
CR
12
CR
13
CR
14
CR
15
CR
16
CR
17
CR
18
CR
19
CR
20
CR
21
CR
22
CR
23
CR
24
CR
25
CR
26
CR
27
CR
28
CR
29
CR
30
Community receptor
Figure 9-40 Change in maximum one-hour mean b(a)p concentration at community receptors (with-project and cumulative scenarios)
=
Chapter 9 – Air quality
Air toxics Four air toxics – benzene, PAHs (as BaP), formaldehyde and 1,3-butadiene – were considered in the assessment. These compounds are representative of the much wider range of air toxics associated with motor vehicles, and they have commonly been assessed for road projects
The changes in the maximum one-hour concentrations were compared with the relevant NSW impact assessment criteria. For each compound, where there was an increase in the concentration, this was well below the NSW impact assessment criterion.
The changes in the maximum one-hour benzene concentration at the community receptors as a result of the project are shown in Figure 9-39, where they are compared with the NSW impact assessment criterion from the Approved Methods. These changes took into account emissions from both surface roads and tunnel ventilation outlets. It can be seen from the Figure that there where there was an increase in the concentration, this was well below the assessment criterion. The changes in the maximum 1-hour BaP, formaldehyde and 1,3-butadiene concentration are presented in Figure 9-40, Figure 9-41, and Figure 9-42 respectively. For each compound, where there was an increase in the concentration, this was well below the NSW impact assessment criterion. The largest increases for the community receptors were also representative of the largest increases for the RWR receptors.
-8
-4
0
4
8
12
16
20
24
28
32
CR
01
CR
02
CR
03
CR
04
CR
05
CR
06
CR
07
CR
08
CR
09
CR
10
CR
11
CR
12
CR
13
CR
14
CR
15
CR
16
CR
17
CR
18
CR
19
CR
20
CR
21
CR
22
CR
23
CR
24
CR
25
CR
26
CR
27
CR
28
CR
29
CR
30
Cha
nge
in m
ax.
1-ho
ur [
benz
ene]
(µg
/m3 )
Community receptor
2026-DS
2036-DS
2036-DSC
Air quality criterion 29 µg/m3
Figure 9-39 Change in maximum one-hour mean benzene concentration at community receptors (with-project and cumulative scenarios)
F6 Extension Stage 1 from New M5 Motorway at Arncliffe to President Avenue at Kogarah 9-69
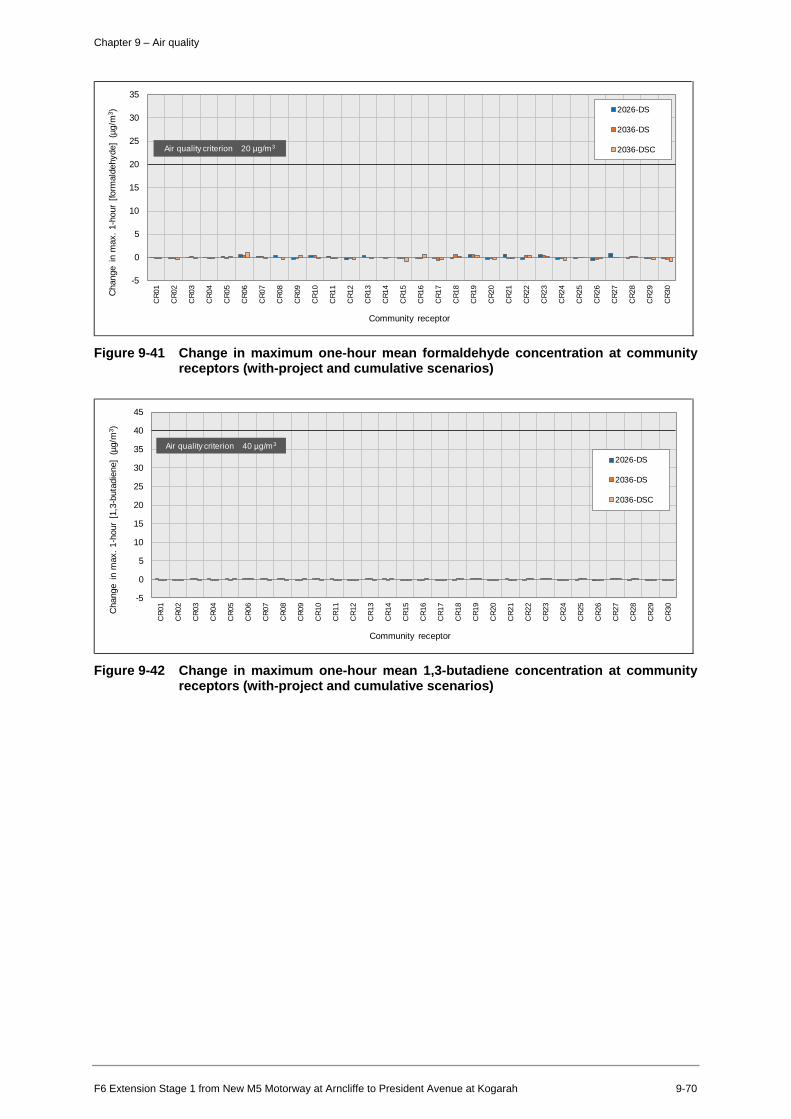
=
=
□
I I
Chapter 9 – Air quality
-5
0
5
10
15
20
25
30
35
CR
01
CR
02
CR
03
CR
04
CR
05
CR
06
CR
07
CR
08
CR
09
CR
10
CR
11
CR
12
CR
13
CR
14
CR
15
CR
16
CR
17
CR
18
CR
19
CR
20
CR
21
CR
22
CR
23
CR
24
CR
25
CR
26
CR
27
CR
28
CR
29
CR
30
Cha
nge
in m
ax.
1-ho
ur [
form
alde
hyde
] (µ
g/m
3 )
Community receptor
2026-DS
2036-DS
2036-DSC Air quality criterion 20 µg/m3
Figure 9-41 Change in maximum one-hour mean formaldehyde concentration at community receptors (with-project and cumulative scenarios)
-5
0
5
10
15
20
25
30
35
40
45
CR
01
CR
02
CR
03
CR
04
CR
05
CR
06
CR
07
CR
08
CR
09
CR
10
CR
11
CR
12
CR
13
CR
14
CR
15
CR
16
CR
17
CR
18
CR
19
CR
20
CR
21
CR
22
CR
23
CR
24
CR
25
CR
26
CR
27
CR
28
CR
29
CR
30
Cha
nge
in m
ax.
1-ho
ur [
1,3-
buta
dien
e]
(µg/
m3 )
Community receptor
2026-DS
2036-DS
2036-DSC
Air quality criterion 40 µg/m3
Figure 9-42 Change in maximum one-hour mean 1,3-butadiene concentration at community receptors (with-project and cumulative scenarios)
F6 Extension Stage 1 from New M5 Motorway at Arncliffe to President Avenue at Kogarah 9-70
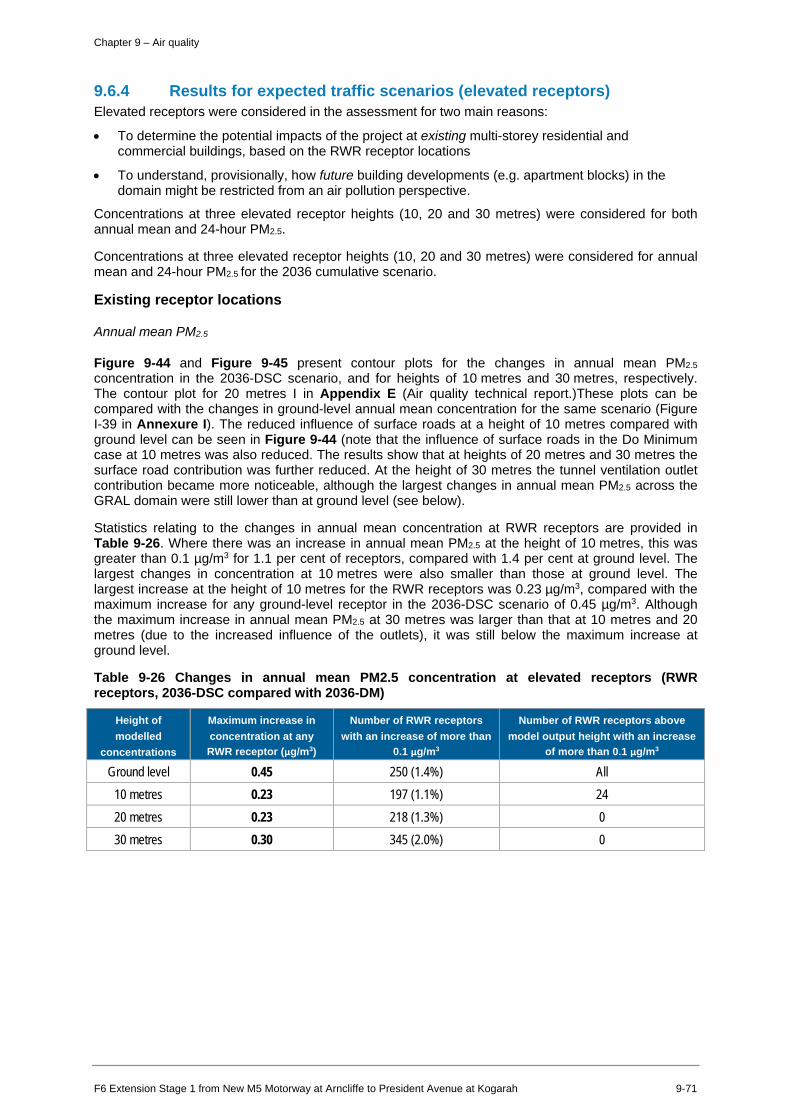
Chapter 9 – Air quality
9.6.4 Results for expected traffic scenarios (elevated receptors) Elevated receptors were considered in the assessment for two main reasons:
• To determine the potential impacts of the project at existing multi-storey residential and commercial buildings, based on the RWR receptor locations
• To understand, provisionally, how future building developments (e.g. apartment blocks) in the domain might be restricted from an air pollution perspective.
Concentrations at three elevated receptor heights (10, 20 and 30 metres) were considered for both annual mean and 24-hour PM2.5.
Concentrations at three elevated receptor heights (10, 20 and 30 metres) were considered for annual mean and 24-hour PM2.5 for the 2036 cumulative scenario.
Existing receptor locations
Annual mean PM2.5
Figure 9-44 and Figure 9-45 present contour plots for the changes in annual mean PM2.5
concentration in the 2036-DSC scenario, and for heights of 10 metres and 30 metres, respectively. The contour plot for 20 metres I in Appendix E (Air quality technical report.)These plots can be compared with the changes in ground-level annual mean concentration for the same scenario (Figure I-39 in Annexure I). The reduced influence of surface roads at a height of 10 metres compared with ground level can be seen in Figure 9-44 (note that the influence of surface roads in the Do Minimum case at 10 metres was also reduced. The results show that at heights of 20 metres and 30 metres the surface road contribution was further reduced. At the height of 30 metres the tunnel ventilation outlet contribution became more noticeable, although the largest changes in annual mean PM2.5 across the GRAL domain were still lower than at ground level (see below).
Statistics relating to the changes in annual mean concentration at RWR receptors are provided in Table 9-26. Where there was an increase in annual mean PM2.5 at the height of 10 metres, this was greater than 0.1 µg/m3 for 1.1 per cent of receptors, compared with 1.4 per cent at ground level. The largest changes in concentration at 10 metres were also smaller than those at ground level. The largest increase at the height of 10 metres for the RWR receptors was 0.23 µg/m3, compared with the maximum increase for any ground-level receptor in the 2036-DSC scenario of 0.45 µg/m3. Although the maximum increase in annual mean PM2.5 at 30 metres was larger than that at 10 metres and 20 metres (due to the increased influence of the outlets), it was still below the maximum increase at ground level.
Table 9-26 Changes in annual mean PM2.5 concentration at elevated receptors (RWR receptors, 2036-DSC compared with 2036-DM)
Height of modelled
concentrations
Maximum increase in concentration at any RWR receptor (µg/m3)
Number of RWR receptors with an increase of more than
0.1 µg/m3
Number of RWR receptors above model output height with an increase
of more than 0.1 µg/m3
Ground level 0.45 250 (1.4%) All 10 metres 0.23 197 (1.1%) 24 20 metres 0.23 218 (1.3%) 0 30 metres 0.30 345 (2.0%) 0
F6 Extension Stage 1 from New M5 Motorway at Arncliffe to President Avenue at Kogarah 9-71
Chapter 9 – Air quality
It should be noted that, for the 10, 20 and 30 metre outputs, it was not necessarily the case that there were existing buildings at these heights at the RWR receptor locations. It should be noted that it was not necessarily the case that there are existing buildings at these heights at the RWR receptor locations (see Chapter 14 (Property and land use) for description of the building height restrictions in the areas potentially affected by the ventilation outlets).
It can be seen from the last column of Table 9-26 that none of the receptors with an increase in annual mean PM2.5 of more than 0.1 µg/m3 had a height of more than 20 metres.
The results indicate that, for all RWR receptor locations, and assuming no further construction at those locations, the changes in annual mean PM2.5 concentration at heights of up to 30 metres above ground level are acceptable (i.e. lower than at ground level, and well below the criterion for an increase in PM2.5 of 1.8 µg/m3).
The reduced influence of surface roads and portals at a receptor height of 10 metres compared with ground level can be seen in Figure 9-43 (note that the influence of surface roads in the Do Minimum case at 10 metres was also reduced). For example, where there was an increase in annual mean PM2.5 at the height of 10 metres, this was greater than 0.1 µg/m3 for 1.1 per cent of receptors, compared with 1.4 per cent at ground level. The largest changes in concentration at 10 metres were also smaller than those at ground level. The largest increase at the height of 10 metres for the RWR receptors was 0.24 µg/m3, which can be compared with the maximum increase for any ground-level receptor in the 2036-DSC scenario of 0.45 µg/m3.
The contour plot showing the change in concentrations of annual mean PM2.5 at 30 metres is shown in Figure 9-44.
F6 Extension Stage 1 from New M5 Motorway at Arncliffe to President Avenue at Kogarah 9-72

0 0 lf) "'SI' ('J '-0
0 0 0 (')
--s:('J '-0
0 0 0
"'SI' ('J '-0
0 0 0
°' (') ('J '-0
0 0 0 I'-... (') ('J '-0
327000 329000
~ Ventilation outlet - Surface road
-10 -2 -1 -0.5 -0.2 0 0.1 0.18 1.8
(micrograms per cubic metre)
331000 333000
y Metres ERM
WGS 1984 UTM Zone 56S The business of sustainability
0
Chapter 9 – Air quality
Figure 9-43 Contour plot of change in annual mean PM2.5 concentration (2036-DSC minus 2036-DM, 10 metre receptor height)
F6 Extension Stage 1 from New M5 Motorway at Arncliffe to President Avenue at Kogarah 9-73

0 0 lf) "'SI' ('J '-0
0 0 0 (')
--s:('J '-0
0 0 0
"'SI' ('J '-0
0 0 0
°' (') ('J '-0
0 0 0 I'-... (') ('J '-0
327000 329000
~ Ventilation outlet - Surface road
PM2s __ ___j__[__j___L_J_..J.__L___J1
-10 -2 -1 -0 .5 -0 .2 0 0.1 0.18 1.8
(micrograms per cubic metre)
331000 333000
Metres ERM WGS 1984 UTM Zone 56S The business of sustainability
0
Chapter 9 – Air quality
Figure 9-44 Contour plot of change in annual mean PM2.5 concentration (2036-DSC minus 2036-DM, 30 metre receptor height)
F6 Extension Stage 1 from New M5 Motorway at Arncliffe to President Avenue at Kogarah 9-74
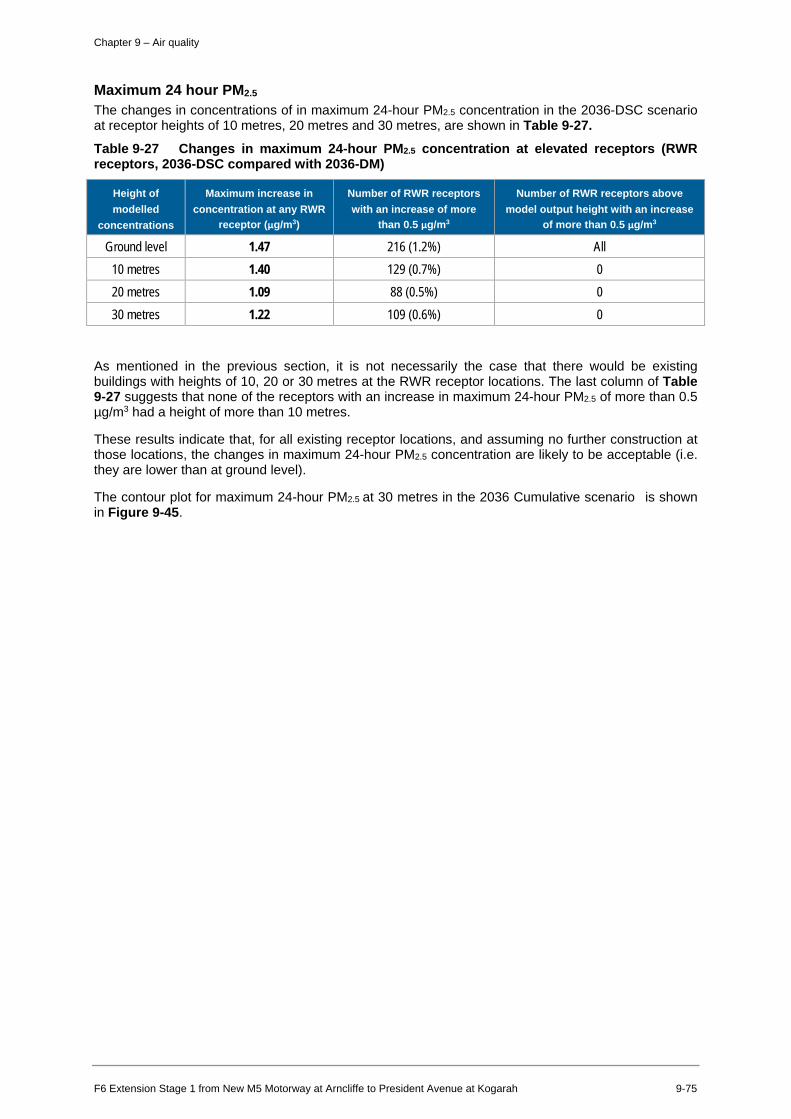
Chapter 9 – Air quality
Maximum 24 hour PM2.5
The changes in concentrations of in maximum 24-hour PM2.5 concentration in the 2036-DSC scenario at receptor heights of 10 metres, 20 metres and 30 metres, are shown in Table 9-27.
Table 9-27 Changes in maximum 24-hour PM2.5 concentration at elevated receptors (RWR receptors, 2036-DSC compared with 2036-DM)
Height of modelled
concentrations
Maximum increase in concentration at any RWR
receptor (µg/m3)
Number of RWR receptors with an increase of more
than 0.5 µg/m3
Number of RWR receptors above model output height with an increase
of more than 0.5 µg/m3
Ground level 1.47 216 (1.2%) All 10 metres 1.40 129 (0.7%) 0 20 metres 1.09 88 (0.5%) 0 30 metres 1.22 109 (0.6%) 0
As mentioned in the previous section, it is not necessarily the case that there would be existing buildings with heights of 10, 20 or 30 metres at the RWR receptor locations. The last column of Table 9-27 suggests that none of the receptors with an increase in maximum 24-hour PM2.5 of more than 0.5 µg/m3 had a height of more than 10 metres.
These results indicate that, for all existing receptor locations, and assuming no further construction at those locations, the changes in maximum 24-hour PM2.5 concentration are likely to be acceptable (i.e. they are lower than at ground level).
The contour plot for maximum 24-hour PM2.5 at 30 metres in the 2036 Cumulative scenario is shown in Figure 9-45.
F6 Extension Stage 1 from New M5 Motorway at Arncliffe to President Avenue at Kogarah 9-75

0 0 lf) "'SI' ('J '-0
0 0 0 (')
--s:('J '-0
0 0 0
"'SI' ('J '-0
0 0 0
°' (') ('J '-0
0 0 0 I'-... (') ('J '-0
327000 329000
~ Ventilation outlet - Surface road
PM2s __ ___j__[__j___L_J_..J.__L___J1
-10 -2 -1 -0 .5 -0 .2 0 0.1 0.18 1.8
(micrograms per cubic metre)
331000 333000
Metres ERM WGS 1984 UTM Zone 56S The business of sustainability
0
Chapter 9 – Air quality
Figure 9-45 Contour plot for change in maximum 24-hour PM2.5 concentration (2036-DSC minus 2036-DM, 30 metre receptor height
F6 Extension Stage 1 from New M5 Motorway at Arncliffe to President Avenue at Kogarah 9-76
Chapter 9 – Air quality
Implications for future developments The results for both annual mean and 24-hour PM2.5 do not seem to impose any significant restrictions on future developments in the GRAL domain up to a height of 30 metres above ground level. This statement only applies to the RWR receptor locations included in the modelling, although these should be broadly representative of other similar locations. However, planning controls should be developed in the vicinity of the ventilation outlets to ensure that future developments at heights of 30 metres or higher are not adversely impacted by the ventilation outlets. Development of planning controls would be supported by detailed modelling addressing all relevant pollutants and averaging periods.
9.6.5 Results for regulatory worst case scenarios The concentrations in the regulatory worst case scenario were, of course, higher than those for the expected traffic scenarios in all cases, and the following points are noted for the former:
• The maximum one-hour CO concentration was negligible, especially taking into account the fact that CO concentrations are well below the NSW impact assessment criterion. For example, the maximum one-hour outlet contribution in the regulatory worst case scenario (0.76 mg/m3) was a very small fraction of the criterion (30 mg/m3). The maximum background one-hour CO concentration (3.13 mg/m3) was also well below the criterion. Exceedances of the criterion due to the ventilation outlets are therefore highly unlikely to occur
• For PM10 the maximum contribution of the ventilation outlets would be small. For the annual mean and maximum 24-hour metrics the outlet contributions were seven per cent and 20 per cent of the respective criteria. This would be significant for some receptors, but any exceedances of the criteria would be dominated by background concentrations
• The ventilation outlet contribution would be most important for PM2.5, with the maximum contributions equating to 22 per cent and 40 per cent of the annual mean and 24-hour criteria respectively. Again, any exceedances of the criteria would be dominated by background concentrations.
For annual mean NO2, the maximum outlet concentrations in the regulatory worst case were an order of magnitude higher than those in the expected traffic case, although total concentrations would still remain below the NSW air quality criterion.
A detailed analysis was conducted for one-hour NO2. Although in some cases the ventilation outlet contributions appeared to be substantial, this was deceptive. As the background and surface road contributions (and hence total NOx) increased, there was a pronounced reduction in the contribution of the outlets to NO2. The analysis showed that maximum outlet contribution occurred when other contributions were low, such that overall NO2 concentrations were well below the criterion or even the predicted maximum.
Although the contributions to maximum one-hour concentrations of NO2 and 24-hour concentrations of PM2.5 could have been significant, the contributions would be theoretical worst cases, and there are several reasons why they would not represent a cause for concern in reality. For example:
• The probability of a ‘worst case event’ occurring that would lead to these concentrations in the ventilation outlets is very low
• Were a worst case event to occur, the probability of it lasting up to one hour would be very low. It is extremely unlikely that such an event would last for 24 hours
• The probability of a worst case event coinciding with the worst 24-hour period for dispersion would be very unlikely
• The probability of a worst case event coinciding with a high background concentration would also be very low. In the case of NO2, even if this were to occur the NO2/NOX ratio would be low.
Peak in-tunnel concentrations for all traffic scenarios, including the capacity traffic at different speeds, were well within the in-tunnel concentrations associated with the regulatory worst case scenarios. It therefore follows that the predicted ventilation outlet contributions to ambient concentrations for any in-tunnel traffic scenario would be lower than those used in the regulatory worst case assessment.
It can be concluded that emissions from the project ventilation outlets, even in the regulatory worst case scenarios, would be unlikely to result in adverse impacts on local air quality. Roads and Maritime
F6 Extension Stage 1 from New M5 Motorway at Arncliffe to President Avenue at Kogarah 9-77
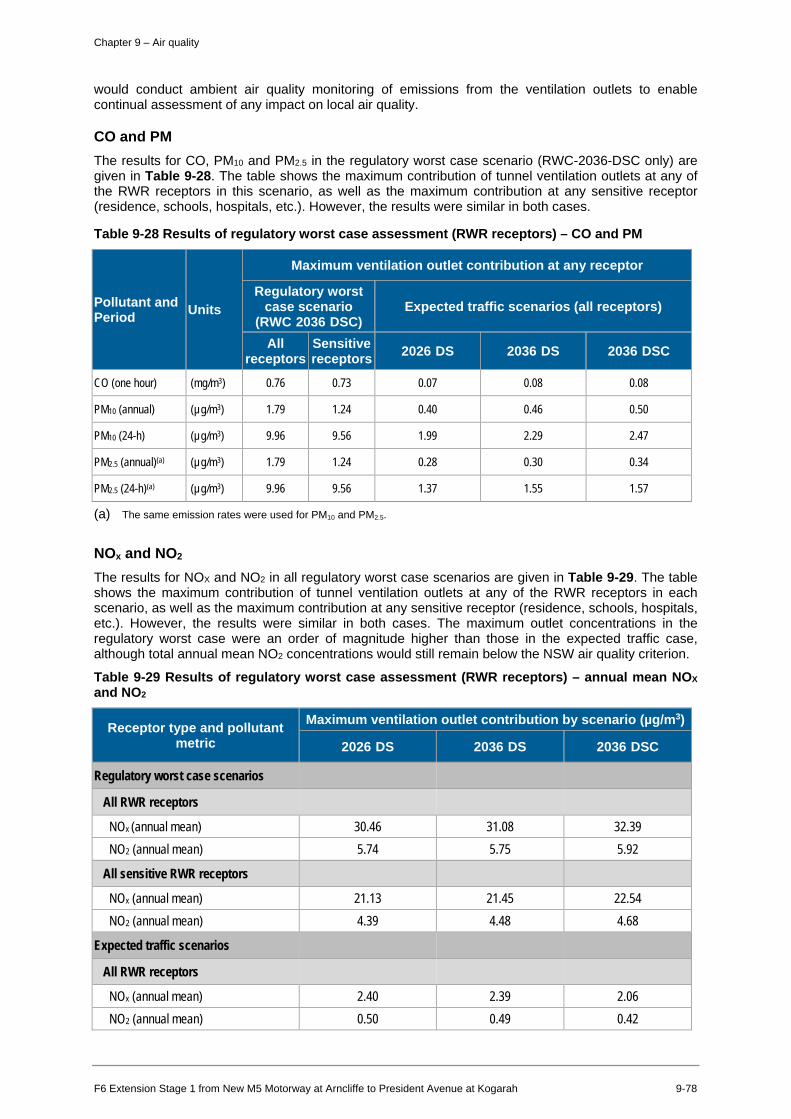
- -
- - -
- - -
Chapter 9 – Air quality
would conduct ambient air quality monitoring of emissions from the ventilation outlets to enable continual assessment of any impact on local air quality.
CO and PM The results for CO, PM10 and PM2.5 in the regulatory worst case scenario (RWC-2036-DSC only) are given in Table 9-28. The table shows the maximum contribution of tunnel ventilation outlets at any of the RWR receptors in this scenario, as well as the maximum contribution at any sensitive receptor (residence, schools, hospitals, etc.). However, the results were similar in both cases.
Table 9-28 Results of regulatory worst case assessment (RWR receptors) – CO and PM
Pollutant and Period Units
Maximum ventilation outlet contribution at any receptor
Regulatory worst case scenario
(RWC 2036 DSC) Expected traffic scenarios (all receptors)
All receptors
Sensitive receptors 2026 DS 2036 DS 2036 DSC
CO (one hour) (mg/m3) 0.76 0.73 0.07 0.08 0.08
PM10 (annual) (µg/m3) 1.79 1.24 0.40 0.46 0.50
PM10 (24-h) (µg/m3) 9.96 9.56 1.99 2.29 2.47
PM2.5 (annual)(a) (µg/m3) 1.79 1.24 0.28 0.30 0.34
PM2.5 (24-h)(a) (µg/m3) 9.96 9.56 1.37 1.55 1.57
(a) The same emission rates were used for PM10 and PM2.5.
NOx and NO2
The results for NOX and NO2 in all regulatory worst case scenarios are given in Table 9-29. The table shows the maximum contribution of tunnel ventilation outlets at any of the RWR receptors in each scenario, as well as the maximum contribution at any sensitive receptor (residence, schools, hospitals, etc.). However, the results were similar in both cases. The maximum outlet concentrations in the regulatory worst case were an order of magnitude higher than those in the expected traffic case, although total annual mean NO2 concentrations would still remain below the NSW air quality criterion.
Table 9-29 Results of regulatory worst case assessment (RWR receptors) – annual mean NOX and NO2
Receptor type and pollutant metric
Maximum ventilation outlet contribution by scenario (µg/m3)
2026 DS 2036 DS 2036 DSC
Regulatory worst case scenarios
All RWR receptors
NOx (annual mean) 30.46 31.08 32.39 NO2 (annual mean) 5.74 5.75 5.92
All sensitive RWR receptors
NOx (annual mean) 21.13 21.45 22.54 NO2 (annual mean) 4.39 4.48 4.68
Expected traffic scenarios
All RWR receptors
NOx (annual mean) 2.40 2.39 2.06 NO2 (annual mean) 0.50 0.49 0.42
F6 Extension Stage 1 from New M5 Motorway at Arncliffe to President Avenue at Kogarah 9-78
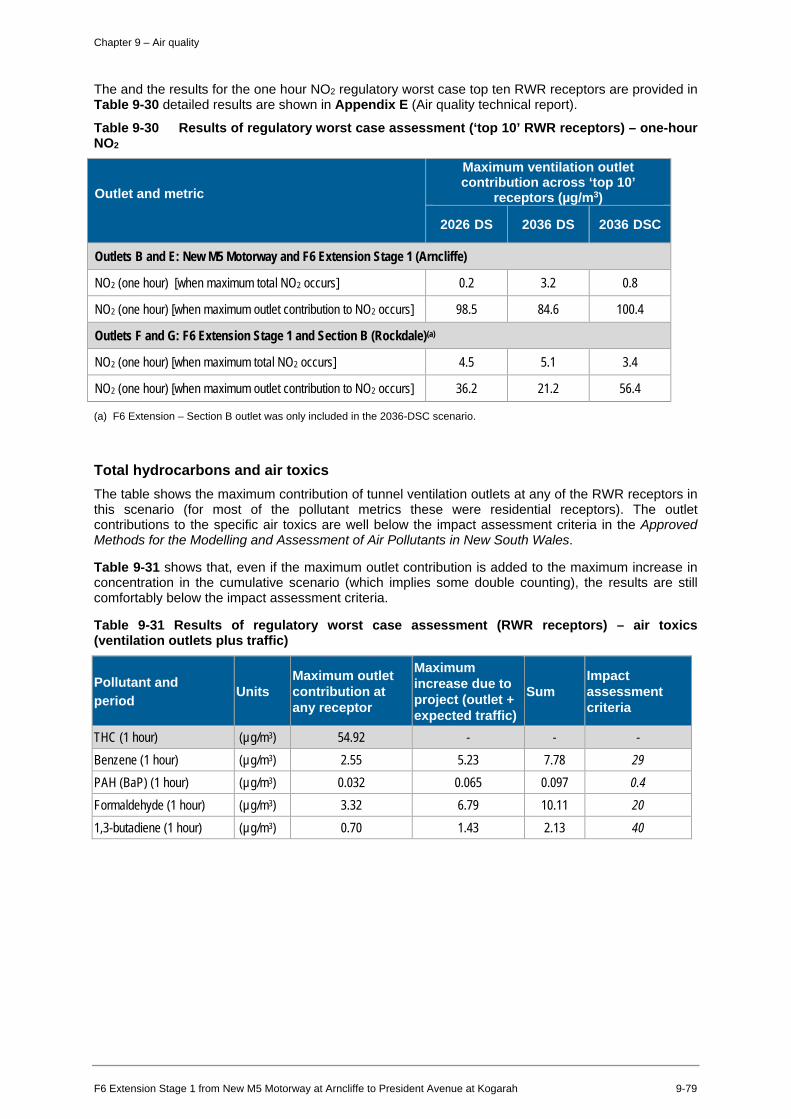
- - -
Chapter 9 – Air quality
The and the results for the one hour NO2 regulatory worst case top ten RWR receptors are provided in Table 9-30 detailed results are shown in Appendix E (Air quality technical report).
Table 9-30 Results of regulatory worst case assessment (‘top 10’ RWR receptors) – one-hour NO2
Outlet and metric
Maximum ventilation outlet contribution across ‘top 10’
receptors (µg/m3)
2026 DS 2036 DS 2036 DSC
Outlets B and E: New M5 Motorway and F6 Extension Stage 1 (Arncliffe)
NO2 (one hour) [when maximum total NO2 occurs] 0.2 3.2 0.8
NO2 (one hour) [when maximum outlet contribution to NO2 occurs] 98.5 84.6 100.4
Outlets F and G: F6 Extension Stage 1 and Section B (Rockdale)(a)
NO2 (one hour) [when maximum total NO2 occurs] 4.5 5.1 3.4
NO2 (one hour) [when maximum outlet contribution to NO2 occurs] 36.2 21.2 56.4
(a) F6 Extension – Section B outlet was only included in the 2036-DSC scenario.
Total hydrocarbons and air toxics The table shows the maximum contribution of tunnel ventilation outlets at any of the RWR receptors in this scenario (for most of the pollutant metrics these were residential receptors). The outlet contributions to the specific air toxics are well below the impact assessment criteria in the Approved Methods for the Modelling and Assessment of Air Pollutants in New South Wales.
Table 9-31 shows that, even if the maximum outlet contribution is added to the maximum increase in concentration in the cumulative scenario (which implies some double counting), the results are still comfortably below the impact assessment criteria.
Table 9-31 Results of regulatory worst case assessment (RWR receptors) – air toxics (ventilation outlets plus traffic)
Pollutant and period Units
Maximum outlet contribution at any receptor
Maximum increase due to project (outlet + expected traffic)
Sum Impact assessment criteria
THC (1 hour) (µg/m3) 54.92 - - -
Benzene (1 hour) (µg/m3) 2.55 5.23 7.78 29
PAH (BaP) (1 hour) (µg/m3) 0.032 0.065 0.097 0.4
Formaldehyde (1 hour) (µg/m3) 3.32 6.79 10.11 20
1,3-butadiene (1 hour) (µg/m3) 0.70 1.43 2.13 40
F6 Extension Stage 1 from New M5 Motorway at Arncliffe to President Avenue at Kogarah 9-79
Chapter 9 – Air quality
9.6.6 Sensitivity tests Several sensitivity tests were conducted to investigate the effects of the influence of;
• ventilation outlet temperature
• height of ventilation outlet, and
• the inclusion of buildings near tunnel ventilation outlets.
For each parameter the value used in the model was varied around a central estimate that was representative of the value used in the expected traffic case model scenarios.
The sensitivity tests were only conducted for the ventilation outlet contribution (i.e. background and surface road contributions were excluded), and for maximum one-hour, maximum 24-hour PM2.5 and annual mean PM2.5. Both absolute and percentage changes in concentration were considered. The percentage changes could also be considered as being representative for other pollutants (e.g. CO, NOX, and PM10).
The tests were mainly conducted for a sub-area of the project model domain of approximately 2 km x 2 km around the Rockdale ventilation outlets and for seven community receptors representative of the area. The detailed results for each test are provided in Appendix E (Air quality technical report)
Ventilation outlet temperature
For the outlet temperature of 15oC the predicted PM2.5 concentrations were systematically higher than those in the central estimate (25 oC) as a consequence of the reduced thermal buoyancy of the plume leading to poorer dispersion. Across all PM2.5 metrics the largest increase at any community receptor was 23 per cent, and the average increase was 9 per cent. The predicted outlet concentrations remained well below the air quality criteria for PM2.5.
For the outlet temperature of 35˚C the predicted PM2.5 concentrations were systematically lower than those in the central estimate of 25˚C because of increased thermal plume buoyancy. The largest decrease at any community receptor was 19 per cent, and the average decrease was 10 per cent.
Ventilation outlet height For the ventilation outlet heights the central estimate for (test HT02) was taken to be 35 metres above the ground (the outlet height used in the expected traffic case modelling). In height test HT01 the height was set to 25 metres, and in height test HT03 the height was set to 45 metres. This was considered to be a realistic potential range for the outlet height at this location.
For the outlet height of 25 metres the predicted PM2.5 concentrations were almost all systematically higher than those in the central estimate. This is a consequence of the reduction of ambient wind speed with height in the atmosphere (which results in poorer dispersion), and the shorter distances between the source and the receptors. The largest increase at any community receptor was 43 per cent, and the average increase was 22 per cent. As with the temperature tests, the predicted outlet concentrations remained well below the air quality criteria for PM2.5.
For the outlet height of 45 metres the predicted PM2.5 concentrations were in most cases lower than those in the central estimate. The largest decrease at any community receptor was 30 per cent, and the average decrease was 21 per cent.
Buildings The project assessment excluded buildings from the dispersion modelling (the rationale for this was provided in section 9.3.2). The sensitivity of the inclusion of buildings to predicted concentrations was therefore assessed. The effects of stack-tip downwash were also included in this test.
The results for the buildings tests are shown in Appendix E (Air quality technical report). These show that, when buildings were included, there was a maximum increase in concentrations associated with the ventilation outlet of 32 per cent, and an average increase of 20 per cent.
As with the height and temperature tests, the predicted outlet concentrations remained well below the air quality criteria for PM2.5.
F6 Extension Stage 1 from New M5 Motorway at Arncliffe to President Avenue at Kogarah 9-80
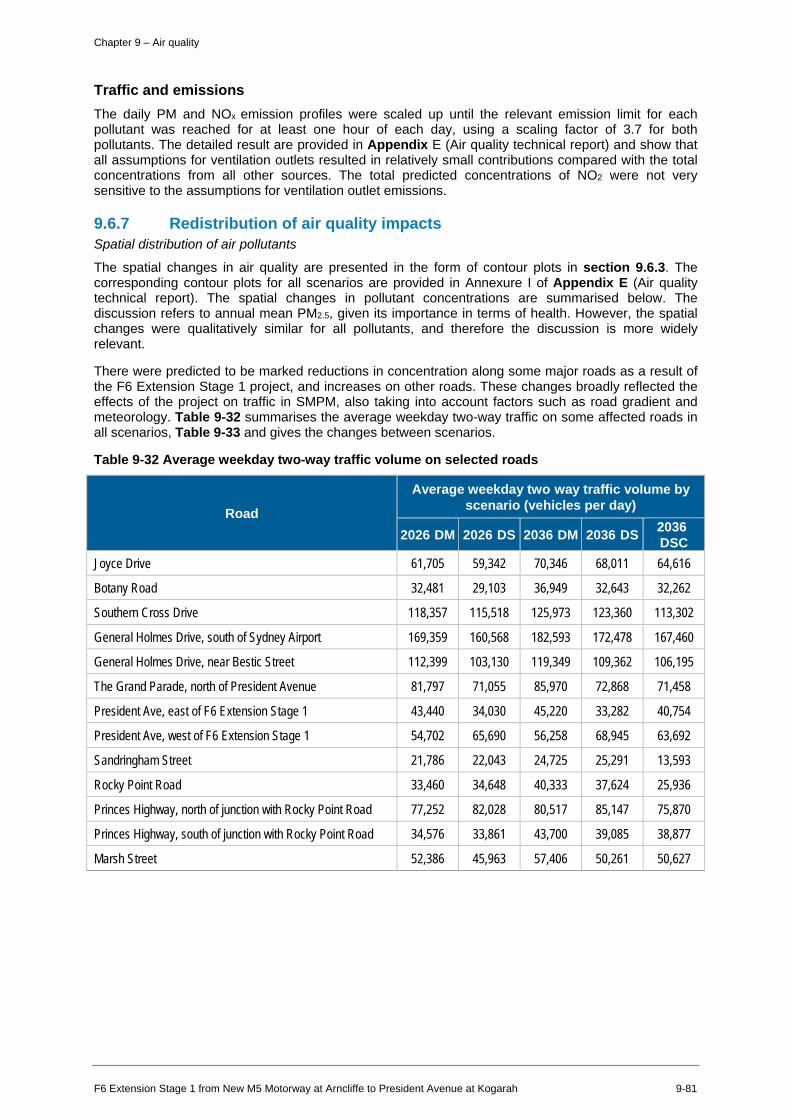
-
- - - - -
Chapter 9 – Air quality
Traffic and emissions The daily PM and NOx emission profiles were scaled up until the relevant emission limit for each pollutant was reached for at least one hour of each day, using a scaling factor of 3.7 for both pollutants. The detailed result are provided in Appendix E (Air quality technical report) and show that all assumptions for ventilation outlets resulted in relatively small contributions compared with the total concentrations from all other sources. The total predicted concentrations of NO2 were not very sensitive to the assumptions for ventilation outlet emissions.
9.6.7 Redistribution of air quality impacts Spatial distribution of air pollutants
The spatial changes in air quality are presented in the form of contour plots in section 9.6.3. The corresponding contour plots for all scenarios are provided in Annexure I of Appendix E (Air quality technical report). The spatial changes in pollutant concentrations are summarised below. The discussion refers to annual mean PM2.5, given its importance in terms of health. However, the spatial changes were qualitatively similar for all pollutants, and therefore the discussion is more widely relevant.
There were predicted to be marked reductions in concentration along some major roads as a result of the F6 Extension Stage 1 project, and increases on other roads. These changes broadly reflected the effects of the project on traffic in SMPM, also taking into account factors such as road gradient and meteorology. Table 9-32 summarises the average weekday two-way traffic on some affected roads in all scenarios, Table 9-33 and gives the changes between scenarios.
Table 9-32 Average weekday two-way traffic volume on selected roads
Road
Average weekday two way traffic volume by scenario (vehicles per day)
2026 DM 2026 DS 2036 DM 2036 DS 2036 DSC
Joyce Drive 61,705 59,342 70,346 68,011 64,616
Botany Road 32,481 29,103 36,949 32,643 32,262
Southern Cross Drive 118,357 115,518 125,973 123,360 113,302
General Holmes Drive, south of Sydney Airport 169,359 160,568 182,593 172,478 167,460
General Holmes Drive, near Bestic Street 112,399 103,130 119,349 109,362 106,195
The Grand Parade, north of President Avenue 81,797 71,055 85,970 72,868 71,458
President Ave, east of F6 Extension Stage 1 43,440 34,030 45,220 33,282 40,754
President Ave, west of F6 Extension Stage 1 54,702 65,690 56,258 68,945 63,692
Sandringham Street 21,786 22,043 24,725 25,291 13,593
Rocky Point Road 33,460 34,648 40,333 37,624 25,936
Princes Highway, north of junction with Rocky Point Road 77,252 82,028 80,517 85,147 75,870
Princes Highway, south of junction with Rocky Point Road 34,576 33,861 43,700 39,085 38,877
Marsh Street 52,386 45,963 57,406 50,261 50,627
F6 Extension Stage 1 from New M5 Motorway at Arncliffe to President Avenue at Kogarah 9-81
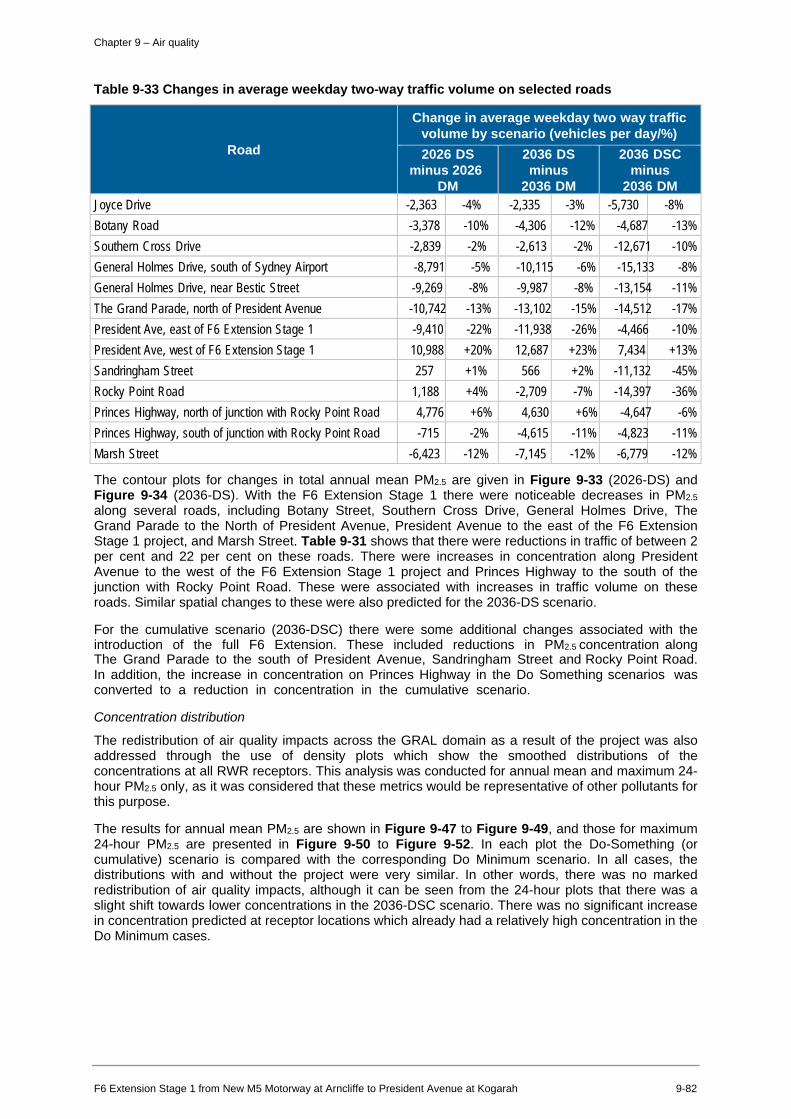
-
--
-
-
-
-
Chapter 9 – Air quality
Table 9-33 Changes in average weekday two-way traffic volume on selected roads
Road
Change in average weekday two way traffic volume by scenario (vehicles per day/%) 2026 DS
minus 2026 DM
2036 DS minus
2036 DM
2036 DSCminus
2036 DMJoyce Drive -2,363 -4% -2,335 -3% -5,730 -8%Botany Road -3,378 -10% -4,306 -12% -4,687 -13%Southern Cross Drive -2,839 -2% -2,613 -2% -12,671 -10%General Holmes Drive, south of Sydney Airport -8,791 -5% -10,115 -6% -15,133 -8%General Holmes Drive, near Bestic Street -9,269 -8% -9,987 -8% -13,154 -11%The Grand Parade, north of President Avenue -10,742 -13% -13,102 -15% -14,512 -17%President Ave, east of F6 Extension Stage 1 -9,410 -22% -11,938 -26% -4,466 -10%President Ave, west of F6 Extension Stage 1 10,988 +20% 12,687 +23% 7,434 +13%Sandringham Street 257 +1% 566 +2% -11,132 -45%Rocky Point Road 1,188 +4% -2,709 -7% -14,397 -36%Princes Highway, north of junction with Rocky Point Road 4,776 +6% 4,630 +6% -4,647 -6%Princes Highway, south of junction with Rocky Point Road -715 -2% -4,615 -11% -4,823 -11%Marsh Street -6,423 -12% -7,145 -12% -6,779 -12%
The contour plots for changes in total annual mean PM2.5 are given in Figure 9-33 (2026-DS) andFigure 9-34 (2036-DS). With the F6 Extension Stage 1 there were noticeable decreases in PM2.5
along several roads, including Botany Street, Southern Cross Drive, General Holmes Drive, TheGrand Parade to the North of President Avenue, President Avenue to the east of the F6 ExtensionStage 1 project, and Marsh Street. Table 9-31 shows that there were reductions in traffic of between 2per cent and 22 per cent on these roads. There were increases in concentration along PresidentAvenue to the west of the F6 Extension Stage 1 project and Princes Highway to the south of thejunction with Rocky Point Road. These were associated with increases in traffic volume on theseroads. Similar spatial changes to these were also predicted for the 2036-DS scenario.
For the cumulative scenario (2036-DSC) there were some additional changes associated with theintroduction of the full F6 Extension. These included reductions in PM2.5 concentration along The Grand Parade to the south of President Avenue, Sandringham Street and Rocky Point Road. In addition, the increase in concentration on Princes Highway in the Do Something scenarios was converted to a reduction in concentration in the cumulative scenario.
Concentration distribution
The redistribution of air quality impacts across the GRAL domain as a result of the project was alsoaddressed through the use of density plots which show the smoothed distributions of theconcentrations at all RWR receptors. This analysis was conducted for annual mean and maximum 24-hour PM2.5 only, as it was considered that these metrics would be representative of other pollutants forthis purpose.
The results for annual mean PM2.5 are shown in Figure 9-47 to Figure 9-49, and those for maximum24-hour PM2.5 are presented in Figure 9-50 to Figure 9-52. In each plot the Do-Something (orcumulative) scenario is compared with the corresponding Do Minimum scenario. In all cases, thedistributions with and without the project were very similar. In other words, there was no markedredistribution of air quality impacts, although it can be seen from the 24-hour plots that there was aslight shift towards lower concentrations in the 2036-DSC scenario. There was no significant increasein concentration predicted at receptor locations which already had a relatively high concentration in theDo Minimum cases.
F6 Extension Stage 1 from New M5 Motorway at Arncliffe to President Avenue at Kogarah 9-82
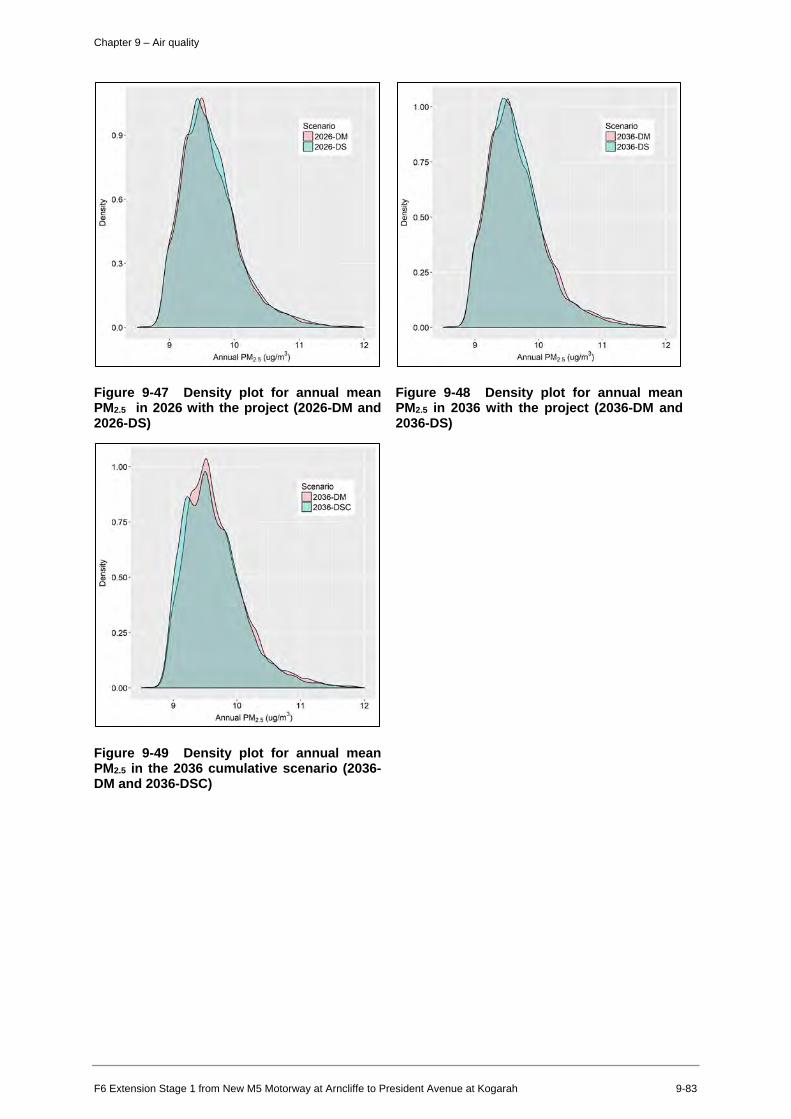
0.9 ·
z;, 0.6 · ·.; C
" 0
z;, ·.;
0.3·
0.0 ·
1.00·
0.75 ·
~ 0.50 · 0
0.25 ·
0.00 ·
9
9
Scenario D 2026-DM D2026-DS
10 11
Annual PM2.5 (ug/m3)
Scenario D2036-DM D2036-DSC
10 11
Annual PM2.5 (ug/m3)
1.00·
Scenario D2036-DM D2036-DS
0.75 ·
z;, ·.; C
0.50 · " 0
0.25 ·
0.00 ·
12 9 ' ' 10 11 12
Annual PM2.5 (ug/m3)
12
Chapter 9 – Air quality
Figure 9-48 Density plot for annual mean PM2.5 in 2036 with the project (2036-DM and 2036-DS)
Figure 9-47 Density plot for annual mean PM2.5 in 2026 with the project (2026-DM and 2026-DS)
Figure 9-49 Density plot for annual mean PM2.5 in the 2036 cumulative scenario (2036-DM and 2036-DSC)
F6 Extension Stage 1 from New M5 Motorway at Arncliffe to President Avenue at Kogarah 9-83
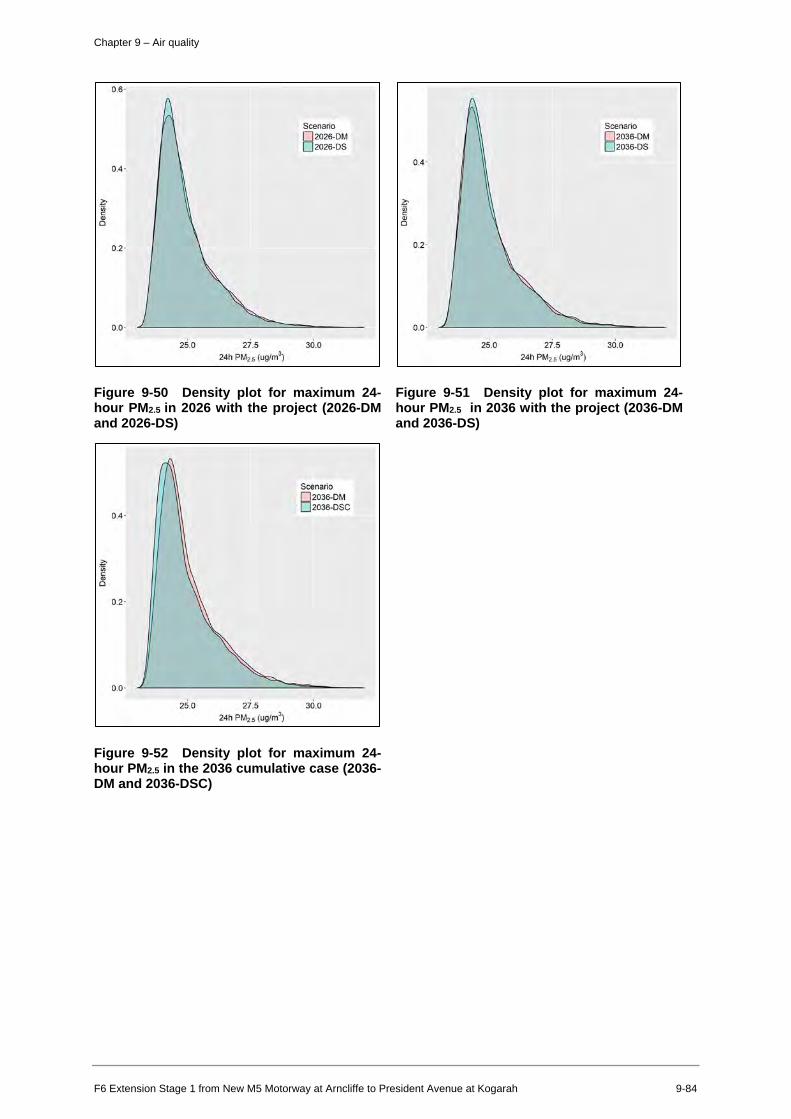
z;, ·.; C
" 0
z;, ·.; C
" 0
0.6 ·
0.4 ·
0.2 ·
0.0 ·
25.0
0.4 ·
0.2 ·
0.0 ·
25.0
27.5
24h PM2 5 (ug/m3)
27.5
24h PM25 (ug/m3)
Scenario D2026-DM D2026-DS
30.0
Scenario D2036-DM D2036-DSC
30.0
Scenario D2036-DM D2036-DS
0.4-
z;, ·.; C
" 0
0.2 ·
0.0·
25.0 27.5 30.0
24h PM2 5 (ug/m3)
Chapter 9 – Air quality
Figure 9-51 Density plot for maximum 24-hour PM2.5 in 2036 with the project (2036-DM and 2036-DS)
Figure 9-50 Density plot for maximum 24-hour PM2.5 in 2026 with the project (2026-DM and 2026-DS)
Figure 9-52 Density plot for maximum 24-hour PM2.5 in the 2036 cumulative case (2036-DM and 2036-DSC)
F6 Extension Stage 1 from New M5 Motorway at Arncliffe to President Avenue at Kogarah 9-84
Chapter 9 – Air quality
9.6.8 Regional air quality The changes in the total emissions resulting from the project were given in Table 9-34. These changes can be viewed as a proxy for the project’s regional air quality impacts which, on the basis of the results, are likely to be negligible. For example:
• The changes in NOX emissions for the assessed road network in a given year ranged from a decrease of 39 tonnes per year to an increase of 27 tonnes per year. The largest increase equated to a very small proportion (around 0.05 per cent) of anthropogenic NOX emissions in the Sydney airshed in 2016 (around 53,700 tonnes)
• The increase in NOX in a given year was much smaller than the projected reduction in emissions between 2015 and 2036 (around 690 tonnes per year).
The regional air quality impacts of a project can also be framed in terms of its capacity to influence ozone production. NSW EPA has developed a Tiered Procedure for Estimating Ground Level Ozone Impacts from Stationary Sources (ENVIRON, 2011). Although this procedure does not relate specifically to road projects, it was applied here to give an indication of the likely significance of the project’s effect on ozone concentrations in the broader Sydney region. The methods used is described in Appendix E (Air quality technical report).
The results in Table 9-34 show that the largest increase in NOX emissions (27 tonnes per year in the 2036-DSC scenario) was well below the 90 tonnes/year threshold for assessment. Indeed, this was the only scenario with an increase in overall NOX emissions. THC emissions decreased in all scenarios.
Table 9-34 Absolute changes in total traffic emissions in the GRAL domain
Scenario comparison Change in total emissions (tonnes/year)
CO NOx PM10 PM2.5 THC Underlying changes in emissions with time(a)
2026-DM vs 2016-BY -1,369 -610 1.7 -5.2 -174 2036-DM vs 2016-BY -1,838 -689 5.8 -4.2 -221 Changes due to the project in a given year 2026-DS vs 2026-DM -42 -39 -2.8 -1.8 -3.4 2036-DS vs 2036-DM 31 12 1.3 0.8 -0.4 2036-DSC vs 2036-DM 56 27 2.8 1.8 -2.8 The 2026-DM and 2036-DM scenarios include the WestConnex and Sydney Gateway projects. The 2016-BY scenario does not.
The changes in total traffic emissions for the project scenarios are shown in Figure 9-53.
F6 Extension Stage 1 from New M5 Motorway at Arncliffe to President Avenue at Kogarah 9-85
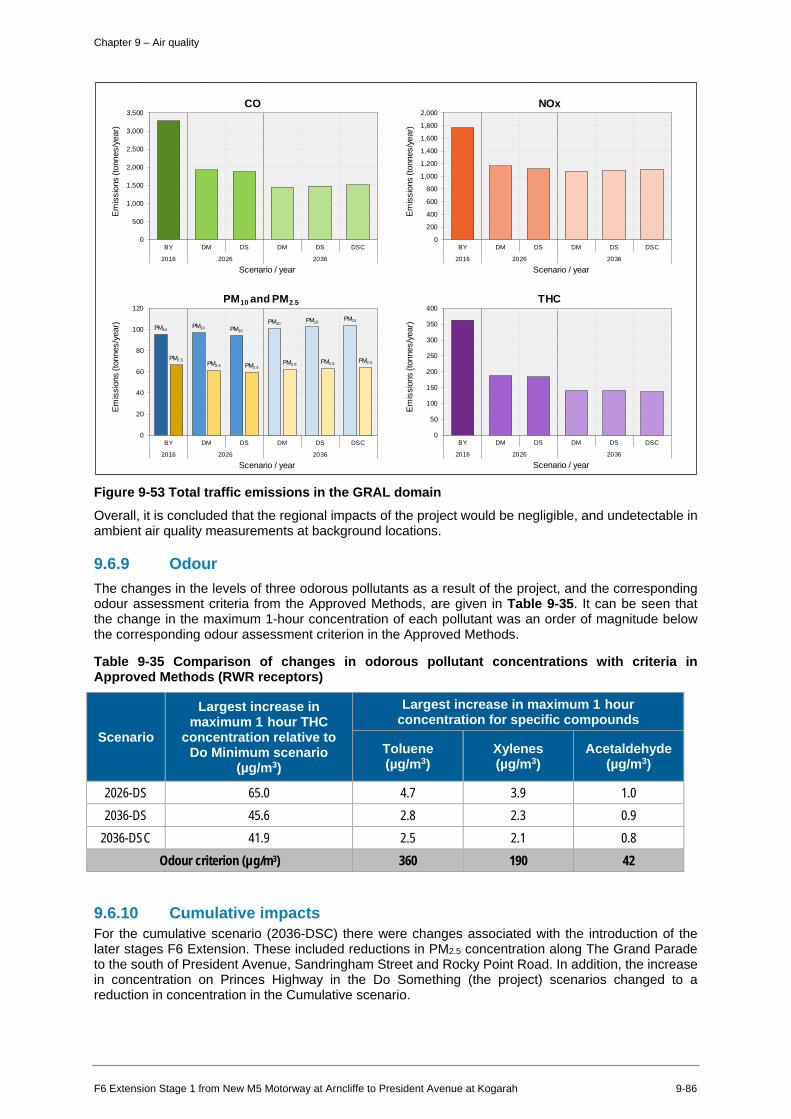
--
- - -- -- - - -- -
I I I
Chapter 9 – Air quality
0
500
1,000
1,500
2,000
2,500
3,000
3,500
BY DM DS DM DS DSC
2016 2026 2036
Em
issi
ons
(ton
nes/
year
)
Scenario / year
CO
0
200
400
600
800
1,000
1,200
1,400
1,600
1,800
2,000
BY DM DS DM DS DSC
2016 2026 2036
Em
issi
ons
(ton
nes/
year
)
Scenario / year
NOx
PM10 PM10 PM10
PM10 PM10
PM10
PM2.5 PM2.5 PM2.5
PM2.5 PM2.5 PM2.5
0
20
40
60
80
100
120
BY DM DS DM DS DSC
2016 2026 2036
Em
issi
ons
(ton
nes/
year
)
Scenario / year
PM10 and PM2.5
0
50
100
150
200
250
300
350
400
BY DM DS DM DS DSC
2016 2026 2036
Em
issi
ons
(ton
nes/
year
)
Scenario / year
THC
Figure 9-53 Total traffic emissions in the GRAL domain
Overall, it is concluded that the regional impacts of the project would be negligible, and undetectable in ambient air quality measurements at background locations.
9.6.9 Odour The changes in the levels of three odorous pollutants as a result of the project, and the corresponding odour assessment criteria from the Approved Methods, are given in Table 9-35. It can be seen that the change in the maximum 1-hour concentration of each pollutant was an order of magnitude below the corresponding odour assessment criterion in the Approved Methods.
Table 9-35 Comparison of changes in odorous pollutant concentrations with criteria in Approved Methods (RWR receptors)
Scenario
Largest increase in maximum 1 hour THC
concentration relative to Do Minimum scenario
(µg/m3)
Largest increase in maximum 1 hour concentration for specific compounds
Toluene (µg/m3)
Xylenes (µg/m3)
Acetaldehyde (µg/m3)
2026-DS 65.0 4.7 3.9 1.0 2036-DS 45.6 2.8 2.3 0.9
2036-DSC 41.9 2.5 2.1 0.8 Odour criterion (µg/m3) 360 190 42
9.6.10 Cumulative impacts For the cumulative scenario (2036-DSC) there were changes associated with the introduction of the later stages F6 Extension. These included reductions in PM2.5 concentration along The Grand Parade to the south of President Avenue, Sandringham Street and Rocky Point Road. In addition, the increase in concentration on Princes Highway in the Do Something (the project) scenarios changed to a reduction in concentration in the Cumulative scenario.
F6 Extension Stage 1 from New M5 Motorway at Arncliffe to President Avenue at Kogarah 9-86

0 0 I.() --.;f" N
'°
0 0 0 CV) --.;f" N
'°
0 0 0
'<I" N
'°
0 0 0 0-(V") N
'°
0 0 0 r--... CV) N
'°
327000 329000
~ Ventilation outlet - Surface road
-10 -5 -3 -1 0 3
(micrograms per cubic metre)
331000 333000
M etres ERM WGS 1984 UTM Zone 56S The business of sustainability
0
Chapter 9 – Air quality
Figure 9-54 Contour plot of change in annual mean NO2 concentration in the 2036 cumulative scenario (all sources, 2036-DSC minus 2036-DM)
F6 Extension Stage 1 from New M5 Motorway at Arncliffe to President Avenue at Kogarah 9-87

0 0 I.() --.;f" N
'°
0 0 0 CV) --.;f" N
'°
0 0 0
'<I" N
'°
0 0 0 0-(V") N
'°
0 0 0 r--... CV) N
'°
327000 329000
~ Ventilation outlet - Surface road
-400 -200 -50 -20 0 30 50
(micrograms per cubic metre)
331000 333000
M etres ERM WGS 1984 UTM Zone 56S The business of sustainability
0
Chapter 9 – Air quality
Figure 9-55 Contour plot of change in maximum one-hour mean NO2 concentration in the 2036 cumulative scenario (all sources, 2036-DSC minus 2036-DM)
F6 Extension Stage 1 from New M5 Motorway at Arncliffe to President Avenue at Kogarah 9-88
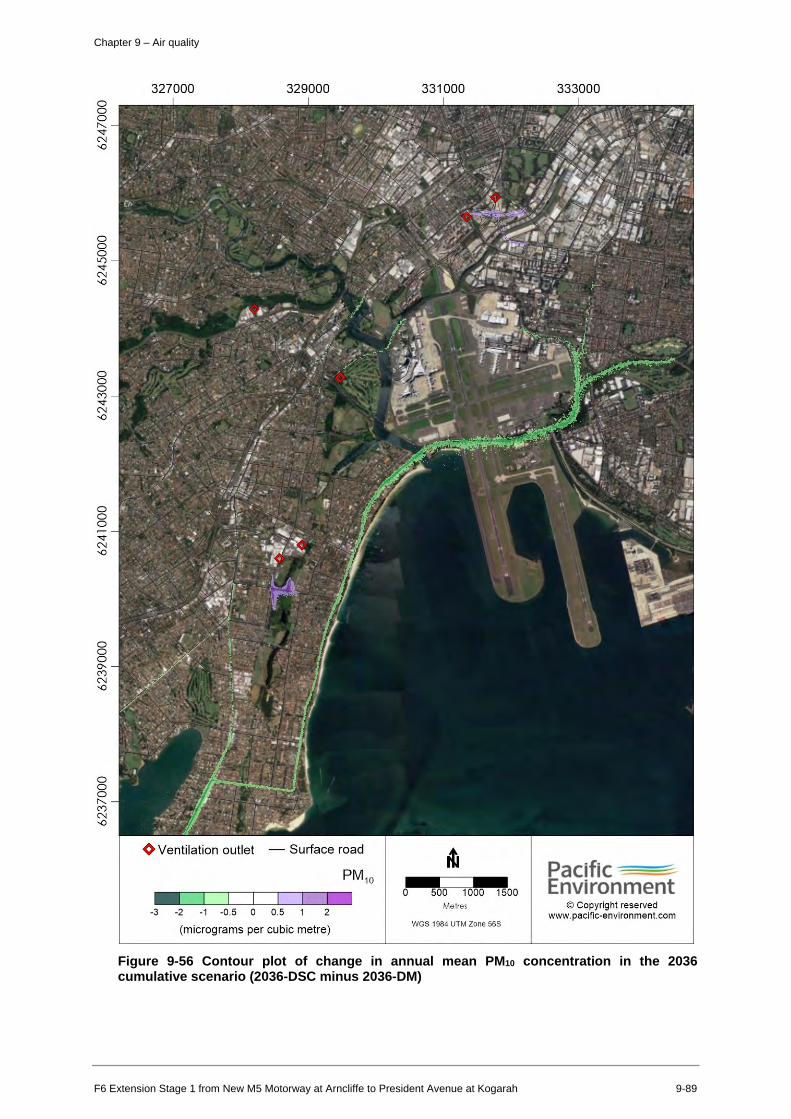
0 0 If) '<I" ('J '-0
0 0 0 C") '<I" ('J '-0
0 0 0
'<I" ('J '-0
0 0 0 0-C") ('J '-0
0 0 0
" C") ('J '-0
327000 329000
~ Ventilation outlet - Surface road
PM 10
I -3 -2 -1 -0.5 0 0.5 1 2
(micrograms per cubic metre)
331000
Metres
WGS 1984 UTM Zone 56S
333000
Pacific Environment
© Copyright reserved www.pacific-environment.com
0
Chapter 9 – Air quality
Figure 9-56 Contour plot of change in annual mean PM10 concentration in the 2036 cumulative scenario (2036-DSC minus 2036-DM)
F6 Extension Stage 1 from New M5 Motorway at Arncliffe to President Avenue at Kogarah 9-89

0 0 I.() --.;f" N
'°
0 0 0 CV) --.;f" N
'°
0 0 0
'<I" N
'°
0 0 0 0-(V") N
'°
0 0 0 r--... CV) N
'°
327000 329000
~ Ventilation outlet - Surface road
PM2s
-4 -2 -1 -0.8 -0.2 0 0.2 0.8 1.8
(micrograms per cubic metre)
331000
M etres
WGS 1984 UTM Zone 56S
333000
Pacific Environment
© Copyrig ht reserved www.pacific-environment.com
0
Chapter 9 – Air quality
Figure 9-57 Contour plot of change in annual mean PM2.5 concentration in 2036 cumulative scenario (all sources, 2036-DSC minus 2036-DM)
F6 Extension Stage 1 from New M5 Motorway at Arncliffe to President Avenue at Kogarah 9-90
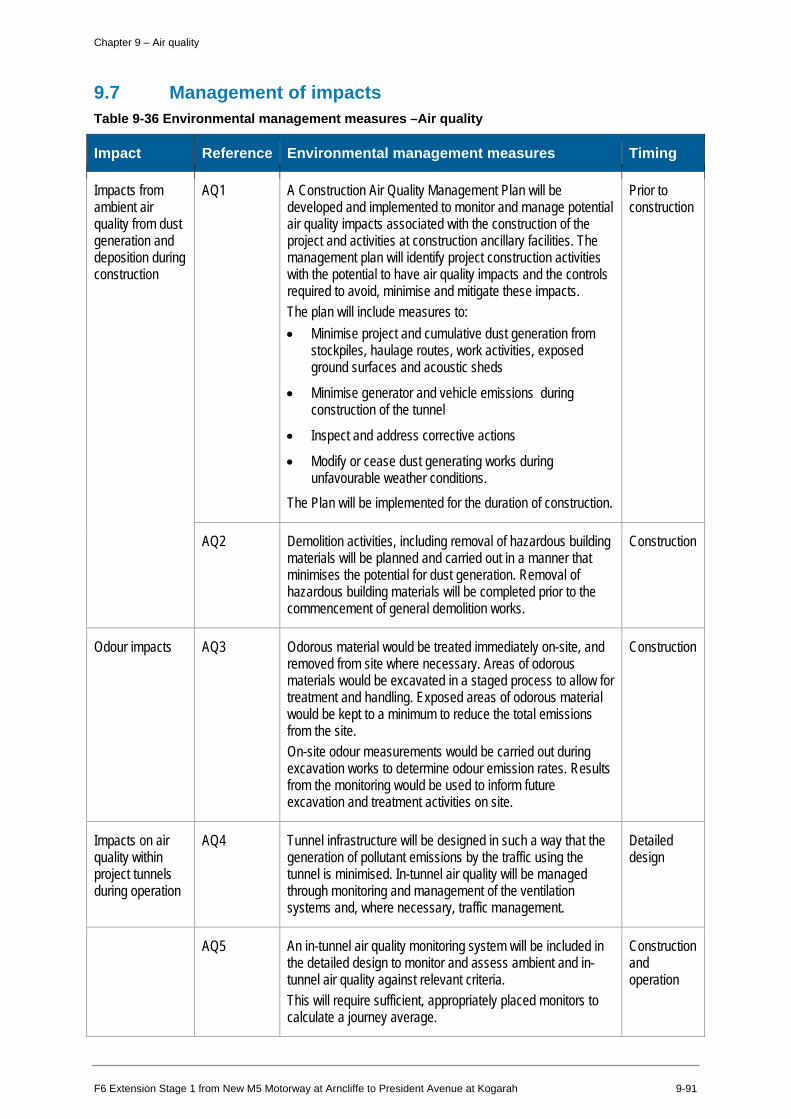
Chapter 9 – Air quality
9.7 Management of impacts Table 9-36 Environmental management measures –Air quality
Impact Reference Environmental management measures Timing
Impacts from ambient air quality from dust generation and deposition during construction
AQ1 A Construction Air Quality Management Plan will be developed and implemented to monitor and manage potential air quality impacts associated with the construction of the project and activities at construction ancillary facilities. The management plan will identify project construction activities with the potential to have air quality impacts and the controls required to avoid, minimise and mitigate these impacts. The plan will include measures to: • Minimise project and cumulative dust generation from
stockpiles, haulage routes, work activities, exposed ground surfaces and acoustic sheds
• Minimise generator and vehicle emissions during construction of the tunnel
• Inspect and address corrective actions
• Modify or cease dust generating works during unfavourable weather conditions.
The Plan will be implemented for the duration of construction.
Prior to construction
AQ2 Demolition activities, including removal of hazardous building materials will be planned and carried out in a manner that minimises the potential for dust generation. Removal of hazardous building materials will be completed prior to the commencement of general demolition works.
Construction
Odour impacts AQ3 Odorous material would be treated immediately on-site, and removed from site where necessary. Areas of odorous materials would be excavated in a staged process to allow for treatment and handling. Exposed areas of odorous material would be kept to a minimum to reduce the total emissions from the site. On-site odour measurements would be carried out during excavation works to determine odour emission rates. Results from the monitoring would be used to inform future excavation and treatment activities on site.
Construction
Impacts on air quality within project tunnels during operation
AQ4 Tunnel infrastructure will be designed in such a way that the generation of pollutant emissions by the traffic using the tunnel is minimised. In-tunnel air quality will be managed through monitoring and management of the ventilation systems and, where necessary, traffic management.
Detailed design
AQ5 An in-tunnel air quality monitoring system will be included in the detailed design to monitor and assess ambient and in-tunnel air quality against relevant criteria. This will require sufficient, appropriately placed monitors to calculate a journey average.
Construction and operation
F6 Extension Stage 1 from New M5 Motorway at Arncliffe to President Avenue at Kogarah 9-91
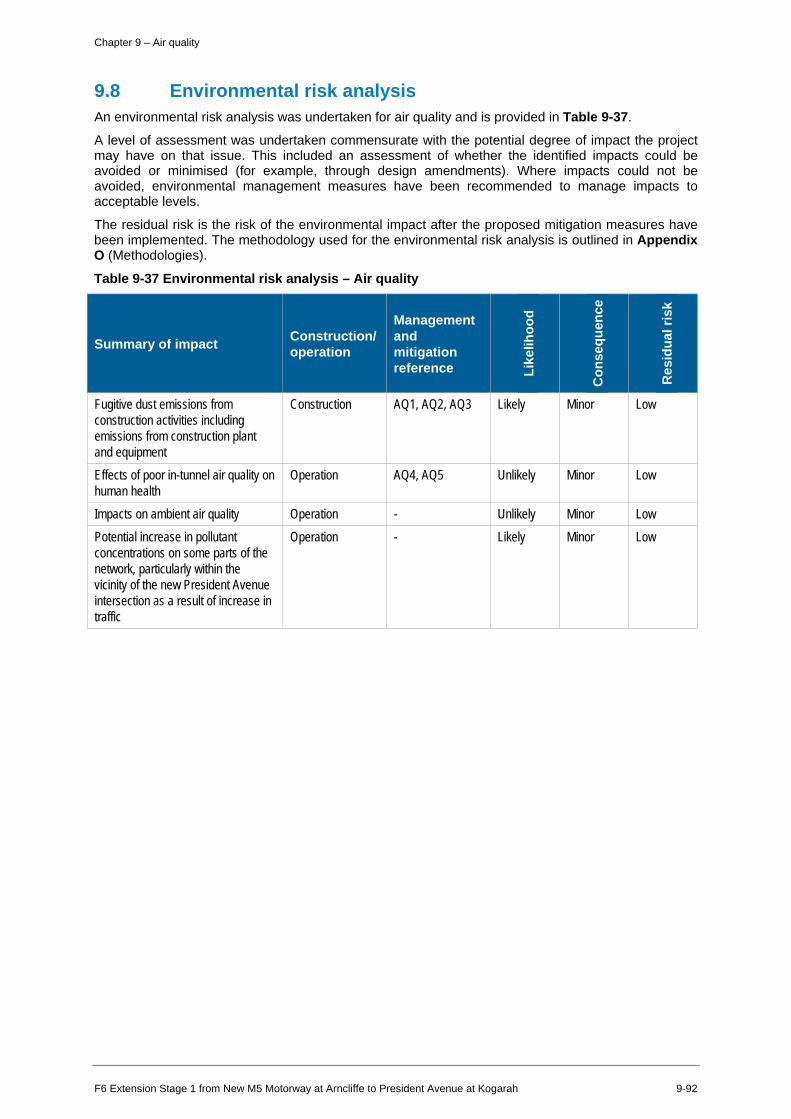
Chapter 9 – Air quality
9.8 Environmental risk analysis An environmental risk analysis was undertaken for air quality and is provided in Table 9-37.
A level of assessment was undertaken commensurate with the potential degree of impact the project may have on that issue. This included an assessment of whether the identified impacts could be avoided or minimised (for example, through design amendments). Where impacts could not be avoided, environmental management measures have been recommended to manage impacts to acceptable levels.
The residual risk is the risk of the environmental impact after the proposed mitigation measures have been implemented. The methodology used for the environmental risk analysis is outlined in Appendix O (Methodologies).
Table 9-37 Environmental risk analysis – Air quality
Summary of impact Construction/ operation
Management and mitigation reference Li
kelih
ood
Con
sequ
ence
Res
idua
l ris
k
Fugitive dust emissions from construction activities including emissions from construction plant and equipment
Construction AQ1, AQ2, AQ3 Likely Minor Low
Effects of poor in-tunnel air quality on human health
Operation AQ4, AQ5 Unlikely Minor Low
Impacts on ambient air quality Operation - Unlikely Minor Low Potential increase in pollutant concentrations on some parts of the network, particularly within the vicinity of the new President Avenue intersection as a result of increase in traffic
Operation - Likely Minor Low
F6 Extension Stage 1 from New M5 Motorway at Arncliffe to President Avenue at Kogarah 9-92