Embed Size (px)
DESCRIPTION
A System Model of Oral Glucose Absorption
Citation preview
2472 IEEE TRANSACTIONS ON BIOMEDICAL ENGINEERING, VOL. 53, NO. 12, DECEMBER 2006
A System Model of Oral Glucose Absorption:Validation on Gold Standard Data
Chiara Dalla Man, Michael Camilleri, and Claudio Cobelli*, Fellow, IEEE
Abstract—A reliable model of glucose absorption after oralingestion may facilitate simulation as well as pathophysiologicalstudies. One of the difficulties for the development and qualityassessment of such models has been the lack of gold standard datafor their validation. Thus, while data on plasma concentrationsof glucose are available, the rates of appearance in plasma ofingested glucose (Ra) were not available to develop such models.Here we utilize the recent availability of Ra data, estimated witha model-independent multiple tracer technique, to formulate asystem model of intestinal glucose absorption. Two published andtwo new models are tested on this new data set. One of the two newmodels performed best: it is nonlinear, describes the Ra data welland its parameters are estimated with good precision. This modelhas important potential both in simulation contexts, e.g., it canbe incorporated in whole-body models of the glucose regulatorysystem, as well as in physiological and clinical studies to quantita-tively characterize possible impairment of glucose absorption inparticular populations such as elderly and diabetic individuals.
Index Terms—Gastric emptying, gastrointestinal system, meal,OGTT, parameter estimation, physiological model.
I. INTRODUCTION
ORAL ingestion of glucose is used in everyday meals aswell as in the most important clinical test to assess glu-
cose tolerance in humans, through the oral glucose tolerancetest (OGTT). After ingestion, glucose is absorbed in the uppergastrointestinal tract, transported to the splanchnic bed (mostlythe liver) and, finally, reaches the peripheral circulation. Wehave recently proposed a model of glucose absorption [1], [2],which describes the rate of glucose appearance in the periph-eral circulation through a series of linear functions. Howevera model describing or mimicking the mechanisms of glucosetransit through the gastrointestinal tract, would be very usefulto study possible abnormalities of glucose absorption in partic-ular populations, e.g., elderly versus young and diabetic versusnormal individuals, as well as validating simulation models ofglucose regulation. In fact, only a few of the currently avail-able simulation models allow an oral route of glucose adminis-tration [3]–[6] but in all, the glucose absorption process is de-scribed rather simplistically. Modeling glucose absorption after
Manuscript received April 12, 2005; revised June 17, 2006. This workwas supported in part by the National Institutes of Health (NIH) under GrantEB-01975 and Grant DK29953-23. Asterisk indicates corresponding author.
C. Dalla Man is with the Department of Information Engineering, Universityof Padova, Padova 35131, Italy (e-mail: [email protected]).
M. Camilleri is with the Division of Gastroenterology and Hepatology,Mayo Clinic College of Medicine, Rochester, MN 55905 USA (e-mail:[email protected]).
*C. Cobelli is with the Department of Information Engineering, Universityof Padova, Padova 35131, Italy (e-mail: [email protected]).
Digital Object Identifier 10.1109/TBME.2006.883792
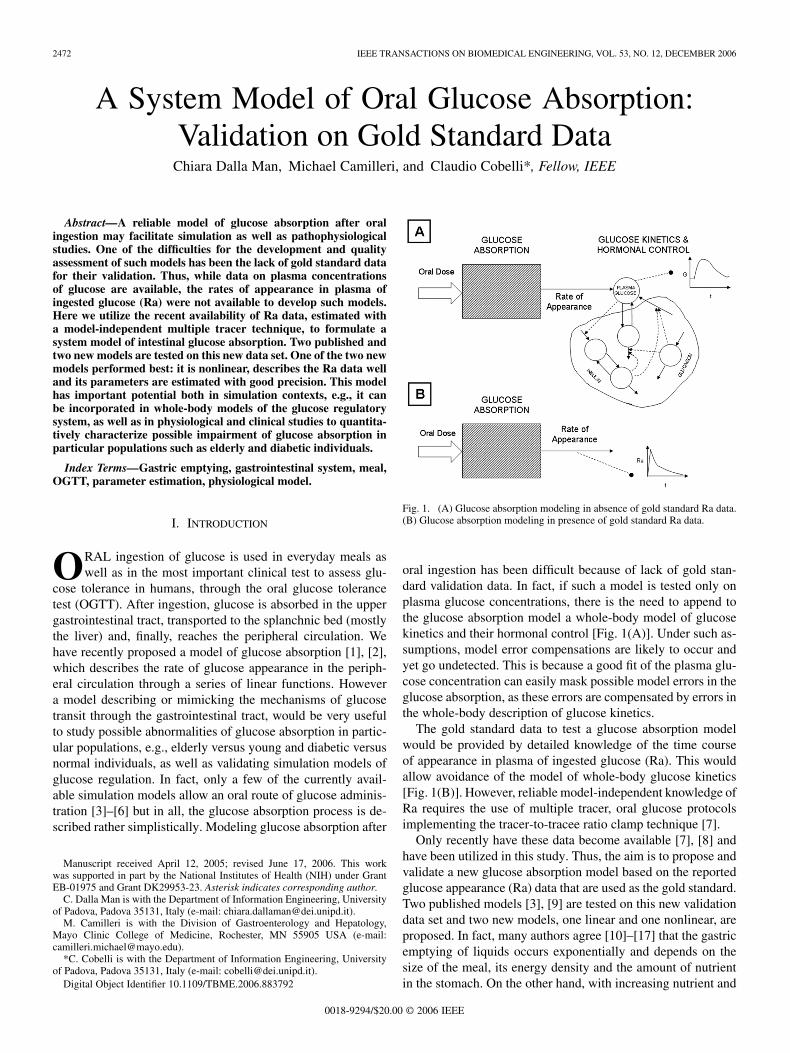
Fig. 1. (A) Glucose absorption modeling in absence of gold standard Ra data.(B) Glucose absorption modeling in presence of gold standard Ra data.
oral ingestion has been difficult because of lack of gold stan-dard validation data. In fact, if such a model is tested only onplasma glucose concentrations, there is the need to append tothe glucose absorption model a whole-body model of glucosekinetics and their hormonal control [Fig. 1(A)]. Under such as-sumptions, model error compensations are likely to occur andyet go undetected. This is because a good fit of the plasma glu-cose concentration can easily mask possible model errors in theglucose absorption, as these errors are compensated by errors inthe whole-body description of glucose kinetics.
The gold standard data to test a glucose absorption modelwould be provided by detailed knowledge of the time courseof appearance in plasma of ingested glucose (Ra). This wouldallow avoidance of the model of whole-body glucose kinetics[Fig. 1(B)]. However, reliable model-independent knowledge ofRa requires the use of multiple tracer, oral glucose protocolsimplementing the tracer-to-tracee ratio clamp technique [7].
Only recently have these data become available [7], [8] andhave been utilized in this study. Thus, the aim is to propose andvalidate a new glucose absorption model based on the reportedglucose appearance (Ra) data that are used as the gold standard.Two published models [3], [9] are tested on this new validationdata set and two new models, one linear and one nonlinear, areproposed. In fact, many authors agree [10]–[17] that the gastricemptying of liquids occurs exponentially and depends on thesize of the meal, its energy density and the amount of nutrientin the stomach. On the other hand, with increasing nutrient and
0018-9294/$20.00 © 2006 IEEE
DALLA MAN et al.: SYSTEM MODEL OF ORAL GLUCOSE ABSORPTION: VALIDATION ON GOLD STANDARD DATA 2473
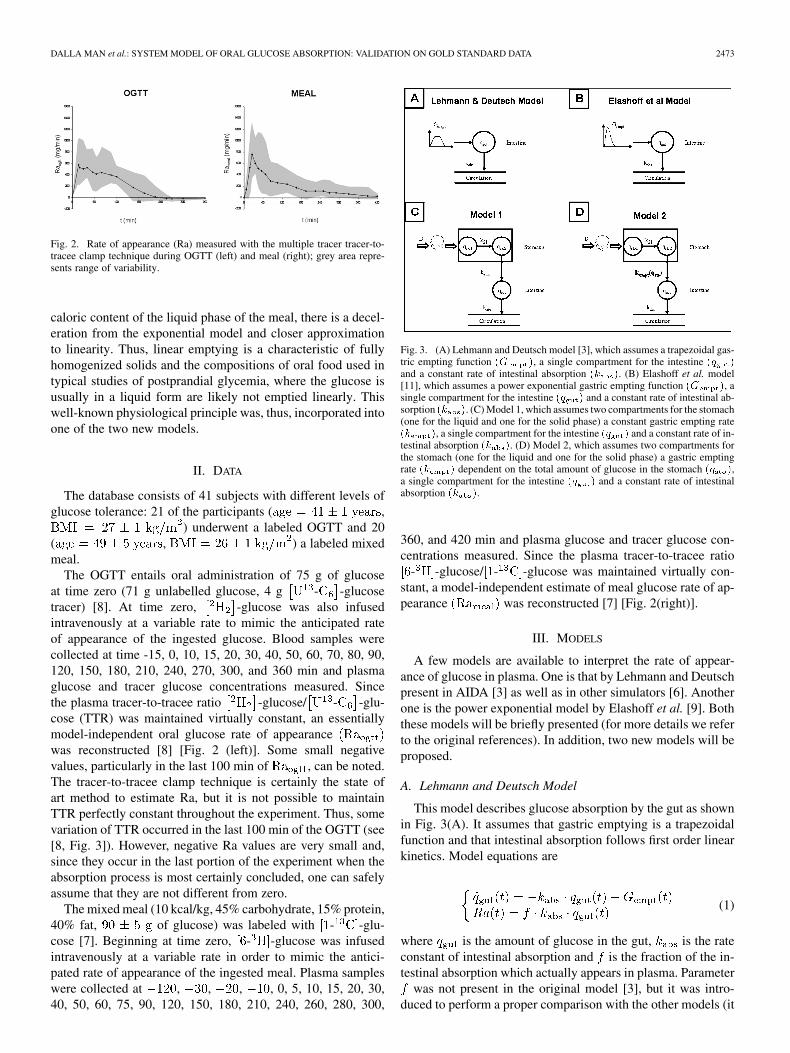
Fig. 2. Rate of appearance (Ra) measured with the multiple tracer tracer-to-tracee clamp technique during OGTT (left) and meal (right); grey area repre-sents range of variability.
caloric content of the liquid phase of the meal, there is a decel-eration from the exponential model and closer approximationto linearity. Thus, linear emptying is a characteristic of fullyhomogenized solids and the compositions of oral food used intypical studies of postprandial glycemia, where the glucose isusually in a liquid form are likely not emptied linearly. Thiswell-known physiological principle was, thus, incorporated intoone of the two new models.
II. DATA
The database consists of 41 subjects with different levels ofglucose tolerance: 21 of the participants ( ,
) underwent a labeled OGTT and 20( , ) a labeled mixedmeal.
The OGTT entails oral administration of 75 g of glucoseat time zero (71 g unlabelled glucose, 4 g - -glucosetracer) [8]. At time zero, -glucose was also infusedintravenously at a variable rate to mimic the anticipated rateof appearance of the ingested glucose. Blood samples werecollected at time -15, 0, 10, 15, 20, 30, 40, 50, 60, 70, 80, 90,120, 150, 180, 210, 240, 270, 300, and 360 min and plasmaglucose and tracer glucose concentrations measured. Sincethe plasma tracer-to-tracee ratio -glucose/ - -glu-cose (TTR) was maintained virtually constant, an essentiallymodel-independent oral glucose rate of appearancewas reconstructed [8] [Fig. 2 (left)]. Some small negativevalues, particularly in the last 100 min of , can be noted.The tracer-to-tracee clamp technique is certainly the state ofart method to estimate Ra, but it is not possible to maintainTTR perfectly constant throughout the experiment. Thus, somevariation of TTR occurred in the last 100 min of the OGTT (see[8, Fig. 3]). However, negative Ra values are very small and,since they occur in the last portion of the experiment when theabsorption process is most certainly concluded, one can safelyassume that they are not different from zero.
The mixed meal (10 kcal/kg, 45% carbohydrate, 15% protein,40% fat, of glucose) was labeled with - -glu-cose [7]. Beginning at time zero, - -glucose was infusedintravenously at a variable rate in order to mimic the antici-pated rate of appearance of the ingested meal. Plasma sampleswere collected at , , , , 0, 5, 10, 15, 20, 30,40, 50, 60, 75, 90, 120, 150, 180, 210, 240, 260, 280, 300,
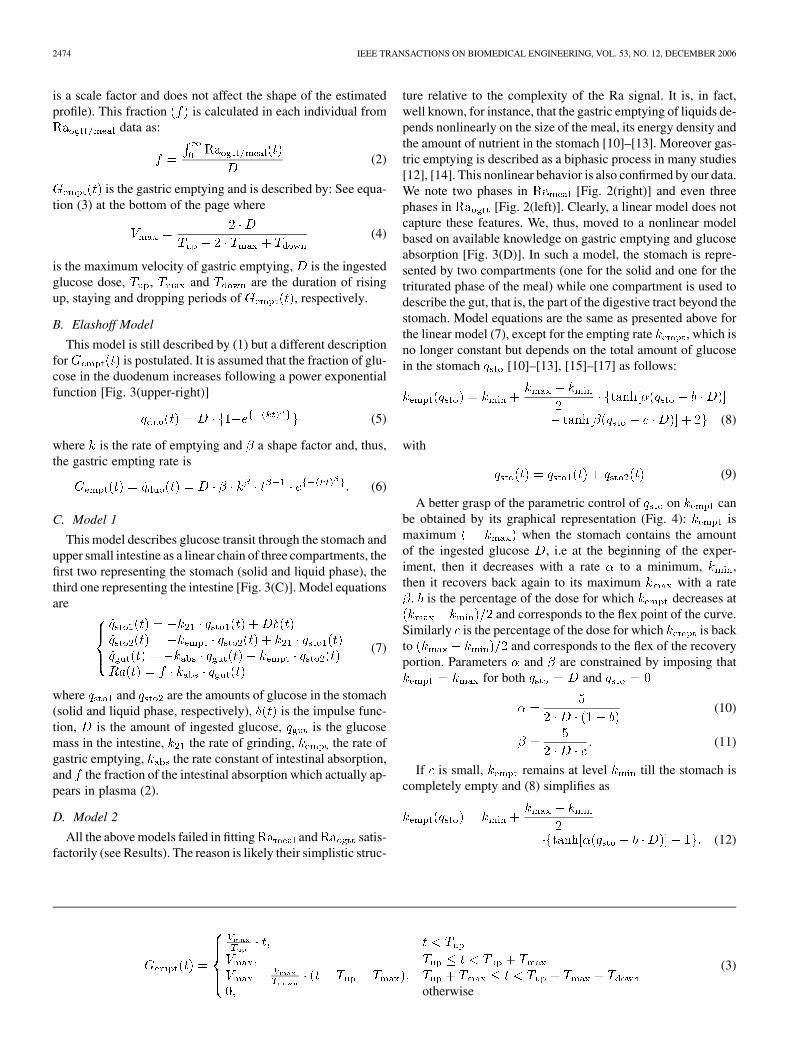
Fig. 3. (A) Lehmann and Deutsch model [3], which assumes a trapezoidal gas-tric empting function (G ), a single compartment for the intestine (q )and a constant rate of intestinal absorption (k ). (B) Elashoff et al. model[11], which assumes a power exponential gastric empting function (G ), asingle compartment for the intestine (q ) and a constant rate of intestinal ab-sorption (k ). (C) Model 1, which assumes two compartments for the stomach(one for the liquid and one for the solid phase) a constant gastric empting rate(k ), a single compartment for the intestine (q ) and a constant rate of in-testinal absorption (k ). (D) Model 2, which assumes two compartments forthe stomach (one for the liquid and one for the solid phase) a gastric emptingrate (k ) dependent on the total amount of glucose in the stomach (q ),a single compartment for the intestine (q ) and a constant rate of intestinalabsorption (k ).
360, and 420 min and plasma glucose and tracer glucose con-centrations measured. Since the plasma tracer-to-tracee ratio
- -glucose/ - -glucose was maintained virtually con-stant, a model-independent estimate of meal glucose rate of ap-pearance was reconstructed [7] [Fig. 2(right)].
III. MODELS
A few models are available to interpret the rate of appear-ance of glucose in plasma. One is that by Lehmann and Deutschpresent in AIDA [3] as well as in other simulators [6]. Anotherone is the power exponential model by Elashoff et al. [9]. Boththese models will be briefly presented (for more details we referto the original references). In addition, two new models will beproposed.
A. Lehmann and Deutsch Model
This model describes glucose absorption by the gut as shownin Fig. 3(A). It assumes that gastric emptying is a trapezoidalfunction and that intestinal absorption follows first order linearkinetics. Model equations are
(1)
where is the amount of glucose in the gut, is the rateconstant of intestinal absorption and is the fraction of the in-testinal absorption which actually appears in plasma. Parameter
was not present in the original model [3], but it was intro-duced to perform a proper comparison with the other models (it
2474 IEEE TRANSACTIONS ON BIOMEDICAL ENGINEERING, VOL. 53, NO. 12, DECEMBER 2006
is a scale factor and does not affect the shape of the estimatedprofile). This fraction is calculated in each individual from
data as:
(2)
is the gastric emptying and is described by: See equa-tion (3) at the bottom of the page where
(4)
is the maximum velocity of gastric emptying, is the ingestedglucose dose, , and are the duration of risingup, staying and dropping periods of , respectively.
B. Elashoff Model
This model is still described by (1) but a different descriptionfor is postulated. It is assumed that the fraction of glu-cose in the duodenum increases following a power exponentialfunction [Fig. 3(upper-right)]
(5)
where is the rate of emptying and a shape factor and, thus,the gastric empting rate is
(6)
C. Model 1
This model describes glucose transit through the stomach andupper small intestine as a linear chain of three compartments, thefirst two representing the stomach (solid and liquid phase), thethird one representing the intestine [Fig. 3(C)]. Model equationsare
(7)
where and are the amounts of glucose in the stomach(solid and liquid phase, respectively), is the impulse func-tion, is the amount of ingested glucose, is the glucosemass in the intestine, the rate of grinding, the rate ofgastric emptying, the rate constant of intestinal absorption,and the fraction of the intestinal absorption which actually ap-pears in plasma (2).
D. Model 2
All the above models failed in fitting and satis-factorily (see Results). The reason is likely their simplistic struc-
ture relative to the complexity of the Ra signal. It is, in fact,well known, for instance, that the gastric emptying of liquids de-pends nonlinearly on the size of the meal, its energy density andthe amount of nutrient in the stomach [10]–[13]. Moreover gas-tric emptying is described as a biphasic process in many studies[12], [14]. This nonlinear behavior is also confirmed by our data.We note two phases in [Fig. 2(right)] and even threephases in [Fig. 2(left)]. Clearly, a linear model does notcapture these features. We, thus, moved to a nonlinear modelbased on available knowledge on gastric emptying and glucoseabsorption [Fig. 3(D)]. In such a model, the stomach is repre-sented by two compartments (one for the solid and one for thetriturated phase of the meal) while one compartment is used todescribe the gut, that is, the part of the digestive tract beyond thestomach. Model equations are the same as presented above forthe linear model (7), except for the empting rate , which isno longer constant but depends on the total amount of glucosein the stomach [10]–[13], [15]–[17] as follows:
(8)
with
(9)
A better grasp of the parametric control of on canbe obtained by its graphical representation (Fig. 4): ismaximum when the stomach contains the amountof the ingested glucose , i.e at the beginning of the exper-iment, then it decreases with a rate to a minimum, ,then it recovers back again to its maximum with a rate
. is the percentage of the dose for which decreases atand corresponds to the flex point of the curve.
Similarly is the percentage of the dose for which is backto and corresponds to the flex of the recoveryportion. Parameters and are constrained by imposing that
for both and
(10)
(11)
If is small, remains at level till the stomach iscompletely empty and (8) simplifies as
(12)
otherwise
(3)

DALLA MAN et al.: SYSTEM MODEL OF ORAL GLUCOSE ABSORPTION: VALIDATION ON GOLD STANDARD DATA 2475
Fig. 4. Qualitative plot of gastric emptying rate (k ) as function of theamount of glucose in the stomach q : it equals k when the stomach con-tains the amount of the ingested glucose, D, then it decreases to a minimum(k ). b is the percentage of the dose for which k decreases at (k �
k )=2; c is the percentage of the dose for which k is back to (k �
k )=2.
IV. IDENTIFICATION
A. A Priori Identifiability
All the models are a priori uniquely identifiable [18], [19] ex-cept Model 1 which is nonuniquely identifiable and there are sixpossible solutions for the parameter vector , onefor each permutation of its elements. Thus, additional assump-tions were needed to make the model uniquely identifiable. Weassumed and chose, out of the two possible solu-tions, the one which guarantees .
B. Parameter Estimation
All models were numerically identified by nonlinear leastsquares [18], [19] as implemented in SAAM II software [20].Measurement error on Ra was assumed independent Gaussianwith zero mean and unknown constant standard deviation (es-timated a posteriori); negative values of Ra were not consid-ered in the optimization process. To favour numerical identifia-bility of Model 2, especially in the meal studies, the constraint
was imposed.
C. Statistical Analysis
Data are presented as mean SE. Unpaired comparisonswere done by Mann-Whitney rank test with significance levelat [21].
V. RESULTS
A. Lehmann and Deutsch Model
The model was not able to fit satisfactorily andprofiles: average model prediction is plotted against Ra mea-surements in Fig. 5 (upper panels, broken line) for both OGTTand meal. The mean sum of squared residual (RSS) was 173363and 185369 for the OGTT and meal, respectively. Parameters
Fig. 5. Upper panel: data ( ) versus predictions during OGTT (right) and meal(left) of Lehmann and Deutsch (broken line) and Elashoff et al. (solid line)Models. Lower panel: data ( ) versus predictions during OGTT (right) and meal(left) of Model 1 (broken line) and Model 2 (solid line).
were estimated with poor precision:(mean %); (122%);
(32%) but in 19 subjects it collapsedto zero; (18%);
(23%); (495%);collapsed to zero in all subjects;
(12%).
B. Elashoff Model
The model was not able to fit satisfactorily andprofiles: average model prediction is plotted against Ra mea-surements in Fig. 5 (upper panels, solid line) for both OGTTand meal. Mean RSS was 180286 and 217213 for the OGTT andmeal, respectively. Parameters estimates are:
(23%); (19%);(185%); (53%);
(50%);(419%).
C. Model 1
The linear model was not able to fit satisfactorily Raogtt andRameal profiles: average model prediction is plotted againstRa measurements in Fig. 5 (lower panel, broken line) forboth OGTT and meal. Mean RSS was 195267 and 223897for the OGTT and meal, respectively. Parameters were esti-mated with good precision:(76%); (36%);
(50%);(12%).
D. Model 2
The nonlinear model fitted and profiles verywell both in average as well as in each individual (not shown)in spite of the large interpatient variability of the glucose ab-sorption profile. Average model prediction is plotted against Rameasurements in Fig. 5 (lower panels, solid line) for both OGTT

2476 IEEE TRANSACTIONS ON BIOMEDICAL ENGINEERING, VOL. 53, NO. 12, DECEMBER 2006
Fig. 6. Average gastric emptying rate estimated during OGTT (left) and meal(right) as function of the amount of glucose in the stomach. During meal (12)instead of (8) was employed in ten subjects and in those cases k = k
when q = 0; this causes that on average, for q = 0, k is differentfrom k .
and meal. Mean RSS was 74781 and 123713 for the OGTT andmeal, respectively, both significantly lower ( and
) than those obtained with the other models. Param-eter estimates are: (23%);
(13%);(56%); (4%);
(19%); (26%);(41%);
(46%); (6%). Parameterwas virtually zero in ten subjects and, thus, (12) in-
stead of (8) was employed; in the remaining subjects(25%).
By comparing model parameters estimated during OGTT andmeal, Model 2 predicts a similar maximum gastric empting rate( versus , notsignificantly different) but lower minimum gastric empting rate,absorption rate and fraction b in meal than in OGTT (
versus , ;versus ,
; versus ,; c is not different in the two tests. As a result gastric
emptying rate as function of are different betweenthe two tests (Fig. 6). It is important to note that, when duringmeal (12) is used instead of (8), one has when
. As a result, on average, for , is differentfrom .
VI. DISCUSSION
A reliable model describing glucose traversing throughthe gastrointestinal tract (esophagus, stomach, intestine),splanchnic bed and its appearance in the peripheral circulationcould be very useful in to assess impairment of glucose ab-sorption e.g., in elderly and diabetic individuals. Alternatively,it could be integrated in a glucose homeostasis simulator topredict plasma glucose and insulin concentrations after oralglucose intake. The aim of this study was, thus, to formulatea system model of the glucose rate of appearance in plasmaafter an oral glucose load and validate it against gold standarddata, i.e., glucose rate of appearance in plasma measured withthe multiple tracer-to-tracee ratio technique both during OGTTand meal [7], [8], [22] in a virtually model-independent way. Infact, testing the model on these Ra gold standard data instead
of plasma glucose concentration avoids the need to append tothe glucose absorption model a whole-body model of glucosekinetics and their hormonal control (Fig. 1), thus avoidingpossible model error compensation.
In this paper, two new models were proposed to mimic glu-cose transport and appearance in the peripheral circulation inhumans: one linear (Model 1) and one nonlinear (Model 2), eachof which consisted of a chain of three compartments, the firsttwo representing the stomach (solid and triturated phase), thethird one representing the intestine [Fig. 3(C) and (D)]. Theyboth assumed a constant rate of intestinal absorption butwere differentiated by the assumptions in the description of thegastric emptying rate, which was constant for the linear model,and dependent on the total amount of glucose in the stomachfor the nonlinear model. As discussed in the introduction, gas-tric emptying of liquids is a nonlinear function of the amountof nutrient in the stomach, especially with different composi-tion or physical nature of the meals, ranging from fully ho-mogenized solids to liquids, which were the oral meals usedin this study. Our results with model 1, which describes gas-tric emptying as a linear process, support the principles summa-rized above since the model is not able to accurately describethe data (Fig. 5, bottom panels, broken line). On the contrary,model 2 showed a very good fit of both OGTT (liquid meal)and homogenized meal Ra data (Fig. 5 lower panels, solid line;sum of squared residuals significantly lower with model 2 thanwith all other models, both during OGTT, , andmeal, ). We also tested two published models [3], [9]which were less accurate in fitting and showed ei-ther systematic overestimation or underestimation of Ra. More-over, neither of the published models provided good precisionin the parameter estimates, while parameters of Model 1 and2 proposed by our study were estimated with reasonable preci-sion. We surmise that the published models’ failure was relatedto their reliance on relatively simplistic model structures whichcannot capture the complexity of the Ra signal, for instance thethree different phases showed by and the two phases evi-dent in (Fig. 2). Conversely, the nonlinearity introducedin the gastric emptying rate, besides being a more realistic de-scription of glucose transit from the stomach to the duodenumbased on scintigraphic quantitation in the literature, also allowsto better fit a variety of curves. From these consid-erations, one concludes that Model 2 is better suited to describeglucose transit through the gastrointestinal tract.
An interesting feature of Model 2 is that its parameters arepotentially usable to quantitatively characterize the different Rapatterns observed in various conditions, e.g., young vs elderlysubjects, men vs women, diabetic vs nondiabetic subjects. Thesestudies are currently underway (see [22], [23]), but one can ap-preciate the potential to use the model by observing the differentparameters that characterize Ra after an OGTT or a meal. Rapresents different profiles: during OGTT absorption shows threedifferent phases (Fig. 2), a peak in the first 30 min, a plateautill approximately min and a rapid decrease to zero inthe last part; conversely during the homogenized meal, the firstpeak is at min (reflecting the slower emptying of solidscompared to liquids), then the curve decreases to zero withoutshowing a plateau. These qualitative features of the curves are
DALLA MAN et al.: SYSTEM MODEL OF ORAL GLUCOSE ABSORPTION: VALIDATION ON GOLD STANDARD DATA 2477
quantitatively characterized by the model: the maximum gas-tric empting rate is similar during the two test meals, while bothminimum gastric empting rate , absorption rate andfractions b and c are lower in the meal study than in the OGTT(Fig. 6). This agrees with the knowledge that glucose absorp-tion is slower during a mixed meal than during an OGTT due tothe presence of other nutrients, mainly fats, which significantlyslow down gastric digestion and intestinalabsorption .
We perceive that this new system model will also prove usefulwhen integrated into whole-body glucose homeostasis simula-tors. Given the great demand of normal life, whole-body glu-cose system simulators, in order to better design diabetic ther-apeutic regimens and to provide a test bed for new closed loopalgorithms and glucose sensors, we anticipate an interest in thismodel and we plan to incorporate it into our simulator which iscurrently in its final stage of development [24]
In conclusion, the availability of and goldstandard data has allowed us to formulate a new model of glu-cose rate appearance after an oral glucose intake which well pre-dicts measured profiles, provides easily interpretable parametersand has great potential to be incorporated in normal life, glu-cose system simulators as well as to quantitatively characterizeglucose absorption in different groups, such as the elderly anddiabetic populations.
ACKNOWLEDGMENT
The authors would like to thank Dr. A. Vella for the helpfuldiscussion on the physiological basis of the model.
REFERENCES
[1] C. Dalla Man, A. Caumo, and C. Cobelli, “The oral glucose minimalmodel: Estimation of insulin sensitivity from a meal test,” IEEE Trans.Biomed. Eng., vol. 49, no. 5, pp. 419–429, May 2002.
[2] C. Dalla Man, A. Caumo, R. Basu, R. Rizza, G. Toffolo, and C. Cobelli,“Minimal model estimation of glucose absorption and insulin sensi-tivity from oral test: Validation with a tracer method,” Am. J. Physiol.,vol. 287, pp. E637–43, 2004.
[3] E. D. Lehmann and T. Deutsch, “A physiological model of glucose-insulin interaction in type 1 diabetes mellitus,” J. Biomed. Eng., vol.14, pp. 235–42, 1992.
[4] R. Hovorka, V. Canonico, L. J. Chassin, U. Haueter, M. Massi-Benedetti, M. Orsini Federici, T. R. Pieber, H. C. Schaller, L.Schaupp, T. Vering, and M. E. Wilinska, “Nonlinear model predictivecontrol of glucose concentration in subjects with type 1 diabetes,”Physiol. Meas., vol. 25, pp. 905–20, 2004.
[5] M. E. Fisher, “A semiclosed-loop algorithm for the control of bloodglucose levels in diabetics,” IEEE Trans. Biomed. Eng., vol. 38, no. 1,pp. 57–61, Jan. 1991.
[6] R. S. Parker, J. H. Ward, N. A. Peppas, and F. J. Doyle. III, “RobustH1 glucose control in diabetes using a physiological model,” AIChE J.,vol. 46, pp. 2537–2549, 2000.
[7] R. Basu, B. D. Camillo, G. Toffolo, A. Basu, P. Shah, A. Vella, R.Rizza, and C. Cobelli, “Use of a novel triple tracer approach to assespostprandial glucose metabolism,” Am. J. Physiol. Endocrinol. Metab.,vol. 284, pp. E55–69, 2003.
[8] C. Dalla Man, K. E. Yarasheski, A. Caumo, H. Robertson, G. K. Tof-folo, K.S. Polonsky, and C. Cobelli, “Insulin sensitivity by oral glucoseminimal models: Validation against clamp,” Am. J. Physiol., vol. 289,no. 6, pp. E954–E959, Dec. 2005.
[9] J. D. Elashoff, T. J. Reedy, and J. H. Meyer, “Analysis of gastric emp-tying data,” Gastroenterology, vol. 83, pp. 1306–12, 1982.
[10] J. N. Hunt, J. L. Smith, and C. L. Jiang, “Effect of meal volume andenergy density on the gastric emptying of carbohydrates,” Gastroen-terology, vol. 89, pp. 1326–1330, 1985.
[11] M. Horowitz, A. Maddox, M. Bochner, J. Wishart, R. Bratasiuk, P.Collins, and D. Shearman, “Relationships between gastric emptying ofsolid and caloric liquid meals and alcohol absorption,” Am. J. Physiol.,vol. 257, pp. G291–8, 1989.
[12] M. Camilleri, J. R. Malagelada, M. L. Brown, G. Becker, and A. R.Zinsmeister, “Relation between antral motility and gastric emptying ofsolids and liquids in humans,” Am. J. Physiol., vol. 249, pp. G580–5,1985.
[13] J. N. Hunt and J. D. Pothak, “The osmotic effects of some simplemolecules and ions on gastric emptying,” J. Physiol. Lond., vol. 154,pp. 254–269, 1960.
[14] J. A. Siegel, J. L. Urbain, L. P. Adler, N. D. Charkes, A. H. Maurer,B. Krevsky, L. C. Knight, R. S. Fisher, and L. S. Malmud, “Biphasicnature of gastric emptying,” Gut, vol. 29, no. 1, pp. 85–9, Jan. 1988.
[15] K. A. Kelly, “Gastric emptying of liquids and solids: Roles of proximaland distal stomach,” Am. J. Physiol., vol. 239, pp. G71–6, 1980.
[16] R. A. Hinder and K. A. Kelly, “Canine gastric emptying of solids andliquids,” Am. J. Physiol., vol. 233, pp. E335–40, Oct. 1977.
[17] P. J. Collins, L. A. Houghton, N. W. Read, M. Horowitz, B. E. Chat-terton, R. Heddle, and J. Dent, “Role of the proximal and distal stomachin mixed solid and liquid meal emptying,” Gut, vol. 32, pp. 615–9,1991.
[18] E. Carson, C. Cobelli, and L. Finkelstein, The Mathematical Mod-eling of Endocrine-Metabolic Systems. Model Formulation, Identifica-tion and Validation. New York: Wiley, 1983.
[19] C. Cobelli, D. T. Foster, and G. Toffolo, Tracer Kinetics in BiomedicalResearch: From Data to Model. London, U.K.: Kluwer Academic/Plenum, 2001.
[20] P. Barrett, B. Bell, C. Cobelli, H. Golde, A. Schumitzky, P. Vicini, andD. Foster, “Saam ii: Simulation, analysis, and modeling software fortracer and pharmacokinetic studies,” Metabolism, vol. 47, pp. 484–92,1998.
[21] D. G. Altman, Practical Statistics for Medical Research. London,U.K.: Chapman and Hall, 1991.
[22] R. Basu, C. Dalla Man, M. Campioni, A. Basu, G. Toffolo, C. Cobelli,and R. Rizza, “The effects of age on insulin secretion and action differin elderly men and women,” Diabetes Suppl. 1, vol. 54, pp. A369–370,2005.
[23] R. Basu, E. Breda, A. Oberg, C. Powell, C. Dalla Man, P. Arora, G.Toffolo, C. Cobelli, and R. Rizza, “Mechanisms of age-associated de-terioration in glucose tolerance: Contribution of alterations in insulinsecretion, action and clearance,” Diabetes, vol. 52, pp. 1738–48, 2003.
[24] C. Dalla Man, R. A. Rizza, and C. Cobelli, “A simulation model of theglucose-insulin system in postprandial state,” in Proc. Diabetes Tech-nology Meeting, 2005, vol. A27.
Chiara Dalla Man was born in Venice, Italy, onMarch 2, 1977. She received the Doctoral degree(Laurea) cum laude in electronics engineering in2000 and the Ph.D. degree in biomedical engineeringfrom the University of Padova in 2005.
She is currently a Post-Doctoral Research Fellowwith the Department of Information engineeringof Padova University. Her main interests are in thefield of mathematical modeling of metabolic andendocrine systems.
Michael Camilleri received undergraduate trainingand the M.D. degree from the University of Malta,Malta, in 1975. He pursued academic and clinicaltraining at Hammersmith Hospital and the RoyalPostgraduate Medical School in London, U.K. Hisreceived the Masters degree from the University ofLondon, London, U.K.
He was elected to Fellowship of the Royal Col-leges of Physicians of London and Edinburgh. He hasbeen on staff at Mayo Clinic since 1987 and holdsthe rank of Professor of Medicine and Physiology in
the Mayo Clinic College of Medicine. In 2001, he was named the Athertonand Winifred W. Bean Professor at Mayo Clinic College of Medicine. He hasbeen instrumental in translating basic understanding of physiology and phar-macology of the autonomic and neuromuscular component of the gut to the di-agnosis and treatment of patients with functional and gastrointestinal motilitydisorders. His work has led to successful applications for extramural funding
2478 IEEE TRANSACTIONS ON BIOMEDICAL ENGINEERING, VOL. 53, NO. 12, DECEMBER 2006
from foundations, NIH and pharmaceutical companies. He served for four yearson the Gastrointestinal Drugs Advisory Committee of the FDA. He currentlyholds two RO1 grants and a K24 or Clinical Research Mentor Award from theNIH. He is the first author or senior author of over 300 original articles, hasco-authored 3 books, and has mentored more than 50 research fellows. He hasreceived a number of awards including the Mayo Clinic Department of InternalMedicine’s Outstanding Investigator Award and Outstanding Mentor Award, theJanssen Research Foundation Clinical Research Award in 1996, the FunctionalBrain-Gut Research Group Research Scientist Award in 2000, the AGA/Milesand Shirley Fiterman Foundation Joseph B. Kirsner Clinical Research Awardin Gastroenterology in 2003, and the Sixth Janssen Research Award in 2003.He was an Associate Editor of Gastroenterology from 1996 to 2001, Co-Editorof Neurogastroenterology and Motility from 2001 to 2006, and is currently Ed-itor-in-Chief of Clinical Gastroenterology and Hepatology.
Claudio Cobelli (S’67–M’70–SM’97–F’03) wasborn in Bressanone (Bolzano), Italy, on February 21,1946. He received the Doctoral degree (Laurea) inelectrical engineering in 1970 from the University ofPadova, Padova, Italy.
From 1970 to 1980, he was a Research Fellowof the Institute of System Science and BiomedicalEngineering, National Research Council, Padova,Italy. From 1973 to 1975, he was Associate Professorof Biological Systems at the University of Florence.From 1975 to 1981, he was Associate Professor
of Biomedical Engineering at the University of Padova. In 1981, he becomeFull Professor of Biomedical Engineering at University of Padova. His mainresearch activity is in the field of modeling and identification of physiologicalsystems, especially endocrine-metabolic systems. He has published around 200papers in internationally refereed journals. He is co-editor of CarbohydrateMetabolism: Quantitative Physiology and Mathematical Modeling (Wiley,1981), Modeling and Control of Biomedical Systems (Pergamon, 1989) andModeling Methodology for Physiology and Medicine (Academic, 2000). He isco-author (with E. R. Carson and L. Finkelstein) of The Mathematical Modelingof Metabolic and Endocrine Systems (Wiley, 1983) and (with D. Foster andG. Toffolo) of Tracer Kinetics in Biomedical Research: from Data to Model(Kluwer Academic/Plenum).
He is currently Associate Editor of IEEE TRANSACTION ON BIOMEDICAL
ENGINEERING and of Mathematical Biosciences. He is on the Editorial Boardof American Journal of Physiology: Endocrinology and Metabolism, and hasbeen in the past on the Editorial Board of Control Engineering Practice;Diabetes, Nutrition & Metabolism; Diabetologia, and American Journal ofPhysiology: Modeling in Physiology. He has been Chairman 1999–2004) ofthe Italian Biomedical Engineering Group and has been Chairman (1990–1993and 1993–1996) of IFAC TC on Modeling and Control of Biomedical Systems.He is a member of International Federation for Medical and Biological En-gineering, the Biomedical Engineering Society, the Society for MathematicalBiology, the American Diabetes Association, and the European Association forthe Study of Diabetes.