Embed Size (px)
Citation preview

9 - 12 SCIENCE CURRICULUM GUIDE
SUPPLEMENTAL MATERIAL
As the 9 - 12 Science Curriculum Guide Committee worked it was determined that several of themembers had used experiments that would be of interest to all science teachers. As a result, thispacket was prepared. It includes experiments that are inexpensive, effective and are easy to do. The experiments included are:
1. How Big Is Our Solar System? 2. Demonstrations of the Effects of Different Densities 3. Soil Erosion and Deposition Laboratory 4. Liquefaction of Soil 5. Dermal and Vascular Tissue Lab Procedures 6. The Remarkable Shooting Idioblasts 7. Osmosis - Diffusion Lab 8. Owl Pellet Lab 9. Woolly Worm Lab10. The Electric Pickle Demo11. A Safe Ethanol Cannon12. Chemiluminescent Necklaces13. Methanol Flame Tests14. Mystery Sign15. Patriotic Colors16. Natural Indicators17. Rainbow Lab18. Nitrogen Oxide Equilibrium19. Hydrogen and Oxygen Generating, Collecting and Testing20. Diffusion of Ideal Gases21. Physics Lab Investigation: Diver22. Physics Lab Investigation: Penny Lab23. Which of Newton �s Laws Can Be Demonstrated by a Soda Pop Can?
Page 2
HOW BIG IS OUR SOLAR SYSTEM?
CONCEPTS:1. Our solar system contains nine planets.2. Our solar system is a vast place.3. The planets that make up our solar system are much smaller than the sun.4. These vast distances can be viewed through the use of a scale model.
OBJECTIVES:1. Through the introduction of ratio and proportion, the students will verify that large
things can be reduced in size to a point where they can be easily seen.2. Using the ratio scale provided by the instructor, the students will construct a model of
the nine planets found in our solar system.3. Using the distance scale provided by the instructor, the students will, after placing the
model of the sun on the playground, correctly position as many of the nine planets asthey were able to place on the school grounds.
4. Using the map of their community, the students will then locate on that map thecorrect location of any planets they were not able to be placed on the school grounds. If possible, the students (accompanied by the instructor) will then walk to thoselocations where the planets would appear on the community map and note thelocation and its relationship to the spot on the school grounds where the model of thesun was placed.
5. Using a map of the western hemisphere, the students will then, using the scaleprovided, note the position of the nearest star to our sun.
SAFETY:Students may not leave the school grounds without the instructor.
MATERIALS (for class):%¸1 basketball%¸Clay%¸9 metric rulers%¸1 metric trundle wheel%¸9 long pins%¸9 wooden stakes (3' x 1" x 0.5")%¸Felt pens%¸City maps
%¸Map of the western hemisphere%¸Scale showing size and distance of the
solar system%¸35-mm camera with a wide angle lens%¸Parental permission slips (if leaving the
school grounds)
Page 3
BACKGROUND INFORMATION:
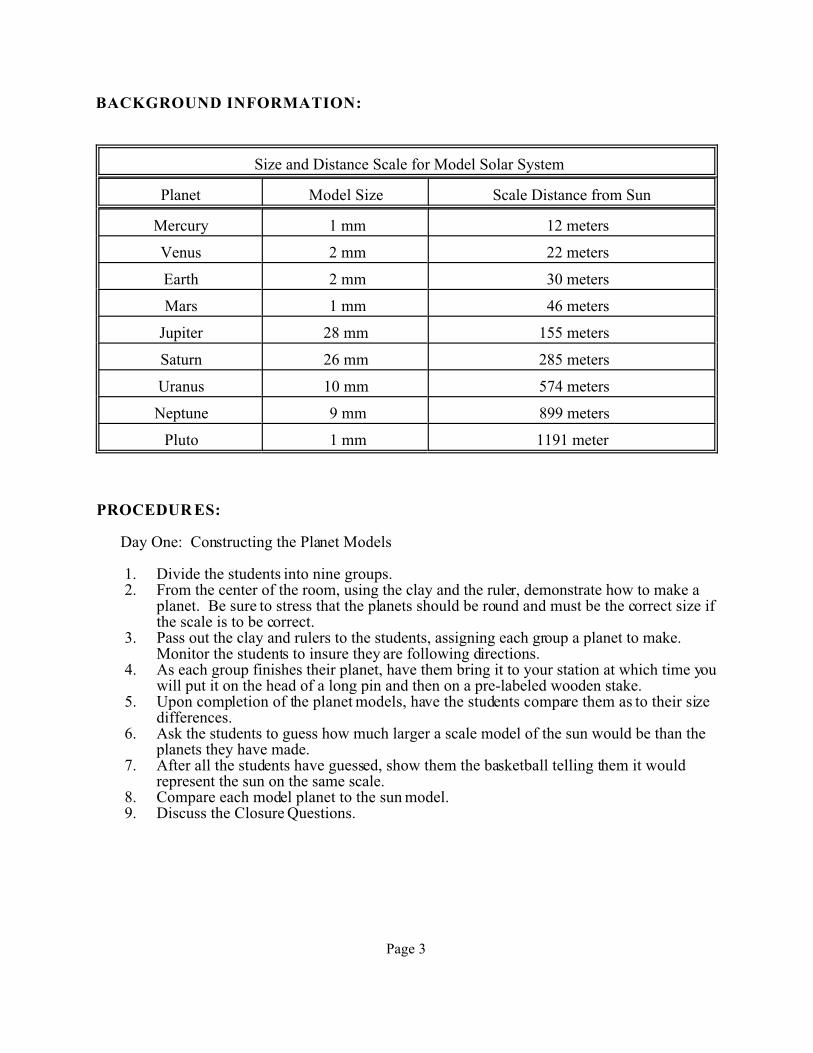
Size and Distance Scale for Model Solar System
Planet Model Size Scale Distance from Sun
Mercury 1 mm 12 meters
Venus 2 mm 22 meters
Earth 2 mm 30 meters
Mars 1 mm 46 meters
Jupiter 28 mm 155 meters
Saturn 26 mm 285 meters
Uranus 10 mm 574 meters
Neptune 9 mm 899 meters
Pluto 1 mm 1191 meter
PROCEDUR ES:
Day One: Constructing the Planet Models
1. Divide the students into nine groups. 2. From the center of the room, using the clay and the ruler, demonstrate how to make a
planet. Be sure to stress that the planets should be round and must be the correct size ifthe scale is to be correct.
3. Pass out the clay and rulers to the students, assigning each group a planet to make. Monitor the students to insure they are following directions.
4. As each group finishes their planet, have them bring it to your station at which time youwill put it on the head of a long pin and then on a pre-labeled wooden stake.
5. Upon completion of the planet models, have the students compare them as to their sizedifferences.
6. Ask the students to guess how much larger a scale model of the sun would be than theplanets they have made.
7. After all the students have guessed, show them the basketball telling them it wouldrepresent the sun on the same scale.
8. Compare each model planet to the sun model. 9. Discuss the Closure Questions.
Page 4
Day Two: Constructing the Solar System Model
10. Have the teams bring their planet models outside.11. Assemble the teams at the farthest point on the school grounds as possible.12. At that point, have one student hold the basketball.13. Using a trundle wheel or other measuring device, measure off 12-meters and place the
team that made Mercury at that point.14. Using the trundle wheel and the scale, continue measuring off the distances from the sun
and placing the planets in their correct locations until you run out of space or planets,depending upon the size of your school grounds.
15. At that point, using a 35-mm camera with a wide angle lens, take as many pictures aspossible to get the model into perspective so that the photographs may later be assembledon a bulletin board for a visual display of the solar system model.
16. Have the team members take turns holding the models so they all can step back to avantage point and view the model.
17. Return to the classroom and using the local city map, indicate the locations of all theplanets that could not be placed on the school grounds.
18. If a walking field trip to these locations is not possible, take a photograph of the locationwith the planet on the spot. If possible include a landmark that the students willrecognize in the photograph.
19. On a map of the western hemisphere, locate the nearest star to our sun which would be aspot 4,000 miles away from your school. Tell the students that is where the nextbasketball would be found.
SOURCE: Earth Science, Teacher's Edition, Holt Publishing.
Page 5
STUDENT ACTIVITY
NAME_________________________
Figures not available HOW BIG IS OUR SOLARSYSTEM?
SAFETY:
Do not leave the school grounds without your instructor.
MATERIALS (Day One):
%¸Clay%¸1 metric ruler
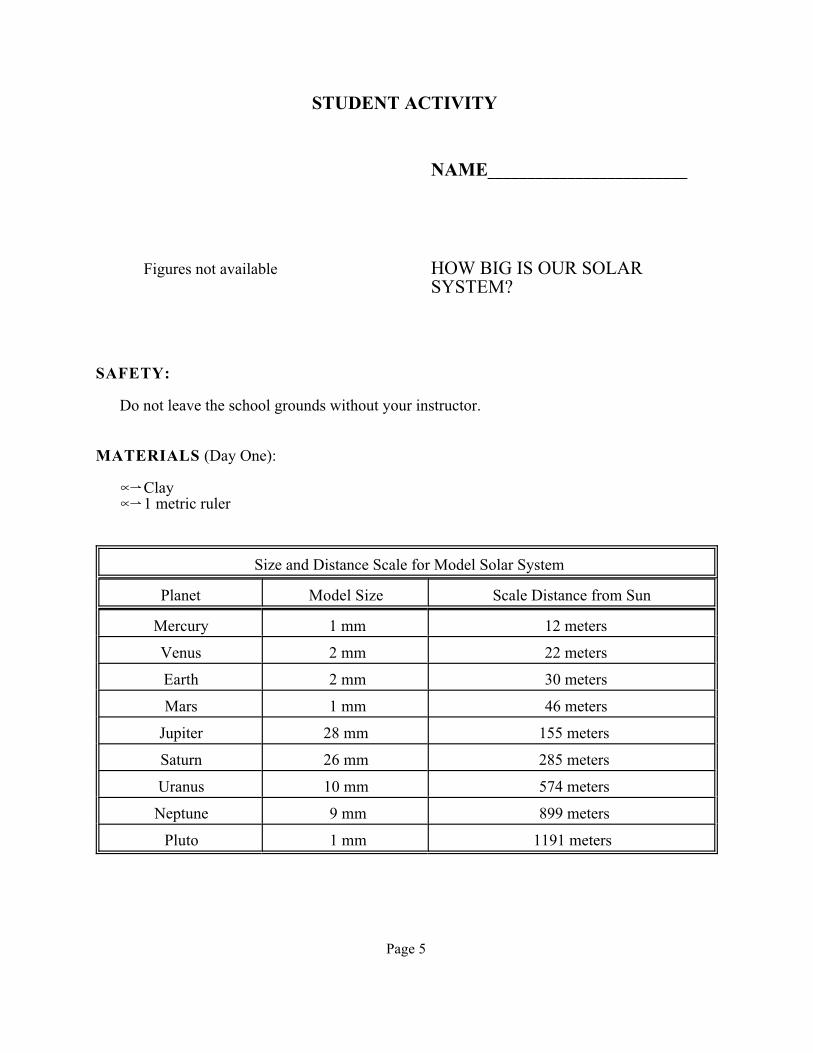
Size and Distance Scale for Model Solar System
Planet Model Size Scale Distance from Sun
Mercury 1 mm 12 meters
Venus 2 mm 22 meters
Earth 2 mm 30 meters
Mars 1 mm 46 meters
Jupiter 28 mm 155 meters
Saturn 26 mm 285 meters
Uranus 10 mm 574 meters
Neptune 9 mm 899 meters
Pluto 1 mm 1191 meters
Page 6
PROCEDURES (Day One):
1. Using the clay and the metric ruler, make the planet assigned to you by your instructor.
2. Upon completion of your planet, take it to your instructor for approval and mounting.
3. Compare the size of your planet to the other eight. Record your observations below:
4. Compare the size of your planet to the sun. Record your observations below:
CLOSURE QUESTIONS (Day One):
1. Why didn't we make asteroid models, or models of the moon or comets?
2. Why are the planet models so small?
MATERIALS (Day Two):%¸Planet Models%¸Trundle Wheel%¸1 City Map%¸1 Western Hemisphere Map%¸1 felt pen
PROCEDURES (Day Two):
1. Accompany your instructor outdoors to place as many planets as possible on the schoolgrounds using the scale provided.
2. Using the local city map, locate the correct position of any planets that were not able to beplaced on the school grounds.
3. Using a map of the western hemisphere, note the position of the nearest star to our sun.
4. What planets did not fit on your school grounds?
Page 7
5. Where should you put the asteroids?
6. What would the path of a comet be like?
7. Based on your model, which planet do you think we probably know the least about? Explain.
8. If a rocket can travel at 40,000 km/hr, how old would you be by the time you reachedPluto?
9. What will be required before man can travel to another star?
ANSWERS T O CLOSURE QUESTIONS:
1. We didn't make asteroid models or models of the moon or comets because they would betoo small on this scale.
2. The planet models are so small because if we make them larger, then the distance scalewould also increase.
3. Answers will vary. 4. The asteroids would be placed between Mars and Jupiter. 5. The path of a comet would be elliptical and cross over the orbital paths of several planets. 6. Because of its small size and great distance from the earth, we probably know the least
about Pluto. 7. Answers will vary depending on current age. 8. Answers will vary.
CORRELATION OF SFA:
Earth Science - AstronomyProcesses and Skills: Observing, Communicating, Comparing, Organizing, Relating, andInferring.
Submitted by Frederick L. Anderson, Georgia-Cumberland Academy
Page 8
DEMONSTRATION OF THE EFFECTS OF DIFFERENT DENSITIES
OBJECTIVES:
1. Students will compare the densities of water, regular soda pop and diet soda pop.
2. Students will develop a hypothesis to explain the different densities of diet and regularsoda pop.
MATERIALS:
%¸Water %¸Regular soda pop%¸Diet soda pop (of the same kind)%¸A 2.0 liter ungraduated cylinder (A large tub or bucket will also work, but it is less
impressive.)
PROCEDUR ES:
1. Fill the cylinder with water, leaving enough space to accommodate the two cans of sodapop.
2. Place the regular soda pop into the water being careful to eliminate any air that may gettrapped under the can.
3. Using the same procedure, add the can of diet soda to the water.
4. You may wish to allow students to test some of their hypotheses. (Reverse the order ofplacing the cans in the water, etc.)
Submitted by Frederick L. Anderson, Georgia-Cumberland Academy
Page 9
SOIL EROSION AND DEPOSITION LAB
OBJECTIVES:
Upon completion of this laboratory you should be able to --
- Explain the effect of different amounts of water on the erosion patterns of a soil.
- Explain the effect of water on different angles of soil slope.
BACKGROUND:
Water has the energy to erode and deposit earth in varying patterns depending upon the angleand the amount of flow. This laboratory will investigate these patterns.
MATERIALS:
%¸1 cake pan or a cookie tin whose end will fit into a cake pan or other wide container
%¸Approximately 2 liters (2 quart jars) of loose soil mix with only small gravel and withoutgrass (obtain in garden, by the edge of the road or under the grass)
%¸Supports such as books, bricks or blocks of wood
%¸Quart size wide-mouthed jar or pouring container so that you can pour water in a steadystream.. Small-mouthed containers cause the water to flow irregularly.
%¸Water
PROCEDURES:
NOTE - This lab should be done outdoors or in a sink or bathtub where there will be few problems with water spillage.
1. Make a stream table.This can be done in the following ways:
One way is to use a cake pan and prop one end up with any materials that you have sothat the pan will be turned for the longest slope and will be steady. You will need tochange the angle of the pan so you may need several props. Then cover the upper 3/4 ofthe surface with a 2 cm thick layer of moist sand and small gravel mix.
Figure not available
Page 10
Another method is to take a cookie tin or a thin piece of wood approximately the size of acookie tin and turn it so that you will be using the longest slope, and prop up one end withany good steadying prop material and prop the middle so that the tin will not bend whenloaded with the sand and gravel mix. Now set the lower end into a container that willhold water and form a miniature lake. Then cover the upper 3/4 of the cookie tin surfacewith a 2 cm thick layer of moist sand and small gravel mix.
2. Raise one end of the pan, cookie tin, or other type of surface approximately 6 cm.
3. Fill the lower end of the cake pan or the container at the end of the cookie tin with water.
4. Place the lip of the water pouring container close to the top of the sloping sand-coveredsurface and begin pouring water in a steady stream of approximately 1 cm diameter. Thispouring should last for approximately 15-20 seconds. YOU MAY NEED TO REPEATTHIS UNTIL YOU GET A STEADY 15-20 SECOND FLOW.
5. As the water runs to the end of the pan, observe any changes on the surface of the soil, onthe lake, and on the stream itself. Note any places where soil is deposited.
6. Next change the slope of the stream by lifting and propping up the end so that it will be12-14 cm high.
7. Repeat step number 4 and note the effects of this change.
8. Now increase the volume of water by keeping the lip of the pouring container close to theupper surface of the soil and pour a steady stream of water of approximately 2 cmdiameter for approximately 10 seconds. Observe and note the effects of this change.
QUESTIONS:
1. What, if any, deposition features formed?
2. Was there any evidence of sideward erosion of the stream bed?
3. Was there any evidence of undercutting the stream banks?
4. Was there any meandering?
5. What size particles were carried the farthest by the stream movement?
6. What changes in the stream occurred as you increased the steepness of the slope of thestream table?
7. What changes in the stream occurred when you increased the volume of water?
8. What effect does increased stream velocity have on erosion and deposition?
Submitted by Don Quackenbush, Spring Valley Academy
Page 11
LIQUEFACTION OF SOIL
OBJECTIVES:
1. Students will see the liquefaction effects of water on fine grained soils such as pumice.
2. Students will relate liquefaction to natural phenomena such as sink holes, mud slides, and"quicksand."
MATERIALS:
%¸Water%¸Pumice (if available) OR Baking Soda
PROCEDURES:
1. Add enough water to a handful of pumice (baking soda) to make it hold together and bemoldable, but not so much that it becomes runny.
2. Demonstrate how it may be formed into a block-like shape.
3. Holding the "block" in the palm of your open hand, simulate an earthquake by bumpingyour hand from underneath with your other hand. The block will form a "puddle" as aresult of the vibration and the water.
Submitted by Frederick L. Anderson, Georgia-Cumberland Academy
Page 12
DERMAL AND VASCULAR TISSUE LAB PROCEDURES
SUPPLIES:
%¸Living leaf (lettuce, iris, wanderingjew, yucca, Swedish Ivy, etc.)
%¸Celery%¸Microscope%¸Microscope slides and cover slides%¸Dropper%¸Small beaker of water for making
wet mounts
%¸Forceps%¸Single-edged razor blade%¸Cutting surface%¸Ruler%¸Optional - prepared microscope slides of
epidermal cell%¸Paper toweling for clean-up
NOTE TO INSTRUCTOR:Start soaking seeds for the "Seed Lab".
PROCEDURES:
I. Epidermis
1. Select a leaf and tear it in half.2. Take a small piece of very thin translucent tissue from the edge of the tear.
(Approximately this |__| size.)3. Make a wet mount of the epidermal tissue. 4. Observe the specimen under the microscope and answer the following questions on your
lab report form. NOTE: You may want to use prepared microscope slides to make theseobservations.a. Are the guard cells open or closed?b. Do the guard cells have chloroplasts in them?c. Do the epidermal cells surrounding the guard cells have chloroplasts?d. How many other epidermal cells are in direct contact with the guard cells?
II. Vascular bundles
1. Using celery, break the stem and pull the stringy fibers from the surface of the stalk.2. Make some "tissue thin" slices along the stringy fibers (vascular bundles) and make a wet
mount of them.3. Observe this tissue under the microscope starting with the low power and then increase
the magnification.a. Do any of the cells look like either xylem or phloem tissue?b. If so, which kind? xylem or phloem c. What structures make these cells easily identifiable? Figure not availabled. Why are these structures present?
Page 13
QUESTIONS FOR REVIEW:
1. Describe how gases enter and exit the leaf.2. Why is the epidermis important?3. What is the periderm?4. Describe xylem and phloem tissue.5. How will knowing and understanding this material help you in working with plants.
Submitted by Don Quackenbush, Spring Valley Academy
Page 14
THE REMARKABLE SHOOTING IDIOBLASTS
The ejection of sharp, needle like crystals from specialized spindle-shaped cells of the plantDieffenbachia is a phenomenon that deserves more attention from biology teachers and, perhapsresearchers. Students are fascinated when they see these distinctive cells (idioblasts) shoot outneedle after needle like some kind of automatic microscopic blowgun. But the performance andstructure of these achlorophyllous cells should be used for more than just laboratoryentertainment.
Dore (1963) first reported the presence of idioblasts in Dieffenbachia (Fig. 1). Each idioblastcontains a large bundle of double-pointed, sharp, needle like crystals called raphides. Forcibleejection of the raphides can sometimes be observed under the microscope (Fig.2).
Because the raphides consist of calcium oxalate, they are a good example of ergastic (nonliving)cell inclusions. Perhaps these cells help the plant to "dispose" of excess oxalate by forming theinsoluble raphides in special vacuoles. Moreover, the shooting of the raphides may be anevolutionary adaptation with real survival value. An animal that tries to eat the stem or leaves ofDieffenbachia is not likely to repeat the experience.
The common name of Dieffenbachia is dumb cane. It has long been known that if a humanchews a piece of leaf or stem of Dieffenbachia, mouth and throat paralysis will result. Theparalysis may prevent eating or speaking for as much as a full day.
PARALYSIS
After the discovery of the raphides, the calcium oxalate of which they are composed wassuspected of causing the throat paralysis. However, Walter and Khanna (1972) showed that themacerated tissue of Dieffenbachia contains a proteolytic enzyme similar to scorpion and snakevenoms. The sharp raphides probably make it possible for the enzyme to penetrate the mouthand throat tissues. Using the scanning electron microscope, Sakai and Nagao (1980)demonstrated the presence of grooves on opposite sides of the raphides. These grooves couldenhance the entrance of the venomlike enzyme. Sakai and Nagao also believe their picturesshow barbs along the length of the raphides which might prevent dislodging.
Figure not available Figure not available
FIGURE 1 A Dieffenbachia picta idioblast withits nipple-like tips undamaged and containing abundle of sharp calcium oxalate crystals.
FIGURE 2 Two idioblasts, one firing and one not. Because of the limited depth of field, it is not possible to have both the cell and the needles in focus at the same time.Nevertheless, the blurred image of an emerging needle can be seen.
Page 15
Figure not available Figure not available
FIGURE 3 Scanning electron micrograph of the undamaged tip of a Dieffenbachia idioblast. 1650X.
FIGURE 4 Dieffenbachia idioblast with damaged tip. Such cells are able to eject raphides in a blowgun-like way. 2750X.
EJECTION MECHANISM
If macerated Dieffenbachia tissue is placed in a drop of tap water on a glass slide and observedwith a light microscope, it will be seen that some idioblasts will be ejecting while others will not. Why the difference? A probable answer was obtained by scanning electron and lightmicroscopic studies of idioblasts. Video observations of fresh preparations of idioblasts wereespecially revealing.
Preparing Material for Observation
1. Grind a piece of fresh Dieffenbachia leaf in a small amount of tap water using a mortar andpestle.
2. After grinding, add tap water to bring the volume to about 10 ml.3. Strain the resulting liquid through a tea strainer to remove the larger leaf debris.4. Pour the strained liquid into a test tube.5. After a short wait, draw a drop of this liquid from the bottom of the test tube where the
idioblasts settle.6. Place the drop on a slide, add a coverslip, and examine under 100X magnification. Locate a
field with several idioblasts. Greater magnification can be used later to observe individualidioblasts.
Observing Ejecting Cells
A color video camera with microscope adapter makes it possible to see detail not visible with themicroscope alone. Even under 430X it is difficult to see a difference between cells that are firingneedles and those that are not.
The much enlarged picture on the TV monitor shows that cells not ejecting have smooth, roundnipple-like tips, while ejecting cells invariably have rough and jagged (i.e., broken off) tips. Thenumber of raphides ejected at a time seems to depend on the amount of damage to the tip. Thisdifference between intact and fractured tips was confirmed by the use of a scanning electronmicroscope (Figs. 3, 4).
Page 16
EJECTION FORCE
The fact that an idioblast does not fire until the tip is broken does not answer the question ofwhat force is ejecting the raphides. They are almost certainly forced out by the high turgidity inthe idioblasts.
The bundle of raphides is surrounded by a thick, jelly-like polysaccharide or mucopolysaccharidematerial (Sakai and Nagao 1980). Osmosis and/or a imbibition would produce pressure on allsides of a raphide. On the TV monitor, when a cell has fired its last raphide, other particulatematter continues to be ejected by the cell. This would seem to be supportive evidence for theturgor hypophysis.
ACKNOWLEDGMENT
Special thanks are due to Gardner-Denver Division of Cooper Industries for the use of theirscanning electron microscope, and to Mr. Gene Kock and Mrs. Wilma Campbell for theirtechnical assistance.
FURTHER READING
Dore, W.G., Crystalline raphides in toxic houseplant Dieffenbachia, Journal American MedicalAssociation, 1963, 185, 1045.
Middendorf, E.A., Plants with blowguns, Turtox News, 1968, 46, 162-164.
Sakai and Nagao M., Raphide structure in Dieffenbachia maculata, Journal American SocietyHorticultural Science, 1980, 105, 124-126.
Walter, W.G. and Khanna, P.N., Chemistry of the aroids, Part 1 -- Dieffenbachia seguine,Dieffenbachia amoena, and Dieffenbachia picta, Economic Botany, 26, 363-372.
Submitted by Don Quackenbush (Spring Valley) taken from CAROLINA TIPS, Vol. 45, No. 7 (July 1,1982) by FATHER EUGENE MIDDENDORF, From the Biological Sciences Department, QuincyCollege, Quincy, Illinois, 62301.
Page 17
OSMOSIS - DIFFUSION LAB
Want a painless, fun, and cheap way to demonstrate the various aspects of these concepts? Arehypotonic, hypertonic, isotonic, and osmosis just a bunch of words to your students? Use raweggs, vinegar, clear corn syrup, and salt to make these all come alive in your class! This lab canbe done on many levels of complexity, detail, and depth of knowledge, but even on a simplelevel, it is a fairly vivid way to illustrate movement of substances.
Remove the shells of raw eggs by placing them in a bowl and covering them generously withvinegar. I use 6-8 in a large mixing bowl and fill the bowl with vinegar to prevent the vinegarfrom becoming saturated as the calcium carbonate shells dissolve. Let set at least 12 hours, oruntil the shell gets soft enough to be scraped off by fingernail as you run tap water over the eggs. Set one egg in a beaker or jar of tap or distilled water, and one in beaker of clear corn syrup(Karo brand, for example). Let them set overnight again after showing them to the students andcompare them the next day. The water egg will be quite bloated, and the Karo egg nicelyshriveled. After discussing why the changes in size, switch the eggs and compare again the nextday. Since the eggs are raw, they make marvelous cell models with the flexible membrane, fairlytransparent albumin, and visible yolk. Place an egg in an empty culture dish and puncture themembrane of each egg to show the effects of water moving in or out.
One can measure initial mass, volume displaced, or girth of the eggs, and then compare after allthe various treatments. One can set up an isotonic saline solution in addition by adding salt towater until egg stays suspended midway. This is cheap enough for lab partners to do but nice tolead the entire class together as you do the demonstration and discussion.
A version of this lab is in the Modern Biology Laboratories, 1989, pp. 37-38. Record the mass ofan egg to the nearest 0.1 g. The shells are removed by using 1 M HCl. Keep the egg submergedwith a smaller beaker filled with water on top of it for 15 minutes. Remove egg with tongs andrinse under tap water. Reweigh the egg. Place the egg in a beaker of water for 20 minutes andthen reweigh. Finally place in beaker of Karo syrup and let set overnight. The next day removethe egg, rinse, blot and reweigh.
Submitted by Nikki Gonzalez, Loma Linda Academy
Page 18
OWL PELLET LAB
This is a cheap lab if you or the students collect the pellets yourselves, a likely possibility inmany areas. Prices from supply companies vary but run about $2-$3 each pellet. Owls eat entireanimals but cannot digest some parts such as bones, fur, and feathers. The pyloric openingprevents these from entering the intestine. When enough material is present, the owl regurgitatesan oval pellet. If you collect the pellets yourself, either store in bags in the freezer or store driedwith a moth ball or other insecticide inside.
Place the pellet in a dissecting pan and tease carefully apart with needle probes. The bones insideare cleaned of muscle and other soft tissue. The prey animals can be identified mainly by themandibles, teeth, and skulls but other major bones can be counted to estimate the number ofanimals in the pellet. Insect exoskeletons, snail shells, and other invertebrates materials may befound as well.
Many levels of this lab investigation are possible also: students can have a great deal of fun andexploration just cleaning and taping the bones to a piece of paper--sometimes in the shape of theanimal if enough bones are found. Skulls can be identified with the skull charts in mammal fieldguides. Students really enjoy sliding the incisors out of the jaws of rodents--since the incisorsgrow the animal's whole life, there is a surprising amount tucked up inside the jaw. Generalquestions about the biotic relationship of the owls and prey, how many species of prey lived inthe ecosystem collected from, and percentages of each species represented in the total number ofanimals in all the pellets per class can be used to lead the class through many principles ofecology. A more detailed lab description can be found in Modern Biology Laboratories, 1989,pp. 303-308.
Submitted by Nikki Gonzalez, Loma Linda Academy
Page 19
WOOLLY WORM LAB
Want to show selection pressure in action? Scatter 200 2-inch pieces of 12 or so different colorsof yarn around a school yard. For a class of 30 students, I use about 40' x 40' grassy area, but dirtis fine. Let the students be the predators of these larval stage of some insects, the wooley worms. Let them collect as many as possible in a short period of time, usually only about 2-3 minutes. Ifthey have too long in the area, they will find all or most of the worms and defeat the intent of thelab. I use bright as well as cryptic colors to illustrate that the most visible colors are preyed uponfirst. If the colors are selected purely randomly, then there should be an equal number of eachcolor (or approximately) collected. Have the students count the number of each color andtabulate the class totals on the board. They will soon see that bright blue totals are much higher,for example, than the brown or grass green. You can have them do Chi-squares on the numbersto test the hypothesis that the colors are selected randomly. This was a lab I got at NationalScience Teachers Association Area Conference, and it includes how to do the statistical analysis,essay questions, and summary data questions. If you would like the entire lab, please write me. The students will get a chance to get out of the classroom, your 'energetic' students can help youscatter the yarn pieces, and it is a great kinetic way to show that next year's crop of wooleyworms will be of a greatly different color mixture. A final cheap touch is that the yarn pieces lasta long time and are recyclable year after year.
Submitted by Nikki Gonzalez, Loma Linda Academy
Page 20
THE ELECTRIC PICKLE DEMO
SET-UP
1. Cut the end off of an extension cord and split into two wires. Strip away enough of theinsulation on the end of each of the two wires so that you may solder to a "16 penny" nail.
2. Solder a "16 penny" nail to the end of each wire.
3. Push each nail through a cork so that the nail extends out the other end of the cork.
4. Tape the cork, the solder joint, and any exposed wire with electrical tape.
5. Clamp the corks to ring stands and insert each nail into opposite ends of a pickle, so thatthe pickle is supported between the nails. Be careful that the nails do not touch insidethe pickle!
Figure not available
6. Plug the extension cord into an electrical outlet and wait a few seconds for current tobegin flowing through the pickle and the pickle to glow with a yellowish green glow.
*7. [Optional] With the cord unplugged insert a "flash bar" with metal prongs into theglowing side of the pickle. With a little maneuvering the flash bar will light up.
Submitted by Aubrey Fautheree, Gem State Academy
Obtained from a manual given at Portland State University summer seminar "Microscale ChemistryTechniques & Experiments.
Page 21
A SAFE ETHANOL CANNON
PURPOSE: To demonstrate two different rates of the exothermic combustion ofethanol in air.
TIME REQUIRED: 5-10 minutes
DESCRIPTION: Ethyl alcohol is burned on a watch glass. Then a small amount of ethylalcohol is placed in a plastic bottle and shaken. The bottle is corked andignited with a match.
MATERIALS: %¸1 plastic bottle, size is not important%¸Cork to fit the bottle%¸One ringstand with utility clamp%¸One watch glass%¸5 ml of ethyl ether%¸Dropper%¸Matches
PROCEDURE: 1. Make a small hole in the side of the plastic bottle.2. Burn a small amount of the ethyl alcohol on the watch glass.3. Place about one ml of the ethyl alcohol in the plastic bottle and cork.
Shake well and carefully discard the excess alcohol and recork.4. Clamp securely on the ring stand.5. Aim the bottle across the room (not at anyone).6. Ignite cannon by holding a lit match on the hole.
DISCUSSION: The cannon will drive a cork about 30 feet. The reaction is self limitingbecause of the limited oxygen in the bottle. The reaction products, whichmust be removed from the bottle before the reaction can be repeated, maybe removed by blowing air thru the bottle.
DISPOSAL: None
HAZARDS: Excess alcohol in the bottle will be ignited and can cause small fires.
REFERENCE: G.W. Johnson & Victor Moore, NWW 1987
CATEGOR IES: Reaction rates, thermodynamics, & expansion of gases
Submitted by Aubrey Fautheree, Gem State Academy
Obtained from a manual given at Portland State University summer seminar "Microscale ChemistryTechniques & Experiments.
Page 22
CHEMILUMINESCENT NECKLACES
PURPOSE: To illustrate how rates of reactions depend on temperature.
MATERIALS:% ̧1 chemiluminescent necklace% ̧Two 100 ml graduated cylinders% ̧Hot water over 50° C
% ̧Two 250 ml beakers% ̧Ice
PROCEDURE:1. Activate the necklace by bending and shaking the plastic tube.2. Fill one graduated cylinder with hot water another with ice water.3. Place about 6 inches of the necklace into each cylinder.4. Turn out the lights. Observe where the light brightens on the light necklace,
where it doesn't change, and where it dims.5. If a light meter is available, it can be used to measure the intensity.
DISCUSSION:This simple demonstration is also well received by a wide variety of age groups.They are able to infer on the basis of their observations that raising thetemperature increases the rate of reaction. Most observers will accurately predictthat the glow intensity of the lightstick end immersed in hot water will fade beforethat of the end kept in the icewater.
The light necklace contains dilute hydrogen peroxide in a pthalic ester solventcontained in the plastic tube. During the course of the reaction, an intermediate isformed which transfers energy to a dye molecule. Visible light is emitted whenthe excited dye molecule returns to the ground state.
TIPS: The necklace may be placed in the freezer and will last for several weeksdepending upon how cold the temperature is of the particular freezer that is used.
HAZARDS: Do not break open the light necklace. The solution will burn your eyes if itsomehow gets into them.
DISPOSAL: Throw the expended necklace into the trash.
REFERENCE S:Bassam Z. Shakhashiri, Chemical demonstrations: A handbook for teachers ofchemistry. Volume 1. University of Wisconsin Press, 1983. ISBN 0-299-08890-1
Submitted by Aubrey Fautheree, Gem State Academy
Obtained from a manual given at Portland State University summer seminar "Microscale ChemistryTechniques & Experiments.
Page 23
METHANOL FLAME TESTS
PURPOSE: This demonstration shows the representative flame tests for alkali, alkaline earth,and copper metallic salts.
DESCRIPTION:Six petri dishes are stacked on beakers and approximately 25 ml of methanol is added. 1 gram of a metallic salt is added to the methanol and mixed with a stir rod. The methanol is then ignited.
MATERIALS:%¸ 150 ml methanol%¸ Six petri dishes%¸ Six 400 ml beakers%¸ Samples of various metallic salts, such as strontium chloride, potassium
iodide, lithium nitrate, copper II nitrate, copper II bromide, barium nitrate,calcium nitrate, sodium chloride.
PROCEDURE:Place about 25 ml of methanol in each petri dish and stack on the inverted 400 ml beakers. Add about 1 gram of each salt to the methanol and mix with a stir rod. Turn out the lights in the room and light each of the mixtures.
DISCUSSION:This can be an excellent way to introduce quantum mechanics to your students. Itis very beautiful and the flames will last for several minutes. As the flames burndown the color intensifies right before it goes out.
TIPS: The petri dishes can be labeled and saved, I've used the same ones for a couple ofyears. All you need to do is add more methanol and stir.
HAZARDS: The petri dishes are hot, so let them cool before you remove them from thebeakers. Placing the petri dishes on the beakers is more stable than on a wiregauze and ring stand.
DISPOSAL: If the experiment will not be done again, rinse the salts down the drain with plenty of water.
REFERENCE S:Colored Flames, a source book for teachers volume 1, Lee R. Summerlin, 1985.
Submitted by Aubrey Fautheree, Gem State Academy
Obtained from a manual given at Portland State University summer seminar "Microscale ChemistryTechniques & Experiments.
Page 24
MYSTERY SIGN
OVERVIEW:
In this demonstration, you spray window cleaning solution containing NH3 on a large piece ofpaper, and a message in pink appears and then disappears. This demonstration is a good oneto carry out on the first day of class, to show that chemistry deals with changes in matter.
MATERIALS:
%¸Solution of phenolphthalein indicator%¸Cotton swab%¸Small sponge brush or paint brush%¸Large piece of paper (somewhat absorbent)%¸Spray bottle of window cleaning solution containing NH3.
ADVANCE PREPARATION:
1. Phenolphthalein: Prepare the phenolphthalein solution by mixing 0.1 g indicatorin 50 mL ethyl alcohol.
2. Add a few cubic centimeters of concentrated ammonia solution to the windowcleaning solution containing NH3 to increase basicity.
PROCEDURE:
1. Use a small paint brush, sponge brush, or cotton swab to paint a message, usingphenolphthalein indicator solution, on a large piece of paper. If the paper is not veryporous, the window cleaning solution containing NH3 will run down the paper and cancause a mess. Have paper towels handy. Keep the message short and simple (for example, "Chemistry is fun!" or "Chem is try"). Allow the paper to dry thoroughly andtape it to the chalkboard in front of the classroom.
2. Spray window cleaning solution containing NH3 on the message so as to cover the entiremessage as quickly as possible.
3. Repeat step 2 several times.
RESULTS:
The basic window cleaning solution containing NH3 will turn the indicator pink. The colorwill fade quickly because the ammonia will evaporate and the carbon dioxide in the air willproduce an acidic solution that will neutralize any ammonia that may remain on the paper.
Submitted by Aubrey Fautheree, Gem State Academy
Obtained from Pren tice Hall Chemistry: The Study of Matter. Copyright 1989.
Page 25
PATRIOTIC COLORS
OVERVIEW:
In this demonstration, you add a colorless solution to three other colorless solutions toproduce red, white, and blue solutions. The reactions that occur when you mix thesesolutions illustrate that chemistry deals with changes in materials.
MATERIALS:
%¸Ammonia water%¸0.05% phenolphthalein solution%¸0.5 M magnesium nitrate or magnesium chloride%¸Copper (II) sulfate solution that is almost colorless%¸Three 125-mL Erlenmeyer flasks%¸50-mL beaker
ADVANCE PREPARATION:
1. Prepare ammonia water by mixing one part concentrated ammonia with three parts water.2. Prepare the phenolphthalein solution by mixing 0.05 g of indicator in 50 mL of ethyl
alcohol.3. Prepare a 0.5 M magnesium solution by mixing 7.4 g of magnesium nitrate in 100 mL of
water or by mixing 4.8 g of magnesium chloride in 100 mL of water.4. Prepare a near colorless dilute solution of copper (II) sulfate by mixing a few crystals in
water.
PROCEDURE:
1. Place the three Erlenmeyer flasks onto a piece of white paper.2. Place about 100 mL of distilled water and 5-10 drops of the phenolphthalein solution into
the first flask; 100 mL of magnesium solution into the next; and 100 mL of the very dilutecopper (II) sulfate solution into the last flask.
3. Have the students note that all of the flasks seem to look like water (clear, colorlessliquids).
4. Pour some ammonia water into the 50-mL beaker and add a few milliliters of thissolution to each flask.
Figure not available
Page 26
RESULTS:
The first flask should turn a clear, dark rose color because phenolphthalein turns pink orpurple in a basic solution. The second flask should form a white precipitate of magnesiumhydroxide. The last flask should turn a deep blue because copper forms a flue complex withammonia.
Submitted by Aubrey Fautheree, Gem State Academy
Obtained from Prentice Hall Chemistry: The Study of Matter. Copyright 1989
Page 27
NATURAL INDICATORS
Even the sleepiest chemistry student should be familiar with litmus paper. This acid-baseindicator is so widely used that most students can repeat, "If it turns blue it's a base," frommemory. But did you know that the dye used in litmus paper is a natural dye obtained fromlichens? Many of these dyes can be tested using equally common household acids and bases.
The caustic nature of strong mineral acids, such as sulfuric acid or strong bases, such as sodiumhydroxide, has led to misconceptions and fears. All acids and bases wrongly become categorizedas "dangerous." Bases such as ammonia water and milk of magnesia are familiar products inmost homes as are basic salts such as soap, trisodium phosphate, and bicarbonate of soda. Fruit,sour milk, and vinegar contain citric, lactic and acetic acids, respectively. The soil of an area israrely neutral. The success or failure of many home gardens can often be traced directly to theacidity or basicity of the soil. The color of some flowers is an accurate index of the soil's acidity.
Acid-base indicators work because the molecules of dye change color according to theconcentration of hydronium ions.
In this experiment, you will use the dye from cabbage leaves as an indicator. Other dyes, such asteas, grape juice, flowers, and berries, also provide interesting indicators to test for acidity orbasicity.
MATERIALS:
Cassette boxes containing the following:
%¸ 12 polyethylene micro-tip 1 mL pipettes containing solutions with pHs which rangefrom 1 to 12
%¸ 8 polyethylene micro-tip 1 mL pipettes for natural indicators%¸ 96 well-plate%¸ Color pens/pencils (optional)
DIRECTIONS:
1. **PUT YOUR GOGGLES & APRON ON NOW!!!**
2. Obtain a 96 well plate, twelve 1 mL micro-tip polyethylene pipettes containing thepH solutions 1-12, and eight 1 mL micro-tip polyethylene pipettes containingcommercial and natural indicators. One of the indicators needs to be universal.
Page 28
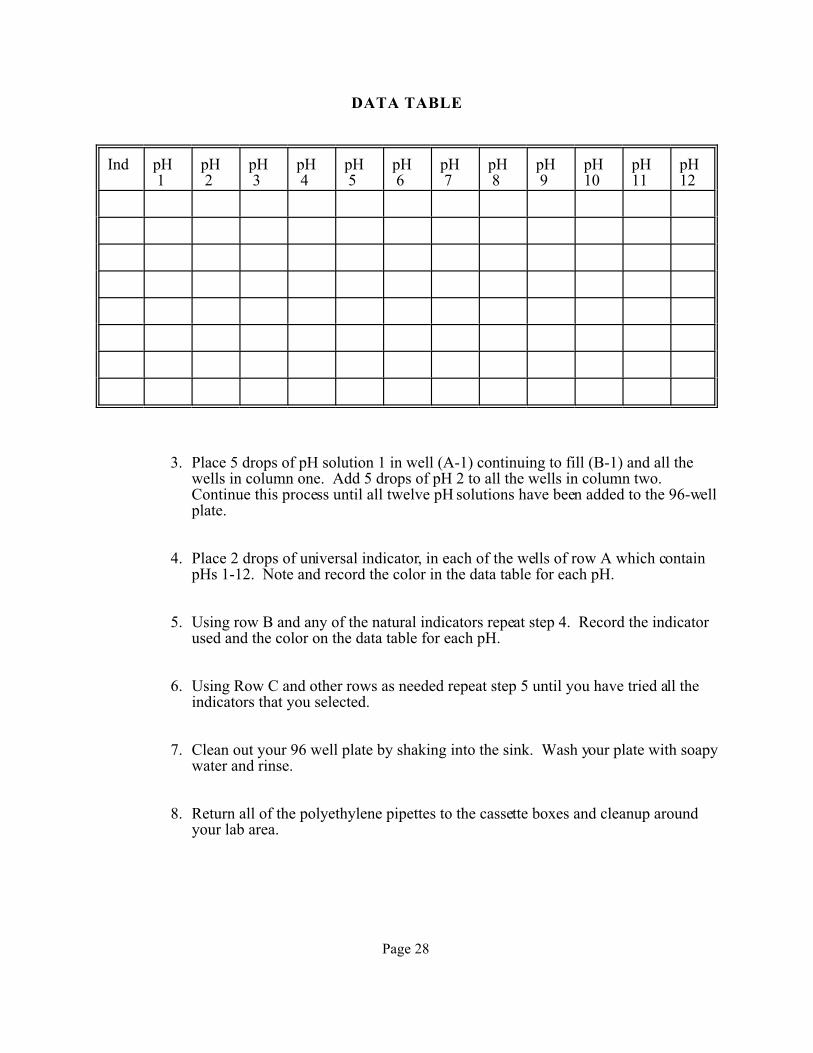
DATA TABLE
Ind pH 1
pH 2
pH 3
pH 4
pH 5
pH 6
pH 7
pH 8
pH 9
pH10
pH11
pH12
3. Place 5 drops of pH solution 1 in well (A-1) continuing to fill (B-1) and all thewells in column one. Add 5 drops of pH 2 to all the wells in column two. Continue this process until all twelve pH solutions have been added to the 96-wellplate.
4. Place 2 drops of universal indicator, in each of the wells of row A which containpHs 1-12. Note and record the color in the data table for each pH.
5. Using row B and any of the natural indicators repeat step 4. Record the indicatorused and the color on the data table for each pH.
6. Using Row C and other rows as needed repeat step 5 until you have tried all theindicators that you selected.
7. Clean out your 96 well plate by shaking into the sink. Wash your plate with soapywater and rinse.
8. Return all of the polyethylene pipettes to the cassette boxes and cleanup aroundyour lab area.
Page 29
FOLLOW-UP:
1. What is the significance of the color changes in each row?
2. Which would be a good indicator for general use?
3. Why don't the natural indicators produce as dark a color as the commercial indicators thatyou used?
Submitted by Aubrey Fautheree, Gem State Academy
Obtained from "Chemistry in Microscale" by David F. Ebrenkrany and John J. Mauch. Published byKendall/Hunt Publishing 1990. PS: This book is full of good experiments.
Page 30
RAINBOW LAB
In this experiment you will be using three common household materials, water, vinegar, andammonia water. An acid-base indicator has been added to one of the solutions. Notice that it isa different color depending upon which substance it is in. You will try to obtain up to 8 colors byvarying the amounts of each solution that you add to a 1 x 8 strip.
MATERIALS:
%¸ 1 x 8 well strip%¸ 1 plastic stir rod%¸ 3 labeled polyethylene pipettes which contain the following solutions
distilled waterclear household ammonia waterwhite distilled vinegar + universal indicator (the indicator is red in acid or blue in ammonia)
% ̧ An empty polyethylene pipette to collect any duplicate colors
PROCEDURE: PUT YOUR GOGGLES AND APRON ON NOW!
1. Open up and fold back your cassette case exposing the contents of your case.2. Place your 1 x 8 strip in front of you and place the 4 polyethylene pipettes next to your
strip.3. The colors can be made by varying the number of drops of ammonia, and or vinegar
solution that you place in each well. Make sure you mix each combination with your stirrod.
4. You may remove duplicate colors in your wells by removing them with your empty pipet.
QUESTIONS:
1. How many colors did you obtain, and what were they?
2. What reasons can you give for the color changes?
3. Which of the pipettes contained the acid? The base? Explain.
4. What purpose did the universal indicator serve?
5. Name at least 3 commercial acid/base indicators. Name at least 3 natural indicators.

Page 31
TEACHERS' GUIDE
This lab introduces the concept of acids and bases using materials that your students are familiarwith. Universal indicator is used to show how the pH can change depending upon how manydrops of vinegar, ammonia, or water are added to each well.
MATER IALS: (FOR CLA SS OF 30)% ̧30 polyethylene pipettes for vinegar/universal indicator solution% ̧30 polyethylene pipettes for ammonium hydroxide solution% ̧30 polyethylene pipettes for distilled water% ̧30 polyethylene pipettes for overflow/disposal purposes% ̧30 1 x 8 well strips% ̧30 plastic stirrers (pipette tips)% ̧30 cassette case (pipette holders)% ̧250 mL 5% white distilled vinegar% ̧250 mL clear household ammonia solution% ̧250 mL distilled water
PREPARATION OF SOLUTIONS
Universal Indicator solution (added to distilled vinegar to make a cherry red color orammonia to make a dark blue color)
(OPTIONAL ALTERNATES)
&f250 mL 0.1 M Acetic Acid (CH3COOH) solution. (Hint) 6 mL Glacial Acetic acid addedto water to make 250 mL of solution.
&f250 mL 0.1 M solution of Ammonium Hydroxide (NH4OH) solution. (Hint) 1.7 mLConcentrated Ammonium Hydroxide to water to make 250 mL of solution.
Universal Indicator may be prepared by combining the following:
10 mL methyl orange solution (0.1 g methyl orange/100 mL of water)10 mL methyl red solution (0.3 g methyl red/100 mL ethanol)10 mL bromthymol blue solution (0.6 g bromthymol blue/100 mL ethanol) 7 mL phenolphthalein solution (0.1 g phenolphthalein/100 mL water)110 mL ethanol53 mL water
Universal Indicator can also be made from red cabbage by boiling the cabbage in a quart ofwater for about an hour and letting it cool to room temperature. If you want to preserve thissolution for longer than a week, it may be frozen and then thawed as needed.
Page 32
LAB HINTS
To fill pipettes, squeeze empty pipette, insert cut end into solution container and release thepressure. Repeat this procedure for all of the solutions. Trim pipette tips by cutting longstem off to within two centimeters of the bulb.
Stirrers may be prepared in the following manner. Heat cut off ends from thin-stem pipettesin burner flame and mash with pliers to form small flat spatula end. Ends can be trimmedwith scissors to fit well openings.
ANSWERS
1. You should be able to obtain eight shades of colors. Including: cherry red, pink, orange,yellow, green, light blue, & dark blue.
2. The colors change with the acidity and basicity of the various solutions. Changes in pHinteract with several dyes in the Universal Indicator.
3. The Universal Indicator will show a red color in acidic solutions. The base is colorlessbecause it has no indicator solution in it initially.
4. The Universal Indicator registers the change in acidity and basicity of the combiningsolutions. Changes in color register changes in pH.
5. Commercial indicators, Litmus, methyl orange, methyl red, phenolphthalein, malachitegreen, Alizarin yellow R etc. Natural indicators, Red cabbage juice, grape juice, fruitskins with color, various flower petals.
HAZARDS
Try to avoid spills with solutions. Acetic acid and ammonia water can affect sensitive skinand adversely affect clothing. Flush spills with copious water.
DISPOSALAll solutions can be washed down drain with excess water.
Submitted by Aubrey Fautheree, Gem State Academy
Obtained from "Chemistry in Microscale" by David F. Ebrenkrany and John J. Mauch. Published by Kend all/HuntPublishing 1990 . PS: This book is full of good experiments.
Page 33
NITROGEN OXIDE EQUILIBRIUM
Henri LeChatelier noted an equilibrium system can be disrupted. Forcing the system to adjust tonew conditions and shift to establish a new equilibrium point. To reach the new equilibrium, thechemical system will change the relative amounts of reactants and products.
LeChatelier's principle can be observed in a nitrogen oxide system. Colorless nitrogen oxidereacts with oxygen to produce brown nitrogen dioxide which may dimerize to form colorlessdinitrogen tetraoxide.
!’ !’2NO + O2 2NO2 N2O4
!• !•colorless brown colorless
The equilibrium for the first reaction lies far to the right. Thus in this activity you will essentiallyobserve the equilibrium between toxic nitrogen dioxide and its dimer dinitrogen tetraoxide.
!’2NO2 N2O4
!•
brown colorless
According to LeChatelier's principle an increase in pressure can be relieved when two moleculesof NO2 form one molecule of N2O4 and the equilibrium shifts toward products. Raising thetemperature increases the importance of entropy and one molecule of N2O4 forms two of NO2,causing the equilibrium to shift towards reactants.
PROCEDURE
1. Obtain a sealed pipette filled with nitrogen oxides from your teacher.
2. Alternate immersing the bulb of the pipette in hot and cold water. Observe the colorchanges.
3. Alternate varying the pressure on the gases by squeezing and releasing the bulb. Again,observe any color changes.
Page 34
QUESTIONS
1. In what direction was the equilibrium shifted in the ice bath? Is the reaction, 2NO2 !’N2O4, exothermic or endothermic?
2. How did the increased pressure effect the equilibrium? What evidence can you give foryour conclusion?
3. List the methods a chemist can use to change equilibrium. What purpose might thisserve?
4. Give an accurate definition of dynamic chemical equilibrium using your own words.
5. Define LeChatelier's principle.
6. Write the expression for the equilibrium constant for the Nitrogen Oxide equilibrium.
a. What happens to its value when you cool the pipette?
b. What happens to its value when you squeeze the pipette?
c. What would happen if used a bigger pipette?
Page 35
STUDENT ACTIVITYNitrogen Oxide Equilibrium
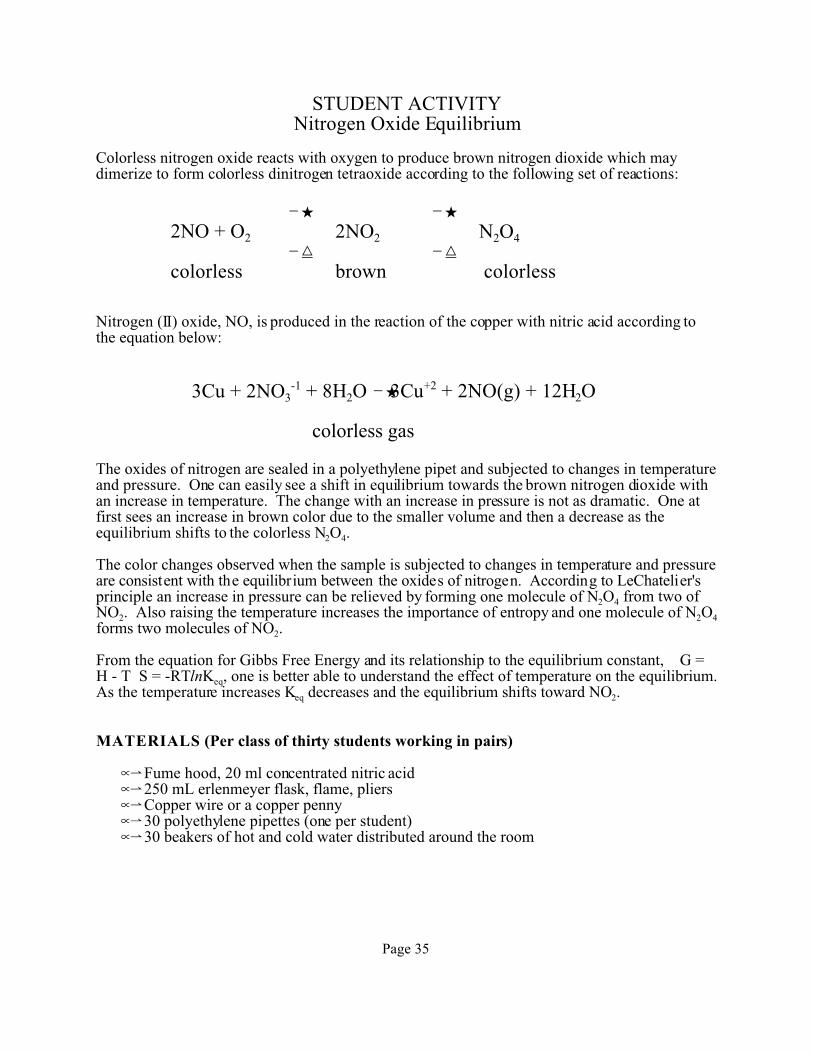
Colorless nitrogen oxide reacts with oxygen to produce brown nitrogen dioxide which maydimerize to form colorless dinitrogen tetraoxide according to the following set of reactions:
!’ !’2NO + O2 2NO2 N2O4
!• !•colorless brown colorless
Nitrogen (II) oxide, NO, is produced in the reaction of the copper with nitric acid according tothe equation below:
3Cu + 2NO3-1 + 8H2O !’ 3Cu+2 + 2NO(g) + 12H2O
colorless gas
The oxides of nitrogen are sealed in a polyethylene pipet and subjected to changes in temperatureand pressure. One can easily see a shift in equilibrium towards the brown nitrogen dioxide withan increase in temperature. The change with an increase in pressure is not as dramatic. One atfirst sees an increase in brown color due to the smaller volume and then a decrease as theequilibrium shifts to the colorless N2O4.
The color changes observed when the sample is subjected to changes in temperature and pressureare consistent with the equilibrium between the oxides of nitrogen. According to LeChatelier'sprinciple an increase in pressure can be relieved by forming one molecule of N2O4 from two ofNO2. Also raising the temperature increases the importance of entropy and one molecule of N2O4
forms two molecules of NO2.
From the equation for Gibbs Free Energy and its relationship to the equilibrium constant, G = H - T S = -RTlnKeq, one is better able to understand the effect of temperature on the equilibrium. As the temperature increases Keq decreases and the equilibrium shifts toward NO2.
MATERIALS (Per class of thirty students working in pairs)
%¸Fume hood, 20 ml concentrated nitric acid% ̧ 250 mL erlenmeyer flask, flame, pliers% ̧ Copper wire or a copper penny% ̧ 30 polyethylene pipettes (one per student)% ̧ 30 beakers of hot and cold water distributed around the room
Page 36
HAZARDS
Nitrogen dioxide, N2O is an extremely toxic gas. Exposure to concentrations greater than200 ppm may be fatal. This would be a good time to remind your students that any gas thatyou can see should be considered dangerous and toxic. Remind students that the brown hazearound cities is partly due to nitrogen dioxide.
PROCEDURE
1. In a fume hood add a small piece of copper wire to an erlenmeyer flask containing about20 ml of concentrated nitric acid.
2. Wait a few minutes while the acid oxidizes the copper and brown nitrogen dioxide fumesform in the flask.
3. Draw the fumes into a polyethylene pipette.
4. Heat the long end of the polyethylene pipette in a flame, squeeze and seal shut with pliers.
TIPS
Many samples may be prepared ahead of time and passes out to students, so that they eachcan make their own observations. This activity only takes a few minutes and leads intodiscussions or reviews LeChatelier's principle, Gibbs Free Energy, and entropy.
The oxides of nitrogen seem to slowly pass through the pipet and eventually the pipettebecomes puckered as there is a decrease of gases and pressure inside. The samples shouldnot be prepared too far in advance.
The change in color with an increase in pressure is not very noticeable. The shift inequilibrium may be conveniently shown by sealing the mixture in a syringe and increasingthe pressure.1
ANSWERS TO QUESTIONS
1. The equilibrium was shifted toward N2O4 as evidenced by the decrease in the brown colorof the poisonous nitrogen dioxide. The reaction is exothermic ( H = -57 kJ/mole N2O4.) According to LeChatelier's principle as energy is removed from the system by the ice baththe system replaces the energy by shifting to the right.
2. The increase in pressure causes the equilibrium to shift towards N2O4. The color of thegases seemed to become slightly lighter.
3. Change the temperature. This may be useful if one wants to control the predominatespecies in a system at equilibrium. One can also vary the pressure, as well as add orremove products and reactants. While this does not really change the equilibrium, thesystem does respond by reacting in a manner to restore the system to a state ofequilibrium.
Page 37
4. Reactants and products are continually reacting. While these reactions are always takingplace we may not be able to observe them because the rates of the forward and reversereactions may already be in a state of equilibrium.
5. A system at equilibrium will respond to stress by shifting in a manner to reduce the stress. Or if a system is removed from equilibrium it responds in such a way to return the systemto a state of equilibrium.
_______________________________
1 B.Z. Shakhashiri, Chemical Demonstrations, Volume 2, The University of Wisconsin Press, 1985.
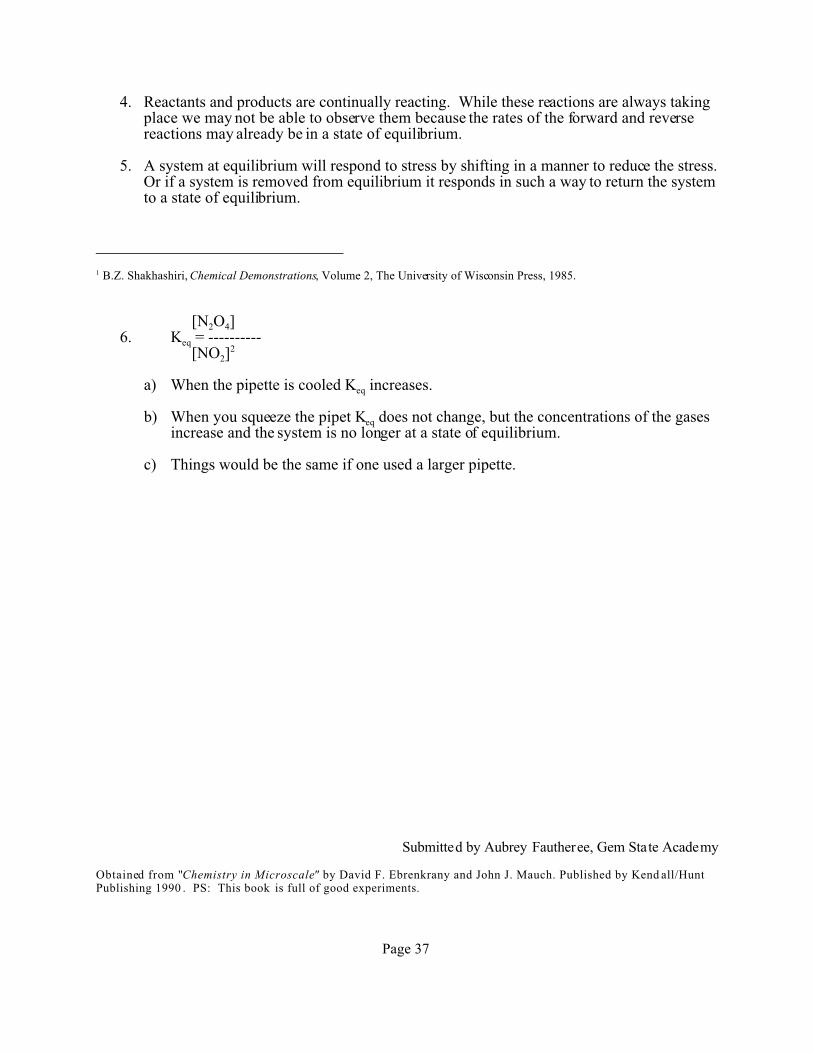
[N2O4]6. Keq = ----------
[NO2]2
a) When the pipette is cooled Keq increases.
b) When you squeeze the pipet Keq does not change, but the concentrations of the gasesincrease and the system is no longer at a state of equilibrium.
c) Things would be the same if one used a larger pipette.
Submitted by Aubrey Fautheree, Gem State Academy
Obtained from "Chemistry in Microscale" by David F. Ebrenkrany and John J. Mauch. Published by Kend all/HuntPublishing 1990 . PS: This book is full of good experiments.
Page 38
HYDROGEN AND OXYGENGENERATING, COLLECTING, & TESTING
Hydrogen is a clear, colorless gas which is said to be "combustible"--meaning simply that it canburn quite readily. Oxygen is also a clear, colorless gas that is said to "support combustion"--meaning that it must be present for combustible materials to burn. In this lab, you will begenerating, collecting, and testing hydrogen and oxygen gas. Hydrochloric acid will be reactedwith zinc to generate the hydrogen. (In general, any strong acid and almost any metal will reactto produce hydrogen.) Hydrogen peroxide will be added to manganese metal to generate theoxygen. (Hydrogen peroxide decomposes by itself to produce water and oxygen, at a slow,imperceptible rate; the manganese oxide "rust" which is coating the manganese metal acts as acatalyst to speed-up this reaction.) By collecting and pop-testing (igniting) differenthydrogen/oxygen mixtures, you will audibly compare them to determine the most reactive(loudest) mixture.
Because this lab will be done on the microscale level, the explosions, though potentially loud, arecompletely safe. On the other hand, the two solutions used in this lab, hydrochloric acid (HCl)and hydrogen peroxide (H2O2), can cause serious damage should they come in contact with youreyes. SAFETY GOGGLES MUST THEREFORE BE WORN AT ALL TIMES. Labaprons are recommended as well.
MATERIALS
%¸1 250 mL beaker% ̧ 1 small test tube labeled "H2 generator" 1/6 full of zinc% ̧ 1 small test tube labeled "O2 generator" 1/6 full of manganese% ̧ Two 1-hole rubber stoppers with 1 inch nozzles% ̧ Nozzles are cut from the tips of graduated pipettes% ̧ 1 cut-off graduated pipette or (super jumbo pipette)% ̧ One 10 mL graduated cylinder% ̧ One Bunsen burner (with matches or lighter)% ̧ One small stock bottle of 1 M hydrochloric acid (HCl)% ̧ 1small stock bottle of 3% hydrogen peroxide (H2O2)% ̧ 1permanent marker% ̧ Tap water
PROC EDUR E -- PUT YOUR GOGGLES AND APR ON ON NOW!!(RECORD ALL OBSERVATIONS)
1. Fill the beaker 3/4 full with tap water. This will act as a test tube holder, a temperatureregulator, and a water reserve during the experiment.
2. Using the graduated cylinder and the pen, increment the cut-off polyethylene pipette toshow six equal-volume intervals. This cut-off pipette will be referred to as the "collectionbulb". (See figure below)
Figure not available
Page 39
3. Light a bunsen burner and adjust it to a medium-sized cool flame. If bunsen burners arenot available, ordinary candles will suffice.
4. The test tube labeled "H2 generator" contains several pieces of zinc metal and is toppedwith a 1-hole stopper (with nozzle). Remove the stopper, and using the full lengthgraduated pipette, add enough 1 M HCl to fill the test tube to within 2 cm of the top. Replace the stopper, and set the generator in the beaker of water. Wait 5 seconds beforebeginning the next step.
Figure not available
5. Fill the collection bulb completely full of water, then place the end of the pipette over theend of the generator and collect the hydrogen gas.
6. Once the collection bulb has become filled with gas, hold it horizontally with its mouthroughly 1 cm from the mid-section of the flame. AVOID PUTTING THE BULBDIRECTLY IN THE FLAME, IT WILL MELT AND POSSIBLY BURN. Shouldthis happen, simply quench the tip in the beaker of water and obtain a new bulb from theinstructor. Gently squeeze a very small portion of the contents of the bulb into the flameand observe. Repeat.
Figure not available
7. Repeat steps 4-6, generating, collecting, and testing oxygen this time. There are twoimportant differences to keep in mind. First, the test tube labelled "O2 generator" doesnot contain zinc; it contains pieces of manganese metal (with an oxide coating--MnO2). Secondly, hydrogen peroxide (H2O2), not HCl, will be added to the test tube.
8. With both gases being generated side by side, collect and test all different possible ratiosof hydrogen and oxygen. Be as consistent as possible each time. (If either of the tworeactions should slow down too much, simply remove the stopper carefully decant (pour)off the remaining liquid into the sink, and replace it with some fresh solution from theappropriate stock bottle. Replace the stopper; wait 5 seconds and resume collecting thegas.
9. Create a bar graph that shows in a logical fashion the relative loudness of each of thesamples that you tested (including the pure hydrogen and oxygen).
10. Collect the optimum mixture one more time, and instead of pop-testing it with the flame,take it to the "launch pad," and have the instructor supply the activation energy with aTesla coil. Can you think of ways to make your rocket go further? Try them! What ratioof hydrogen, oxygen, and water produces the greatest distance when the rocket islaunched?
Page 40
QUESTIONS
1. Write a balanced equation for the reaction taking place inside the hydrogen generator.
2. Write a balanced equation for the reaction taking place inside the oxygen generator.
3. Which do you think will have to be replaced first: the Zn in the hydrogen generator, orthe manganese in the oxygen generator?
4. There are two reasons for filling the generators up so full. Can you think of what theymight be?
5. Explain your observations for the pop-test of pure hydrogen.
6. Explain your observations for the pop-test of pure oxygen.
7. Did you find any mixtures that produced no reaction at all? Explain how that couldhappen?
8. What proportion of hydrogen and oxygen produced the most explosive mixture? Whywas that mixture most explosive?
9. Write a balanced equation for the reaction of hydrogen and oxygen.
10. Why do the hydrogen and oxygen in the collection bulb not react as soon as they mix? What role does the flame play?
11. If a small spark is needed to supply the activation energy for a small bulb of hydrogen-oxygen mixture, how could the same small spark also act to supply the activation energyfor an entire room-full of the mixture? In other words, why does one not have to use aproportionately larger amount of energy to spark a proportionately larger volume ofhydrogen and oxygen?
12. What methods did you attempt for making your rocket fly farther? Which ones worked?
Submitted by Aubrey Fautheree, Gem State Academy
Obtained from "Chemistry in Microscale" by David F. Ebrenkrany and John J. Mauch. Published by Kend all/HuntPublishing 1990 . PS: This book is full of good experiments.
Page 41
TEACHERS' GUIDE
The construction of the gas generators and supplementary equipment is very simple, andinexpensive. The only new materials that you as a teacher might have to order is a box ofgraduated or super jumbo pipettes. You will find these pipettes extremely versatile items.
MATERIALS: (FOR A CLASS OF 30 STUDENTS)
% ̧ Sixty 13 x 100 mm test tubes%¸Sixty graduated and thirty jumbo polyethylene pipettes % ̧ Sixty 1-hole 00 rubber stoppers (to fit test tubes)% ̧ Zinc metal% ̧ Manganese metal% ̧ 250 mL of 1 M HCl (87.6 ml of concentrated HCl added to 912.4 ml water)% ̧ 250 mL of 3% H2O2 (store bought works fine.)
CONSTRUCTION
Cut the graduated pipettes off at points A & B. The tip portions fit securely in the stoppers. Cut the end of a jumbo or graduated pipette approximately 1 cm from the bulb and use thisfor the collection of the various ratios of hydrogen and oxygen. Fill one test tubeapproximately 1/6 full of zinc metal for the H2 generator, the other test tube 1/6 full ofmanganese metal for the O2 generator, insert the stoppers and your generators are ready to beused.
Figure not available
LAUNCH PAD
The launch pad is also relatively simple. Cut a thin piece of wood 20 inches by 2 inches intothree pieces. Two pieces need to be 5 inches, these are sections X and Y. The third piece is10 inches and is labeled Z on the drawing below. Connect X to Y and Y to Z lengthwise withduct tape hinges, drive a nail through the center of Y, and arrange the three so that section Zlies flush on the table and sections X & Y from an A-frame.
Page 42
One can then adjust the launch angle by moving the unhinged end of X either toward or awayfrom the Y & Z hinge. See second drawing below. The student simply places a bulbcontaining the optimum H2/O2 mixture, over the nail, and the teacher brings a Tesla coilalong-side it to create a spark gap between the coil and the nail through the side of thecollection bulb.
Figure not available
HINTS FOR LAUNCH PAD
Making 3 or 4 such launch pads allows for less wait time and more trials for the students.
Place launch pads on one lab bench, all aimed at a large target on the wall or a box on thefloor 5-6 meters away. Students may adjust the angle and direction before blast-off.
Leaving a small amount of water in the collection bulb causes the "micro-rocket" to flyconsiderably farther: you might want to tell your students this, or see if they can discover itfor themselves. (There is a toy water rocket based on this principle.)
If arcing is failing to occur, ground the nail by wrapping one end of a wire around the headfrom below, and the other end around a grounded metal pipe or sink faucet.
LAB HINTS
Add a few drops of copper sulfate solution to the zinc in the hydrogen generators. This actsto catalyze the production of the hydrogen gas.
Step #2: Incrementing the bulb is best accomplished by filling the bulb completely withwater, then emptying it into the graduated cylinder, measuring the total volume of the bulb,dividing this volume by 6, refilling the bulb, emptying out 1/6, marking the water level,emptying out another 1/6, and so on. This can also be done by counting the number of dropsthe pipette holds and then divide by six.
Step #5: Collecting the gas is best done by water displacement (this is easier at a micro-levelthan at the standard macro-level!) Fill the bulb completely with water, and place it mouth-downward over the nozzle. The displaced water will simply trickle back down into thereserve beaker.
Step #8: Testing different mixtures, the mixtures are collected by filling the collection bulbwith one part hydrogen, then transferring the bulb to the other generator to collect theremaining 5 parts oxygen--then pop testing with the flame.
If the hydrogen generation is too slow, 2-3 molar hydrochloric acid can be used.
Page 43
ANSWERS
1. The reaction is Zn + 2 HCl (aq) ---> ZnCl2 (aq) + H2 (g). Note: we do not see the zincchloride that is produced along with the hydrogen gas, for the zinc chloride is soluble andtherefore remains as dissociated ion in solution.
2. The reaction is 2 H2O2 (aq) ---> 2 H2O + O2 (g). Note: in this reaction, the by-productwater is not evident, for it simply mixes in with the water already present as a solvent forthe hydrogen peroxide.
3. The zinc metal will need to be replaced first for it is being consumed in the first reactionabove. The manganese is acting as a catalyst for the second reaction above, and thetheoretically would never need replacing. Actually, the catalyst is the oxide coating,MnO2, that forms on the surface of the manganese pieces; this tends to flake off andbecome discarded whenever old solution is replaced with new, so even the manganesewill eventually have to be replaced.
4. One reason to fill the generators up so full with solution is that it leaves very little airspace in the generators, so it does not take that long for the gas that's being produced todisplace the air. Thus, within a matter of seconds, the gas coming through the nozzle is arelatively pure sample of the gas that one is attempting to collect. The second reason isthat it allows the reaction to proceed for a relatively long period of time.
5. Hydrogen is combustible; this means it reacts readily with oxygen. Pure hydrogentherefore is not by itself an explosive substance. The slight pop that is heard is a result ofthe hydrogen coming out of the mouth of the collection bulb as it is squeezed and mixingwith some of the oxygen in the air. This can be repeated several times; yet for each bit ofhydrogen that is expelled from the bulb an equal amount of air containing oxygen isdrawn back in. Eventually a combustible mixture is attained in the bulb, and the flamebackfires into the bulb.
6. Oxygen show a negative pop-test. Oxygen supports combustion, but it is not itselfcombustible.
7. Some mixtures contain so little of one of the two reactants that the likelihood is slight ofhaving an O2 particle collide with a H2 particle. This therefore decreases the chances ofthe reaction propagating throughout the mixture, so the explosive chain reaction cannotoccur.
8. The most explosive mixture is two parts hydrogen to one part oxygen. This is the moleratio from the balanced equation (see #9 below). It is most explosive because it allowsfor the maximum yield of product (water) and the maximum output of heat. Because thetwo reactants are present in this optimum ratio, they are both completely consumed; inother words, nothing is wasted.
9. The reaction is 2 H2 (g) + O2 (g) ---> 2 H2O (g) + heat
10. Even if hydrogen and oxygen are both present in a combustible ratio, and the H2-O2
collisions are occurring at a considerable rate, the collisions are generally not occurringwith enough energy to form the activated complex, and the reaction can not proceed at adetectable rate. By supplying extra energy, in the form of heat or electricity, the particlesmove faster and collide harder on average and therefore have a greater chance of forming
Page 44
the activated complex and enabling the reaction to begin. This minimum energyrequirement is known as the activation energy for the reaction.
11. The activation energy mentioned above only needs to be supplied locally (in theimmediate vicinity of the spark). The reaction that it causes, produces much more heatthan it consumes, and therefore supplies the activation energy for the layer of particlessurrounding this vicinity, which in turn supply the energy for the next shell of particles,and so on, in a sort of propagating chain reaction. This all takes place so quickly that itappears that the entire mixture is exploding simultaneously.
12. Several parameters influence the length of the rocket's flight. One of course is the ratio ofthe gases. A second is the angle of the launch: 45° is best under ideal frictionlessconditions, but with the considerable air resistance, some angle less than 45° willinvariably prove more effective. The mass of the rocket plays a major role, a weightedrocket will be less subject to air resistance, but it will also have more inertia to overcome. Streamlining the rocket with tail-fins and a nose cone, for example can also increase itsflight. Leaving some water in the bulb can greatly increase the flight as well, for it givesthe expanding gases something to push against, a propellent as it were. One can find agood illustration of this principle in toy water rockets, which rely on pumping air into aplastic bulb partly filled with water.
REFERENCE
This experiment was written by Robert Becker, St. Louis, Missouri.
Submitted by Aubrey Fautheree, Gem State Academy
Obtained from "Chemistry in Microscale" by David F. Ebrenkrany and John J. Mauch. Published by Kend all/HuntPublishing 1990 . PS: This book is full of good experiments.
Page 45
DIFFUSION OF IDEAL GASES
Most gases at atmospheric pressure and room temperature behave in an "ideal" fashion. That is,they have elastic collisions with each other and the walls of the container. For all molecularcollisions the total energy of the gas is conserved. The energy possessed by an ideal gas is aresult of its random motion thru space (the kinetic energy of the gas molecule). Like anycollection of moving objects, molecules of an ideal gas have an average kinetic energy (KE)which is characterized by the following equation:
Ave. KE = mass X (ave. velocity)2
2
The average kinetic energy of ideal gases is determined by the temperature. In addition theaverage velocity of ideal gas molecules is inversely proportional to the square root of themolecular weight of the gas.
Ave. velocity "� "� 1
MW
In this lab you will measure the relative velocities of two gases NH3 and HCl by measuring thedistance each gas travels in a period of time. The two gases will be simultaneously introduced atopposite ends of a diffusion tube. When the gases encounter each other in the diffusion tube theywill react to form a white precipitate (NH4Cl). The relative velocities of the gases will bedetermined by comparing the distance each gas must diffuse before it reacts with its counterpart. The ratio of these distances will then be related to the relative molecular masses of the gasses.
MATERIALS
% ̧96 well plate% ̧2 polyethylene pipettes% ̧Melting point capillary (open at both ends)% ̧Bunsen burner% ̧Razor blade% ̧Millimeter ruler% ̧2 drops of concentrated HCl% ̧2 drops of concentrated NH4OH
PROCEDURE: PUT YOUR GOGGLES ON NOW!
Construct a gas diffusion apparatus by attaching the tube portion of two polyethylene pipettes toboth ends of an open capillary tube. Cut the tubes as indicated in the diagram below.
Figure not available
Page 46
If the polyethylene tubes do not fit tightly onto the capillary you can wave the joint quicklythrough a lighted bunsen burner two or three times. Be sure to rotate the assembly after eachpass through the flame to avoid over-heating. Let the assembly cool for 3 minutes.
In one corner of a 96 well plate place 2 drops of concentrated ammonia hydroxide (NH4OH). Inthe opposite corner place 2 drops of concentrated hydrochloric acid (HCl). Label the wells sothat you will not confuse them later. Both solutions are mixtures of a gas dissolved in water. These solutions will be the sources of the diffusing gases (NH3 and HCl) in this experiment.
Figure not available
Without kinking the tubes simultaneously insert the ends of the gas diffusion apparatus into thewells containing HCl and NH4OH. Allow the diffusion tube to remain in the solutionsundisturbed for twenty seconds. In some cases you may have to hold it in place. After twentyseconds remove the diffusion tube and insert the ends into the wells located in the nearest unusedcorners of the 96 well plate. Allow the tube to "develop" undisturbed for two minutes. Duringthis time look for the appearance of a faint white band and mark the center of the band with a penas it appears. If you have not located the band after two minutes try holding the diffusionapparatus against a dark background. This white band is ammonium chloride, NH4Cl. It is thesalt which results from the following acid-base neutralization reaction:
NH3 (g) + HCl (g) -------> NH4Cl (s)
Using a ruler with millimeter precision, measure the distance from the end of each polyethylenetube to the middle of the white band. This length is the distance each of the corresponding gasestraveled to reach the "reaction zone" in the diffusion tube.
d (HCl) = __________ d (NH3) = __________
Verify that the ratio of the distances traveled by the gases is approximately equal to the valuepredicted by the corresponding molecular weights.
d (HCl) = "� MW(NH3)d (NH3) = MW(HCl)
Page 47
ANALYSIS
Round-off your result to two significant figures and report your datum to your instructor. Afterall of the students have submitted their results (20 or more trials) plot the data on a histogram asshown below:
Figure not available
This data set can now be used to discuss important statistical parameters such as mean (average),mode (most often occurring value), and median (value for which half of the data is larger andhalf of the data is smaller). Which value best represents the relative rate of diffusion for thesetwo gases. Does this best value agree with the expected value? If not, why not? Use the data tocalculate the standard deviation, SD, of the ratio of the diffusion rates. The standard deviation ofa set of observations is the square root of the average of the squared deviations from the mean.
SD = "� �£ (x-x)2
n-1
On the histogram block out the area covered by ± 1, 2, & 3 times the standard deviation. Thisarea represents the 68%, 95%, & 98% confidence levels of the "true" value.
Page 48
QUESTIONS
1. Suppose this experiment were repeated under each of the following conditions: Explainwhat changes you would expect to observe in each case.
a) The room temperature is 5 degrees warmer.b) The experiment is performed in a vacuum.c) The diffusion tube is twice as long.d) The diffusion tube is held in a vertical position.
2. Equal molar samples of ammonia (NH3) and boron trifluoride (BF3) are introduced intothe opposites ends of a long glass tube that is kept horizontal. Both substances are gasesand diffuse along the tube. They react spontaneously to form an addition complex, NH3---BF3. Where in the tube will this complex form?
Like any collection of moving objects, molecules of an ideal gas have an average kinetic energy(KE) which is characterized by the following equation:
KE = mass X velocity2
2
In 1662 Robert Boyle showed that for an ideal gas the product of the pressure and the volume is aconstant value for a fixed temperature. This constant turns out to be two thirds the averagekinetic energy of the gas.
2 KE = pressure X volume 3
Combining these two equations gives an expression which relates the pressure and volume of agas to its mass and average velocity.
3 pressure X volume = mass X velocity2
Dividing both sides of the equation by the number of moles and rearranging gives the followingrelationship.
mass = 3 (pressure X volume) X 1 mole mole velocity2
If we consider ideal behaving gases (molar volume = 22.4 liters) at constant temperature andpressure this equation becomes:
molecular weight = constant X 1 velocity2
Page 49
Rearranging, the average velocity of an ideal gas at constant temperature and pressure isinversely related to the square root of its molecular weight.
velocity = constant X "� 1 MW
Diffusion is the random movement of a substance through a medium. For ideal gases in air, therate at which the gas diffuses depends on the average velocity of the molecules. In thisexperiment we will examine the relative rate of the diffusion of two gases, HCl and NH3, atconstant temperature and pressure. The distance these two gases travel in a period of timedepends only on the values of their molecular weights.
rate (Hcl) = d (Hcl) = "� M.W. (NH3) rate (NH3) d (NH3) M.W. (HCl)
It would be useful to collect data from several classes or even for several years to assemble alarge enough data base to generate a nice Gaussian curve for the histogram.
Most people can sense a temperature change of two degrees Celcius. Ask the students tocalculate the average velocity (in miles per hour) for a gas molecule at 25°C. Also have themcalculate the change in the average velocity (in miles per hour) of an air molecule for atemperature rise from 25°C to 27°C. (The average molecular weight of air is 28.9 g/mole.)
MATERIALS: (30 STUDENTS)
% ̧Thirty 96 well plates% ̧70 polyethylene pipettes% ̧60 melting point capillary, 150 mm length (open at both ends)% ̧10 bunsen burners% ̧15 razor blades% ̧15 millimeter precision rulers% ̧5 pipettes of concentrated HCl% ̧5 pipettes of concentrated NH4OH
HAZARDS
This lab uses small quantities of concentrated acid and base. These reagents are hazardous andshould be handled in a well vented area. Refer to the manufacturer's material data safety sheet(MSDS) for additional precautions.
Page 50
DISPOSAL
The 96 well plates may be rinsed in the sink with copious amounts of water.
LAB HINTS
The gas diffusion apparatus can be cleaned out and used again by simply flushing with water. However, it is essential that the apparatus be completely dry before attempting anotherexperiment.
The concentrated acid and base may be dispensed using labeled polyethylene pipettes filled witheach reagent. Alternately you could use polyethylene pipettes in labeled 10 mL beakers.
The students can add the reagents to their 96 well plates and return to their lab stations tocomplete the experiment.
ANSWERS TO QUESTIONS
1. a) The gases would diffuse faster but the ratio of the distances traveled would be thesame.
b) no change
c) The gases would travel longer distances but the ratio would be the same.
d) no change
2. The ratio of the distance traveled (BF3 : NH3) would be 0.503. The complex would formabout two thirds of the way from the end of the tube at which the NH3 was introduced.
REFERENCES
Dr. William G. Becker, Portland State University, P.O. Box 751, Portland, OR 97207-0751.
Submitted by Aubrey Fautheree, Gem State Academy
Obtained from "Chemistry in Microscale" by David F. Ebrenkrany and John J. Mauch. Published by Kend all/HuntPublishing 1990 . PS: This book is full of good experiments.
Page 51
PHYSICS LAB Investigation: Diver
PROBLEM:
Design a "Cartesian Diver" system for each of three different stability states--
1. Diver floats at upper surface until pressure is applied; will float unless added pressure ismaintained;
2. Diver rests on bottom of container but can be brought up with negative pressure application,but will sink again unless negative pressure is maintained;
3. Diver is bi-stable; floats at upper surface or rests at bottom surface, either without applicationof additional or sub-normal pressure, but may be moved to other state at will.
MATERIALS PER GROU P:
%¸ One 2.5 liter or gallon jug of glass with small mouth%¸ 1 test tube, 13 mm x 100 mm size works well%¸ 1 large beaker 600 ml or larger
PROCEDURE:
Fill jug with water. Add small amount of water to test tube which you believe will allow test tube tojust float upright when inverted (mouth downward). Make a test run by filling large beaker with waterand try to float inverted test tube in it. If tube sinks, remove small amount of water and retry. If tubefalls over horizontally, add more water than last time and try again.
When test tube will just float when inverted in beaker, place finger over its mouth and move to jug. At this point see if you can control the "diver" by first making sure jug is filled completely to the topwith water. Then apply pressure over mouth of the jug with palm of hand. If successful, diver willmove downward with such pressure.
By observation and experimentation, determine which type of diver you just produced. Negativepressure can be applied to the jug/diver system by making sure jug is completely full to the top andsealing your palm over jug's mouth, then cup your palm upward while maintaining the seal.
By further observation and experimentation, changing the amount of water in diver, you should beable to obtain the other two types of diver.
Page 52
NOTE TO TEACHER:
This exercise is challenging and usually fun for the students. It is not so much fun for the teachersince it tends to be messy and wet! Cafeteria trays under each set-up will help contain the water.
You may want to require students to report on this activity by attempting to explain how the diverworks.
CONCEPTS
Involved in this investigation include -- Cause-effect, Change, Cycle, Equilibrium, Field, Force,Gradient (pressure), Interaction, Model, System, and Theory.
Submitted by Harold Williams, Campion Academy
Page 53
PHYSICS LAB Investigation: PENNY LAB
PROBLEM:
Using a 10cm x 10cm piece of aluminum foil, design and fold a "boat" which will support andfloat with the greatest amount of cargo possible. The cargo will consist of pennies.
MATERIALS:
% ̧ At least 1 piece 10cm x 10cm aluminum foil per lab group.% ̧ Trough or tray large enough in which to float boat.% ̧ Supply of pennies for each group; usually a 50-cent roll is sufficient.
NOTE TO TEACHER:
This exercise invites creativity, ingenuity, insight, trial-and-error, and is usually met withconsiderable enthusiasm. Competition is keen as the different groups try to outdo each otherin designing the "best" boat.
Control is achieved by preparing the foil before hand and making sure all pieces are uniform. The coins are identical in mass so there is consistency here, also.
CONCEPTS:
Involved in this investigation include Cause-effect, Change, Equilibrium, Force, Interaction,Perception, Quantification, Replication, and Theory. Post lab discussion can do much toamplify and clarify student thinking involving these concepts.
Submitted by Harold Williams, Campion Academy
Page 54
WHICH OF NEWTON'S LAWS CAN BE DEMONSTRATED BY A SODA POP CAN?
CONCEPTS:
1. Newton's First Law states that a body at rest tends to stay at rest and a body in motiontends to stay in motion unless acted upon by some outside force.
2. Newton's Second Law states that a body acted on by a constant force will move with aconstant acceleration in the direction that the force is acting.
3. Newton's Third Law states that for every action, there is an equal and opposite reaction.
4. All three of Newton's Laws can be demonstrated by the creation of a soda pop steamengine.
OBJECTIVES:
1. Through observation of a teacher-made example, the students will be able to construct asimple, steam-powered model of a steam engine.
2. After observing the function of their simple model, the students will be able to relate theirmodel steam engine to more sophisticated steam-powered engines.
3. After observing the operation of their simple model, the students will be able to explainNewton's Third Law of motion in terms relative to their own experience.
4. After working with their model to either increase its speed, smoothness of motion, or toget it moving in the first place, the students will reconstruct or modify their basic design(more vent holes, smaller/larger vent holes, heavier can, etc.).
SAFETY:
1. Wear safety goggles at all times.
2. Practice good safety techniques when cutting and piercing the aluminum can.
3. Keep a safe distance away from the steam engine while it is in operation. Steam can causeserious burns!
MATERIALS (per pair):
%¸1 aluminum soda pop can%¸Masking tape%¸1 styrofoam cup%¸1 straight pin%¸1 cork%¸1 pair of scissors
%¸1 Bunsen burner%¸1 10-mL graduated cylinder%¸2" x 4" board (at least 4" long)%¸Marker pen%¸Goggles%¸Cooking or lubricating oil (optional)
Page 55
PROCEDURES (Summary):Using an empty soda pop can, a styrofoam cup, and a pivot system, the students will make asteam engine which can be used to demonstrate each of Newton's Laws of Motion.
ANSWERS T O CLOSURE QUESTIONS:
1. The force of the steam escaping the can caused it to spin.2. If you filled the can half-full of water, the water steam vent holes would be blocked and
the can would not spin.3. The can finally stopped spinning because all the water had been converted into steam.4. Answers will vary (poor craftsmanship, vent holes too large, too much water, etc.)5. Newton's Third Law (Action/Reaction) was most clearly demonstrated by this experiment
because the force of the steam is in one direction, and the can spins in the oppositedirection.
6. The escaping steam would be called the "action" and the spinning of the can would becalled the "reaction".
7. The modifications that might alter or improve the working of your model would be toadjust the water level, apply lubrication, adjust the vent openings, etc.
8. The model steam engine relates to the workings of real steam engines because both use theprocess of steam generation to cause motion.
CORRELATION TO SFA:
Physical Science - Mechanics (3-12)Processes and Skills: Observing, Communicating, Comparing, Organizing, Relating, and Inferring.
SOUR CE: James Taylor, Science Teacher, Ahwahnee Middle School, FUSD
Page 56
STUDENT ACTIVITY
NAME _________________________
WHICH OF NEWTON'S
Figure is not available LAWS CAN BE
DEMONSTRATED BY
A SODA POP CAN?
SAFETY:
1. Wear safety goggles at all times.2. Practice good safety techniques when cutting and piercing the aluminum can.3. Keep a safe distance away from the steam engine while it is in operation. Steam can cause
serious burns!
MATERIALS (per pair):
%¸1 aluminum soda pop can%¸Masking tape%¸1 styrofoam cup%¸1 straight pin%¸1 cork%¸1 pair of scissors
%¸1 Bunsen burner%¸1 10-mL graduated cylinder%¸2" x 4" board (at least 4" long)%¸Marker pen%¸Goggles%¸Cooking or lubricating oil (optional)
Page 57
PROCEDUR ES:
1. Cut a 1.5 cm2 piece of aluminum from an aluminum can. Using the board, carefullypuncture the center of this piece with a thumb tack.
2. Cut a diamond-shaped hole in the center of a 12-cm long piece of masking tape. Push thealuminum piece from above to cover the diamond-shaped hole of tape. Push a straight pinthrough the hole and press the sharp end of the pin into a cork.
3. Center the tape over the bottom end of a styrofoam cup and tape the cup/pivot in place. Make sure that the "burs" on your piece of aluminum don't interfere with the smooth spinof the pin. If it does, untape it and turn it over. Cooking oil or other lubrication isoptional.
4. Take an empty aluminum can and stand it aside your 2" x 4" board and scribe a linearound it so as to have a line encircling it 2" above its bottom.
5. Take another straight pin and puncture the can on the line and push the pin to the right sothat the hole will "point" to the right. Put a second, similar hole 180 degrees away on thesame line. (Note: hole diameters may need to be adjusted to the heat output of yourburner.)
6. Place 6-mL of water in the can.7. Press your styrofoam cup with the pivot over the top of the can firmly and seal it with
masking tape where the cup and the can meet.8. Holding your steam engine by the cork, suspend the can over a burner flame and observe
the results. Record your observations below:
CLOSURE Q UESTIONS:
1. What made the can spin?
2. What would happen if you filled the can half-full of water?
3. Why did the can finally stop spinning?
4. Why did some of the cans in the class fail to spin?
5. Which of Newton's Laws was most clearly demonstrated by this experiment? Explain.
6. Which responses of your steam engine would be called the "action" and which the"reaction" in regards to Newton's Third Law?
7. What modifications might alter or improve the working of your model?
8. How does your model relate to the workings of real steam engines?
Submitted by Frederick L. Anderson, Georgia-Cumberland Academy