Embed Size (px)
Citation preview

Germi R _ Evaluation of two commercial EBV amplification kit
- 1 -
1 2
Comparison of commercial extraction systems and PCR assays for the 3 quantification of Epstein-Barr DNA load in whole blood 4
5
Raphaële GERMI1-2*, Julien LUPO1-2, Touyana SEMENOVA1, Sylvie LARRAT1-2, Nelly 6
MAGNAT1, Laurence GROSSI 2, Jean-Marie SEIGNEURIN1-2 and Patrice MORAND1-2 7
8
1 Unit of Virus Host Cell Interactions UMI 3265 UJF-EMBL-CNRS, B.P. 181, 6, rue Jules 9
Horowitz, 38042 Grenoble Cedex 9, France 10
2 Laboratoire de Virologie, Département des Agents Infectieux, Pôle Biologie, Centre 11
Hospitalier Universitaire Grenoble, BP 217, 38043 Grenoble Cedex 9, France 12
13
*Corresponding author: Raphaële Germi 14
Mailing address: Laboratoire de Virologie 15
CHU Grenoble BP 217 16
38043 Grenoble 17
France 18
Phone: 33 4 76 76 56 04 19
Fax: 33 4 76 76 52 28 20
E-Mail: [email protected] 21
Running head: Evaluation of two commercial EBV quantification kits 22
Copyright © 2012, American Society for Microbiology. All Rights Reserved.J. Clin. Microbiol. doi:10.1128/JCM.05593-11 JCM Accepts, published online ahead of print on 11 January 2012
on October 13, 2019 by guest
http://jcm.asm
.org/D
ownloaded from

Germi R _ Evaluation of two commercial EBV amplification kit
- 2 -
ABSTRACT 23
The automation of DNA extraction and use of commercial quantitative real-time PCR assays 24
could help obtain more reliable results for the quantification of Epstein-Barr virus viral load 25
(EBV-VL). This study compared two automated extraction platforms and two commercial 26
PCRs for EBV-VL measurement in ten EBV Quality Controls for Molecular Diagnostics 27
(QCMD) and in 200 whole blood (WB) specimens from transplant (n=137) and nontransplant 28
patients (n=63). The WB specimens were extracted using the QIAcube or MagNA-Pure 29
instrument and VLs were quantified with the EBV R-gene quantification kit (Argene) or the 30
Artus EBV RG PCR kit (Qiagen) on the Rotor-Gene 6000 and compared with the results of a 31
laboratory-developed PCR. The QCMD specimens were extracted using the QIAamp-DNA-32
mini-kit and quantified with the three PCR assays. 33
The extraction platforms and the PCR assays showed a good correlation (R>0.9, p<0.0001) 34
but up to 10% discordant results were observed, mostly for low viral loads (VL<3 log10 35
copies/mL) and standard deviation reached as high as 0.49 log10. 36
In WB but not in QCMD samples, Argene PCR tended to give higher VL values than Artus 37
PCR or laboratory-developed PCR (mean difference of the 200 WB VL = −0.42 or −0.36, 38
respectively). 39
In conclusion, the two automated extractions and the two PCRs provided reliable and 40
comparable VL results but differences greater than 0.5 log10 copies/mL remained between 41
the two commercial PCRs after common DNA extraction. 42
43
Key words: Epstein-Barr virus, automated extraction, commercial PCR assay, whole blood 44
45
on October 13, 2019 by guest
http://jcm.asm
.org/D
ownloaded from

Germi R _ Evaluation of two commercial EBV amplification kit
- 3 -
INTRODUCTION 46
Primary Epstein-Barr virus (EBV) infection is the cause of the vast majority of the cases of 47
infectious mononucleosis and the subsequent EBV lifelong persistence in the infected host, 48
although mostly asymptomatic, can lead to the development of several lymphoid and 49
epithelial cancers in immunosuppressed and immunocompetent individuals (13, 18). 50
With the outstanding development of real-time quantitative PCR, the measurement of EBV 51
DNA load during these EBV-associated diseases has been largely implemented in clinical 52
practice (6, 11). The monitoring of EBV DNA load in blood is required in transplant 53
recipients at risk of post-transplantation lymphoproliferative disorders and could also be a 54
surrogate marker for the adjustment of the immunosuppressive regimen in these patients (7, 55
9). EBV DNA load measurement in plasma also appears to be a useful biomarker for the 56
management of EBV-associated undifferentiated nasopharyngeal carcinoma (4). Although 57
less clearly demonstrated, EBV DNA load measurement could also be helpful in other clinical 58
situations such as severe or atypical infectious mononucleosis and other EBV-associated 59
malignancies in immunosuppressed or immunocompetent patients (6). Besides the debates on 60
the clinical utility and the clinically relevant EBV DNA levels in various EBV-associated 61
diseases, technical standardization of EBV load has not yet been achieved (6, 7). There is still 62
great variability among the different PCR methods at all steps of the analysis, resulting in 63
great variability in inter-laboratory results (1, 8, 16). This heterogeneity is a barrier to the 64
optimal use of this quantitative PCR assay. The automation of nucleic acid extraction 65
procedures and the use of commercialized PCR assays could decrease this heterogeneity and 66
improve the agreement and the clinical utility of EBV load measurement in routine settings 67
(5, 15, 17). 68
The aim of this study was (1) to compare two automated platforms for EBV DNA extraction 69
from whole blood samples: the MagNA Pure LC system (Roche Applied Science, Meylan, 70
France) (herein referred to as MagNA) and the Qiacube instrument (Qiagen, Hilden, 71
on October 13, 2019 by guest
http://jcm.asm
.org/D
ownloaded from

Germi R _ Evaluation of two commercial EBV amplification kit
- 4 -
Germany) (referred to as Qiacube); (2) to compare the results of EBV DNA load in whole 72
blood samples, after extraction with the Qiacube, obtained with two commercially available 73
real-time PCR assays: the EBV R-gene quantification kit (provided free by Argene, Verniolle, 74
France, and referred to as Argene PCR) and the Artus EBV RG PCR kit (provided free by 75
Qiagen, Hilden, Germany and referred to as Artus PCR). These results obtained with the two 76
commercially available PCR assays were also compared with a laboratory-developed EBV 77
real-time quantitative PCR assay (Lab PCR). Additionally, the three PCR assays were tested 78
with the proficiency panel from the Quality Controls for Molecular Diagnostics 2009 79
(QCMD). 80
81
MATERIAL AND METHODS 82
Clinical samples 83
One hundred and twenty-five patients sent to our institution for routine EBV load testing (86 84
transplant recipients with routine monitoring of EBV load and 39 nontransplant patients with 85
a suspicion of an EBV-associated disease) were included in the study and gave 200 specimens 86
of whole blood collected in EDTA tubes (Table 1). Eighty samples out of these 200 were 87
sequentially collected from eight patients (five transplant recipients, one patient with HIV 88
infection, one patient with hypogammaglobulinemia, and one patient with EBV-associated 89
encephalitis). The range of EBV load assessed with the laboratory-developed PCR (see 90
below) is presented in Table 1. All samples were collected between September and November 91
2008 and stored at −80°C until use. 92
93
94
Study design 95
Firstly, all whole blood specimens were extracted with the MagNA system and the Qiacube 96
instrument and amplified using the laboratory-developed PCR assay on the LightCycler 2.0 97
on October 13, 2019 by guest
http://jcm.asm
.org/D
ownloaded from

Germi R _ Evaluation of two commercial EBV amplification kit
- 5 -
platform in order to compare the performance of the two extraction robots. The DNA was 98
isolated following the manufacturer’s instructions from 200 µL of whole blood with the DNA 99
Isolation kit (Roche Applied Science, Meylan, France) for the MagNa instrument and with the 100
QIAamp DNA Blood mini kit (Qiagen, Hilden, Germany) for the Qiacube robot. The 101
extracted DNA was eluted with 100 µL of elution buffer, aliquoted, and frozen at −80°C 102
before use. 103
Secondly, the performance of the three EBV PCR assays was compared using aliquoted DNA 104
extracts obtained with the Qiacube. The laboratory-developed PCR and the Argene PCR 105
assays, already described elsewhere (3, 5), targeted the BXLF1 thymidine kinase gene and 106
were run on a LightCycler 2.0 platform and the Rotor-gene 6000 platform, respectively. The 107
Artus PCR targeted the EBNA-1 gene and was run on the Rotor-Gene 6000 amplification. All 108
three PCR assays were multiplex PCRs for the simultaneous amplification of an internal 109
control used to verify the efficacy of the extraction and the absence of PCR inhibitors in the 110
amplification process. The characteristics of each PCR are summarized in Table 2. 111
In addition to the whole blood samples, ten lyophilized samples from the EBV QCMD 2009 112
were extracted manually (without Qiacube robot) using QIAamp DNA Blood mini kit, 113
(Qiagen) and quantified with the three PCR assays, as described above. The QCMD samples 114
contain a lyophilized EBV strain quantified using electron microscopy. All QCMD samples 115
were reconstituted using sterile water (NAT quality). 116
117
Statistical analysis 118
The EBV load measurements were expressed as log10 copies/mL. The correlation coefficients 119
were calculated using a Spearman test and the homogeneity of the variances was analysed by 120
the Fischer-Snedecor test (Statview 5.0, SAS Institute Inc., Cary, NC, USA). Comparison of 121
the viral loads obtained by the different technologies was represented on a Bland-Altman 122
graph. Only viral loads positive in both compared assays were represented on the Bland-123
on October 13, 2019 by guest
http://jcm.asm
.org/D
ownloaded from

Germi R _ Evaluation of two commercial EBV amplification kit
- 6 -
Altman graphs. Discordant results were defined either because the results of the Bland-124
Altman analysis were outside the interval average ± 1.96 standard deviations (SD) 125
(quantitatively discordant results) or because one EBV load measurement was positive in one 126
method and negative in another (qualitatively discordant results). 127
128
Results 129
130
Comparison of automated extractions 131
The analysis of EBV load obtained after the two extraction procedures showed a linear 132
correlation between the log10 of EBV load with a Spearman correlation coefficient of 0.958 133
(p<0.0001). Among the 200 samples, 159 were positive using both automated extractions, 21 134
were negative with the two technologies and 20 were qualitatively discordant. Five samples 135
with a low EBV load (<3 log10 copies/mL) with Qiacube–Lab PCR were negative with 136
MagNA–Lab PCR and 15 samples positive with MagNA–Lab PCR (all but one < 3 log10 137
copies/mL) were negative with Qiacube–Lab PCR. Bland-Altman analysis of the 159 samples 138
positive with both technologies showed that more than 95% of the samples were within the 139
“mean ± 1.96 SD” (Figure 1A). The mean difference between the EBV loads (log10 140
copies/mL) obtained with the two methods was 0.11 and the standard deviation 0.31 (Table 141
3). The differences between viral loads were above 0.5 log10 for 7.6% of the samples and 142
above 1 log10 for 1.9% of the samples. 143
No PCR inhibition occurred during these experiments. 144
145
Comparison of real-time PCRs after Qiacube extraction 146
The Spearman correlation coefficients between the log10 of EBV load obtained with the three 147
different PCRs ranged from 0.908 to 0.942 (p<0.0001). 148
on October 13, 2019 by guest
http://jcm.asm
.org/D
ownloaded from

Germi R _ Evaluation of two commercial EBV amplification kit
- 7 -
Eleven qualitatively discordant results were obtained between laboratory-developed PCR and 149
Artus PCR. One was positive using the Artus PCR and negative using the laboratory-150
developed PCR and ten samples were negative using the Artus PCR and positive using the 151
laboratory-developed PCR. The Bland-Altman analysis of the 154 samples positive in both 152
assays showed that 3.9% of the results were outside the “mean ± 1.96 SD” interval (Figure 153
1B,). The most discordant result was measured at 5.69 log10 copies/mL and 3.42 log10 154
copies/mL with the Artus PCR and the laboratory-developed PCR, respectively. This case, 155
called “patient H,” is discussed below. The mean difference between EBV loads (log10 156
copies/mL) measured by Lab PCR and Artus PCR was −0.06 and the standard deviation was 157
0.42 (Table 3). The differences were above 0.5 log10 for 18.9% and above 1 log10 for 1.95% 158
of the 154 samples positive using the two methods. 159
Among the 17 qualitatively discordant results between laboratory-developed PCR and Argene 160
PCR, eight were negative with the Argene PCR and positive with the laboratory-developed 161
PCR (all were below 3 log10 copies/mL). Nine samples were negative with the laboratory-162
developed PCR and positive with the Argene PCR (two were below 3 log10 copies/mL and 163
seven between 3 and 4 log10 copies/mL). The Bland-Altman analysis showed that 7.1% of 164
the 156 results positive with the two methods were outside the “mean ± 1.96 SD” interval 165
(Figure 1C). The VL obtained for patient H, with the laboratory-developed PCR and the 166
Argene PCR, were not discordant. The mean difference observed between Lab PCR and 167
Argene PCR was −0.4 and the standard deviation 0.41 (Table 3). 168
There were 18 qualitatively discordant results between Artus and Argene PCRs. Four were 169
negative with the Argene PCR and positive with the Artus PCR (all were below 3 log10 170
copies/mL) and 14 were negative with the Artus PCR and positive with the Argene PCR (five 171
were below 3 log10 copies/mL and eight were quantified between 3 and 5 log10 copies/mL. 172
On the Bland-Altman graph Six of the 151 samples positive in both assays (4%) were 173
on October 13, 2019 by guest
http://jcm.asm
.org/D
ownloaded from

Germi R _ Evaluation of two commercial EBV amplification kit
- 8 -
discordant (Figure 1D). One of them corresponded to patient H. The mean difference between 174
the two methods was −0.34 and the standard deviation 0.49 (Table 3). 175
The viral load differences measured between the Argene PCR and the laboratory-developed 176
PCR or the Artus PCRs were above 0.5 log10 for more than 40% of the samples positive with 177
the two methods (66/156 and 62/151, respectively). Less than 6% of the samples showed a 178
difference above 1 log10. In more than 92% of the samples with a difference above 0.5 log10, 179
Argene PCR gave a higher viral load. 180
181
Follow-up of EBV VL in patients with various EBV-associated pathologies 182
Figure 2 shows the longitudinal monitoring of EBV load from eight patients (80 183
measurements, ranging from 6 to 13 samples/patient ) with four methods: MagNA–184
laboratory-developed PCR, Qiacube–laboratory-developed PCR, Qiacube–Artus PCR, and 185
Qiacube–Argene PCR. When comparing the two extraction platforms, the differences 186
between viral loads were below 0.5 log for 86.3% of the samples and below 1 log for 96.3% 187
of the samples. The differences between viral loads measured with the laboratory-developed 188
and Artus PCRs were below 0.5 log for 90% of the samples and below 1 log for 98.8% of the 189
samples. The viral load differences measured between the Argene PCR and the laboratory-190
developed or Artus PCRs were below 0.5 log for 61.3% and 63.8% of the samples, 191
respectively; 96.3% of samples showed a difference below 1 log when the Argene and 192
laboratory-developed PCRs or the Argene and Artus PCRs were compared. Overall, EBV 193
DNA load measurements were higher with the Argene PCR than with EBV load 194
measurements with the laboratory-developed or Artus PCR. 195
196
Results of the EBV Quality Control for Molecular Diagnostics Proficiency Panel 2009 197
Table 4 depicts the EBV load results of the ten samples from the EBV QCMD 2009 after 198
manual extraction (without Qiacube nor MagNA robots) and amplification with the three 199
on October 13, 2019 by guest
http://jcm.asm
.org/D
ownloaded from

Germi R _ Evaluation of two commercial EBV amplification kit
- 9 -
PCR assays (Lab, Artus, and Argene). The expected negative result was found negative with 200
the three PCR assays. All nine positive results obtained with the laboratory-developed PCR 201
were higher than the expected results, but the difference remained below 0.5 log10 copies/mL 202
(mean delta log10 = +0.175). With the Argene PCR, eight of nine results were lower than the 203
expected results (mean delta log10 for the nine positive samples: −0.180). The maximum 204
differences between the Argene and the expected results were −0.502 and +0.564, 205
respectively. Using the Artus PCR, seven of nine results were lower than the expected result 206
(mean delta log10 for the nine positive samples: −0.425) and four of them presented 207
differences greater than 0.5 log10. The Spearman correlation coefficients of the laboratory-208
developed PCR, the Artus PCR, and the Argene PCR regarding the expected results were 209
0.999, 0.951, and 0.915, respectively. 210
211
212
213
on October 13, 2019 by guest
http://jcm.asm
.org/D
ownloaded from

Germi R _ Evaluation of two commercial EBV amplification kit
- 10 -
214
DISCUSSION 215
The automation of nucleic acid extraction and the availability of commercial real-time 216
quantitative PCR assays could improve the agreement and the clinical utility of EBV DNA 217
load measurement in routine clinical settings. This study compared the EBV load results 218
obtained with two automated extraction methods coupled to the same PCR assay and the EBV 219
load results obtained with three EBV quantitative real-time PCR assays after the same 220
extraction. 221
There are few published data on the performance of automated extraction for EBV DNA 222
quantification on whole blood (14) and, to our knowledge, this is the first study of Qiacube 223
extraction for EBV DNA load measurement. The comparison of the MagNA and Qiacube 224
automated extraction platforms showed an excellent correlation of the EBV load results in 225
200 whole blood specimens (R=0.958 p<0.0001) with less than 8% VL differing for more 226
than 0.5 log10 and a low standard deviation of the differences (0.31). No PCR inhibition 227
precluded the measurement of EBV load since none of the samples inhibited the internal 228
positive control in any of the PCR assays. All the qualitatively discordant VL (10%) 229
concerned low EBV loads (below 3 log10 copies/mL): 15 of 20 were negative after the 230
Qiacube extraction and weakly positive after MagNA extraction and 5 of 20 were negative 231
after the MagNA extraction and weakly positive after Qiacube extraction. This suggested a 232
trend toward greater sensitivity of MagNA extraction compared to Qiacube extraction, 233
particularly for low viral load. Both automated extractions were equivalent regarding time 234
consuming and standardization. The Qiacube is not totally automated but offers the advantage 235
of being more versatile since almost all the manual extraction kits available from Qiagen can 236
be adapted on the Qiacube with comparable results. No cross-contamination was observed 237
with either the MagNA or the Qiacube, but it should be noted that MagNA proposes a UV 238
DNA-decontamination process not included in the Qiacube. 239
on October 13, 2019 by guest
http://jcm.asm
.org/D
ownloaded from
Germi R _ Evaluation of two commercial EBV amplification kit
- 11 -
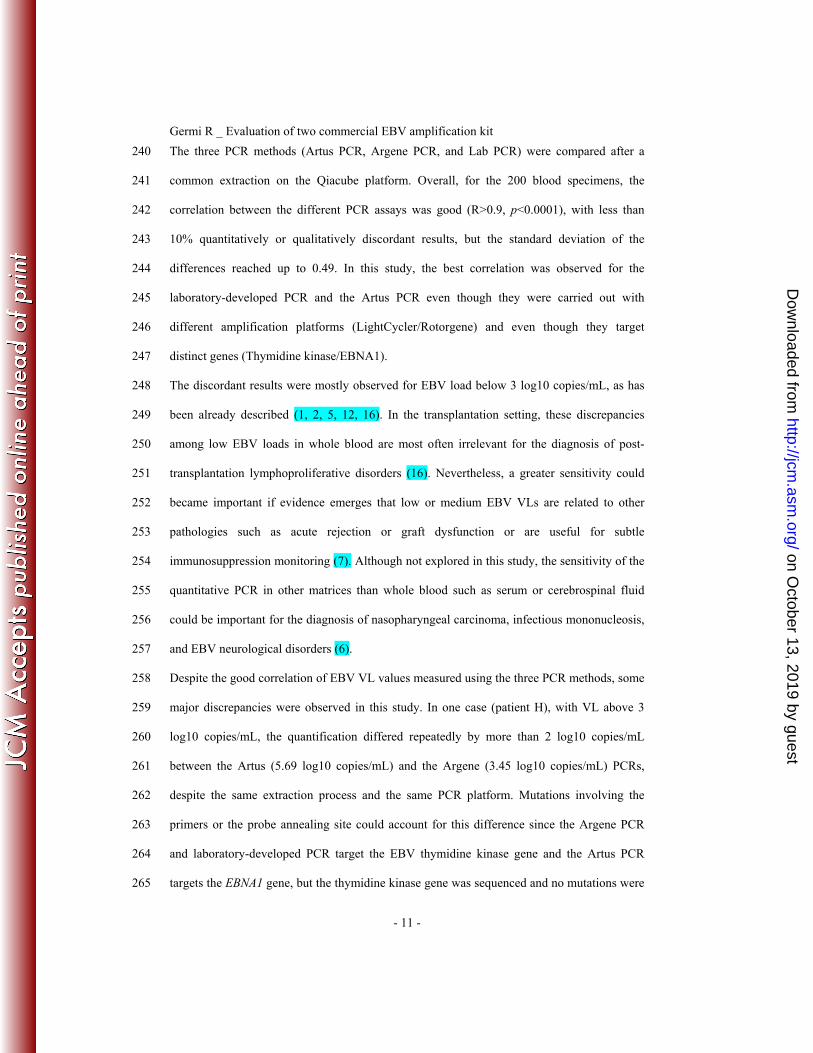
The three PCR methods (Artus PCR, Argene PCR, and Lab PCR) were compared after a 240
common extraction on the Qiacube platform. Overall, for the 200 blood specimens, the 241
correlation between the different PCR assays was good (R>0.9, p<0.0001), with less than 242
10% quantitatively or qualitatively discordant results, but the standard deviation of the 243
differences reached up to 0.49. In this study, the best correlation was observed for the 244
laboratory-developed PCR and the Artus PCR even though they were carried out with 245
different amplification platforms (LightCycler/Rotorgene) and even though they target 246
distinct genes (Thymidine kinase/EBNA1). 247
The discordant results were mostly observed for EBV load below 3 log10 copies/mL, as has 248
been already described (1, 2, 5, 12, 16). In the transplantation setting, these discrepancies 249
among low EBV loads in whole blood are most often irrelevant for the diagnosis of post-250
transplantation lymphoproliferative disorders (16). Nevertheless, a greater sensitivity could 251
became important if evidence emerges that low or medium EBV VLs are related to other 252
pathologies such as acute rejection or graft dysfunction or are useful for subtle 253
immunosuppression monitoring (7). Although not explored in this study, the sensitivity of the 254
quantitative PCR in other matrices than whole blood such as serum or cerebrospinal fluid 255
could be important for the diagnosis of nasopharyngeal carcinoma, infectious mononucleosis, 256
and EBV neurological disorders (6). 257
Despite the good correlation of EBV VL values measured using the three PCR methods, some 258
major discrepancies were observed in this study. In one case (patient H), with VL above 3 259
log10 copies/mL, the quantification differed repeatedly by more than 2 log10 copies/mL 260
between the Artus (5.69 log10 copies/mL) and the Argene (3.45 log10 copies/mL) PCRs, 261
despite the same extraction process and the same PCR platform. Mutations involving the 262
primers or the probe annealing site could account for this difference since the Argene PCR 263
and laboratory-developed PCR target the EBV thymidine kinase gene and the Artus PCR 264
targets the EBNA1 gene, but the thymidine kinase gene was sequenced and no mutations were 265
on October 13, 2019 by guest
http://jcm.asm
.org/D
ownloaded from

Germi R _ Evaluation of two commercial EBV amplification kit
- 12 -
observed (results not shown) (17). Targeting genes present in multiple repeated copies may 266
also cause this type of discrepancy, but to our knowledge the thymidine kinase and EBNA1 267
genes are single-copy genes (15). This considerable difference between two commercial 268
assays in a single laboratory has already been observed by others (2, 15, 17), suggesting that 269
replacing one method with another should be done with caution. It is hoped that the ongoing 270
implementation of a WHO EBV international standard for nucleic acid amplification-based 271
assays will improve the standardization of EBV load measurement, making the clinical 272
interpretation of EBV viral load less challenging. 273
The second type of discrepancy highlighted by this study was a trend of Argene PCR giving 274
higher EBV VL than the Artus PCR and the laboratory-developed PCR in whole blood (mean 275
difference of the 200 WB VL = −0.42 and −0.36, respectively). Surprisingly, the QCMD 276
panel quantified by the Argene PCR gave values below the expected results and below the 277
laboratory-developed PCR, suggesting that EBV VL quantification depends on the matrix 278
considered. This difference between the results of cell-free samples and cell-associated 279
clinical samples has already been described (1, 5) and suggests that evaluation of a new 280
commercial EBV DNA quantitative assay relies both on quality control and clinical sample 281
studies. 282
The main advantages of the commercial kit are that it provides standards and reagents 283
produced using good manufacturing practices and it is easy to develop for nonspecialized 284
laboratories that cannot develop their own method. Some studies suggested that commercial 285
assays and standardized reagents could help improve the comparability of assays between 286
laboratories (2, 8, 10), but others observed no significant difference in inter-laboratory 287
quantitative precision when commercial reagents/assays rather than laboratory-developed 288
assays were used (16). 289
In conclusion, these results demonstrated that the automated extraction systems, MagNA and 290
Qiacube, and the two commercially available EBV real-time quantitative PCR assays, Argene 291
on October 13, 2019 by guest
http://jcm.asm
.org/D
ownloaded from

Germi R _ Evaluation of two commercial EBV amplification kit
- 13 -
and Artus, gave comparable results for EBV DNA measurement in whole blood. However, in 292
this study the two automated extraction techniques with the same PCR gave a higher 293
correlation (p<0.05) and a lower standard deviation (Fischer-Snedecor test p<0.001) than 294
different PCR assays with the same extracted material. This work also underscored that 40% 295
of VL measurements performed with two commercial assays, in the same laboratory, differed 296
by more than 0.5 log10 copies/mL. This highlighted the importance of using an international 297
standard and reinforced the assumption that monitoring EBV VLs should be performed with 298
the same assays and the same specimen type, and should be interpreted in a given patient with 299
regard to the clinical history, the risk factors for an EBV-associated disease, and the viral 300
dynamics of their EBV viral load. 301
302
303
on October 13, 2019 by guest
http://jcm.asm
.org/D
ownloaded from

Germi R _ Evaluation of two commercial EBV amplification kit
- 14 -
Acknowledgments 304
305
Disclosure statement 306
The authors state no conflict of interest. 307 308
309
on October 13, 2019 by guest
http://jcm.asm
.org/D
ownloaded from

Germi R _ Evaluation of two commercial EBV amplification kit
- 15 -
References 310
311
1. Abbate, I., Zanchetta, M., Gatti, M., Gabrielli, L., Zanussi, S., Milia, M. G., 312
Lazzarotto, T., Tedeschi, R., Ghisetti, V., Clementi, M., De Rossi, A., Baldanti, F., 313
and M. R. Capobianchi. 2011. Multicenter comparative study of Epstein-Barr virus 314
DNA quantification for virological monitoring in transplanted patients. J. Clin. Virol. 315
50(3):224-229. 316
2. Ahsanuddin, A. N., Standish, M. C., Caliendo, A. M., Hill, C. E., and F. S. Nolte. 317
2008. Validation of an Epstein-Barr viral load assay using the QIAGEN Artus EBV 318
TM PCR analyte-specific reagent. Am. J. Clin. Pathol. 130(6):865-869. 319
3. Brengel-Pesce, K., Morand, P., Schmuck, A., Bourgeat, M. J., Buisson, M., 320
Barguès, G., Bouzid, M., and J. M. Seigneurin. 2002. Routine use of real-time 321
quantitative PCR for laboratory diagnosis of Epstein-Barr virus infections. J. Med. 322
Virol. 66:360-369. 323
4. De Paoli, P., Pratesi, C., and M. T. Bortolin. 2007. The Epstein Barr virus DNA 324
levels as a tumor marker in EBV-associated cancers. J. Cancer. Res. Clin. Oncol. 325
133(11):809-815. 326
5. Fafi-Kremer, S., Morand, P., Barranger, C., Barguès, G., Magro, S., Bés, J., 327
Bourgeois, P., Joannes, M., and J. M. Seigneurin. 2008. Evaluation of the Epstein-328
Barr virus R-gene quantification kit in whole blood with different extraction methods 329
and PCR platforms. J. Mol. Diagn. 10(1):78-84. 330
6. Gärtner, B., and J. K. Preiksaitis. 2010. EBV viral load detection in clinical 331
virology. J. Clin. Virol. 48(2):82-90; 332
7. Gulley, M. L., and W. Tang. 2010. Using Epstein-Barr viral load assays to diagnose, 333
monitor, and prevent posttransplant lymphoproliferative disorder. Clin. Microbiol. 334
Rev. 23(2):350-366. 335
8. Hayden, R. T., Hokanson, K. M., Pounds, S. B., Bankowski, M. J., Belzer, S. W., 336
Carr, J., Diorio, D., Forman, M. S., Joshi, Y., Hillyard, D., Hodinka, R. L., 337
Nikiforova, M. N., Romain, C. A., Stevenson, J., Valsamakis, A., Balfour, H. H., 338
and U. S. EBV Working Group. 2008. Multicenter comparison of different real-time 339
PCR assays for quantitative detection of Epstein-Barr virus. J. Clin. Microbiol. 340
46(1):157-163. 341
9. Heslop, H. E. 2009. How I treat EBV lymphoproliferation. Blood. 114(19):4002-342
4008. 343
on October 13, 2019 by guest
http://jcm.asm
.org/D
ownloaded from

Germi R _ Evaluation of two commercial EBV amplification kit
- 16 -
10. Ito, Y., Takakura, S., Ichiyama, S., Ueda, M., Ando, Y., Matsuda, K., Hidaka, E., 344
Nakatani, K., Nishioka, J., Nobori, T., Kajiyama, N., and H. Kimura. 2010. 345
Multicenter evaluation of prototype real-time PCR assays for Epstein-Barr virus and 346
cytomegalovirus DNA in whole blood samples from transplant recipients. Microbiol. 347
Immunol. 54(9):516-522. 348
11. Kimura, H., Ito, Y., Suzuki, R., and Y. Nishiyama. 2008. Measuring Epstein-Barr 349
virus (EBV) load: the significance and application for each EBV-associated disease. 350
Rev. Med. Virol. 18(5):305-319. 351
12. Laus, S., Kingsley, L. A., Green, M., and R. M. Wadowsky. 2011. Comparison of 352
QIAsymphony Automated and QIAamp Manual DNA Extraction Systems for 353
Measuring Epstein-Barr Virus DNA Load in Whole Blood Using Real-Time PCR. J. 354
Mol. Diagn. 13(6):695-700. 355
13. Luzuriaga, K., and, J. L. Sullivan. 2010. Infectious mononucleosis. N. Engl. J. Med. 356
362(21):1993-2000. 357
14. Mengelle, C., Legrand-Abravanel, F., Mansuy, J. M., Barthe, C., Da Silva, I., and 358
J. Izopet. 2008. Comparison of two highly automated DNA extraction systems for 359
quantifying Epstein-Barr virus in whole blood. J. Clin. Virol. 43(3):272-276. 360
15. Perandin, F., Cariani, E., Pollara, C. P., and N. Manca. 2007. Comparison of 361
commercial and in-house Real-time PCR assays for quantification of Epstein-Barr 362
virus (EBV) DNA in plasma. BMC Microbiol. 7:22. 363
16. Preiksaitis, J. K., Pang, X. L., Fox, J. D., Fenton, J. M., Caliendo, A. M., and G. 364
G., and American Society of Transplantation Infectious Diseases Community of 365
Practice. 2009. Interlaboratory comparison of Epstein-Barr virus viral load assays. 366
Am. J. Transplant. 9(2):269-279. 367
17. Ruiz, G., Peña, P., de Ory, F., and J. E. Echevarría. 2005. Comparison of 368
commercial real-time PCR assays for quantification of Epstein-Barr virus DNA. J. 369
Clin. Microbiol. 43(5):2053-2057. 370
18. Young, L. S., and A. B. Rickinson. 2004. Epstein-Barr virus: 40 years on. Nat. Rev. 371
Cancer. 4(10):757-768. 372
373
374
on October 13, 2019 by guest
http://jcm.asm
.org/D
ownloaded from

Table 1: Whole blood sample distribution
Range of viral load (log10 copies/mL)
Number of whole blood specimens
Hematopoietic stem cells n=19
[0 – 3][3 – 4][4 – 5]
> 5
39
151671
Solid organn=67
[0 – 3][3 – 4][4 – 5]
> 5
98
3720383
EBV primary infectionn=2
[4 – 5] 2
other EBV-associated diseasesn=37
[0 – 3][3 – 4][4 – 5]
> 5
61
139
2712
Patients
Transplant recipients
Nontransplant patients
Table 2: Characteristics of real-time PCRs
Argene PCR
Artus PCR
Laboratory-developed PCR
Target BXLF1 EBNA1 BXLF1 Probe technology Hydrolysis Hydrolysis Hybridization PCR cycle steps 2
(95°C, 60°C) 3
(95°C, 55°C, 72°C) 3
(95°C, 58°C, 72°C) Final volume assay 25 50 20 Volume of extracted
DNA 10 20 10
Number and type of quantification
standards
4 Plasmid
4 Plasmid
5 Namalwa cells
(2 EBV copies/cell) Range of the
standard curve (copies/mL of whole
blood)
5000–5,000,000 25,000–25,000,000 500–5,000,000
Simultaneous amplification internal
control
Yes Yes Yes
Artus PCR: Qiagen Artus EBV RG PCR kit, Argene PCR: Argene EBV R-gene kit
on October 13, 2019 by guest
http://jcm.asm
.org/D
ownloaded from

Table 3: Mean difference between EBV DNA loads (log10 copies/mL) measured by the different methods and standard deviation (SD)
MP-Lab PCR /Q-Lab PCR
Q-Lab PCR /Q-Artus PCR
Q-Lab PCR /Q-Argene PCR
Q-Artus PCR /Q-Argene PCR
Mean 0.11 -0.06 -0.4 -0.34SD 0.31 0.42* 0.41* 0.49*
MP: MagNApure extraction, Q: Qiacube extraction, Lab: laboratory-developed real-time PCR (on LightCycler amplification platform), A: Qiagen Artus EBV RG PCR kit (on rotor-gene amplification platform), R: Argene EBV R-gene kit (on rotor-gene amplification platform) *Statistically different regarding SD of MP-LabPCR / Q-Lab PCR (Fischer-Snedecor test, p<0.001) Table 4: Quantification of EBV DNA load of Quality Control of Molecular Diagnostics (QCMD) 2009.
QCMD 2009
Expected results(log10
copies/mL)
Lab PCR(log10
copies/mL)
Artus PCR(log10
copies/mL)
Argene PCR(log10
copies/mL)
Lab PCR(Delta log10 copies/mL)
Artus PCR(Delta log10 copies/mL)
Argene PCR(Delta log10 copies/mL)
no. 1 0.000 0.000 0.000 0.000 0.000 0.000 0.000no.2 2.425 2.512 2.000 2.989 0.087 -0.425 0.564no.3 2.719 2.845 2.000 2.544 0.126 -0.719 -0.175no.4 3.919 4.145 3.653 3.803 0.226 -0.266 -0.116no.5 4.218 4.390 3.309 3.922 0.172 -0.909 -0.296no.6 4.431 4.512 4.525 4.290 0.081 0.094 -0.141no.7 5.199 5.279 4.813 4.942 0.080 -0.386 -0.257no.8 2.733 3.051 2.000 2.398 0.318 -0.733 -0.335no.9 3.412 3.641 3.544 3.051 0.229 0.132 -0.361
no.10 3.315 3.577 2.699 2.813 0.262 -0.616 -0.502R * 0.999 0.951 0.915
R = Spearman correlation coefficient regarding * (p≤0.006) Lab PCR: laboratory-developed PCR (on LightCycler amplification platform), Artus PCR: Qiagen Artus EBV RG PCR kit (on rotor-gene amplification platform), Argene PCR: Argene EBV R-gene kit (on rotor-gene amplification platform) Delta log10 copies/mL = difference between PCRs and expected results
on October 13, 2019 by guest
http://jcm.asm
.org/D
ownloaded from

0,5
1
1,5
2
og10
Q-L
ab)
AFigure 1
-2
-1,5
-1
-0,5
0
0 1 2 3 4 5 6 7 8
(log10 MP Lab + log10 Q Lab)/2
(log1
0 M
P-La
b - l
o
0
0,5
1
1,5
2
- log
10 Q
-A)
(log10 MP-Lab + log10 Q-Lab)/2
B
-2
-1,5
-1
-0,5
0
0 1 2 3 4 5 6 7 8
(log10 Q-Lab + log10 Q-A)/2
(log1
0 Q
-Lab
0
0,5
1
1,5
2
b - l
og10
Q-R
)
C
-2
-1,5
-1
-0,5 0 1 2 3 4 5 6 7 8
(log10 Q-Lab + log10 Q-R)/2
(log1
0 Q
-Lab
2D
-0 5
0
0,5
1
1,5
2
0 1 2 3 4 5 6 7 8Q-A
- lo
g10
Q-R
)
D
-2
-1,5
-1
-0,5
(log10 Q-A + log10 Q-R)/2
(log1
0 Q
on October 13, 2019 by guest
http://jcm.asm
.org/D
ownloaded from

Legend of figure 1: Bland-Altman analysis of EBV DNA load positive with both technologiestechnologies.A: Comparison of extraction robots: MagNApure + laboratory developed PCR on LightCycler instrument (MP-Lab) with Qiacube + laboratory-developed PCR on LightCycler instrument (Q-Lab). n=159.B: Comparison of laboratory-developed PCR (Qiacube + laboratory-developed PCR on LightCycler instrument: Q-Lab) with Artus EBV RG PCR kit (Qiacube + EBV RG PCR kit on rotor-gene instrument: Q-A). n=154.EBV RG PCR kit on rotor gene instrument: Q A). n 154.C: Comparison of laboratory-developed PCR (Qiacube + laboratory-developed PCR on LightCycler instrument: Q-Lab) with Argene EBV R-gene kit (Qiacube + EBV R-gene kit on rotor-gene instrument: Q-R). n=156.D: Comparison of Artus EBV RG PCR kit (Q-A) and Argene EBV R-gene kit (Q-R).The bold line represents the mean differences/2 for the samples; the thin lines represents the mean ± 1.96 standard deviation. n=151.
on October 13, 2019 by guest
http://jcm.asm
.org/D
ownloaded from

Patient 1 MP-Lab
Q-Lab
Q-A
Patient 2
Figure 2
0
1
2
3
4
5
6
log1
0 EB
V D
NA
cop
ies/
mL
Q
Q-R
0
1
2
3
4
5
6
log1
0 EB
V D
NA
cop
ies/
mL
MP-Lab
Q-Lab
Q-A
Q-R
07/0
2/200
7
11/1
2/200
7
03/0
1/200
8
11/0
1/200
8
18/0
1/200
8
25/0
1/200
8
04/0
2/200
8
05/0
3/200
8
15/0
7/200
8
23/0
7/200
8
29/0
7/200
8
04/0
8/200
8
14/0
1/200
80
2008
/07/
25
2008
/11/
25
2008
/12/
29
2009
/01/
05
2009
/01/
12
2009
/01/
19
2009
/01/
23
2009
/01/
26
2009
/01/
30
Patient 3
4
5
6
opie
s/m
L
MP-Lab
Q-Lab
Q-A
Q-R
Patient 4
4
5
6
copi
es/m
L
0
1
2
3
4
2007
/11/
06
2008
/01/
03
2008
/01/
04
2008
/01/
14
2008
/01/
25
2008
/02/
19
2008
/07/
22
2008
/08/
24
2008
/08/
29
2008
/10/
29
2008
/11/
28
2008
/12/
05
log1
0 EB
V D
NA
co
0
1
2
3
2008
/03/
03
2008
/03/
10
2008
/06/
18
2008
/07/
04
2008
/07/
17
2008
/09/
19
2008
/11/
17
2008
/12/
16
2009
/01/
13
log1
0 EB
V D
NA
MP-Lab
Q-Lab
Q-A
Q-R
Patient 5
2
3
4
5
6
g10
EBV
DN
A c
opie
s/m
L
MP-Lab
Q-Lab
Q-A
Q-R
Patient 6
2
3
4
5
6
og10
EB
V D
NA
cop
ies/
mL
MP-LabQ-LabQ-AQ R
0
1
2008
/07/
11
2008
/09/
15
2009
/01/
05
2009
/02/
02
2009
/02/
10
2009
/02/
23
2009
/03/
02
2009
/03/
09
2009
/03/
13
2009
/03/
24
2009
/03/
31
log
0
1
2008
/06/
05
2008
/06/
16
2008
/06/
19
2008
/06/
23
2008
/08/
17
2008
/11/
25
lo Q-R
Patient 7
5
6
L
Patient 8
5
6
L
0
1
2
3
4
5
09/2
007
/30
04/1
004
/30
05/2
107
/16
08/2
709
/17
10/0
910
/30
11/2
012
/30
02/0
5
log1
0 EB
V D
NA
cop
ies/
mL
MP-Lab
Q-Lab
Q-A
Q-R
0
1
2
3
4
/04/
28
/05/
27
/06/
11
/09/
25
/10/
29
/01/
15
/02/
25
log1
0 EB
V D
NA
cop
ies/
mL
MP-Lab
Q-Lab
Q-A
Q-R
2006
/09/
2007
/07/
2008
/04/
2008
/04/
2008
/05/
2008
/07/
2008
/08/
2008
/09/
2008
/10/
2008
/10/
2008
/11/
2008
/12/
2009
/02/
2008
/04
2008
/05
2008
/06
2008
/09
2008
/10
2008
/0
2008
/02
on October 13, 2019 by guest
http://jcm.asm
.org/D
ownloaded from

Legend of figure 2: Follow-up using four different EBV DNA load technologies forLegend of figure 2: Follow-up, using four different EBV DNA load technologies, for eight patients with various pathologies.Patient 1: Hematopoietic stem cell transplantation (HSCT) recipient with non-Hodgkin lymphoma (NHL), Patient 2: HSCT recipient (D+/R−), Patient 3: kidney transplant recipient (D+/R−), Patient 4: kidney transplant recipient (D+/R−), Patient 5: kidney transplant recipient (D+/R−), Patient 6: HIV, Patient 7: hypogammaglobulinemia with EBV primary infection, Patient 8: EBV encephalitis.p y , pD/R EBV serological status Donor/RecipientMP: MagNApure extraction, Q: Qiacube extraction, Lab: laboratory developed real-time PCR (on LightCycler amplification platform), A: Qiagen Artus EBV RG PCR kit (on rotor gene amplification platform), R = Argene EBV R-gene kit (on rotor-gene amplification platform)
on October 13, 2019 by guest
http://jcm.asm
.org/D
ownloaded from