Embed Size (px)
Citation preview

8th Grade Math Scope & Sequence 2014
8th Grade Year at a Glance
1st Trimester 1st Trimester 2nd Trimester 2nd Trimester 3rd Trimester 3rd Trimester
Standards 8.EE.1 8.EE.2 8.EE.3 8.EE.4 8.NS.1 8.NS.2
Practice Standards
8.EE.2 8.EE.7
Practice Standards
8.G.1 8.G.2 8.G.3 8.G.4 8.G.5 8.G.6 8.G.7 8.G.8 8.G.9
Practice Standards
8.EE.5 8.EE.6 8.EE.8
Practice Standards
8.EE.5 8.EE.6 8.EE.8 8.F.1 8.F.2 8.F.3 8.F.4 8.F.5
Practice Standards
8.SP.1 8.SP.2 8.SP.3 8.SP.4
Practice Standards
Units 1 & 2 3 4 5 6 & 7 8
Big Ideas 2012
Chap 6, 9 Chap 1, 6, 8 Chap 5, 6 & Additional Topics
Chap 1, 2, 3 Chap 1, 2, 3, 4 Chap 7
Big Ideas 2014
Chap 7, 10 Chap 1, 7 Chap 2, 3, 7 8 Chap 4, 5 Chap 4, 5, 6 Chap 9
Prioritized Vocabulary
Perspective Evidence Explain
Evaluate Synthesize Analyze
Justify Relevance Opinion
Analyze Reason Interpret
Accuracy Reliability Source
Correlation Infer Production
Unit Theme Motivation Influence Adversity Change Innovation Progress
Math Concepts
Exponents & Radicals Scientific Notations Rational & Irrational Numbers
Solving Equations Geometry: Volume, Angles, Triangles
Rate of Change Graphing & Interpreting Equations
Writing Equations Solving & Graphing Systems Interpreting Graphs & Functions
Statistics Scatter Plots Line of Best Fit
Science Connections
Physical & Chemical Change, Energy Conversion
Energy from the Sun, Organisms Response to Energy
Climate Change, Alternative Energies
Rock & Fossil Formation
Energy, Force & Motion Alternative Energies

8th Grade Math Scope & Sequence 2014
Social Studies
Connections
Geography Concepts & Skills Native Americans & Explorers
Colonization of the US
Revolution & Gaining Independence
Government & Constitution
Bill of Rights
Territorial & Political Expansion
Social Rights
Civil War & Reconstruction
English Language Arts
Connections
Analyze Idea Development, Gathering Credible Evidence, Collaborative Discussion Verbs
Analyze Conflicting Information, Literary Non-‐Fiction Analytical Discussions
Analyze Development of a Main Idea, Evaluate Reasoning
Point of View, Responding to Conflicting Evidence, Creating Cohesion
Use/Evaluate Different Mediums, Address Audience in Writing
Analyze Point of View, Analyze Patterns, Narrative Technique
PE & Health Concepts
Self-‐concept, Mental Health, Physical Fitness, Stress Management
Decision Making, Sportsmanship, Media Literacy
Peer Pressure & Refusal Skills, Addiction, Abstinence, & Illegal Drugs
Abstinence, Nutrition, First Aid, Infectious Disease
Human Development, Teamwork
Communication, Puberty

8th Grade Math Scope & Sequence 2014
Standard Big Ideas 2012 Big Ideas 2014 Performance Task(s) 8.EE.1 -‐ Know and apply the properties of integer exponents to generate equivalent numerical expressions.
9.1 Exponents 9.2 Product of Powers
Property 9.3 Quotient of Powers
Property 9.4 Zero & Negative Exponents
10.1 Exponents 10.2 Product of
Powers Property 10.3 Quotient of
Powers Property 10.4 Zero and Negative Exponents
Big Ideas: Astronomy after 9.4 (2012) Explain why 3! ∙ 3! = 3! and not 9!
8.EE.2 -‐ Use square root and cube root symbols to represent solutions to equations of the form x2= p and x3= p, where p is a positive rational number. Evaluate square roots of small perfect squares and cube roots of small perfect cubes. Know that √2 is irrational.
6.1 Finding Square Roots 6.3 Approximating Square
Roots 6.3b Real Numbers
7.1 Finding Square Roots
7.2 Finding Cube Roots
7.4 Approximating Square Roots
Big Ideas: Nested Boxes after 6.3 (2012) Is the square root of a number always smaller than the number itself?
8.NS.1 -‐ Know that numbers that are not rational are called irrational. Understand informally that every number has a decimal expansion; for rational numbers show that the decimal expansion repeats eventually, and convert a decimal expansion which repeats eventually into a rational number.
6.3 Approximating Square Roots
7.4 Approximating Square Roots
7.4 Ext. Repeating Decimals
Big Ideas: Gravity after 6.4 (2012)
8.NS.2 -‐ Use rational approximations of irrational numbers to compare the size of irrational numbers, locate them approximately on a number line diagram, and estimate the value of expressions (e.g. π2).
6.3 Approximating Square Roots
6.3b Real Numbers
7.4 Approximating Square Roots
Big Ideas: Australian Football after 6.4 (2012)
8.EE.3 -‐ Use numbers expressed in the form of a single digit times an integer power of 10 to estimate very large or very small quantities, and to express how many times as much one is than the other.
9.5 Reading Scientific Notation
9.6 Writing Scientific Notation
9.6b Scientific Notation
10.5 Reading Scientific Notation 10.6 Writing Scientific Notation
Big Ideas: Metallic Lattice after 9.6 (2012) Provide two (2) original (not teacher-‐given) real-‐life situations that could be illustrated using powers of ten, one that describes a very small number and one that describes a very large number. Estimate how much larger one is than the other.

8th Grade Math Scope & Sequence 2014
8.EE.4 -‐ Perform operations with numbers expressed in scientific notation, including problems where both decimal and scientific notation are used. Use scientific notation and choose units of appropriate size for measurements of very large or very small quantities (e.g., use millimeters per year for seafloor spreading). Interpret scientific notation that has been generated by technology.
9.5: Reading Scientific Notation
9.6 Writing Scientific Notation
9.6b Scientific Notation
10.7 Operations in Scientific Notation
Big Ideas: Population & Land Areas after 9.6 (2012) Express your age at your last birthday in each of the following units: years, months, weeks, days, hours, minutes and seconds. Which values would be useful to write in scientific notation? Justify your reasoning. Compare your age to that of the 4.5 billion year old earth.
8.EE.2* -‐ Use square root and cube root symbols to represent solutions to equations of the form x2= p and x3= p, where p is a positive rational number. Evaluate square roots of small perfect squares and cube roots of small perfect cubes. Know that √2 is irrational.
6.2 The Pythagorean Theorem
6.5 Using the Pythagorean Theorem
7.3 The Pythagorean Theorem
7.5 Using the Pythagorean Theorem
Big Ideas: Nested Boxes after 6.3 (2012)
8.EE.7 -‐ Solve linear equations in one variable.
a. Give examples of linear equations in one variable with one solution, infinitely many solutions, or no solutions. Show which of these possibilities is the case by successively transforming the given equation into simpler forms, until an equivalent equation of the form x = a, a = a, or a = b results (where a and b are different numbers.)
b. Solve linear equations with rational number coefficients, including equations whose solutions require expanding expressions using the distributive property and collecting like terms.
1.1 Solving Simple Equations
1.2 Solving Multi-‐Step Equations
1.3 Solving Equations with Variables on both sides
1.3b Solutions of Linear Equations
1.1 Solving Simple Equations
1.2 Solving Multi-‐Step Equations
1.3 Solving Equations with Variables on Both Sides
1.4 Rewriting equations and formulas
5.4 Ext, Solving Linear Equations by Graphing
Big Ideas: Kennel Fees after 1.3 (2012) Create equations that would result in one solution, no solutions, or infinitely many solutions. What is it about the structure of the original equation that reveals the number of solutions?

8th Grade Math Scope & Sequence 2014
8.G.1 -‐ Verify experimentally the properties of rotations, reflections, and translations: a. Lines are taken to lines, and line segments to line segments of the same length. b. Angles are taken to angles of the same measure. c. Parallel lines are taken to parallel lines.
Topic 1 Transformations 2.2 Translations 2.3 Reflections 2.4 Rotations
Big Ideas-‐ New Subdivision after Topic 1 (2012) Create a tessellation using rotations, reflections, and translations.
8.G.2 -‐ Understand that a two-‐dimensional figure is congruent to another if the second can be obtained from the first by a sequence of rotations, reflections, and translations; given two congruent figures, describe a sequence that exhibits the congruence between them.
Topic 1 Transformations 2.1 Congruent Figures 2.2 Translations 2.3 Reflections 2.4 Rotations
Big Ideas-‐ Alumni Center after Topic 1 (2012) Find at least two different ways to describe the transformation(s) that map the first figure onto the second. (horizontal arrow to vertical arrow) NC p.27 #1
8.G.3 -‐ Describe the effect of dilations, translations, rotations, and reflections on two-‐dimensional figures using coordinates.
Topic 1 Transformations 2.2 Translations 2.3 Reflections 2.4 Rotations 2.7 Dilations
Big Ideas-‐ Transformations after Topic 1 (2012) Given an original shape and its image on a coordinate plane, determine the rule or rules that translated the original to the resulting image. The vertices of Triangle A are (1,0), (1,1), (0,0) and A’ are (2,1), (2,2), (3,1). Describe the transformations done on A to result in A’.
8.G.4 -‐ Understand that a two-‐dimensional figure is similar to another if the second can be obtained from the first by a sequence of rotations, reflections, translations, and dilations; given two similar two-‐dimensional figures, describe a sequence that exhibits the similarity between them.
Topic 1 Transformations 2.5 Similar Figures 2.6 Perimeters and
Areas of Similar Figures
2.7 Dilations
Big Ideas-‐ Soccer Complex after Topic 1 (2012) NC p.30 #1

8th Grade Math Scope & Sequence 2014
8.G.9 -‐ Know the formulas for the volumes of cones, cylinders, and spheres and use them to solve real-‐world and mathematical problems.
Topic 2 Volume 8.1: Volumes of Cylinders 8.2: Volumes of Cones 8.3: Volumes of Spheres 8.4: Surface Area and Volumes of Similar Solids
Big Ideas-‐ Coffee after Topic 2 (2012) What does the height of the cone need to be so that one spherical scoop of ice cream with the same radius as the cone won’t overflow if it all melts? A Christmas tree is 7ft tall with a 5ft diameter at the base, with one foot between the floor and lowest branch. How far up the tree should your first of two strings of lights end so that you will have enough lights to evenly fill the Christmas tree? NC p.36-‐38
8.G.5 -‐ Use informal arguments to establish facts about the angle sum and exterior angle of triangles, about the angles created when parallel lines are cut by a transversal, and the angle-‐angle criterion for similarity of triangles.
5.1Classifying Triangles ** 5.2 Angles & Sides of
Triangles 5.4 Using Similar
Triangles 5.5 Parallel Lines & Transversals
3.1 Parallel Lines and Transversals
3.2 Angles of Triangles
3.4 Using Similar Triangles
Big Ideas-‐ Intersection after 5.5 (2012) The streets 400 E and 900 E run north and south. Euclid Drive cuts both of these streets at an angle from SE to NW. Pythagoras Way passes through all three streets SW to NE. Are all possible triangles created by the intersections of the streets similar? Justify. NC p.21-‐32 #1, 3, 4
8.G.6 -‐ Explain a proof of the Pythagorean Theorem and its converse.
6.2: The Pythagorean Theorem
6.5: Using the Pythagorean Theorem
7.3: The Pythagorean Theorem 7.5: Using the Pythagorean Theorem
Big Ideas-‐ Garfield’s Proof after 6.2 (2012) Investigate the historical context of one of the proofs of Pythagorean Theorem and present the proof in context to the class. NC p.33 #1
8.G.7 -‐ Apply the Pythagorean Theorem to determine unknown side lengths in right triangles in real-‐world and mathematical
6.2 The Pythagorean Theorem
7.3: The Pythagorean Theorem
Big Ideas-‐ Bird Cage after 6.5 (2012)

8th Grade Math Scope & Sequence 2014
problems in two and three dimensions. 6.5 Using the Pythagorean Theorem
7.5: Using the Pythagorean Theorem
Tv’s are measured along their diagonal to find their dimension. How does a 52 inch HD (wide-‐screen) TV compare to a traditional 52 inch (full screen) TV? NC p. 33-‐34 #1, 2
8.G.8 -‐ Apply the Pythagorean Theorem to find the distance between two points in a coordinate system.
6.5 Using the Pythagorean Theorem
7.5: Using the Pythagorean Theorem
Big Ideas-‐ Tank Capture after 6.5 (2012) NC p. 34-‐35 #1,2
8.EE.5 -‐ Graph proportional relationships, interpreting the unit rate as the slope of the graph. Compare two different proportional relationships represented in different ways. For example, compare a distance-‐time graph to a distance-‐time equation to determine which of two moving objects has greater speed.
2.2 Slope of a Line 4.4b Comparing Rates
4.1 Graphing Linear Equations 4.3 Graphing Proportional Relationships
Big Ideas-‐ Assembly Lines after 4.4 (2012) Give examples of relationships that are proportional and relationships that are linear, but not proportional. NC p.13 #1
8.EE.6 -‐ Use similar triangles to explain why the slope m is the same between any two distinct points on a non-‐vertical line in the coordinate plane; derive the equation y = mx for a line through the origin and the equation y = mx + b for a line intercepting the vertical axis at b.
2.2b Triangles and Slope 2.3 Graphing Linear Equations in Slope-‐Intercept Form 2.4 Graphing Linear Equations in Standard Form 3.1 Writing Equations in Slope-‐Intercept Form 3.2 Writing Equations Using Slope and a Point 3.4 Solving Real Life Problems
4.2 Slope of a Line 4.2 Ext Slopes of Parallel & Perpendicular Lines 4.3 Graphing Proportional Relationships 4.4 Graphing Linear Equations in Slope-‐Intercept Form 4.5 Graphing Linear Equations in Standard Form
NC p. 14 #1 How is it possible to have similar triangles that do not yield the same slope?

8th Grade Math Scope & Sequence 2014
8.EE.8 -‐ Analyze and solve pairs of simultaneous linear equations.
a. Understand that solutions to a system of two linear equations in two variables correspond to points of intersection of their graphs, because points of intersection satisfy both equations simultaneously.
b. Solve systems of two linear equations in two variables algebraically, and estimate solutions by graphing the equations. Solve simple cases by inspection.
c. Solve real-‐world and mathematical problems leading to two linear equations in two variables.
2.1 Graphing Linear Equations 2.5 Systems of Linear Equations 2.6 Special Systems of Linear Equations 2.7 Solving Equations by Graphing
5.1 Solving Systems by Graphing 5.2 Solving Systems by Substitution 5.3 Solving Systems by Elimination 5.4 Solving Special Systems 5.4 Ext. Solving Linear equations by graphing
Big Ideas-‐ Party after 3.5 (2012) Create equations that would result in one solution, no solutions or infinitely many solutions. What is it about the structure of the original equation that reveals the number of solutions? NC p.16 #1
8.EE.6 -‐ Use similar triangles to explain why the slope m is the same between any two distinct points on a non-‐vertical line in the coordinate plane; derive the equation y = mx for a line through the origin and the equation y = mx + b for a line intercepting the vertical axis at b.
3.1 Writing Equations in Slope-‐Intercept Form 3.2 Writing Equations Using Slope and a Point 3.3 Writing Equations Using Two Points 3.4 Solving Real Life Problems
4.4 Graphing Linear Equations in Slope-‐Intercept Form
Big Ideas -‐ School Lunch after 3.4 (2012)
8.EE.8 -‐ Analyze and solve pairs of simultaneous linear equations. c. Solve real-‐world and mathematical problems leading to two linear equations in two variables.
3.5 Writing Systems of Linear Equations
4.6 Writing Equations in Slope-‐Intercept Form 4.7 Writing Equations in Point-‐Slope Form
Big Ideas-‐ Party after 3.5 (2012)
8.F.1 -‐ Understand that a function is a rule that assigns to each input exactly one output. The graph of a function is the set of ordered pairs consisting of an input and the corresponding output.
4.1 Domain and Range of a Function 4.2 Discrete and Continuous Domains 4.3 Linear Function Patterns
6.1 Relations and Functions 6.2 Representations of Functions
Big Ideas – Touchdowns after 4.1 (2012) Find three relationships in the real world that can be represented by functions, and three that are not functions.

8th Grade Math Scope & Sequence 2014
4.4 Comparing Linear and Nonlinear functions
NC p. 19
8.F.2 -‐ Compare properties of two functions each represented in a different way (algebraically, graphically, numerically in tables, or by verbal descriptions).
4.1 Domain and Range of a Function 4.2 Discrete and Continuous Domains 4.3 Linear Function Patterns 4.4 Comparing Linear and Nonlinear functions 4.4b Comparing rates
6.3 Linear Functions Big Ideas -‐ Cross Country after 4.4 (2012) Billy argues that the equation y = 4x + 5 is equivalent to the equation of the line that goes through (2, 6) and (3, 10). Is he correct? Justify. NC p. 20
8.F.3 -‐ Interpret the equation y = mx + b as defining a linear function, whose graph is a straight line; give examples of functions that are not linear.
4.3 Linear Function Patterns 4.4 Comparing Linear and Nonlinear Functions
6.3 Linear Functions 6.4 Comparing Linear and Nonlinear Functions
Big Ideas -‐ Space Shuttle after 4.3 (2012) Hermione argues that the table below represents a linear function. Is she correct? x 2 4 8 16 y 1 3 5 7 NC p. 21
8.F.4 -‐ Construct a function to model a linear relationship between two quantities. Determine the rate of change and initial value of the function from a description of a relationship or from two (x, y) values, including reading these from a table or from a graph. Interpret the rate of change and initial value of a linear function in terms of the situation it models, and in terms of its graph or a table of values.
4.3 Linear Function Patterns
4.6 Writing Equations in Slope-‐Intercept Form 4.7 Writing Equations in Point-‐Slope Form; 6.3 Linear Functions
Big Ideas -‐ Remote Helicopter after 4.3 (2012) Wally created the table below for a function he knows to be linear. He thinks something must be wrong with his table because he can’t find the original function from the table. Find the error and the original function. Explain your strategy for finding the error. 3.2 6.4 9.6 12.8 17.8 30.6 43.4 56.2 16 19.2 22.4 25.6 66 81.8 94.6 107.4 NC p.23

8th Grade Math Scope & Sequence 2014
8.F.5 -‐ Describe qualitatively the functional relationship between two quantities by analyzing a graph (e.g., where the function is increasing or decreasing, linear or nonlinear). Sketch a graph that exhibits the qualitative features of a function that has been described verbally.
4.4 Comparing Linear and Nonlinear Functions
6.5 Analyzing and Sketching Graphs
Big Ideas: Egg-‐Dropping Experiment after 4.4 (2012) Graph your distance from the school over time for the hours from 6 am to 9 am. NC p.25
8.SP.1 -‐ Construct and interpret scatter plots for bivariate measurement data to investigate patterns of association between two quantities. Describe patterns such as clustering, outliers, positive or negative association, linear association, and nonlinear association.
7.3 Scatter Plots and Lines of Best Fit
9.1 Scatter Plots 9.2 Lines of Fit 9.4 Choosing a Data Display
Big Ideas: Children’s Vocabulary after 7.3 (2012) Compare class test scores to hours of television watched.
• Predict whether there is positive, negative or no association.
• Collect data and make a scatter plot. • Compare your prediction to the
scatter plot result. • Describe any association you
observe. Interpret your findings and explain your reasoning.
8.SP.2 -‐ Know that straight lines are widely used to model relationships between two quantitative variables. For scatter plots that suggest a linear association, informally fit a straight line, and informally assess the model fit by judging the closeness of the data points to the line.
7.3 Scatter Plots and Lines of Best Fit *missing informally assess the model fit.
9.2 Lines of Fit Big Ideas: Class Attendance after 7.3 (2012) (picture of scatterplot graph with two lines) Which line is the best fit for the data? Justify your answer.
8.SP.3 -‐ Use the equation of a linear model to solve problems in the context of bivariate measurement data, interpreting the slope and intercept.
7.3 Scatter Plots and Lines of Best Fit *missing interpreting the slope and intercept.
9.2 Lines of Fit Big Ideas: Fossils after 7.3 (2012) Create a story problem that uses a line with a slope of 2/5 and a y-‐intercept of 3. Describe the meaning of the slope and y-‐intercept in the context of the problem.

8th Grade Math Scope & Sequence 2014
8.SP.4 -‐ Understand that patterns of association can also be seen in bivariate categorical data by displaying frequencies and relative frequencies in a two-‐way table. Construct and interpret a two-‐way table summarizing data on two categorical variables collected from the same subjects. Use relative frequencies calculated for rows or columns to describe possible association between the two variables.
7.3b Two-‐Way Tables 9.3 Two Way Table Big Ideas: Vision after 7.3 (2012) Construct a two-‐way table to display data from two or more categories. Explain why you believe there is or is not an association between the two variables.

8th Grade Math Scope & Sequence 2014
Scope and Sequence Broken Down By Units (2012)
Unit 1: Exponents & Radicals
Unit 2: Scientific Notation
Unit 3: Equations
Unit 4: Geometry
Unit 5: Graphing & Systems
Unit 6: Writing Linear Equations & Systems
Unit 7: Functions
Unit 8: Statistics & Data
Analysis
9.1 9.2 9.3 9.4 6.1 6.3 6.3B
9.5 9.6 9.6B
1.1** 1.2 1.3 1.3B 1.4
Part A: Transformations: pg. 398 Volume: pg. 402
Part B: 5.1** 5.2 5.4 5.5 6.2 6.5
2.1** 2.2 2.2B 2.3 2.5 2.6 2.7
3.1 3.2 3.3 3.4 3.5
4.1 4.3 4.4 4.4B
7.3 7.3B
** These sections are not covered explicitly in the 8th grade core. Teachers should use discretion as to whether or not these sections should be taught for background knowledge, review, or extension based upon the needs of their students. *Honors: 4 additional topics – Fair division and apportionment, Voting Theory, Set Theory, and 3-‐D Graphing & Graphing Theory. Curriculum guides attached. May be taught when appropriate. Strongly suggested to teach at least SET Theory.

8th Grade Math Scope & Sequence 2014
Scope and Sequence Broken Down By Units (2014
Unit 1: Exponents & Radicals
Unit 2: Scientific Notation
Unit 3: Equations
Unit 4: Geometry
Unit 5: Graphing & Systems
Unit 6: Writing Linear Equations & Systems
Unit 7: Functions
Unit 8: Statistics & Data
Analysis
10.1 10.2 10.3 10.4 7.1 7.2 7.4 7.4ext
10.5 10.6 10.7
7.3 7.5 1.5 1.6 1.7 1.8 5.4
Part A: 2.1 2.2 2.3 2.4 2.7 8.1 8.2 8.3 8.4
Part B: 3.1 3.2 3.4 7.3 7.5
4.1 4.2 4.3 4.4 4.5 5.1 5.2 5.3 5.4
4.4 4.6 4.7
6.1 6.2 6.3 6.4 6.5 4.6 4.7
9.1 9.2 9.3 9.4
** These sections are not covered explicitly in the 8th grade core. Teachers should use discretion as to whether or not these sections should be taught for background knowledge, review, or extension based upon the needs of their students. *Honors: 4 additional topics – Fair division and apportionment, Voting Theory, Set Theory, and 3-‐D Graphing & Graphing Theory. Curriculum guides attached. May be taught when appropriate. Strongly suggested to teach at least SET Theory.

8th Grade Math Scope & Sequence 2014
8. H.1 -‐ Honors: Fair Division & Apportionment Standard: Understand the concepts and applications of fairness and apportionment. Concepts and Skills to Master • Understand the concept of fairness as equal division of like or unlike objects and apportionment as proportional division of like objects. • Understand that fair division may be discrete or continuous while apportionment must be discrete. • Determine mathematical criteria for fairness, using both quantitative and qualitative measures. • Determine mathematical criteria for apportionment. • Understand the use of apportionment in the U.S. political system. Guiding Instructional Questions • If everyone gets the same thing, is that always fair? • How is the number of representatives a state gets determined? • How can 17 students fairly divide 3 pizzas, each with 8 slices, without cutting additional pieces? • In which situations is apportionment preferable to fair division? • How is apportionment used in U.S. Presidential elections? Instructional Strategies • Conduct a mock negotiation using principles of fairness and well posed arguments. • Explore various methods of apportionment • Compare different methods of apportionment such as Hamilton’s Method vs. Jefferson’s Method. • Fairly divide a budget between 5 clubs at your school when each has need for more than 1/5 of the budget. • Give small groups of students something (candy, objects, etc.) to divide fairly with no guidelines to develop the concept of fair
division. • Find two different ways to fairly divide a scalene right triangle into 3 equal parts. • Study apportionment in connection with current elections.

8th Grade Math Scope & Sequence 2014
8.H.1 – Fair Division and Apportionment Additional Resources
• Understand the concept of fairness as equal division of like or unlike objects and apportionment as proportional division of like objects. http://www4.ncsu.edu/~kaltofen/courses/DiscreteModels/Fall01/apportionment.pdf
• Understand that fair division may be discrete or continuous while apportionment must be discrete.
• Determine mathematical criteria for fairness, using both quantitative and qualitative measures.
• Determine mathematical criteria for apportionment. http://www.ctl.ua.edu/math103/apportionment/appmeth.htm
• Understand the use of apportionment in the U.S. political system
http://www.census.gov/population/apportionment/data/2010_apportionment_results.html
• History of apportionment http://www.census.govpopulation/apportionment/about/history.html

8th Grade Math Scope & Sequence 2014
8. H.2 -‐ Honors: Voting Theory Standard: Examine different methods of voting. Concepts and Skills to Master • Understand different voting systems. • Determine the results of an election using various voting systems.
Guiding Instructional Questions • What issues does “majority rule” raise? • Why might different voting systems produce different outcomes? • How might knowing the voting method change the way a voter would vote? • How might knowing the voting method change the way a candidate would run a campaign? • Is there a better way to conduct an election for president than the Electoral College? Instructional Strategies • Compare and contrast the results of various voting methods (e.g. plurality, approval, ranking, run-‐off). • Conduct class votes on various topic(s) and compute the results using various methods. • Research how different countries conduct elections and count votes and compare them to the way the U.S. votes. • Write a letter to the principal arguing for a method of voting on class elections. • Consider covering this topic in conjunction with current or most recent state/national election results. 8.H.2 -‐ Voting Theory Additional Resources
• Understand different voting systems (plurality, approval, ranking, run-‐off) https://www.mtholyoke.edu/acad/polit/damy/BeginnningReading/types.htm http://www.ctl.ua.edu/math103/voting/whatdowe.htm
• Determine the results of an election using various voting systems.
http://faculty.nwfsc.edu/web/math/mizellm/Spring2012/1107/142notes.pdf

8th Grade Math Scope & Sequence 2014
8.H.3 Honors: Set Theory Standard: Understand sets and use set notation to communicate mathematical ideas. Concepts and Skills to Master • Understand the definition and classifications of sets and subsets. • Use the element set notation for union ∪ , element ∈ , intersection ∩ , non-‐element ∉ , null set Ø. • Find unions and intersections of sets given a description, set notation, or a graph. Guiding Instructional Questions • How can set notation be used to communicate mathematical ideas? • Are Ø, 0, and “no solution” equivalent? • Do R (all real numbers) and “infinitely many solutions” mean the same thing? Instructional Strategies • Use set notation for Real [R], Integer [Z], Natural [N], Whole [W], Prime [P], Rational [Q], Irrational [I] numbers. • Create Venn Diagrams to indicate sets, subsets, intersections, and unions. • Explore the concept of closure in sets. • Compare and contrast intersections of sets and unions of sets. 8.H.3 – Set Theory Additional Resources
• Understand the definition and classifications of sets and subsets. http://www.mathsisfun.com/sets/sets-‐introduction.html
• Use the element set notation for union, element, intersection, non-‐element, and null set. • Find unions and intersections of sets given a description, set notation, or a graph.
http://www.sparknotes.com/math/algebra1/compoundinequalities/section2.rhtml
8th Grade Math Scope & Sequence 2014
8.H.4 -‐ Honors: 3-‐D Graphing & Graph Theory Standard: Use graphing techniques to model situations that extend beyond the coordinate plane. Concepts and Skills to Master • Graph points and line segments in a three-‐dimensional coordinate system. • Use Euler Circuits to describe and solve problems involving network paths. • Use Hamiltonian Circuits to describe and solve problems involving network paths. Guiding Instructional Questions • How do computer programmers draw 3-‐D spaces on a 2-‐D screen? • How can a delivery truck drive an efficient route? • How can a snowplow drive an efficient route? • How does the efficient route for a delivery truck differ from that of a snowplow? • What is operations research? Instructional Strategy • Use technology to construct 3-‐D graphs. • Compare historical computer game graphics to modern computer game graphics • Use puzzles and classic mathematics problems such as the Konigsberg Bridge to explore Euler Circuits and continuous paths. • Create circuits that describe contextual problems. • Explore sociological behavior using networks. • Compare and contrast Euler and Hamiltonian Circuits for the same networks.

8th Grade Math Scope & Sequence 2014
8.H.4 – 3-‐D Graphing & Graphing Theory Additional Resources • Graph points & line segments in a 3-‐dimension coordinate system.
http://www.wikihow.com/Plot-‐Points-‐in-‐Three-‐Dimensions http://www.wright.edu/~chaocheng.huang/lecture/mth231/231sec2_1.pdf (Challenging, more for teacher understanding)
• Use Euler Circuits to describe & solve problems involving network paths. http://mathforum.org/isaac/problems/bridges2.html http://www.ctl.ua.edu/math103/euler/howcanwe.htm
• Use Hamiltonian Circuits to describe and solve problems involving network paths. http://www.informatik.uni-‐kiel.de/~gej/publ/nizhny_novgorod.pdf http://www.ctl.ua.edu/math103/hamilton/analyzin.htm
8th Grade Math Scope & Sequence 2014
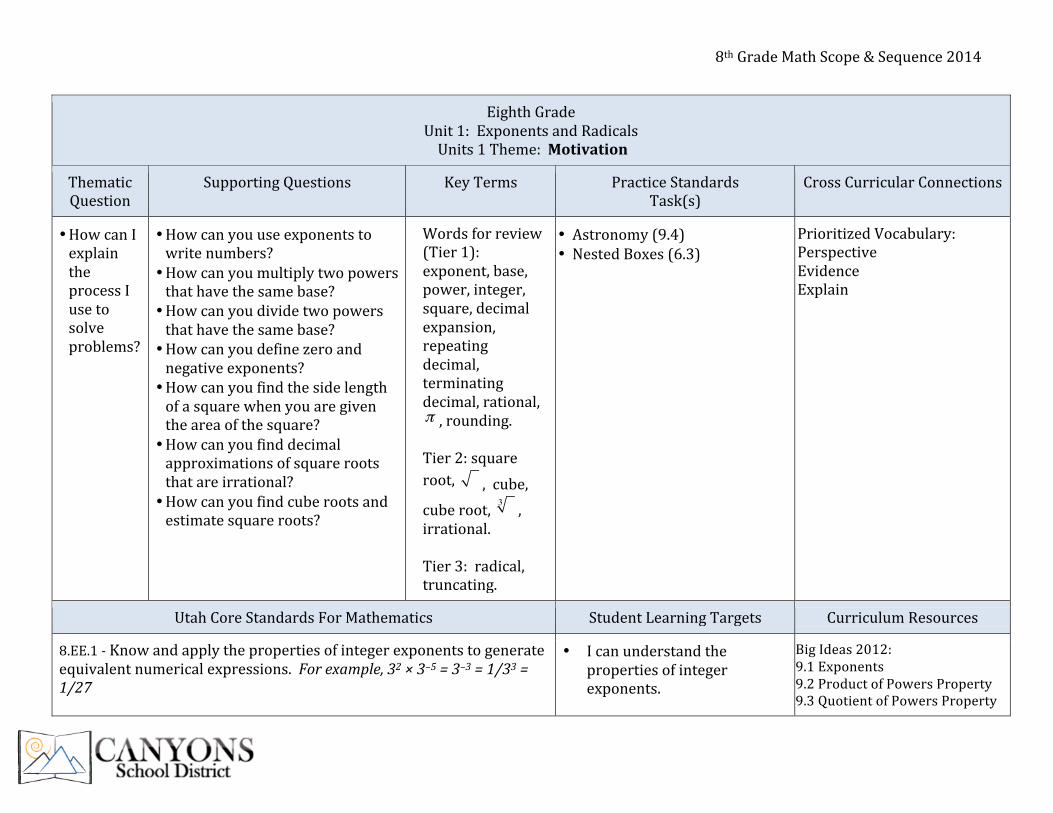
Eighth Grade Unit 1: Exponents and Radicals Units 1 Theme: Motivation
Thematic Question
Supporting Questions Key Terms
Practice Standards Task(s)
Cross Curricular Connections
• How can I explain the process I use to solve problems?
• How can you use exponents to write numbers? • How can you multiply two powers that have the same base? • How can you divide two powers that have the same base? • How can you define zero and negative exponents? • How can you find the side length of a square when you are given the area of the square? • How can you find decimal approximations of square roots that are irrational? • How can you find cube roots and estimate square roots?
Words for review (Tier 1): exponent, base, power, integer, square, decimal expansion, repeating decimal, terminating decimal, rational, π , rounding. Tier 2: square root, , cube, cube root, 3 , irrational. Tier 3: radical, truncating.
• Astronomy (9.4) • Nested Boxes (6.3)
Prioritized Vocabulary: Perspective Evidence Explain
Utah Core Standards For Mathematics Student Learning Targets Curriculum Resources
8.EE.1 -‐ Know and apply the properties of integer exponents to generate equivalent numerical expressions. For example, 32 × 3–5 = 3–3 = 1/33 = 1/27
• I can understand the properties of integer exponents.
Big Ideas 2012: 9.1 Exponents 9.2 Product of Powers Property 9.3 Quotient of Powers Property

8th Grade Math Scope & Sequence 2014
• I can apply the properties of integer exponents to simplify and evaluate numerical expressions.
9.4 Zero & Negative Exponents Big Ideas 2014: 10.1 Exponents 10.2 Product of Powers Property 10.3 Quotient of Powers Property 10.4 Zero & Negative Exponents Big Ideas Performance Task: Astronomy after 9.4 (2012)
8.EE. 2 -‐ Use square root and cube root symbols to represent solutions to equations of the form x2= p and x3= p, where p is a positive rational number. Evaluate square roots of small perfect squares and cube roots of small perfect cubes. Know that √2 is irrational.
• I can evaluate the square roots of small perfect squares and cube roots of small perfect cubes.
• I can represent the solutions to equations using square root and cube root symbols.
• I can understand that all non-‐perfect square roots and cube roots are irrational.
Big Ideas 2012: 6.1 Finding Square Roots 6.3 Approximating Square Roots 6.3b Real Numbers Big Ideas 2014: 7.1 Finding Square Roots 7.2 Finding Cube Roots 7.4 Approximating Square Roots Big Ideas Performance Task: Nested Boxes after 6.3 (2012
8.NS.1 -‐ Know that numbers that are not rational are called irrational. Understand informally that every number has a decimal expansion; for rational numbers show that the decimal expansion repeats eventually, and convert a decimal expansion which repeats eventually into a rational number.
• I can understand that real numbers that are not rational are irrational.
Big Ideas 2012: 6.3: Approximating Square Roots Big Ideas 2014: 7.4 Approximating Square Roots 7.4 Ext. Repeating Decimals Big Ideas Performance Task: Gravity after 6.4 (2012)

8th Grade Math Scope & Sequence 2014
8.NS.2 -‐ Use rational approximations of irrational numbers to compare the size of irrational numbers, locate them approximately on a number line diagram, and estimate the value of expressions (e.g. π2). For example, by truncating the decimal expansion of √2, show that √2 is between 1 and 2, then between 1.4 and 1.5, and explain how to continue on to get better approximations.
• I can compare and order irrational numbers.
Big Ideas 2012: 6.3: Approximating Square Roots 6.3b: Real Numbers Big Ideas 2014: 7.4 Approximating Square Roots Big Ideas Performance Task: Australian Football after 6.4 (2012)
Additional Resources
Science and Technical Subject Literacy Standards Literacy Implementation Ideas
Reading
RL 8.5: Analyze the structure an author uses to organize a text, including how the major sections contribute to the whole and to an understanding of the topic. RI 8.2: Determine a central idea of a text and analyze its development over the course of the text, including its relationship to supporting ideas; provide an objective summary of the text. RI 8.6: Determine an author’s point of view or purpose in a text and analyze how the author acknowledges and responds to conflicting evidence or viewpoints. RI 8.7: Evaluate the advantages and disadvantages of using different mediums (e.g., print or digital text, video, multimedia) to present a particular topic or idea. RI 8.8: Delineate and evaluate the argument and specific claims in a text, assessing whether the reasoning is sound and the evidence is relevant and sufficient; recognize when irrelevant evidence is introduced.

8th Grade Math Scope & Sequence 2014
Writing
W 8.1: Write arguments focused on discipline-‐specific content. a. Introduce claim(s) about a topic or issue, acknowledge and distinguish the claim(s) from alternate or opposing claims, and organize the reasons and evidence logically. b. Support claim(s) with logical reasoning and relevant, accurate data and evidence that demonstrate an understanding of the topic or text, using credible sources. c. Use words, phrases, and clauses to create cohesion and clarify the relationships among claim(s), counterclaims, reasons, and evidence. d. Establish and maintain a formal style. e. Provide a concluding statement or section that follows from and supports the argument presented.

8th Grade Math Scope & Sequence 2014
Eighth Grade Unit 2: Scientific Notation Units 1 Theme: Motivation
Thematic Question
Supporting Questions Key Terms
Practice Standards Task(s)
Cross Curricular Connections
• How can I explain the process I use to solve problems?
• How can you read numbers that are written in scientific notation? • How can you write a number in scientific notation? • How can you add, subtract, and divide numbers in scientific notation?
Words for review (Tier 1): powers of ten, estimate. Tier 3: scientific notation, decimal notation.
• Metallic Lattice (9.6) • Population & Land Areas (9.6)
Prioritized Vocabulary: Perspective Evidence Explain
Utah Core Standards For Mathematics Student Learning Targets Curriculum Resources
8.EE.3 -‐ Use numbers expressed in the form of a single digit times an integer power of 10 to estimate very large or very small quantities, and to express how many times as much one is than the other. For example, estimate the population of the United States as 3 x 10⁸ and the population of the world as 7 x 10⁹, and determine that the world population is more than 20 times larger.
• I can estimate numbers as a product of a single digit and a power of ten.
Big Ideas 2012: 9.5 Reading Scientific Notation 9.6 Writing Scientific Notation 9.6b Scientific Notation Big Ideas 2014: 10.5 Reading Scientific Notation 10.6 Writing Scientific Notation Big Ideas Performance Task: Metallic Lattice after 9.6 (2012)
8.EE.4 -‐ Perform operations with numbers expressed in scientific notation, including problems where both decimal and
• I can compare numbers expressed as a product of a single digit and a
Big Ideas 2012: 9.5 Reading Scientific Notation

8th Grade Math Scope & Sequence 2014
scientific notation are used. Use scientific notation and choose units of appropriate size for measurements of very large or very small quantities (e.g., use millimeters per year for seafloor spreading). Interpret scientific notation that has been generated by technology.
power of ten by a scale factor. • I can interpret numbers expressed
in scientific notation, including numbers generated by technology.
9.6 Writing Scientific Notation 9.6b Scientific Notation Big Ideas 2014: 10.7 Operations in Scientific Notation Big Ideas Performance Task: Population & Land Areas after 9.6 (2012)
Additional Resources
Science and Technical Subject Literacy Standards Literacy Implementation Ideas
Reading
RL 8.5: Analyze the structure an author uses to organize a text, including how the major sections contribute to the whole and to an understanding of the topic. RI 8.2: Determine a central idea of a text and analyze its development over the course of the text, including its relationship to supporting ideas; provide an objective summary of the text. RI 8.6: Determine an author’s point of view or purpose in a text and analyze how the author acknowledges and responds to conflicting evidence or viewpoints. RI 8.7: Evaluate the advantages and disadvantages of using different mediums (e.g., print or digital text, video, multimedia) to present a particular topic or idea. RI 8.8: Delineate and evaluate the argument and specific claims in a text, assessing whether the reasoning is sound and the evidence is relevant and sufficient; recognize when irrelevant evidence is introduced.

8th Grade Math Scope & Sequence 2014
Writing
W 8.1: Write arguments focused on discipline-‐specific content. a. Introduce claim(s) about a topic or issue, acknowledge and distinguish the claim(s) from alternate or opposing claims, and organize the reasons and evidence logically. b. Support claim(s) with logical reasoning and relevant, accurate data and evidence that demonstrate an understanding of the topic or text, using credible sources. c. Use words, phrases, and clauses to create cohesion and clarify the relationships among claim(s), counterclaims, reasons, and evidence. d. Establish and maintain a formal style. e. Provide a concluding statement or section that follows from and supports the argument presented.

8th Grade Math Scope & Sequence 2014
Eighth Grade Unit 3: Equations
Unit 2 Theme: Influence
Thematic Question
Supporting Questions
Key Terms
Practice Standards Task(s) Cross Curricular Connections
• What in life motivates the need to create and solve equations?
• How can you solve a multi-‐step equation? • How can you check the reasonableness of your solution? • How can you solve an equation that has variables on both sides? • How can you determine if an equation in one variable will have no solution, one solution, or infinitely many solutions? • How can you use a formula for one measurement to write a formula for a different measurement?
Words for review (Tier 1): order of operations, Tier 2: solve, variable, solution, like terms, distributive property
• Kennel Fees (1.3)
Prioritized Vocabulary: Evaluate Synthesize Analyze
Utah Core Standards For Mathematics Student Learning Targets Curriculum Resources
8.EE. 2 -‐ Use square root and cube root symbols to represent solutions to equations of the form x2= p and x3= p, where p is a positive rational number. Evaluate square roots of small perfect squares and cube roots of small perfect cubes. Know that √2 is irrational.
• I can evaluate the square roots of small perfect squares and cube roots of small perfect cubes.
• I can represent the solutions to equations using square root and cube root symbols.
Big Ideas 2012: 6.2 The Pythagorean Theorem 6.5 Using the Pythagorean Theorem Big Ideas 2014: 7.3 The Pythagorean Theorem 7.5 Using the Pythagorean Theorem

8th Grade Math Scope & Sequence 2014
• I can understand that all non-‐perfect square roots and cube roots are irrational.
8.EE.7 -‐ Solve linear equations in one variable.
a. Give examples of linear equations in one variable with one solution, infinitely many solutions, or no solutions. Show which of these possibilities is the case by successively transforming the given equation into simpler forms, until an equivalent equation of the form x = a, a = a, or a = b results (where a and b are different numbers.)
b. Solve linear equations with rational number coefficients, including equations whose solutions require expanding expressions using the distributive property and collecting like terms.
• I can solve linear equations in one variable.
Big Ideas 2012: 1.1** Solving Simple Equations 1.2 Solving Multi-‐Step Equations 1.3 Solving Equations with Variables on
both sides 1.3b Solutions of Linear Equations Big Ideas 2014: 1.5 Solving Simple Equations 1.6 Solving Multi-‐Step Equations 1.7 Solving Equations with Variables on
Both Sides 1.8 Rewriting equations and formulas 5.4 Ext, Solving Linear Equations by Graphing Big Ideas Performance Task: Kennel Fees after 1.3 (2012)
Additional Resources
** These sections are not covered explicitly in the 8th grade core. Teachers should use discretion as to whether or not these sections should be taught for background knowledge, review, or extension based upon the needs of their students.
Science and Technical Subject Literacy Standards Literacy Implementation Ideas

8th Grade Math Scope & Sequence 2014
Reading
RL 8.2: Determine the central ideas or conclusions of a text; provide an accurate summary of the text distinct from prior knowledge or opinions. RI 8.5: Analyze in detail the structure of a specific paragraph in a text, including the role of particular sentences in developing and refining a key concept.
Writing
W 8.2: Write informative/explanatory texts, including the narration of historical events, scientific procedures/ experiments, or technical processes. a. Introduce a topic clearly, previewing what is to follow; organize ideas, concepts, and information into broader categories as appropriate to achieving purpose; include formatting (e.g., headings), graphics (e.g., charts, tables), and multimedia when useful to aiding comprehension. b. Develop the topic with relevant, well-‐chosen facts, definitions, concrete details, quotations, or other information and examples. c. Use appropriate and varied transitions to create cohesion and clarify the relationships among ideas and concepts. d. Use precise language and domain-‐specific vocabulary to inform about or explain the topic. e. Establish and maintain a formal style and objective tone. f. Provide a concluding statement or section that follows from and supports the information or explanation presented.

8th Grade Math Scope & Sequence 2014
Eighth Grade
Unit 4: Geometry – Part A (Transformations & Volume) Unit 3 Theme: Adversity
Thematic Question
Supporting Questions
Key Terms
Practice Standards Task(s) Cross Curricular Connections
• How can I use geometry to respond to the challenges of life?
• How can we translate figures using translations, reflections, rotations, and dilations?
• How can we find the volume of cylinders, cones, and spheres?
Words for review (Tier 1): line, angle, radius, height, volume, diameter. Tier 2: coordinate, similar, similarity, pi, π , radius, height, volume, diameter. Tier 3: segment, parallel line, rigid motion, congruent, center of rotation, line of reflection, rotation, reflection, translation, transformation, angle of rotation, dilation, hemisphere.
• New Subdivision (Topic 1) • Alumni Center (Topic 1) • Transformations (Topic 1) • Soccer Complex (Topic 1) • Coffee (Topic 2)
Prioritized Vocabulary: Justify Relevance Opinion
Utah Core Standards For Mathematics Student Learning Targets Curriculum Resources
8.G.1 -‐ Verify experimentally the properties of rotations, reflections, and translations: a. Lines are taken to lines, and line segments to line segments of the same length. b. Angles are taken to angles of the same measure. c. Parallel lines are taken to parallel lines.
• I can verify that congruence of line segments and angles is maintained through rotation, reflection, and translation.
• I can verify that lines remain lines through rotation,
Big Ideas 2012: Topic 1 Transformations Big Ideas 2014: 2.2 Translations 2.3 Reflections 2.4 Rotations

8th Grade Math Scope & Sequence 2014
reflection, and translation. • I can verify that when parallel
lines are rotated, reflected, or translated, each in the same way, they remain parallel lines.
Big Ideas Performance Task: New Subdivision after Topic 1 (2012)
8.G.2 -‐ Understand that a two-‐dimensional figure is congruent to another if the second can be obtained from the first by a sequence of rotations, reflections, and translations; given two congruent figures, describe a sequence that exhibits the congruence between them.
• I can understand that the congruency of two-‐dimensional figures is maintained while undergoing rigid transformations.
• I can describe the transformation of a figure as a rotation, reflection, translation, or a combination of transformations.
Big Ideas 2012: Topic 1 Transformations Big Ideas 2014: 2.1 Congruent Figures 2.2 Translations 2.3 Reflections 2.4 Rotations Big Ideas Performance Task: Alumni Center after Topic 1 (2012)
8.G.3 -‐ Describe the effect of dilations, translations, rotations, and reflections on two-‐dimensional figures using coordinates.
• I can understand how to dilate, translate, rotate, and reflect two-‐dimensional figures on the coordinate plane.
• I can describe the effects of dilations, translations, rotations, and reflections using coordinate notation.
• I can use coordinate notation to describe the transformation given an image and its transformed image.
Big Ideas 2012: Topic 1 Transformations Big Ideas 2014: 2.2 Translations 2.3 Reflections 2.4 Rotations 2.7 Dilations Big Ideas Performance Task: Transformations after Topic 1 (2012)
8.G.4 -‐ Understand that a two-‐dimensional figure is similar to another if the second can be obtained from the first by a sequence
• I can understand that any combination of transformation
Big Ideas 2012: Topic 1 Transformations

8th Grade Math Scope & Sequence 2014
of rotations, reflections, translations, and dilations; given two similar two-‐dimensional figures, describe a sequence that exhibits the similarity between them.
will result in similar figures. • I can describe the sequence of
transformations needed to show how one figure is similar to another.
• I can make dilations of figures by a given scale factor.
Big Ideas 2014: 2.5 Similar Figures 2.6 Perimeters and
Areas of Similar Figures 2.7 Dilations Big Ideas Performance Task: Soccer Complex after Topic 1 (2012)
8.G.9 -‐ Know the formulas for the volumes of cones, cylinders, and spheres and use them to solve real-‐world and mathematical problems.
• I can understand when and how to use formulas for volumes of cones, cylinders, and spheres.
• I can apply volume formulas to real-‐world problems.
Big Ideas 2012: Topic 2 Volume Big Ideas 2014: 8.1: Volumes of Cylinders 8.2: Volumes of Cones 8.3: Volumes of Spheres 8.4: Surface Area and Volumes of Similar Solids Big Ideas Performance Task: Coffee after Topic 2 (2012)
Additional Resources
Science and Technical Subject Literacy Standards Literacy Implementation Ideas
Reading RL 8.1: Cite specific textual evidence to support analysis of science and

8th Grade Math Scope & Sequence 2014
technical texts. RL 8.4: Determine the meaning of symbols, key terms, and other domain-‐specific words and phrases as they are used in a specific scientific or technical context relevant to grades 6–8 texts and topics. RI 8.1: Cite the textual evidence that most strongly supports an analysis of what the text says explicitly as well as inferences drawn from the text.
Writing
W 8.3: students must be able to write precise enough descriptions of the step-‐by-‐step procedures they use in their investigations or technical work that others can replicate them and (possibly) reach the same results W 8.4: Produce clear and coherent writing in which the development, organization, and style are appropriate to task, purpose, and audience. W 8.5: With some guidance and support from peers and adults, develop and strengthen writing as needed by planning, revising, editing, rewriting, or trying a new approach, focusing on how well purpose and audience have been addressed.

8th Grade Math Scope & Sequence 2014
Eighth Grade Unit 4: Geometry – Part B (Angles & Triangles)
Unit 3 Theme: Adversity
Thematic Question
Supporting Questions
Key Terms
Practice Standards Task(s) Cross Curricular Connections
• How can I use geometry to respond to the challenges of life?
• How can you classify triangles by their angles?
• Which properties of triangles make them special among all other types of polygons?
• How can we use properties of parallel lines to solve real-‐life problems?
• How are the lengths of a sides of a right triangle related?
• How can you use the Pythagorean Theorem to solve real-‐life problems?
Words for review (Tier 1): supplementary pairs, line, angle. Tier 2: coordinate. Tier 3: exterior angle of a triangle, remote interior angles of a triangle, adjacent, non-‐adjacent, corresponding angles, alternate interior angles, alternate exterior angles, consecutive interior angles, vertical pairs, transversal, distance formula.
• Intersection (5.5) • Garfield’s Proof (6.2) • Bird Cage (6.5) • Tank Capture (6.5)
Prioritized Vocabulary: Justify Relevance Opinion
Utah Core Standards For Mathematics Student Learning Targets Curriculum Resources
8.G.5 -‐ Use informal arguments to establish facts about the angle sum and exterior angle of triangles, about the angles created when parallel lines are cut by a transversal, and the angle-‐angle criterion for similarity of triangles. For example, arrange three copies of the same triangle so that the sum of the three angles appears to form a
• I can understand that the measure of an exterior angle of a triangle is equal to the sum of the measures of the non-‐adjacent angles.
Big Ideas 2012: 5.1** Classifying Triangles 5.2 Angles & Sides of Triangles 5.4 Using Similar Triangles 5.5 Parallel Lines & Transversals Big Ideas 2014:

8th Grade Math Scope & Sequence 2014
line, and give an argument in terms of transversals why this is so. • I can understand that the sum of the angles of a triangle equals 180°.
• I can determine the relationship between corresponding angles, alternate interior angles, alternate exterior angles, vertical pairs, and supplementary pairs when parallel lines are cut by a transversal.
• I can recognize that if two triangles have two congruent angles, then they are similar triangles (angle-‐angle).
3.1 Parallel Lines and Transversals 3.2 Angles of Triangles 3.4 Using Similar Triangles Big Ideas Performance Task: Intersection after 5.5 (2012)
8.G. 6 -‐ Explain a proof of the Pythagorean Theorem and its converse.
• I can understand that in a right triangle a2 + b2 = c2.
• I can understand and explain a proof of the Pythagorean Theorem.
• I can understand and explain a proof of the converse of the Pythagorean Theorem.
Big Ideas 2012: 6.2: The Pythagorean Theorem 6.5: Using the Pythagorean Theorem Big Ideas 2014: 7.3: The Pythagorean Theorem 7.5: Using the Pythagorean Theorem Big Ideas Performance Task: Garfield’s Proof after 6.2 (2012)
8.G.7 -‐ Apply the Pythagorean Theorem to determine unknown side lengths in right triangles in real-‐world and mathematical problems
• I can use the Pythagorean Theorem to solve for a missing side of a right
Big Ideas 2012: 6.2: The Pythagorean Theorem 6.5: Using the Pythagorean Theorem

8th Grade Math Scope & Sequence 2014
in two and three dimensions. triangle given the other two sides.
• I can use the Pythagorean Theorem to solve problems in real-‐world contexts including three-‐dimensional contexts.
Big Ideas 2014: 7.3: The Pythagorean Theorem 7.5: Using the Pythagorean Theorem Big Ideas Performance Task: Bird Cage after 6.5 (2012)
8.G.8 -‐ Apply the Pythagorean Theorem to find the distance between two points in a coordinate system.
• I can calculate the distance between two points in a coordinate system using the Pythagorean Theorem.
Big Ideas 2012: 6.5 Using the Pythagorean Theorem Big Ideas 2014: 7.5: Using the Pythagorean Theorem Big Ideas Performance Task: Tank Capture after 6.5 (2012)
Additional Resources
** These sections are not covered explicitly in the 8th grade core. Teachers should use discretion as to whether or not these sections should be taught for background knowledge, review, or extension based upon the needs of their students.
Science and Technical Subject Literacy Standards Literacy Implementation Ideas
Reading
RL 8.1: Cite specific textual evidence to support analysis of science and technical texts. RL 8.4: Determine the meaning of symbols, key terms, and other domain-‐specific words and phrases as they are used in a specific scientific or technical context relevant to grades 6–8 texts and topics. RI 8.1: Cite the textual evidence that most strongly supports an analysis of what the text says explicitly as well as inferences drawn from the text.

8th Grade Math Scope & Sequence 2014
Writing
W 8.3: students must be able to write precise enough descriptions of the step-‐by-‐step procedures they use in their investigations or technical work that others can replicate them and (possibly) reach the same results W 8.4: Produce clear and coherent writing in which the development, organization, and style are appropriate to task, purpose, and audience. W 8.5: With some guidance and support from peers and adults, develop and strengthen writing as needed by planning, revising, editing, rewriting, or trying a new approach, focusing on how well purpose and audience have been addressed.
8th Grade Math Scope & Sequence 2014
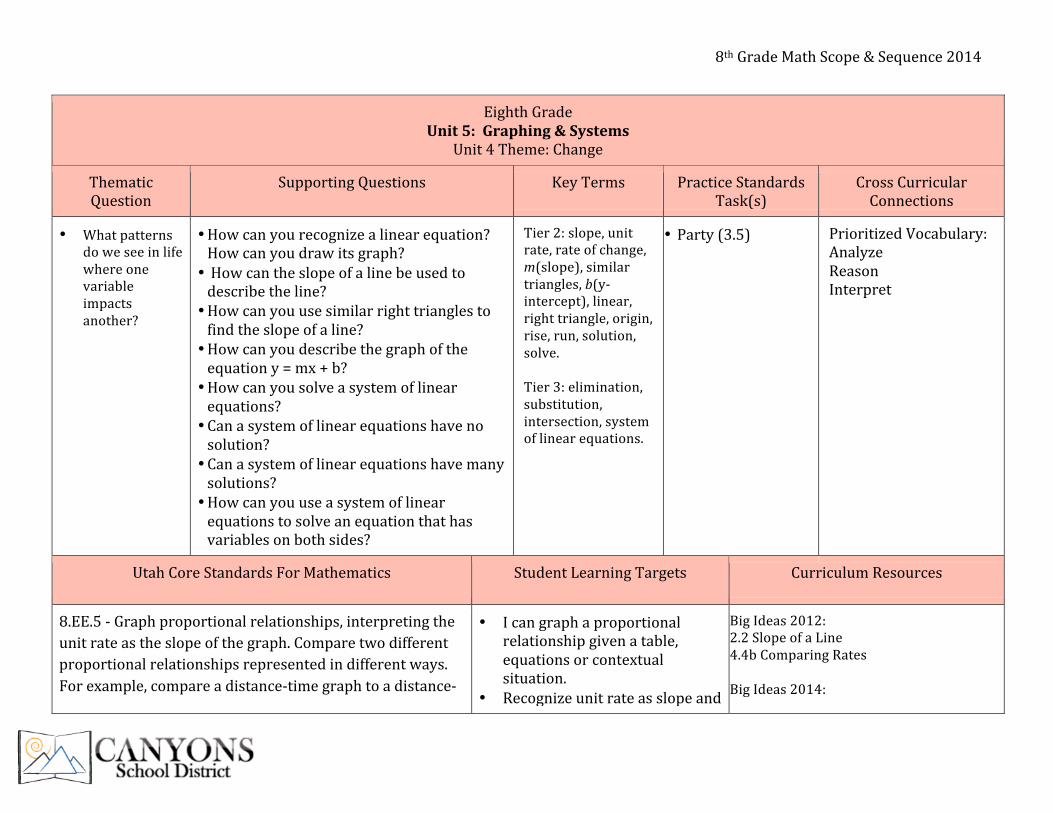
Eighth Grade Unit 5: Graphing & Systems
Unit 4 Theme: Change
Thematic Question
Supporting Questions
Key Terms
Practice Standards Task(s)
Cross Curricular Connections
• What patterns do we see in life where one variable impacts another?
• How can you recognize a linear equation? How can you draw its graph? • How can the slope of a line be used to describe the line? • How can you use similar right triangles to find the slope of a line? • How can you describe the graph of the equation y = mx + b? • How can you solve a system of linear equations? • Can a system of linear equations have no solution? • Can a system of linear equations have many solutions? • How can you use a system of linear equations to solve an equation that has variables on both sides?
Tier 2: slope, unit rate, rate of change, m(slope), similar triangles, b(y-‐intercept), linear, right triangle, origin, rise, run, solution, solve. Tier 3: elimination, substitution, intersection, system of linear equations.
• Party (3.5) Prioritized Vocabulary: Analyze Reason Interpret
Utah Core Standards For Mathematics Student Learning Targets Curriculum Resources
8.EE.5 -‐ Graph proportional relationships, interpreting the unit rate as the slope of the graph. Compare two different proportional relationships represented in different ways. For example, compare a distance-‐time graph to a distance-‐
• I can graph a proportional relationship given a table, equations or contextual situation.
• Recognize unit rate as slope and
Big Ideas 2012: 2.2 Slope of a Line 4.4b Comparing Rates Big Ideas 2014:

8th Grade Math Scope & Sequence 2014
time equation to determine which of two moving objects has greater speed.
interpret the meaning of the slope in context.
• I can recognize the proportional relationships include the point (0,0).
• I can compare different representations of two proportional relationships represented as contextual situations, graphs, or equations.
4.1 Graphing Linear Equations 4.3 Graphing Proportional Relationships Big Ideas Performance Task: Assembly Lines after 4.4 (2012
8.EE.6 -‐ Use similar triangles to explain why the slope m is the same between any two distinct points on a non-‐vertical line in the coordinate plane; derive the equation y = mx for a line through the origin and the equation y = mx + b for a line intercepting the vertical axis at b.
• I can determine the slope of a line as the ratio of the leg lengths of similar right triangles.
• I can explain why the slope is the same between any two distinct points on a line using similar right triangles.
Big Ideas 2012: 2.2b Triangles and Slope 2.3 Graphing Linear Equations in Slope-‐Intercept Form 2.4 Graphing Linear Equations in Standard Form Big Ideas 2014: 4.2 Slope of a Line 4.2 Ext Slopes of Parallel & Perpendicular Lines 4.3 Graphing Proportional Relationships 4.4 Graphing Linear Equations in Slope-‐Intercept Form 4.5 Graphing Linear Equations in Standard Form
8.EE.8 -‐ Analyze and solve pairs of simultaneous linear equations.
a. Understand that solutions to a system of two linear
• I can identify and provide examples of systems of equations that have one solution, infinitely many
Big Ideas 2012: 2.1 Graphing Linear Equations 2.5 Systems of Linear Equations 2.6 Special Systems of Linear Equations

8th Grade Math Scope & Sequence 2014
equations in two variables correspond to points of intersection of their graphs, because points of intersection satisfy both equations simultaneously.
b. Solve systems of two linear equations in two variables algebraically, and estimate solutions by graphing the equations. Solve simple cases by inspection. For example, 3x + 2y = 5 and 3x + 2y = 6 have no solution because 3x + 2y cannot simultaneously be 5 and 6.
c. Solve real-‐world and mathematical problems leading to two linear equations in two variables. For example, given coordinates for two pairs of points, determine whether the line through the first pair of points intersects the line through the second pair.
solutions or no solutions. • I can solve a system of
equations algebraically. • I can estimate solutions by
graphing systems of equations.
2.7 Solving Equations by Graphing Big Ideas 2014: 5.1 Solving Systems by Graphing 5.2 Solving Systems by Substitution 5.3 Solving Systems by Elimination 5.4 Solving Special Systems 5.4 Ext. Solving Linear equations by graphing) Big Ideas Performance Task:
Additional Resources
Big Ideas Math Blue Book: 2.1** 2.2 2.2B 2.3 2.5 2.6 2.7 ** These sections are not covered explicitly in the 8th grade core. Teachers should use discretion as to whether or not these sections should be taught for background knowledge, review, or extension based upon the needs of their students.

8th Grade Math Scope & Sequence 2014
Science and Technical Subject Literacy Standards Literacy Implementation Ideas
Reading
RL 8.3: Follow precisely a multistep procedure when carrying out experiments, taking measurements, or performing technical tasks. RI 8.8: Delineate and evaluate the argument and specific claims in a text, assessing whether the reasoning is sound and the evidence is relevant and sufficient; recognize when irrelevant evidence is introduced. RI 8.9: Analyze a case in which two or more texts provide conflicting information on the same topic and identify where the texts disagree on matters of fact or interpretation.
Writing
W 8.1: Write arguments focused on discipline-‐specific content. a. Introduce claim(s) about a topic or issue, acknowledge and distinguish the claim(s) from alternate or opposing claims, and organize the reasons and evidence logically. b. Support claim(s) with logical reasoning and relevant, accurate data and evidence that demonstrate an understanding of the topic or text, using credible sources. c. Use words, phrases, and clauses to create cohesion and clarify the relationships among claim(s), counterclaims, reasons, and evidence. d. Establish and maintain a formal style. e. Provide a concluding statement or section that follows from and supports the argument presented.

8th Grade Math Scope & Sequence 2014
Eighth Grade Unit 6: Writing Linear Equations & Systems
Units 5 Theme: Innovation
Thematic Question Supporting Questions
Key Terms Practice Standards Task(s) Cross Curricular Connections
• How does everything that we have learned this year relate to functions?
• How can you write an equation of a line when you are given the slope and y-‐intercept of the line?
• How can you write an equation of a line when you are given the slope and a point on the line?
• How can you write an equation of a line when you are given two points on the line?
• How can you use a linear equation in two variables to model and solve a real-‐life problem?
• How can you use a system of linear equations to model and solve a real-‐life problem?
Tier 2: m(slope), b(y-‐intercept), linear, origin, rise, run, solution, system of linear equations
• School Lunch (3.4) • Party (3.5)
Prioritized Vocabulary: Accuracy Reliability Source
Utah Core Standards For Mathematics Student Learning Targets Curriculum Resources
8.EE.6 -‐ Use similar triangles to explain why the slope m is the same between any two distinct points on a non-‐vertical line in the coordinate plane; derive the equation y = mx for a line through the
• I can write an equation in the form y = mx + b from a graph of a line on the
Big Ideas 2012: 3.1 Writing Equations in Slope-‐Intercept Form

8th Grade Math Scope & Sequence 2014
origin and the equation y = mx + b for a line intercepting the vertical axis at b.
coordinate plane. 3.2 Writing Equations Using Slope and a Point 3.4 Solving Real Life Problems Big Ideas 2014: 4.4 Graphing Linear Equations in Slope-‐Intercept Form Big Ideas Performance Task: School Lunch after 3.4 (2012)
8.EE.8 -‐ Analyze and solve pairs of simultaneous linear equations.
c. Solve real-‐world and mathematical problems leading to two linear equations in two variables. For example, given coordinates for two pairs of points, determine whether the line through the first pair of points intersects the line through the second pair.
• I can create and utilize systems of linear equation to model real-‐world situations.
Big Ideas 2012: 3.5 Writing Systems of Linear Equations Big Ideas 2014: 4.6 Writing Equations in Slope-‐Intercept Form 4.7 Writing Equations in Point-‐Slope Form Big Ideas Performance Task: Party after 3.5 (2012)
Additional Resources
Science and Technical Subject Literacy Standards Literacy Implementation Ideas
Reading
RL 8.9: Compare and contrast the information gained from experiments, simulations, video, or multimedia sources with that gained from reading a text on the same topic. RI 8.3: Analyze in detail how a key individual, event, or idea is introduced, illustrated, and elaborated in a text (e.g., through examples or anecdotes). RI 8.9: Compare and contrast one author’s presentation of events with that of

8th Grade Math Scope & Sequence 2014
another (e.g., a memoir written by and a biography on the same person).
Writing
W 8.2: Write informative/explanatory texts, including the narration of historical events, scientific procedures/ experiments, or technical processes. a. Introduce a topic clearly, previewing what is to follow; organize ideas, concepts, and information into broader categories as appropriate to achieving purpose; include formatting (e.g., headings), graphics (e.g., charts, tables), and multimedia when useful to aiding comprehension. b. Develop the topic with relevant, well-‐chosen facts, definitions, concrete details, quotations, or other information and examples. c. Use appropriate and varied transitions to create cohesion and clarify the relationships among ideas and concepts. d. Use precise language and domain-‐specific vocabulary to inform about or explain the topic. e. Establish and maintain a formal style and objective tone. f. Provide a concluding statement or section that follows from and supports the information or explanation presented. W 8.6: Use technology, including the Internet, to produce and publish writing and present the relationships between information and ideas clearly and efficiently. W 8.7: Conduct short research projects to answer a question (including a self-‐generated question), drawing on several sources and generating additional related, focused questions that allow for multiple avenues of exploration. W 8.8: Gather relevant information from multiple print and digital sources, using search terms effectively; assess the credibility and accuracy of each source; and quote or paraphrase the data and conclusions of others while avoiding plagiarism and following a standard format for citation. W 8.9: Draw evidence from informational texts to support analysis reflection, and research.

8th Grade Math Scope & Sequence 2014
Eighth Grade Unit 7: Functions
Unit 5 Theme: Innovation
Thematic Question
Supporting Questions
Key Terms Practice Standards Task(s) Cross Curricular Connections
• How does everything that we have learned this year relate to functions?
• How can you find the domain and range of a function?
• How can you use a linear function to describe a linear pattern?
• How can you recognize when a pattern in real life is linear or nonlinear?
• How can you compare proportional relationships and functions?
Tier 2: function, input, output, dependent, independent, slope, intercept, rate of change, nonlinear, unit rate, m(slope). Tier 3: collinear.
• Touchdowns (4.1) • Remote Helicopter (4.3) • Assembly Lines (4.4) • Cross Country (4.4) • Egg-‐Dropping Experiment (4.4)
Prioritized Vocabulary: Accuracy Reliability Source
Utah Core Standards For Mathematics Student Learning Targets Curriculum Resources
8.F.1 -‐ Understand that a function is a rule that assigns to each input exactly one output. The graph of a function is the set of ordered pairs consisting of an input and the corresponding output.
• I can understand that functions describe relationships where one variable determines a unique value of the other.
• I can recognize a graph of a function as the set of ordered pairs consisting of an input and corresponding
Big Ideas 2012: 4.1 Domain and Range of a Function 4.2 Discrete and Continuous Domains 4.3 Linear Function Patterns 4.4 Comparing Linear and Nonlinear functions Big Ideas 2014: 6.1 Relations and Functions 6.2 Representations of Functions Big Ideas Performance Task:

8th Grade Math Scope & Sequence 2014
output. Touchdowns after 4.1 (2012)
8.F.2 -‐ Compare properties of two functions each represented in a different way (algebraically, graphically, numerically in tables, or by verbal descriptions). For example, given a linear function represented by a table of values and a linear function represented by an algebraic expression, determine which function has the greater rate of change.
• I can compare two linear functions each represented a different way and describe similarities and differences in slopes, y-‐intercepts, and values.
Big Ideas 2012: 4.1 Domain and Range of a Function 4.2 Discrete and Continuous Domains 4.3 Linear Function Patterns 4.4 Comparing Linear and Nonlinear functions 4.4b Comparing rates Big Ideas 2014: 6.3 Linear Functions Big Ideas Performance Task: Cross Country after 4.4 (2012)
8.F.3 -‐ Interpret the equation y = mx + b as defining a linear function, whose graph is a straight line; give examples of functions that are not linear. For example, the function A = s2 giving the area of a square as a function of its side length is not linear because its graph contains the points (1,1), (2,4) and (3,9), which are not on a straight line.
• I can distinguish between linear and non-‐linear functions given their algebraic expression, a table or a graph.
• I can recognize functions written in the form y = mx + b are linear and that every linear function can be written in the form y = mx + b.
Big Ideas 2012: 4.3 Linear Function Patterns 4.4 Comparing Linear and Nonlinear Functions Big Ideas 2014: 6.3 Linear Functions 6.4 Comparing Linear and Nonlinear Functions Big Ideas Performance Task: Space Shuttle after 4.3 (2012)

8th Grade Math Scope & Sequence 2014
8.F.4 -‐ Construct a function to model a linear relationship between two quantities. Determine the rate of change and initial value of the function from a description of a relationship or from two (x, y) values, including reading these from a table or from a graph. Interpret the rate of change and initial value of a linear function in terms of the situation it models, and in terms of its graph or a table of values.
• I can determine and interpret the initial value and rate of change given two points, a graph, a table of values, or a geometric relationship of a linear relationship.
• I can write an equation of a line given two points, a graph, a table of values, or a geometric representation of a linear relationship.
Big Ideas 2012: 4.3 Linear Function Patterns Big Ideas 2014: 4.6 Writing Equations in Slope-‐Intercept Form 4.7 Writing Equations in Point-‐Slope Form 6.3 Linear Functions Big Ideas Performance Task: Remote Helicopter after 4.3 (2012)
8.F.5 -‐ Describe qualitatively the functional relationship between two quantities by analyzing a graph (e.g., where the function is increasing or decreasing, linear or nonlinear). Sketch a graph that exhibits the qualitative features of a function that has been described verbally.
• I can describe attributes of a function by analyzing a graph.
• I can create a graphical representation given the description between two quantities.
Big Ideas 2012: 4.4 Comparing Linear and Nonlinear Functions Big Ideas 2014: 6.5 Analyzing and Sketching Graphs Big Ideas Performance Task: Egg-‐Dropping Experiment after 4.4 (2012)
Additional Resources
Science and Technical Subject Literacy Standards Literacy Implementation Ideas
Reading RL 8.9: Compare and contrast the information gained from experiments, simulations, video, or multimedia sources with that gained from reading a text on the same topic.

8th Grade Math Scope & Sequence 2014
RI 8.3: Analyze in detail how a key individual, event, or idea is introduced, illustrated, and elaborated in a text (e.g., through examples or anecdotes). RI 8.9: Compare and contrast one author’s presentation of events with that of another (e.g., a memoir written by and a biography on the same person).
Writing
W 8.2: Write informative/explanatory texts, including the narration of historical events, scientific procedures/ experiments, or technical processes. a. Introduce a topic clearly, previewing what is to follow; organize ideas, concepts, and information into broader categories as appropriate to achieving purpose; include formatting (e.g., headings), graphics (e.g., charts, tables), and multimedia when useful to aiding comprehension. b. Develop the topic with relevant, well-‐chosen facts, definitions, concrete details, quotations, or other information and examples. c. Use appropriate and varied transitions to create cohesion and clarify the relationships among ideas and concepts. d. Use precise language and domain-‐specific vocabulary to inform about or explain the topic. e. Establish and maintain a formal style and objective tone. f. Provide a concluding statement or section that follows from and supports the information or explanation presented. W 8.6: Use technology, including the Internet, to produce and publish writing and present the relationships between information and ideas clearly and efficiently. W 8.7: Conduct short research projects to answer a question (including a self-‐generated question), drawing on several sources and generating additional related, focused questions that allow for multiple avenues of exploration. W 8.8: Gather relevant information from multiple print and digital sources, using search terms effectively; assess the credibility and accuracy of each source; and quote or paraphrase the data and conclusions of others while avoiding plagiarism and following a standard format for citation. W 8.9: Draw evidence from informational texts to support analysis reflection, and research.

8th Grade Math Scope & Sequence 2014
Eighth Grade Unit 8: Statistics
Unit 6 Theme: Progress
Thematic Question Supporting Questions
Key Terms Practice Standards Task(s) Cross Curricular Connections
• How are important issues identified and explored through statistics?
• How can you use data to predict an event? • How can you create a two-‐way table and analyze the data?
Tier 2: linear, non-‐linear, rate of change, slope, intercept, frequency. Tier 3: bivariate data, scatter plot, outlier, clustering, positive association, negative association, linear association, trend line, relative frequency, categorical data, two-‐way table, associations.
• Children’s Vocabulary (7.3) • Class Attendance (7.3) • Fossils (7.3) • Vision (7.3)
Prioritized Vocabulary: Correlation Infer Production
Utah Core Standards For Mathematics Student Learning Targets Curriculum Resources
8.SP.1 -‐ Construct and interpret scatter plots for bivariate measurement data to investigate patterns of association between two quantities. Describe patterns such as clustering, outliers, positive or negative association, linear association,
• I can collect, record, and construct a set of bivariate data using a scatter plot.
• I can determine whether the relationship between bivariate data
Big Ideas 2012: 7.3 Scatter Plots and Lines of Best Fit Big Ideas 2014: 9.1 Scatter Plots 9.2 Lines of Fit

8th Grade Math Scope & Sequence 2014
and nonlinear association. is approximately linear or nonlinear by examination of a scatter plot.
• I can interpret patterns on a scatter plot such as clustering, outliers, and positive, negative or no association.
9.4 Choosing a Data Display Big Ideas Performance Task: Children’s Vocabulary after 7.3 (2012)
8.SP.2 -‐ Know that straight lines are widely used to model relationships between two quantitative variables. For scatter plots that suggest a linear association, informally fit a straight line, and informally assess the model fit by judging the closeness of the data points to the line.
• I can recognize that straight lines can be used on scatter plots to model the relationship between two quantitative variables.
• I can place a straight line on a scatter plot that closely fits the data points.
• I can judge how well the trend line fits the data by looking at the closeness of the data points.
Big Ideas 2012: 7.3 Scatter Plots and Lines of Best Fit *missing informally assess the model fit. Big Ideas 2014: 9.2 Lines of Fit Big Ideas Performance Task: Class Attendance after 7.3 (2012)
8.SP.3 -‐ Use the equation of a linear model to solve problems in the context of bivariate measurement data, interpreting the slope and intercept. For example, in a linear model for a biology experiment, interpret a slope of 1.5 cm/hr as meaning that an additional hour of sunlight each day is associated with an additional 1.5 cm in mature plant height.
• I can use the equation of a linear model to solve problems.
• I can interpret the meaning of the slope as a rate of change and the meaning of the y-‐intercept in context given bivariate data.
Big Ideas 2012: 7.3 Scatter Plots and Lines of Best Fit *missing informally assess the model fit. Big Ideas 2014: 9.2 Lines of Fit Big Ideas Performance Task: Fossils after 7.3 (2012)
8.SP.4 -‐ Understand that patterns of association can also be seen in bivariate categorical data by displaying frequencies and relative frequencies in a two-‐way table. Construct and
• I can construct a two-‐way frequency table of categorical data.
• I can interpret and describe
Big Ideas 2012: 7.3b Two-‐Way Tables Big Ideas 2014:

8th Grade Math Scope & Sequence 2014
interpret a two-‐way table summarizing data on two categorical variables collected from the same subjects. Use relative frequencies calculated for rows or columns to describe possible association between the two variables. For example, collect data from students in your class on whether or not they have a curfew on school nights and whether or not they have assigned chores at home. Is there evidence that those who have a curfew also tend to have chores?
relative frequencies for possibly associations from a two-‐way table.
9.3 Two Way Table Big Ideas Performance Task: Vision after 7.3 (2012)
Additional Resources
Literacy Standards Literacy Implementation Ideas
Reading
RL 8.3: Follow precisely a multistep procedure when carrying out experiments, taking measurements, or performing technical tasks. RL 8.6: Analyze the author’s purpose in providing an explanation, describing a procedure, or discussing an experiment in a text. RL 8.7: Integrate quantitative or technical information expressed in words in a text with a version of that information expressed visually (e.g., in a flowchart, diagram, model, graph, or table). RI 8.4: Determine the meaning of words and phrases as they are used in a text, including figurative, connotative, and technical meanings; analyze the impact of specific word choices on meaning and tone, including analogies or allusions to other texts.
Writing W 8.3: students must be able to write precise enough descriptions of the step-‐by-‐step procedures they use in their investigations or technical work that others can replicate them and (possibly) reach the same results.