Embed Size (px)
Citation preview
2020 Notice of Annual Meeting of Stockholders
Proxy Statement & Annual Report on Form 10-K

Notice of 2020 Annual Meeting of Stockholders
The 2020 annual meeting of stockholders of Valero Energy Corporation is scheduled to be held as follows:
MEETING DATE & TIME: MEETING PLACE: RECORD DATE:
Thursday, April 30, 202010 a.m., Central Time
Valero Energy CorporationOne Valero Way
San Antonio, Texas 78249
March 4, 2020
The purpose of the annual meeting is to consider and vote on the following:
Voting MattersBoard
Recommendation
ProxyStatementDisclosure
1. Elect directors; FOReach director nominee
p. 13
2. Ratify KPMG LLP as independent auditor; FOR p. 69
3. Advisory vote to approve 2019 executive compensation; FOR p. 72
4. Approve the 2020 Omnibus Stock Incentive Plan; and FOR p. 73
5. Other matters, if any, properly brought before the meeting.
Valero Energy CorporationOne Valero WaySan Antonio, Texas 78249March 19, 2020
By order of the Board of Directors,
J. Stephen GilbertSecretary


Table of Contents
Annual Meeting of Stockholders 1
Information Regarding the Board of Directors 3
Independent Directors 3
Committees of the Board 4
Selection of Director Nominees 6
Director Continuing Education 7
Board Evaluation Process 7
Leadership Structure of the Board 7
Lead Director and Meetings of Non-ManagementDirectors 8
CEO Succession Planning 8
Risk Oversight 8
Stockholder Engagement 10
Climate Change Disclosure 11
Corporate Responsibility 12
Proposal No. 1—Election of Directors 13
Information Concerning Nominees and Directors 13
Summary of Board Skills and Attributes 14
Nominees 15
Identification of Executive Officers 21
Beneficial Ownership of Valero Securities 22
Risk Assessment of Compensation Programs 24
Compensation Committee Report 25
Compensation Discussion and Analysis 25
Company Overview 25
Company Performance 26
Alignment of Executive Pay to Company Performance 29
Elements of Executive Compensation—Summary 30
Pay for Performance Alignment Relative to Peers 32
Adoption of Compensation Governance Best Practices 33
Dialogue With Stockholders 34
Administration of Executive Compensation Programs 35
Benchmarking Data 35
Process and Timing of Compensation Decisions 36
Elements of Executive Compensation 37
Benchmarking Competitive Pay Levels 38
Relative Size of Major Compensation Elements 38
Individual Performance and Personal Objectives 39
Base Salaries 39
Annual Incentive Bonus 40
Long-Term Incentive Awards 43
Perquisites and Other Benefits 45
Post-Employment Benefits 45
Accounting and Tax Treatment 46
Compensation-Related Policies 46
Compensation Consultant Disclosures 48
Equity Compensation Plan Information 49
Executive Compensation 50
Summary Compensation Table 50
Grants of Plan-Based Awards 53
Outstanding Equity Awards 56
Option Exercises and Stock Vested 58
Post-Employment Compensation 59
Pension Benefits 59
Nonqualified Deferred Compensation 61
Potential Payments Upon Termination or Change ofControl 62
Director Compensation 65
Pay Ratio Disclosure 67
Certain Relationships and Related Transactions 68
Proposal No. 2—Ratify Appointment of IndependentAuditors 69
KPMG LLP Fees 70
Report of the Audit Committee 71
Proposal No. 3—Advisory Vote to ApproveCompensation of Named Executive Officers 72
Proposal No. 4—Approve the 2020 Omnibus StockIncentive Plan 73
Miscellaneous 78
Governance Documents and Codes of Ethics 78
Stockholder Communications, Nominations, andProposals 78
Financial Statements 79
Householding 79
Transfer Agent 79
Appendix A - 2020 Omnibus Stock Incentive Plan A-1


2020 ANNUAL MEETING OF STOCKHOLDERS
Our Board is soliciting proxies to be voted at the Annual Meeting of Stockholders on April 30, 2020 (the “Annual Meeting”). Theaccompanying notice describes the time, place, and purposes of the Annual Meeting. Action may be taken at the Annual Meeting or onany date to which the meeting may be adjourned. Unless otherwise indicated the terms “Valero,” “we,” “our,” and “us” in this proxystatement refer to Valero Energy Corporation, to one or more of our consolidated subsidiaries, or to all of them taken as a whole.“Board” means our board of directors.
We are mailing our Notice of Internet Availability of Proxy Materials (“Notice”) to stockholders on or about March 19, 2020. On this date,you will be able to access our proxy materials on the website referenced in the Notice.
RECORD DATE, SHARES OUTSTANDING, QUORUM
Holders of record of our common stock, $0.01 par value (“Common Stock”), at the close of business on March 4, 2020 (the “recorddate”) are entitled to vote on the matters presented at the Annual Meeting. On the record date, 408,545,828 shares of Common Stockwere issued and outstanding and entitled to one vote per share. Stockholders representing a majority of voting power, present inperson or represented by properly executed proxy, will constitute a quorum.
VOTING IN PERSON, REVOCABILITY OF PROXIES
If you attend the Annual Meeting and want to vote in person, we will give you a ballot at the meeting.
If your shares are registered in your name, you are considered the stockholder “of record” and you have the right to vote the shares atthe meeting.
If, however, your shares are held in the name of your broker or other nominee, you are considered the beneficial owner of shares heldin “street name.” As a beneficial owner, if you wish to vote at the meeting, you will need to bring to the meeting a legal proxy from thestockholder of record (e.g., your broker) authorizing you to vote the shares.
You may revoke your proxy at any time before it is voted at the Annual Meeting by (i) submitting a written revocation to Valero,(ii) returning a subsequently dated proxy to Valero, or (iii) attending the Annual Meeting, request that your proxy be revoked, and vote inperson at the Annual Meeting. If instructions to the contrary are not provided, shares will be voted as indicated on the proxy card.
REQUIRED VOTES
For Proposal 1, as required by Valero’s bylaws, each director is to be elected by a majority of votes cast with respect to that director’selection.
Proposals 2, 3 and 4 require approval by the affirmative vote of a majority of the voting power of the shares present in person or byproxy at the Annual Meeting and entitled to vote.
EFFECT OF ABSTENTIONS
Shares voted to abstain are treated as “present” for purposes of determining a quorum. In the election of directors (Proposal 1),pursuant to our bylaws, shares voted to abstain are not deemed “votes cast,” and are accordingly disregarded. When approval for aproposal requires (i) the affirmative vote of a majority of the voting power of the shares present in person or by proxy and entitled tovote (Proposals 2, 3 and 4), or (ii) the affirmative vote of a majority of the voting power of the issued and outstanding Common Stock,then shares voted to “abstain” have the effect of a negative vote (a vote “against”).
2020 PROXY STATEMENT 1

2020 ANNUAL MEETING OF STOCKHOLDERS
BROKER NON-VOTES
Brokers holding shares must vote according to the specific instructions they receive from the beneficial owners of the stock. If yourbroker does not receive specific voting instructions from you, in some cases the broker may vote the shares in the broker’s discretion.
The New York Stock Exchange (the “NYSE”) precludes brokers from voting on certain proposals without specific instructions from thebeneficial owner. This results in a “broker non-vote” on the proposal. A broker non-vote (i) is treated as “present” for purposes ofdetermining a quorum, (ii) has the effect of a negative vote when a majority of the voting power of the issued and outstanding shares isrequired for approval of a particular proposal, and (iii) has no effect when a majority of the voting power of the shares present in personor by proxy and entitled to vote or a plurality or majority of the votes cast is required for approval.
Proposal 2 is deemed to be a routine matter under NYSE rules. A broker or other nominee generally may vote uninstructed shares onroutine matters, and therefore no broker non-votes are expected to occur for Proposal 2. Proposals 1, 3 and 4 are considered non-routine under applicable rules. Because a broker or other nominee cannot vote without instructions on non-routine matters, we expectan undetermined number of broker non-votes to occur on these proposals.
SOLICITATION OF PROXIES
Valero pays the cost for soliciting proxies and the Annual Meeting. In addition to solicitation by mail, proxies may be solicited bypersonal interview, telephone, and similar means by directors, officers, or employees of Valero, none of whom will be speciallycompensated for such activities. Valero also intends to request that brokers, banks, and other nominees solicit proxies from theirprincipals and will pay such brokers, banks, and other nominees certain expenses incurred by them for such activities. Valero retainedGeorgeson LLC, a proxy soliciting firm, to assist in the solicitation of proxies for a fee of $17,500, plus reimbursement of certain out-of-pocket expenses.
For participants in our qualified 401(k) plan (“Thrift Plan”), the proxy card will represent (in addition to any shares held individually ofrecord by the participant) the number of shares allocated to the participant’s account in the Thrift Plan. For shares held by the ThriftPlan, the proxy card will constitute an instruction to the trustee of the plan on how to vote those shares. Shares for which instructionsare not received may be voted by the trustee per the terms of the plan.
2

INFORMATION REGARDING THE BOARD OF DIRECTORS
Valero’s business is managed under the oversight of our Board. Our Board conducts its business through meetings of its membersand its committees. During 2019, our Board held six meetings and the standing Board committees held 15 meetings.
None of our Board members attended less than 75 percent of the meetings of the Board and committees of which he or she was amember. All Board members are expected to attend the Annual Meeting, and all of our Board members attended the 2019 annualmeeting.
Independent Directors
Independent Directors. Our Corporate Governance Guidelines require a majority of the Board to be independent. The Boardpresently has 10 non-management directors and one member from management, Joseph W. Gorder (our Chief Executive Officer). As amember of management, Mr. Gorder is not an independent director under NYSE listing standards. The Board determined that all of ournon-management directors who served on the Board at any time in 2019 and who currently serve on the Board meet the Board’sindependence requirements. Those independent directors are:
H. Paulett Eberhart Donald L. Nickles Stephen M. WatersKimberly S. Greene Philip J. Pfeiffer Randall J. WeisenburgerDeborah P. Majoras Robert A. Profusek Rayford Wilkins, Jr.Eric D. Mullins
Independent Committees. The Board’s Audit Committee, Compensation Committee, and Nominating/Governance and Public PolicyCommittee are composed entirely of directors who meet the independence requirements of the NYSE. Each member of the AuditCommittee also meets the additional independence standards for Audit Committee members required by the SEC.
Independence Standards and Determination. The Board determines independence on the basis of the standards specified by theNYSE, the standards listed in our Corporate Governance Guidelines, and other facts and circumstances the Board may considerrelevant. In general, our Corporate Governance Guidelines require that an independent director must have no material relationship withValero. A relationship is not material under the guidelines if it:
• is not a relationship that would preclude a determination of independence under Section 303A.02(b) of the NYSE ListedCompany Manual;
• consists of charitable contributions by Valero to an organization in which a director is an executive officer that do not exceedthe greater of $1 million or two percent of the organization’s gross revenue in any of the last three years;
• consists of charitable contributions to any organization with which a director, or any member of a director’s immediate family,is affiliated as an officer, director, or trustee pursuant to a matching gift program of Valero and made on terms applicable toemployees and directors, or is in amounts that do not exceed $1 million per year; and
• is not a relationship required to be disclosed by Valero under Item 404 of Regulation S-K (regarding related persontransactions).
Under the NYSE’s listing standards, a director is not deemed independent unless the Board affirmatively determines that the directorhas no material relationship with Valero. The Board has reviewed pertinent information concerning the background, employment, andaffiliations (including commercial, banking, consulting, legal, accounting, charitable, and familial relationships) of our directors, and theBoard has determined that each of our non-management directors and each member of the Audit, Compensation, and Nominating/Governance and Public Policy Committees has no material relationship with Valero, and is therefore independent.
2020 PROXY STATEMENT 3
INFORMATION REGARDING THE BOARD OF DIRECTORS
Committees of the Board
Our Board has three standing committees: The committees’ charters areavailable on our website at:
www.valero.com � Investors �
Corporate Governance � Governance Documents � Charters.
1 Audit Committee,2 Compensation Committee, and3 Nominating/Governance and Public Policy Committee.
AUDIT COMMITTEE
The Audit Committee assists the Board in oversight of the integrity of Valero’s financial statements and public financial information,Valero’s compliance with legal and regulatory requirements, the qualifications and independence of Valero’s independent auditor, andthe performance of Valero’s internal audit function and independent auditors.
The Audit Committee is directly responsible for the appointment, compensation determination, retention, and oversight of theindependent auditors retained to audit Valero’s financial statements. The committee is responsible for the audit fee negotiations and feeapproval associated with Valero’s retention of the independent auditing firm.
The committee annually reviews and evaluates the qualifications, performance, and independence of Valero’s independent auditingfirm, and reviews and evaluates the lead partner of the independent auditor team. In conjunction with the mandated rotation of theaudit firm’s lead engagement partner, the committee is involved in the selection of the audit firm’s new lead engagement partner.
The committee has oversight responsibility regarding management’s annual assessment of, and report on, Valero’s internal controlover financial reporting.
The committee also oversees Valero’s initiatives and strategies respecting cybersecurity and information technology risks.
The Audit Committee met five times in 2019. We make additional disclosures about the Audit Committee in this proxy statement underthe caption “Risk Oversight” and in connection with “Proposal No. 2—Ratify Appointment of KPMG LLP as Independent Auditors.”
Members of the Audit Committee are:• Randall J. Weisenburger (Chair),• H. Paulett Eberhart, and• Stephen M. Waters.
Notes:Audit Committee Financial Experts. The Board hasdetermined that each of the following directors is an “auditcommittee financial expert” (as defined by the SEC) and thateach is “independent” under applicable regulations/standards:(1) Mr. Weisenburger, (2) Ms. Eberhart, and (3) Mr. Waters. Formore information regarding their experience, see “ProposalNo. 1—Election of Directors—Nominees.”
COMPENSATION COMMITTEE
The Compensation Committee reviews and reports to the Board on matters related to compensation programs, policies, andstrategies. The committee has direct responsibility to approve corporate goals and objectives relevant to CEO compensation, evaluatethe CEO’s performance in light of those goals and objectives, and together with the other independent directors, determine andapprove the CEO’s overall compensation. The committee also reviews and approves the corporate goals and objectives relevant to thecompensation of other senior executives of Valero.
The committee conducts periodic reviews of director compensation and makes recommendations to the full Board regarding theindependent directors’ compensation.
The committee reviews Valero’s employee compensation policies and programs, adopts and reviews Valero’s equity compensationplans, oversees the administration of Valero’s compensation plans, and approves amendments to and interpretations of Valero’scompensation plans.
As disclosed further below under the caption “CEO Succession Planning,” the committee reviews and makes regular reports to theBoard regarding management succession planning for the CEO and other senior executives. The committee also exercises oversightover Valero’s initiatives and strategies in the areas of diversity, inclusion, and human capital.
4
INFORMATION REGARDING THE BOARD OF DIRECTORS
The Compensation Committee’s duties are further described in “Compensation Discussion and Analysis” below and in the committee’scharter.
The Compensation Committee met seven times in 2019. The Compensation Committee has, for administrative convenience, delegatedauthority to our Chief Executive Officer to make non-material amendments to Valero’s benefit plans and to make limited grants ofequity awards to new hires who are not executive officers.
Members of the Compensation Committee are:• Rayford Wilkins, Jr. (Chair),• Philip J. Pfeiffer, and• Robert A. Profusek.
Notes:The Compensation Committee Report for fiscal year 2019appears in this proxy statement immediately preceding“Compensation Discussion and Analysis.”
Compensation Committee Interlocks and Insider Participation: There are no compensation committee interlocks. None of themembers of the Compensation Committee has served as an officer or employee of Valero or had any relationship requiring disclosureby Valero under Item 404 of the SEC’s Regulation S-K, which addresses related-person transactions.
NOMINATING/GOVERNANCE AND PUBLIC POLICY COMMITTEE
The Nominating/Governance and Public Policy Committee assists the Board in its oversight responsibilities with respect to corporategovernance, Board membership, climate and environmental matters, public policy trends, and corporate responsibility and reputation.The committee met three times in 2019. The committee’s specific purposes are to:
• identify individuals qualified to become Board members, consistent with criteria approved by the Board;• recommend to the Board director nominees to stand for election at the annual meetings of stockholders;• develop and recommend a set of corporate governance principles applicable to Valero;• assist the Board in identifying, evaluating, and monitoring public policy trends and social and political issues that could impact
Valero’s business activities and performance;• assist the Board in oversight of Valero’s health, safety, and environmental matters as well as climate-related risks and
opportunities;• consider and make recommendations for our strategies relating to corporate responsibility, political contributions, and
reputation management; and• oversee and lead the Board’s and the committees’ annual self-evaluation of performance.
Following the committee’s assessment of the pertinent qualifications, skills, independence, and experience of Eric D. Mullins as apotential director, the committee recommended to the full Board the election of Mr. Mullins as a director, and he was elected to theBoard on Jan. 23, 2020.
Members of the committee are:• Deborah P. Majoras (Chair),• Kimberly S. Greene• Eric D. Mullins *• Donald L. Nickles.
* Mr. Mullins joined the committee in 2020.
Notes:The committee recommended to the Board the directors listedin this proxy statement in Proposal No. 1 as nominees forelection as directors at the Annual Meeting.
The committee also considered and recommended theappointment of a Lead Director to preside at meetings of theindependent directors without management, and recommendedassignments for the Board’s committees. The full Boardapproved the recommendations of the committee and adoptedresolutions approving the slate of director nominees to stand forelection at the Annual Meeting, the appointment of a LeadDirector, and Board committee assignments.
2020 PROXY STATEMENT 5

INFORMATION REGARDING THE BOARD OF DIRECTORS
Selection of Director Nominees
The Nominating/Governance and Public Policy Committee solicits recommendations for Board candidates from a number of sources,including our directors, our officers, and third-party research. In addition, the Committee will consider candidates submitted bystockholders when submitted in accordance with the procedures described in this proxy statement under the caption “Miscellaneous—Stockholder Communications, Nominations, and Proposals.”
The Committee will consider all candidates identified through the processes described above and will evaluate each of them on thesame basis. The level of consideration the Committee will extend to a stockholder’s candidate will be commensurate with the qualityand quantity of information about the candidate that the nominating stockholder makes available to the Committee.
Proxy Access. Our amended and restated bylaws permit a stockholder, or a group of up to 20 stockholders, that has owned at leastthree percent of our outstanding Common Stock for at least three years to nominate and include in our proxy statement candidates forour Board, subject to certain requirements. Each stockholder, or group of stockholders, may nominate candidates for director, up to alimit of the greater of two or 20 percent of the number of directors on the Board. Any nominee must meet the qualification standardslisted in our bylaws. The procedures for nominating a candidate pursuant to our proxy access provisions are described in this proxystatement under the caption “Miscellaneous—Stockholder Communications, Nominations, and Proposals.”
EVALUATION OF DIRECTOR CANDIDATES
Our Corporate Governance Guidelines vest the Nominating/Governance and Public Policy Committee with responsibility for reviewingthe composition of the Board as well as the qualifications of the individual members of the Board and its various committees. Thisreview includes consideration of the directors’ independence, character, judgment, integrity, diversity, age, skills (including financialliteracy) and experience in the context of the overall needs of the Board. The Committee’s assessments include consideration of:
• applicable independence standards;• skills and experience necessary for service on the Board’s committees; and• skills and expertise to serve the needs of the Board as a whole.
Each candidate must meet certain minimum qualifications, including:
• strong ethical principles and integrity;• independence of thought and judgment;• the ability to dedicate sufficient time, energy, and attention to the performance of duties, taking into consideration the
candidate’s service on other public company boards; and• skills and expertise complementary to those of the existing Board members; in this regard, the Board will consider its need for
operational, managerial, financial, governmental affairs, energy, sustainability, technology, human resources, or otherexpertise.
The Committee also considers:
• diversity concepts such as race, gender, national origin, age, and geography;• the ability of a prospective candidate to work with the interpersonal dynamics of the Board and contribute to the Board’s
collaborative culture.
Based on this initial evaluation, the Committee will determine whether to interview a proposed candidate and, if warranted, willrecommend that one or more of its members, other members of the Board, and/or senior officers, as appropriate, interview thecandidate. Following this process, the Committee ultimately determines its list of nominees and recommends the list to the full Boardfor consideration and approval.
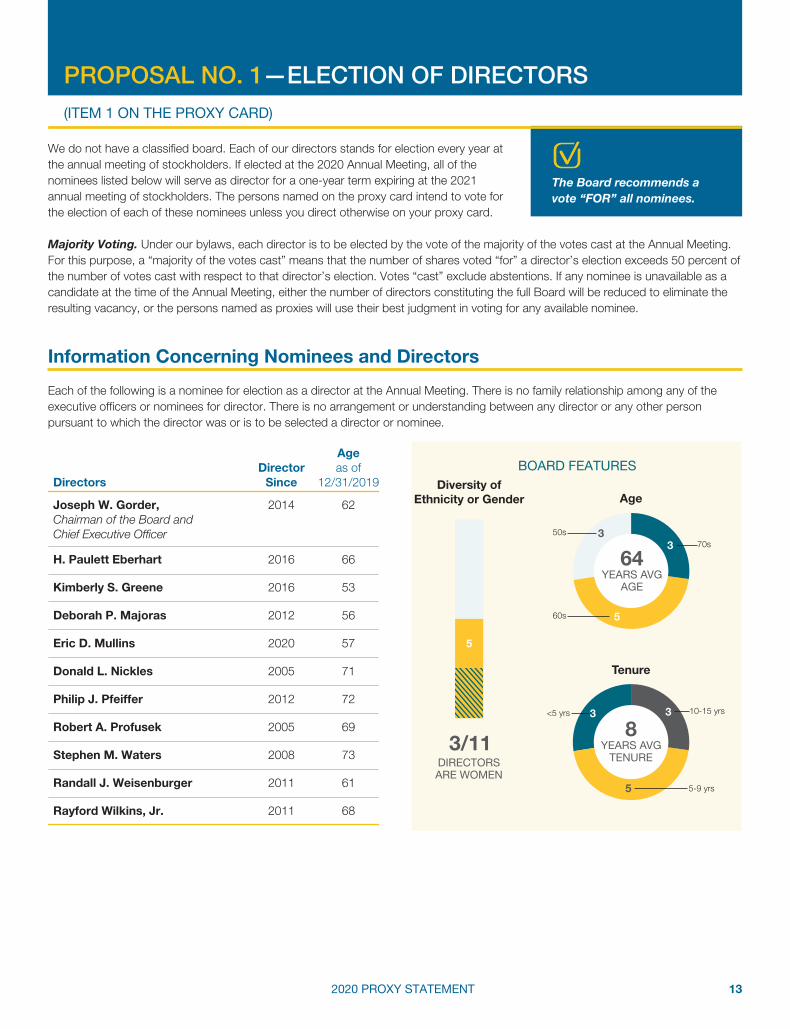
Diversity. Although the Board does not establish specific goals with respect to diversity, the Board’s overall diversity is a significantconsideration in the director nomination process. For this year’s election, the Board has nominated 11 individuals who bring valuablediversity to the Board in terms of gender, ethnicity, industries represented, experience, age, and tenure. The nominees range in agefrom 53 to 73. Five of this year’s nominees (50% of our independent directors) represent diversity of ethnicity or gender. Three of thenominees have served on the Board for less than five years.
Refreshment. We do not set term limits for our directors. As stated in Article I of our Corporate Governance Guidelines, the Boardbelieves that directors who have served on the Board for an extended period of time are able to provide valuable insight into the
6

INFORMATION REGARDING THE BOARD OF DIRECTORS
operations and future of Valero based on their experience with and understanding of Valero’s history, policy, and objectives. As analternative to term limits, the Board believes that its evaluation and nomination processes serve as an appropriate check on each Boardmember’s continued effectiveness.
Retirement Policy. Our directors are subject to a retirement policy (set forth in Article I of our Corporate Governance Guidelines).Under that policy, a director may serve on our Board until he or she reaches the age of 75. A director who turns 75 may serve theremainder of his or her term of office, which shall be deemed to end at the next annual meeting of stockholders at which directors areelected.
Director Continuing Education
We encourage our directors to attend director education programs as appropriate to stay abreast of developments in corporategovernance and board best practices. Valero’s Corporate Governance Guidelines state that Valero will pay for our directors’attendance at continuing education seminars, conferences, or workshops to foster education in matters pertaining to corporategovernance or directors’ responsibilities generally, and that Valero will pay for a director’s membership in an organization such as theNational Association of Corporate Directors in order to provide ongoing resources for board development.
Board Evaluation Process
Our Corporate Governance Guidelines and the charters of each of the Board’s committees require the Board and the committees toconduct an annual performance evaluation. The Nominating/Governance and Public Policy Committee oversees the Board andcommittee self-evaluation process.
At the end of each year, the directors complete detailed surveys designed to evaluate the performance of the Board and each of itsstanding committees. The surveys seek feedback on, among other things, Board and committee composition, the frequency andcontent of Board and committee meetings, the quality of management’s presentations to the Board and the committees, the adequacyof the committees’ charters, and the performance of the Board and the committees in light of the responsibilities of each as establishedin the Corporate Governance Guidelines and the committees’ charters. Summary reports of the evaluation results are compiled andprovided to each director. The summary reports are discussed at Board and/or committee meetings in executive session, led by theChair of the Nominating/Governance and Public Policy Committee, the Lead Director, and/or the Chairman of the Board, all of whomensure that the Board or senior management, as appropriate, follow up on any identified areas for improvement.
In addition to the annual self-evaluation process, the Chair of the Nominating/Governance and Public Policy Committee, the LeadDirector, and/or the Chairman of the Board will meet from time to time with each director individually, either in-person or viateleconference, in order to obtain feedback on the performance of the Board, a committee, or an individual director. The Boardbelieves that all of these evaluation tools provide effective measures and forums for discussing the Board’s effectiveness and potentialareas for improvement.
Leadership Structure of the Board
Our bylaws state that the Chairman of the Board has the power to preside at all meetings of the Board. Joseph W. Gorder, our ChiefExecutive Officer, serves as the Chairman of the Board. Although the Board believes that the combination of the Chairman and ChiefExecutive Officer roles is appropriate in current circumstances, Valero’s Corporate Governance Guidelines do not establish thisapproach as a policy, and in fact, the Chairman and Chief Executive Officer roles were separate from 2005–2007 and from May–December 2014.
The Chief Executive Officer is appointed by the Board to manage Valero’s daily affairs and operations. We believe that Mr. Gorder’sextensive industry experience and direct involvement in Valero’s operations make him best suited to serve as Chairman in order to:
• lead the Board in productive, strategic planning;• determine necessary and appropriate agenda items for meetings of the Board with input from the Lead Director and
independent Board committee Chairs; and• determine and manage the amount of time and information devoted to discussion of agenda items and other matters that
may come before the Board.
2020 PROXY STATEMENT 7

INFORMATION REGARDING THE BOARD OF DIRECTORS
Oversight by Independent Directors. Our Board structure includes strong oversight by independent directors. Mr. Gorder is theonly member from our management (past or present) who serves on the Board; all of our other directors are independent. Each of theBoard’s committees is chaired by an independent director, all committee members are independent, and our Board has named anindependent Lead Director whose duties are described in the following section.
Lead Director and Meetings of Non-Management Directors
Our independent directors appoint a Lead Director whose responsibilities include leading the meetings of our non-managementdirectors outside the presence of management. Following the recommendation of the Nominating/Governance and Public PolicyCommittee, the Board’s independent directors selected Robert A. Profusek to serve as Lead Director during 2020. Our Board regularlymeets in executive session outside the presence of management, generally at each Board and committee meeting.
The Lead Director, working with the committee Chairs, sets agendas and leads the discussion of regular meetings of the Board outsidethe presence of management, provides feedback regarding these meetings to the Chairman, and otherwise serves as liaison betweenthe independent directors and the Chairman. The Lead Director regularly communicates with the Chairman between meetings of theBoard to discuss policy issues, strategies, governance, and other matters that arise throughout the year. The Chairs of the Board’scommittees also communicate regularly with the Lead Director to discuss policy issues facing Valero and the Board and to recommendagenda items for consideration at future Board meetings. The Board believes that this approach appropriately and effectivelycomplements Valero’s combined Chief Executive Officer/Chairman structure.
Our Corporate Governance Guidelines enumerate the duties and responsibilities of the Lead Director, which include:
(a) serving as a liaison between the Chairman and the independent directors,(b) consulting with the Chairman on agendas for board meetings,(c) reviewing and approving information sent to the Board as and when appropriate,(d) the authority to call meetings of the independent directors,(e) setting agendas and leading the discussion of regular executive session meetings of the Board outside the presence of
management and providing feedback regarding these meetings to the Chairman, and(f) receiving, reviewing, and acting upon communications from stockholders or other interested parties when those interests should
be addressed by a person independent of management.
CEO Succession Planning
The full Board continually works with the Compensation Committee to evaluate potential successors to the office of Chief ExecutiveOfficer. Our CEO makes available at all times his recommendations and evaluations of potential successors. The Board regularlydiscusses CEO succession planning in executive sessions led by the Lead Director, both in the presence of the CEO and in sessionswith only the independent directors. The Board’s deliberations also include succession planning for instances of unforeseenemergencies or the temporary disability of the CEO, as well as other senior managers. The Compensation Committee oversees all ofValero’s management succession planning programs, including leadership development, and regularly reports to and engages with theBoard on the topic.
Risk Oversight
The Board considers oversight of Valero’s risk management to be a responsibility of the full Board. The Board’s role in risk oversightincludes receiving reports from its committees, members of senior management, and third-parties on areas of material risk to Valero,and/or to the success of a particular project or endeavor under consideration.
The full Board regularly receives from management, and discusses at board meetings, updates on operational, financial, market, legal,regulatory, strategic, political, reputational, environmental, cybersecurity, policy, and climate-related risks facing Valero. From time totime, the Board also requests reports on areas of special or current relevance. For example, the full Board has recently completedreviews with management of (i) Valero’s cybersecurity initiatives, (ii) Valero’s assessment of climate-related risks and opportunities,(iii) Valero’s policies and procedures concerning issues of workplace diversity, sexual harassment, discrimination, and workplace safety,(iv) the status of Valero’s pension and retirement plans, and (v) Valero’s risk management programs, including property, casualty,business interruption, and marine cargo insurance programs.
8

INFORMATION REGARDING THE BOARD OF DIRECTORS
The Board also discusses significant risks at the Board’s annual strategic planning meeting. In addition to receiving and discussingreports from management in strategic planning sessions, the Board is also able to interact with third-party experts who are invited tomake presentations to the Board on risks facing Valero and its businesses.
The oversight of risk is shared between the full Board and its committees. The full Board (or appropriate Board committee) regularlyreceives reports from management to enable the Board (or committee) to assess Valero’s risk identification, risk management, and riskmitigation strategies. When a report is vetted at the committee level, the Chair of that committee thereafter reports on the matter to thefull Board. This enables the Board and its committees to coordinate the Board’s risk oversight role. The Board also believes that riskmanagement is an integral part of Valero’s annual strategic planning process, which addresses, among other things, the risks andopportunities facing Valero in the long term.
One of the Audit Committee’s responsibilities is to discuss with management Valero’s major financial risk exposures and the stepsValero has taken to monitor and control those exposures, including our risk assessment and risk management policies. The AuditCommittee also has oversight responsibility regarding management’s annual assessment of, and report on, Valero’s internal controlover financial reporting. In addition, Valero’s Chief Information Officer reports regularly to the Audit Committee regarding Valero’sinitiatives and strategies respecting cybersecurity and information technology risks.
Our Nominating/Governance and Public Policy Committee reviews our policies and performance in areas of employee and contractorhealth and safety, environmental compliance, governmental affairs, reputation management, climate-related risks and opportunities,political contributions, and policy matters generally. Valero’s President & COO (Mr. Riggs) and EVP & General Counsel (Mr. Fraser)attend all meetings of the Committee. In addition, members from senior management report regularly to the Committee regardingValero’s health, safety and environmental risks, strategies, and assessments. The Committee also assists the Board in oversight ofValero’s disclosure of climate-related risks and opportunities (as described further in “Climate Change Disclosure” below).
Our Compensation Committee assesses the risk of our compensation programs. Our compensation consultant regularly attendsmeetings of the Committee to provide updates on compensation related risks and trends. See also, “Risk Assessment ofCompensation Programs” elsewhere in this proxy statement.
2020 PROXY STATEMENT 9
STOCKHOLDER ENGAGEMENT
Engagement Process
Ongoing engagement with our stockholders is important to us. We communicate with our stockholders through a variety of means,including direct interface, investor presentations, our website, and publications we issue. As part of our engagement program, oursenior management team reaches out to our stockholders for dialogue concerning their priorities – which may include our strategy,company culture, environmental initiatives, financial performance, capital allocation, executive compensation, climate-related risks andopportunities, and/or corporate governance. We value our stockholders’ views and their input is important.
Our ESG, Compliance, Investor Relations, and Legal teams are dedicated to leading our engagement efforts and collaborating withValero’s management teams and subject matter experts (SMEs) in order to provide appropriate resources for engagement with ourstockholders. The chairs of our Compensation Committee and Nominating/Governance and Public Policy Committee have alsoparticipated in our engagements with stockholders.
Our engagements with stockholders have been constructive and have provided management and the Board with insights on issuesand initiatives that are important to our stockholders and other stakeholders. We initiate formal outreach efforts in the months prior toour annual meeting of stockholders. Through that process, we contact stockholders and invite them to engage in discussions with ourmanagement team and SMEs on a variety of topics, including the stockholders’ priorities and interests, our proxy statementdisclosures, stockholder proposals, company strategy, and ESG matters. Following our annual meeting, our engagement effortscontinue so that we may follow up on matters brought to our attention and/or discuss new issues of interest. Procedures forcommunicating with us are stated in “Stockholder Communications, Nominations, and Proposals” elsewhere in this proxy statement.
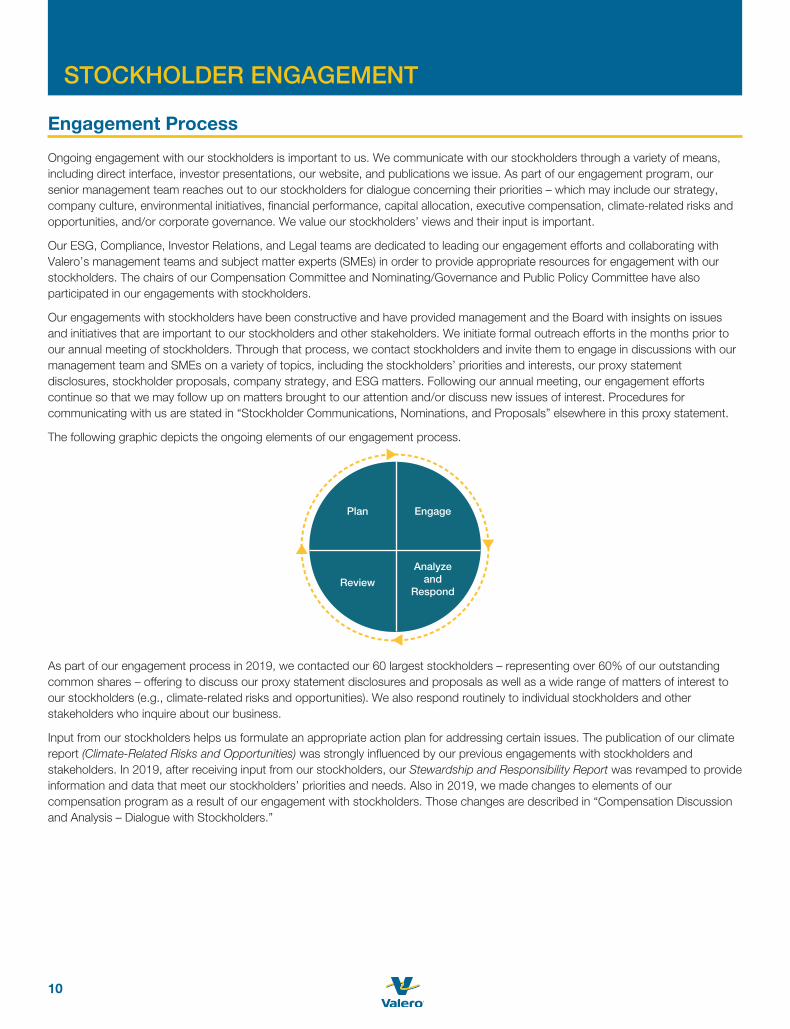
The following graphic depicts the ongoing elements of our engagement process.
Plan Engage
Analyzeand
RespondReview
As part of our engagement process in 2019, we contacted our 60 largest stockholders – representing over 60% of our outstandingcommon shares – offering to discuss our proxy statement disclosures and proposals as well as a wide range of matters of interest toour stockholders (e.g., climate-related risks and opportunities). We also respond routinely to individual stockholders and otherstakeholders who inquire about our business.
Input from our stockholders helps us formulate an appropriate action plan for addressing certain issues. The publication of our climatereport (Climate-Related Risks and Opportunities) was strongly influenced by our previous engagements with stockholders andstakeholders. In 2019, after receiving input from our stockholders, our Stewardship and Responsibility Report was revamped to provideinformation and data that meet our stockholders’ priorities and needs. Also in 2019, we made changes to elements of ourcompensation program as a result of our engagement with stockholders. Those changes are described in “Compensation Discussionand Analysis – Dialogue with Stockholders.”
10

CLIMATE CHANGE DISCLOSURE
In 2017 the Financial Stability Board’s Task Force on Climate-related Financial Disclosure (TCFD) issued its recommendations onreporting climate-related financial information. In September 2018, Valero published its climate report—under Board oversight led bythe Nominating/Governance and Public Policy Committee—that is aligned with the main principles outlined in the recommendations ofthe TCFD. The report is published on our website at www.valero.com > About Valero > Corporate Responsibility > Climate-RelatedRisks and Opportunities.
Per the Board’s Nominating/Governance and Public Policy Committee charter, the committee reviews and discusses withmanagement, at least annually, Valero’s strategy and performance in assessing and responding to climate-related risks andopportunities.
Valero’s Climate-Related Risks and Opportunities report is not a part of this proxy statement. The report is not “soliciting material,”is not deemed filed with the SEC, and is not to be incorporated by reference into any of Valero’s filings under the Securities Act of1933, as amended, or the Securities Exchange Act of 1934, as amended, whether made before or after the date of this proxystatement and irrespective of any general incorporation language therein.
2020 PROXY STATEMENT 11

CORPORATE RESPONSIBILITY
In our Stewardship and Responsibility Report, we make disclosures on a variety of environmental, social, and governance (ESG) topicsof interest to our stakeholders. The report covers the following areas of interest:
• Valero’s vision and guiding principles;• ESG data and initiatives;• safety and reliability;• environmental matters, including data on criteria emissions, flaring, energy conservation, GHG emissions, cogeneration,
waste water management, our wind farm, renewable diesel, ethanol, EPA’s Efficient Producer Program, recycling processes,and wetlands tree planting;
• community engagement and support;• employees and human capital, including diversity and inclusion;• governance;• the social benefit of Valero’s products; and• summary of recent awards.
The report is published on our website at www.valero.com > About Valero > Corporate Responsibility > Stewardship andResponsibility Report.
Valero’s Stewardship and Responsibility Report is not a part of this proxy statement. The report is not “soliciting material,” is notdeemed filed with the SEC, and is not to be incorporated by reference into any of Valero’s filings under the Securities Act of 1933, asamended, or the Securities Exchange Act of 1934, as amended, whether made before or after the date of this proxy statement andirrespective of any general incorporation language therein.
12
PROPOSAL NO. 1—ELECTION OF DIRECTORS(ITEM 1 ON THE PROXY CARD)
We do not have a classified board. Each of our directors stands for election every year atthe annual meeting of stockholders. If elected at the 2020 Annual Meeting, all of thenominees listed below will serve as director for a one-year term expiring at the 2021annual meeting of stockholders. The persons named on the proxy card intend to vote forthe election of each of these nominees unless you direct otherwise on your proxy card.
The Board recommends avote “FOR” all nominees.
Majority Voting. Under our bylaws, each director is to be elected by the vote of the majority of the votes cast at the Annual Meeting.For this purpose, a “majority of the votes cast” means that the number of shares voted “for” a director’s election exceeds 50 percent ofthe number of votes cast with respect to that director’s election. Votes “cast” exclude abstentions. If any nominee is unavailable as acandidate at the time of the Annual Meeting, either the number of directors constituting the full Board will be reduced to eliminate theresulting vacancy, or the persons named as proxies will use their best judgment in voting for any available nominee.
Information Concerning Nominees and Directors
Each of the following is a nominee for election as a director at the Annual Meeting. There is no family relationship among any of theexecutive officers or nominees for director. There is no arrangement or understanding between any director or any other personpursuant to which the director was or is to be selected a director or nominee.
DirectorsDirector
Since
Ageas of
12/31/2019
Joseph W. Gorder,Chairman of the Board andChief Executive Officer
2014 62
H. Paulett Eberhart 2016 66
Kimberly S. Greene 2016 53
Deborah P. Majoras 2012 56
Eric D. Mullins 2020 57
Donald L. Nickles 2005 71
Philip J. Pfeiffer 2012 72
Robert A. Profusek 2005 69
Stephen M. Waters 2008 73
Randall J. Weisenburger 2011 61
Rayford Wilkins, Jr. 2011 68
BOARD FEATURES
DIRECTORS ARE WOMEN
3/11
Age
Tenure
Diversity ofEthnicity or Gender
50s
60s
10-15 yrs
5-9 yrs
8YEARS AVG
TENURE
3 3
5
<5 yrs
5
64YEARS AVG
AGE
3
5
70s3
2020 PROXY STATEMENT 13
PROPOSAL NO. 1—ELECTION OF DIRECTORS
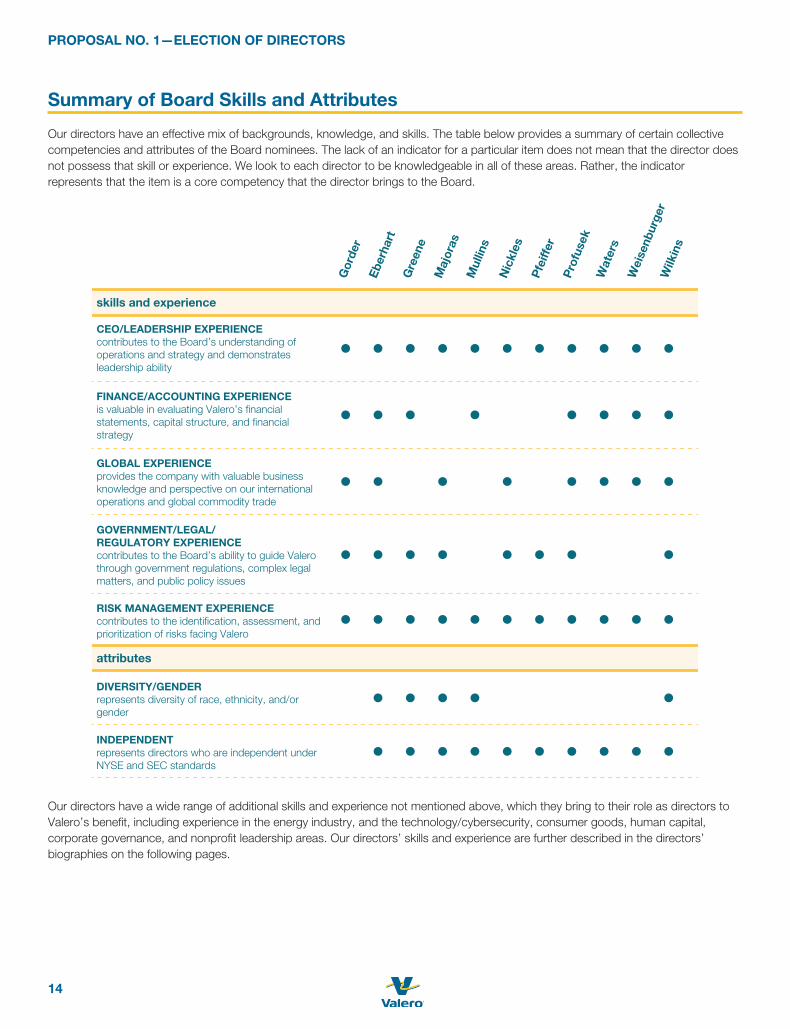
Summary of Board Skills and Attributes
Our directors have an effective mix of backgrounds, knowledge, and skills. The table below provides a summary of certain collectivecompetencies and attributes of the Board nominees. The lack of an indicator for a particular item does not mean that the director doesnot possess that skill or experience. We look to each director to be knowledgeable in all of these areas. Rather, the indicatorrepresents that the item is a core competency that the director brings to the Board.
skills and experience
Gor
der
Eber
hart
Gre
ene
Maj
oras
Nic
kles
Pfei
ffer
Prof
usek
Wat
ers
Wei
senb
urge
rW
ilkin
sattributes
CEO/LEADERSHIP EXPERIENCEcontributes to the Board’s understanding ofoperations and strategy and demonstratesleadership ability
FINANCE/ACCOUNTING EXPERIENCEis valuable in evaluating Valero’s financialstatements, capital structure, and financialstrategy
GLOBAL EXPERIENCEprovides the company with valuable businessknowledge and perspective on our internationaloperations and global commodity trade
GOVERNMENT/LEGAL/REGULATORY EXPERIENCEcontributes to the Board’s ability to guide Valerothrough government regulations, complex legalmatters, and public policy issues
DIVERSITY/GENDERrepresents diversity of race, ethnicity, and/orgender
INDEPENDENTrepresents directors who are independent underNYSE and SEC standards
RISK MANAGEMENT EXPERIENCEcontributes to the identification, assessment, andprioritization of risks facing Valero
Mul
lins
Our directors have a wide range of additional skills and experience not mentioned above, which they bring to their role as directors toValero’s benefit, including experience in the energy industry, and the technology/cybersecurity, consumer goods, human capital,corporate governance, and nonprofit leadership areas. Our directors’ skills and experience are further described in the directors’biographies on the following pages.
14

PROPOSAL NO. 1—ELECTION OF DIRECTORS
Nominees
Age: 62
Director Since: 2014
Chairman
JOSEPH W. GORDER
Featured experience, qualifications, and attributes:• Global energy business leadership at Valero Energy Corporation as Chairman of the Board
and Chief Executive Officer (since 2014), and President (from 2012 to Jan. 2020).
• Refining and marketing operations experience as Valero’s President and Chief OperatingOfficer beginning in 2012. Prior to that, Mr. Gorder was Executive Vice President and ChiefCommercial Officer (beginning in 2011), and led Valero’s European operations from its Londonoffice. Before that, he held several leadership positions with Valero and Ultramar DiamondShamrock Corporation (UDS) with responsibilities including marketing & supply and corporatedevelopment.
Other public company boards (current): none
Prior public company boards (in last five years): Anadarko Petroleum Corporation (NYSE: APC), ValeroEnergy Partners LP (NYSE: VLP)
Age: 66
Director Since: 2016
Committee: Audit
Independent
H. PAULETT EBERHART
Featured experience, qualifications, and attributes:• Business leadership as Board Chair and CEO of HMS Ventures (since 2014), a privately held
business involved with technology services and the acquisition and management of real estate.From 2011 through March 2014, she served as President and CEO of CDI Corp. (NYSE: CDI), aprovider of engineering and information technology outsourcing and professional staffingservices. She served as a consultant to CDI from April 2014 through December 2014.Ms. Eberhart also served as Board Chair and CEO of HMS Ventures from January 2009 untilJanuary 2011.
• Information technology, management, accounting, and finance expertise at InvensysProcess Systems, Inc. (Invensys), a process automation company (President and CEO from 2007to 2009), and Electronic Data Systems Corporation (EDS) (1978 to 2004), an informationtechnology and business process outsourcing company. She was President of Americas of EDS(2003 to March 2004), and served as President of Solutions Consulting at EDS (2002 to 2003).Ms. Eberhart is a Certified Public Accountant.
• Public company governance expertise through her service as Lead Director for another publiccompany.
Other public company boards (current): LPL Financial Holdings Inc. (NASDAQ: LPLA)
Prior public company boards (in last five years): Anadarko Petroleum Corporation (NYSE: APC), CDICorp. (NYSE: CDI), Cameron International Corporation (NYSE: CAM), Ciber, Inc. (NYSE: CBR),Advanced Micro Devices, Inc. (NASDAQ: AMD).
2020 PROXY STATEMENT 15
PROPOSAL NO. 1—ELECTION OF DIRECTORS
Age: 53
Director Since: 2016
Committee:Nom/Gov & Public Policy
Independent
KIMBERLY S. GREENE
Featured experience, qualifications, and attributes:• Energy business leadership at Southern Company Gas as Board Chair, Chief Executive
Officer and President (since June 2018). She served as Executive Vice President and ChiefOperating Officer of the Southern Company (NYSE: SO) from 2014 to May 2018. Prior to that,she was President and CEO of Southern Company Services, Inc. Ms. Greene began her careerat Southern Company in 1991 and held positions of increasing responsibility in the areas ofengineering, strategy, finance, and wholesale marketing, including Senior Vice President andTreasurer of Southern Company Services, Inc. from 2004 to 2007. She rejoined SouthernCompany in 2013.
• Finance expertise and regulatory business management experience as Executive VicePresident and Chief Generation Officer of Tennessee Valley Authority (TVA). While at TVA (2007to 2013), she served as Chief Financial Officer, Executive Vice President of financial services andChief Risk Officer, as well as Group President for strategy and external relations.
• Organizational leadership experience through service on the boards of the American GasAssociation, The Alliance Theater (Atlanta), Metro Atlanta Chamber of Commerce, andMorehouse School of Medicine.
Other public company boards (current): none
Prior public company boards (in last five years): none
Age: 56
Director Since: 2012
Committee:Nom/Gov & Public Policy(Chair)
Independent
DEBORAH P. MAJORAS
Featured experience, qualifications, and attributes:• Public company leadership and governance experience as Chief Legal Officer and Secretary
of The Procter & Gamble Company (P&G) (NYSE: PG) since 2010. She joined P&G in 2008 asSenior Vice President and General Counsel.
• Government, regulatory, and legal experience as Chair of the U.S. Federal Trade Commissionfrom 2004 until 2008. From 2001 to 2004, Ms. Majoras was Deputy Assistant Attorney General inthe U.S. Department of Justice, Antitrust Division. Ms. Majoras joined the law firm of Jones Day in1991, and became a partner in 1999.
• Organizational leadership experience through service on the boards of the United States GolfAssociation, The Christ Hospital Health Network, Legal Aid Society of Greater Cincinnati, andWestminster College.
Other public company boards (current): none
Prior public company boards (in last five years): none
16

PROPOSAL NO. 1—ELECTION OF DIRECTORS
Age: 57
Director Since: 2020
Committee:Nom/Gov & Public Policy
Independent
ERIC D. MULLINS
Featured experience, qualifications, and attributes:• Energy business leadership as the Managing Director and Co-Chief Executive Officer of Lime
Rock Resources, a company that he co-founded in 2005, which acquires, operates, andimproves lower-risk oil and natural gas properties. Mr. Mullins oversees all strategic, financial, andoperational aspects of the Lime Rock Resources funds. From May 2011 through October 2015,he also served as the Co-Chief Executive Officer and Chairman of the Board of Directors of LREGP, LLC, the general partner of LRR Energy, L.P., an oil and natural gas company.
• Management, accounting, and finance expertise as a Managing Director in the InvestmentBanking Division of Goldman Sachs where he led numerous financing, structuring, and strategicadvisory transactions in the division’s Natural Resources Group. He has served as Chair of theAudit Committee for Anadarko Petroleum Corporation and as a member of the Audit Committeefor PG&E Corporation.
• Organizational leadership through service on the board of trustees of the Baylor College ofMedicine.
Other public company boards (current): PG&E Corporation (NYSE: PCG)
Prior public company boards (in last five years): Anadarko Petroleum Corporation (NYSE: APC)
Age: 71
Director Since: 2005
Committee:Nom/Gov & Public Policy
Independent
DONALD L. NICKLES
Featured experience, qualifications, and attributes:• Government affairs leadership and experience as U.S. Senator from Oklahoma for 24 years
(retired 2005). He also served in the Oklahoma State Senate for two years. During his tenure asU.S. Senator, he was Assistant Republican Leader for six years, Chairman of the RepublicanSenatorial Committee, and Chairman of the Republican Policy Committee. He served asChairman of the Budget Committee and as a member of the Finance and Energy and NaturalResources Committees.
• Business leadership as current Chairman and Chief Executive Officer of The Nickles Group, aWashington-based consulting and business venture firm formed in 2005.
• Organizational leadership through service on the advisory board of the Oklahoma MedicalResearch Foundation and the board of directors of Central Union Mission (Washington, DC).
Other public company boards (current): Board of Trustees of Washington Mutual Investors Fund(AWSHX)
Prior public company boards (in last five years): none
2020 PROXY STATEMENT 17

PROPOSAL NO. 1—ELECTION OF DIRECTORS
Age: 72
Director Since: 2012
Committee:Compensation
Independent
PHILIP J. PFEIFFER
Featured experience, qualifications, and attributes:• Business leadership, legal and human capital expertise in the San Antonio office of Norton
Rose Fulbright LLP, where he was Partner-in-Charge for 25 years and led the office’s labor andemployment practice (he presently serves Of Counsel). Through his service with the firm foralmost 50 years, Mr. Pfeiffer assisted employers in traditional management–union matters,complex civil rights matters, employment discrimination cases, affirmative action compliance,employment torts, alternative dispute resolution, employment contracts, and ERISA litigation.
• Organizational leadership through board service and affiliations with Southwest ResearchInstitute, United Way of San Antonio and Bexar County, San Antonio Medical Foundation, TheChildren’s Hospital of San Antonio Foundation, Alamo Area Council of Boy Scouts, and theCancer Therapy and Research Center.
Other public company boards (current): none
Prior public company boards (in last five years): none
Age: 69
Director Since: 2005Lead Director
Committee:Compensation
Independent
ROBERT A. PROFUSEK
Featured experience, qualifications, and attributes:• Business leadership and capital markets expertise as a partner of the Jones Day law firm
where Mr. Profusek chairs the firm’s global mergers and acquisitions practice. His law practicefocuses on mergers, acquisitions, takeovers, restructurings, and corporate governance matters.
• Public company governance experience and expertise through service as Valero’s LeadDirector and the Lead Director of two other public companies. He is a frequent speaker regardingcorporate takeovers and corporate governance, has authored or co-authored numerous articles,has testified before Congress and the SEC about takeover and compensation-related matters,and is a frequent guest commentator on CNBC, CNN, and Bloomberg TV.
• Organizational leadership through service on the board of directors of the Legal Aid Society ofNew York City.
Other public company boards (current): Kodiak Sciences Inc. (NASDAQ: KOD), CTS Corporation(NYSE: CTS)
Prior public company boards (in last five years): none
18

PROPOSAL NO. 1—ELECTION OF DIRECTORS
Age: 73
Director Since: 2008
Committee:Audit
Independent
STEPHEN M. WATERS
Featured experience, qualifications, and attributes:• Financial business leadership as the managing partner of Compass Partners Capital since
2018, the managing partner of Compass Partners Advisers LLP and its predecessor partnerships(since 1996), Managing Partner of Compass Partners Capital (since 2018), and Chief Executive ofCompass Partners European Equity Fund from 2005 to 2013.
• Finance and global experience from his service in several capacities at Morgan Stanley,including Co-Head of the Mergers and Acquisitions department from 1990 to 1992, Co-ChiefExecutive Officer of Morgan Stanley Europe from 1992 to 1996, and as a member of itsworldwide Firm Operating Committee from 1992 to 1996. From 1974 to 1988, he was withLehman Brothers, co-founding the Mergers and Acquisitions department in 1977, becoming apartner in 1980, and serving as Co-Head of the Mergers and Acquisitions department from 1985to 1988.
• Organizational leadership through service on the board of trustees of the United States NavalInstitute Foundation.
Other public company boards (current): Boston Private Financial Holdings, Inc. (NASDAQ: BPFH)
Prior public company boards (in last five years): none
Age: 61
Director Since: 2011
Committee:Audit (Chair)
Independent
RANDALL J. WEISENBURGER
Featured experience, qualifications, and attributes:• Global business leadership and capital markets and finance expertise as the managing
member of Mile 26 Capital, LLC, an investment fund based in Greenwich, Connecticut (since2014), and service as Executive Vice President and Chief Financial Officer of Omnicom GroupInc. (NYSE: OMC) from 1998 through 2014. Prior to joining Omnicom, he was a foundingmember of Wasserstein Perella and a former member of First Boston Corporation. AtWasserstein Perella, Mr. Weisenburger specialized in private equity investing and leveragedacquisitions, and in 1993, he became President and CEO of the firm’s private equity subsidiary.
• Organizational leadership through service on the board of directors of Acosta Sales andMarketing, and Corsair Components, Inc.; and the Board of Overseers of the Wharton School ofBusiness at the University of Pennsylvania.
Other public company boards (current): Carnival Corporation and Carnival plc (NYSE: CCL)
Prior public company boards (in last five years): none
2020 PROXY STATEMENT 19

PROPOSAL NO. 1—ELECTION OF DIRECTORS
Age: 68
Director Since: 2011
Committee:Compensation (Chair)
Independent
RAYFORD WILKINS, JR.
Featured experience, qualifications, and attributes:• Global business leadership and technology and finance expertise as CEO of Diversified
Businesses of AT&T Inc. (NYSE: T), where he was responsible for international investments,AT&T Interactive, AT&T Advertising Solutions, customer information services, and the consumerwireless initiative in India. He retired from AT&T at the end of March 2012. Mr. Wilkins heldseveral other leadership positions at AT&T and its predecessor companies, including GroupPresident and CEO of SBC Enterprise Business Services and President and CEO of SBC PacificBell.
• Organizational leadership through service on the Advisory Council of the McCombs School ofBusiness at the University of Texas at Austin.
Other public company boards (current): Morgan Stanley (NYSE: MS), Caterpillar Inc. (NYSE: CAT)
Prior public company boards (in last five years): none
For information regarding the nominees’ Common Stock holdings, compensation, and other arrangements, see “Information Regardingthe Board of Directors,” “Beneficial Ownership of Valero Securities,” “Compensation Discussion and Analysis,” and “Compensation ofDirectors” elsewhere in this proxy statement.
20

IDENTIFICATION OF EXECUTIVE OFFICERS
The following table lists Valero’s executive officers (for purposes of Rule 3b-7 under the Securities Exchange Act of 1934), describedbelow using their current titles. As used in this proxy statement, our “named executive officers” are the five persons listed in theSummary Compensation Table. There is no arrangement or understanding between any executive officer listed below or any otherperson under which the executive officer was or is to be selected as an officer.
OfficerSince
Age as of12/31/2019
Joseph W. Gorder, Chief Executive Officer and Chairman of the Board 2003 62
R. Lane Riggs, President and Chief Operating Officer 2011 54
Jason W. Fraser, Executive Vice President and General Counsel 2015 51
Gary K. Simmons, Executive Vice President and Chief Commercial Officer 2011 55
Donna M. Titzman, Executive Vice President and Chief Financial Officer 2001 56
Mr. Gorder. Mr. Gorder’s biographical information appears above under the caption “Information Concerning Nominees andDirectors—Nominees.”
Mr. Riggs was elected President and Chief Operating Officer on Jan. 23, 2020. He previously served as Executive Vice President andChief Operating Officer (since Jan. 1, 2018), and prior to that as Executive Vice President–Refining Operations and Engineering (since2014), and Senior Vice President–Refining Operations (since 2011). He has held several leadership positions with Valero overseeingrefining operations, crude and feedstock supply, and planning and economics. Mr. Riggs also served on the board of directors ofValero Energy Partners GP LLC (the general partner of Valero Energy Partners LP (NYSE: VLP)) from 2014 to 2019.
Mr. Fraser was elected Executive Vice President and General Counsel effective Jan. 1, 2019. Prior to that, he served as Senior VicePresident overseeing Valero’s Public Policy & Strategic Planning, Governmental Affairs, Investor Relations, and ExternalCommunications functions (from May 2018). From Nov. 2016 to May 2018, Mr. Fraser served as Vice President-Public Policy &Strategic Planning, and from May 2015 to Nov. 2016, he served in London as Vice President-Europe, overseeing Valero’s Europeancommercial businesses. Prior to his service in London, he served in Valero’s San Antonio headquarters as Senior Vice President &Deputy General Counsel of Valero Services, Inc. (2013 to 2015). Prior to that, he held various leadership roles with Valero, includingSenior Vice President-Specialty Products of Valero Marketing and Supply Company.
Mr. Simmons was elected Executive Vice President and Chief Commercial Officer on Jan. 23, 2020. He previously served as SeniorVice President–Supply, International Operations and Systems Optimization (since May 2014), and prior to that as Vice President–Crudeand Feedstock Supply and Trading (2012 to 2014), and Vice President–Supply Chain Optimization (2011 to 2012). Mr. Simmons hasheld many leadership positions with Valero including Vice President and General Manager of Valero’s Ardmore and St. Charlesrefineries.
Ms. Titzman has served as Executive Vice President and Chief Financial Officer since May 3, 2018. From 2013 to May 2018, sheserved as Senior Vice President and Treasurer having responsibility for banking, cash management, customer credit, investmentmanagement, and risk management. She has also served as Chief Financial Officer and director of Valero Energy Partners GP LLC (thegeneral partner of Valero Energy Partners LP (NYSE: VLP)) from 2013 to 2019. She has held various leadership positions with Valerobefore being elected Treasurer in 1998, and Vice President and Treasurer in 2001. Ms. Titzman is a Certified Public Accountant.
2020 PROXY STATEMENT 21

BENEFICIAL OWNERSHIP OF VALERO SECURITIES
SECURITY OWNERSHIP OF MANAGEMENT AND DIRECTORS
This table lists the beneficial ownership of our Common Stock as of Feb. 1, 2020, by all directors and nominees, the executive officersnamed in the Summary Compensation Table, and the directors and executive officers of Valero as a group. No executive officer,director, or nominee for director owns any class of equity securities of Valero other than Common Stock. None of the shares listedbelow are pledged as security. The address for each person is One Valero Way, San Antonio, Texas 78249.
Name of Beneficial OwnerSharesHeld (1)
Shares UnderOptions (2)
TotalShares
Percent ofClass
H. Paulett Eberhart 4,571 — 4,571 *
Jason W. Fraser 47,734 — 47,734 *
Joseph W. Gorder 449,811 139,897 589,708 *
Kimberly S. Greene 5,720 — 5,720 *
Deborah P. Majoras 19,548 — 19,548 *
Eric D. Mullins — — — *
Donald L. Nickles 26,033 — 26,033 *
Philip J. Pfeiffer 20,914 — 20,914 *
Robert A. Profusek 37,864 — 37,864 *
R. Lane Riggs 182,752 2,667 185,419 *
Gary K. Simmons 128,982 1,750 130,732 *
Donna M. Titzman 204,076 16,623 220,699 *
Stephen M. Waters 9,521 — 9,521 *
Randall J. Weisenburger 55,274 — 55,274 *
Rayford Wilkins, Jr. 32,198 — 32,198 *
Directors and current executive officers as a group (15 persons) 1,224,998 160,937 1,385,935 *
* Indicates that the percentage of beneficial ownership does not exceed 1% of the class.
(1) Includes shares allocated under the Thrift Plan and shares of restricted stock. The balance shown for Mr. Waters includes 500 shares held in a trustfor which Mr. Waters is a beneficiary.
(2) Represents shares of Common Stock that may be acquired under outstanding stock options currently exercisable and that are exercisable within60 days from Feb. 1, 2020.
22

BENEFICIAL OWNERSHIP OF VALERO SECURITIES
SECURITY OWNERSHIP OF CERTAIN BENEFICIAL OWNERS
This table describes each person or group of affiliated persons known to be a beneficial owner of more than five percent of ourCommon Stock as of Dec. 31, 2019. The information is based on reports filed by such persons with the SEC.
Name and Address of Beneficial OwnerAmount and Nature ofBeneficial Ownership
Percent ofClass
The Vanguard Group100 Vanguard BlvdMalvern PA 19355 34,751,539 (1) 8.5%
BlackRock, Inc.55 East 52nd StreetNew York NY 10055 33,601,040 (2) 8.2%
State Street CorporationState Street Financial CenterOne Lincoln StreetBoston MA 02111 21,576,641 (3) 5.3%
(1) The Vanguard Group filed with the SEC a Schedule 13G on Feb. 12, 2020, reporting that it or certain of its affiliates beneficially owned in theaggregate 34,751,539 shares, for which it had sole voting power for 612,849 shares, shared voting power for 124,287 shares, sole dispositivepower for 34,052,213 shares, and shared dispositive power for 699,326 shares.
(2) BlackRock, Inc. filed with the SEC an amended Schedule 13G on Feb. 10, 2020, reporting that it or certain of its affiliates beneficially owned in theaggregate 33,601,040 shares, for which it had sole voting power for 28,768,134 shares and sole dispositive power for 33,601,040 shares.
(3) State Street Corporation filed with the SEC a Schedule 13G on Feb. 14, 2020, reporting that it or certain of its affiliates beneficially owned in theaggregate 21,576,641 shares, for which it had shared voting power for 19,266,984 shares, and shared dispositive power for 21,557,904 shares.
2020 PROXY STATEMENT 23

RISK ASSESSMENT OF COMPENSATION PROGRAMS
Our incentive compensation programs are designed to effectively balance risk and reward. When assessing risk, we consider bothcash compensation payable under our annual incentive bonus plan as well as long-term incentives that are awarded under our stockincentive plan. We also consider the mix of award opportunities (i.e., short- versus long-term), performance targets and metrics, thetarget-setting process, and the administration and governance associated with our plans. We do not believe that our compensationpolicies and practices are reasonably likely to have an adverse effect on Valero. Features of our compensation programs that webelieve mitigate excessive risk taking include:
• the mix between fixed and variable, annual and long-term, and cash and equity compensation, designed to encouragestrategies and actions that are in Valero’s long-term best interests;
• determination of incentive awards based on a variety of indicators of performance, thus diversifying the risk associated with asingle indicator of performance;
• incorporation of relative total stockholder return into our incentive program, calibrating pay and performance relationships tocompanies facing the same or similar market forces as Valero;
• multi-year vesting periods for equity incentive awards, which encourage focus on sustained growth and earnings;• maximum payout ceilings under our annual bonus program and performance share awards;• restricted stock awards that help contain volatility of incentive awards and further align executives’ interests with long-term
stockholder value creation; and• our compensation-related policies, including our executive compensation “clawback” policy and stock ownership guidelines
(discussed under the caption “Compensation Discussion and Analysis—Compensation Related Policies”).
24

COMPENSATION DISCUSSION AND ANALYSIS
TABLE OF CONTENTS
Company Overview 25
Company Performance 26
Alignment of Executive Pay to CompanyPerformance 29
Elements of Executive Compensation—Summary 30
Pay for Performance Alignment Relative to Peers 32
Adoption of Compensation Governance BestPractices 33
Dialogue With Stockholders 34
Administration of Executive CompensationPrograms 35
Benchmarking Data 35
Process and Timing of Compensation Decisions 36
Elements of Executive Compensation 37
Benchmarking Competitive Pay Levels 38
Relative Size of Major Compensation Elements 38
Individual Performance and Personal Objectives 39
Base Salaries 39
Annual Incentive Bonus 40
Long-Term Incentive Awards 43
Perquisites and Other Benefits 45
Post-Employment Benefits 45
Accounting and Tax Treatment 46
Compensation-Related Policies 46
The following Compensation Committee Report is not “soliciting material,” is not deemed filed with the SEC, and is not tobe incorporated by reference into any of Valero’s filings under the Securities Act of 1933, as amended, or the SecuritiesExchange Act of 1934, as amended, whether made before or after the date of this proxy statement and irrespective ofany general incorporation language therein.
COMPENSATION COMMITTEE REPORT
The Compensation Committee has reviewed and discussed the following Compensation Discussion and Analysis with management.Based on the foregoing review and discussions and such other matters the Compensation Committee deemed relevant andappropriate, the Committee recommended to the Board that the Compensation Discussion and Analysis be included in this proxystatement.
Members of the Compensation Committee:Rayford Wilkins, Jr., ChairPhilip J. PfeifferRobert A. Profusek
Compensation Discussion and Analysis—Overview
Company OverviewValero strives to be the premier manufacturer, distributor and marketer of transportation fuels and petrochemical products with a focuson creating value for its stockholders while serving the needs of its more than 10,000 employees and neighboring communities.Sustained profitability within the fuels manufacturing and marketing business in which operating margins are primarily influenced byvolatile commodity prices, requires a sound business strategy, organizational discipline, and a committed workforce. Valero’smanagement and employees are driven by our guiding principles in safety, environmental stewardship, community engagement,employee programs and governance.
Valero’s (i) continued significant investments in the expansion of renewable fuels production capacity, (ii) focus on safe, reliable andenvironmentally responsible operations, and (iii) status as an employer of choice, support Valero’s intention to be the best-in-classproducer of essential fuels and products that are foundational to modern life.
2020 PROXY STATEMENT 25
COMPENSATION DISCUSSION AND ANALYSIS
Valero has three reporting segments – refining, ethanol and renewable diesel. The refining segment includes refining operations andassociated marketing activities and logistics assets. Valero is the largest global independent petroleum refiner and owns refinerieslocated in the United States, Canada and the United Kingdom. The ethanol segment includes ethanol operations and associatedmarketing activities and logistics assets, with plants throughout the U.S. Midwest. Valero is the world’s second-largest corn ethanolproducer and sells this low-carbon fuel both domestically and internationally. Valero’s renewable diesel segment includes theoperations of Diamond Green Diesel, a joint venture with Darling Ingredients Inc., producing low-carbon renewable diesel fuel at a plantin Louisiana. Diamond Green Diesel is the world’s second-largest renewable diesel producer.
VALERO’S STRATEGY FOR VALUE CREATION
• Maintain manufacturing excellence through safe, reliable, environmentally responsible operations.• Utilize a disciplined capital allocation that delivers distinctive financial results and peer-leading returns to stockholders.• Grow earnings through market expansion, margin improvement and operating cost control.
Company PerformanceWhile Valero faced a challenging margin environment through much of the year, Valero’s 2019 achievements and operationalperformance demonstrated sustained excellence in several key areas.
OPERATIONAL AND SAFETY PERFORMANCE DRIVES PROFITABILITY
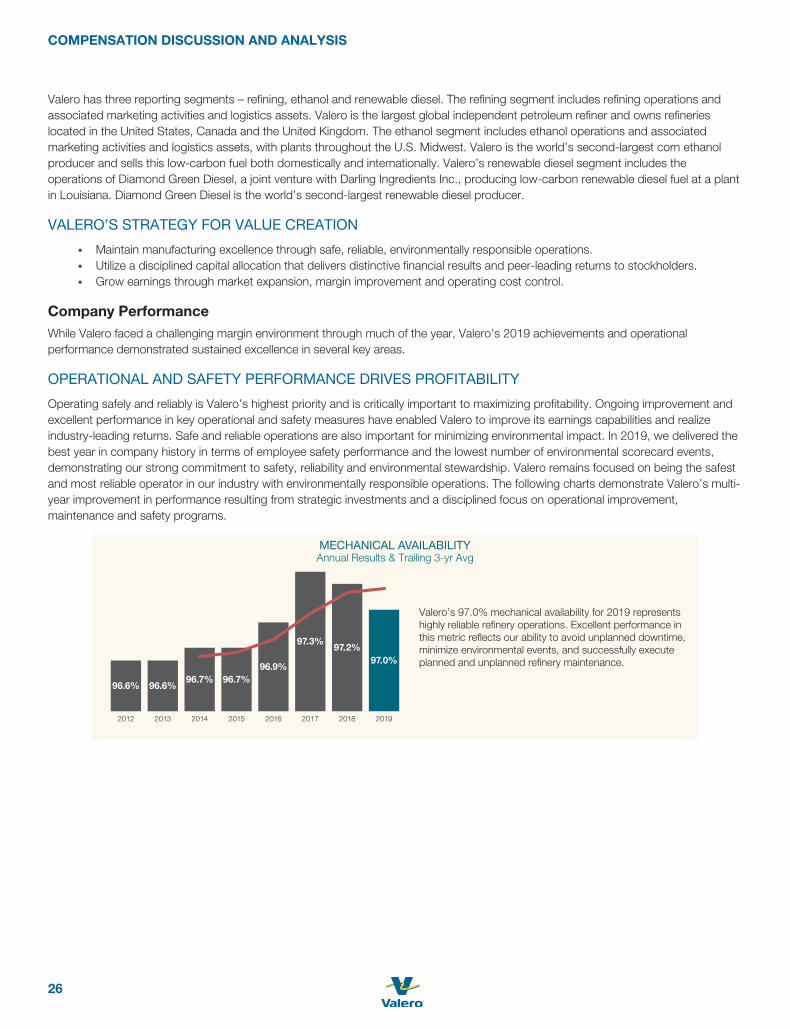
Operating safely and reliably is Valero’s highest priority and is critically important to maximizing profitability. Ongoing improvement andexcellent performance in key operational and safety measures have enabled Valero to improve its earnings capabilities and realizeindustry-leading returns. Safe and reliable operations are also important for minimizing environmental impact. In 2019, we delivered thebest year in company history in terms of employee safety performance and the lowest number of environmental scorecard events,demonstrating our strong commitment to safety, reliability and environmental stewardship. Valero remains focused on being the safestand most reliable operator in our industry with environmentally responsible operations. The following charts demonstrate Valero’s multi-year improvement in performance resulting from strategic investments and a disciplined focus on operational improvement,maintenance and safety programs.
MECHANICAL AVAILABILITY
Valero’s 97.0% mechanical availability for 2019 representshighly reliable refinery operations. Excellent performance inthis metric reflects our ability to avoid unplanned downtime,minimize environmental events, and successfully executeplanned and unplanned refinery maintenance.
2012 2013 2014 2015 2016
96.6% 96.6%96.7% 96.7%
96.9%
97.3%
97.0%97.2%
2017 20192018
Annual Results & Trailing 3-yr Avg
26

COMPENSATION DISCUSSION AND ANALYSIS
PERSONNEL SAFETY
Total Recordable Incident Rate (TRIR)
2017201620152014201320122011
Employees Contractors Industry
0.90
2010 20192018
0.40
0.23 0.
39
In 2019, Valero achieved best-everemployee safety performance
TIER 1 PROCESS SAFETY(Process Safety Event Rate, Three-year Rolling Averages of Process Safety Events
per 200,000 Working Hours)
Valero once again achieved excellent resultsin process safety (0.05 for full-year 2019), whichhas been imperative for environmentally responsibleand safe operations. A Tier 1 Process SafetyEvent represents an unplanned release ofmaterials (hazardous or non-hazardous) that mayresult in a safety and/or environmental incident.
2010 2011 2012 2013 2014 2015 2016
0.07%
2017 20192018
63% reduction in Tier 1 ProcessSafety Events since 2010
0.19%
2020 PROXY STATEMENT 27

COMPENSATION DISCUSSION AND ANALYSIS
Valero seeks to be the leader among its peers in stockholder returns and makes operational and capital allocation decisions in supportof this objective. Through targeted share buybacks and sustainable dividend growth, Valero has prioritized the delivery of cash returnsto stockholders.
ANNUAL DIVIDEND PER SHARE AND WEIGHTED AVERAGE SHARESOUTSTANDING AS PERCENTAGE RELATIVE TO 2011
WASO
Dividend/share
2011 2012 2013 2014 2015 2016 2018 2020*20192017
$0.65$0.30$1.05
$1.70
$2.40
$3.92$3.60
$3.20$2.80
98%96% 93%
88%81% 78%
$0.85
570 million shares
414 million shares75% 73%
* 2020 dividends per share annualized based on most recent quarterly dividend.
As a result of Valero’s performance and capital allocation decisions implemented under the current leadership team, Valero’s TotalStockholder Return1 (TSR) has outperformed the Dow Jones Index, S&P 500 Index, and all companies within the XLE2 energy indexconstituency since 2014.
TOTAL STOCKHOLDER RETURN(Under Current Leadership Team)
Dec
-14
Dec
-15
Dec
-16
Dec
-17
Dec
-19
Dec
-18
185
-100
%
VLO
XLE Range
VLO +128%Dow Jones Index +81%S&P 500 Index +74%XLE -9%XLE Constituents Min -59%
Footnotes:
(1) TSR from Dec 31, 2014, through Dec 31, 2019. TSR includes stock price appreciation and dividends paid.(2) XLE includes refining peers PSX, MPC and 28 other energy companies.
28

COMPENSATION DISCUSSION AND ANALYSIS
Company Performance Highlights—2019
FINANCIALACHIEVEMENTS
• Achieved $2.4 billion in net income attributable to Valero Energy Corporation stockholders• Returned $2.3 billion to stockholders through dividends and share repurchases• Increased quarterly dividend by 12.5% (from $0.80 to $0.90 per share)• Maintained our investment-grade credit ratings• Maintained one of the lowest debt to capitalization ratios within peer group
OPERATIONALACHIEVEMENTS
•
maximize margin captureAchieved excellent refinery Mechanical Availability results (97.0%) allowing us to
• Achieved best-ever performance in three of our critical safety and environmentalmetrics
• Continued cost-savings efforts to increase our cumulative savings since initiationof the program in 2007 to $2.04 billion
STRATEGIC & OTHER ACHIEVEMENTS
• Completed and started an alkylation unit at our Houston refinery for increasedmargin capture
• Completed the Central Texas Pipelines and Terminals project which reducessecondary costs and extends our supply chain from the Gulf coast
• Recognized by S&P Global Platts with the “Award of Excellence - Refining”•
•
Recognized by Institutional Investor magazine for “Best CEO” and “BestInvestor Relations Department” in our industry for the fourth year in a rowSimplified corporate structure through the buy-in of Valero Energy Partners LP(VLP)
• Published inaugural Stewardship and Responsibility Report, which describes ourEnvironmental, Social and Governance (ESG) strategies and accomplishments
Alignment of Executive Pay to Company Performance
Valero’s executive pay program is designed to reward executives for superior company performance. The program design emphasizesvariable incentive pay (delivered through annual and long-term incentives) such that an executive’s ultimate realizable pay is significantlydependent upon the achievement of both absolute and relative performance measures.
For purposes of describing the executive compensation programs as administered in 2019, this Compensation Discussion andAnalysis references the officer positions held during 2019 for R. Lane Riggs (who served as EVP and Chief Operating Officer) andGary K. Simmons (who served as SVP Supply, International Operations and Systems Optimization). Mr. Riggs and Mr. Simmons wereeach elected to new roles on Jan. 23, 2020 as more fully described under the caption, “Identification of Executive Officers.”
VALERO’S COMPENSATION PHILOSOPHY
Tightly link company performance and executive pay
Align the interests of executives and stockholders
Manage risk and adopt best practices in executive pay
Balance compensation over short- and long-term
Facilitate retention of top executive talent
2020 PROXY STATEMENT 29

COMPENSATION DISCUSSION AND ANALYSIS
ELEMENTS OF EXECUTIVE COMPENSATION—SUMMARY
The primary elements of our 2019 executive compensation program are summarized in the table below.
Element Form Key Characteristics
Base Salary Cash
• Takes into consideration scope and complexity of therole, peer market data, experience of the incumbent,and individual performance
• Aligned with competitive practices in order to supportrecruitment and retention of top talent
Annual Bonus Plan Performance-Based Cash
• Variable component of annual pay focused onachievement of short-term annual financial, operationaland strategic objectives that are critical drivers for safeand reliable operations, returns to stockholders, and thedisciplined use of capital
Long-termIncentive Program
Performance Shares(50%)
• Measures relative Total Shareholder Return (TSR)against ten-company Performance Peer group across athree-year period
• Incentivizes stockholder returns• Value delivered is driven by performance relative to
relevant peers in industry
Restricted Stock(50%)
• Vests 1/3 per year over three years• Value delivered is driven by absolute performance of
company stock• Aids in retention of critical talent
� Fixed � Variable
Target Total Pay
Valero’s Compensation Committee administers executive compensation such that each executive’s Target Total Pay is within areasonable range of the most recently-available role-specific market data provided by the Committee’s independent executivecompensation consultant. Target Total Pay represents in aggregate the three primary elements of our executive compensationprogram as listed and summarized in the prior table (Salary, Annual Incentive Bonus, and Long-term Incentives). Each element isadministered independently with reference to competitive market data and with consideration of other factors as discussed further inCompensation Discussion and Analysis under the heading, “Benchmarking Competitive Pay Levels.” Target Total Pay for 2019 for ournamed executive officers is listed in the table below.
Salary ($)
Target AnnualIncentive Bonus
($) (1)
Target Long-term Incentives(Stock Awards)
($) (2)Target Total Pay
($)
Gorder CEO 1,745,000 2,792,000 10,990,000 15,527,000
Titzman CFO 725,000 580,000 2,500,000 3,805,000
Riggs COO 840,000 840,000 3,360,000 (3) 5,040,000
Fraser General Counsel 600,000 480,000 2,250,000 3,330,000
Simmons SVP 650,000 422,500 1,500,000 2,572,500
Footnotes:
(1) Represents Salary multiplied by the executive’s target bonus percentage as described below under the heading, “Annual Incentive Bonus.”(2) Represents Salary multiplied by the executive’s target long-term incentive percentage as described below under the heading, “Long Term
Incentive Awards.”(3) Excludes a $1 million restricted stock award associated with the Long-Term Incentive Agreement with Mr. Riggs as described below under the
heading, “Long Term Incentive Awards.”
30

COMPENSATION DISCUSSION AND ANALYSIS
The total compensation for each executive as disclosed in the Summary Compensation Table in this proxy differs from the Target TotalPay as listed in the preceding table primarily due to the following factors.
• The Target Total Pay excludes values associated with certain retirement benefits that are included in the SummaryCompensation Table and which can increase or decrease significantly year-to-year due to actuarial assumptions and otherfactors (see the “Change in Pension Value and Non-qualified Deferred Compensation Earnings” column of the SummaryCompensation Table and related footnotes). Also excluded are the “Other Compensation” perquisites and benefits disclosedin the Summary Compensation Table.
• The values disclosed in the Summary Compensation Table for long-term incentives are calculated in accordance with SECdisclosure requirements and can differ substantially from the values calculated for Target Total Pay, which are used foradministering compensation decisions. Most notably, the disclosed values for performance shares in the SummaryCompensation Table represent three different tranches from three unique awards (granted in 2017, 2018, and 2019) whichinclude adjustments for predicted performance (see footnote (2) of the Summary Compensation Table for further details),whereas the value of performance shares in Target Total Pay represents the full 2019 award grant which was administeredbased on the average closing stock price for the 15 trading days ending the day before the grant. For example, in 2019 thevalue disclosed for performance shares within the long-term incentive column of the Summary Compensation Table forMr. Gorder was $3.1 million higher than the comparable Target Total Pay value as administered by the CompensationCommittee ($8.58 million versus $5.49 million). Refer to the “Grants of Plan-based Awards” tables and associated footnotesin this proxy statement for more detailed information regarding the 2019 long-term incentive grants.
Other factors contributing to differences between the disclosed values in the Summary Compensation Table and the values shownwithin Target Total Pay include the actual annual bonus amount paid versus the target annual bonus value (as discussed further belowunder the caption, "Annual Incentive Bonus") and, for restricted stock grants, the difference between the stock price associated withthe grant date fair value of the award (as required for the Summary Compensation Table disclosure) and the stock price used todetermine the number of restricted shares granted in order to achieve the target value (average closing stock price for 15 days prior togrant as described previously).
$0.00
$2.00
$4.00
$6.00
$8.00
$10.00
$12.00
$14.00
$16.00
2017 2018 2019
CEO Pay ($ mill)
Salary Bonus Long-term Incentives
$0.00
$0.50
$1.00
$1.50
$2.00
$2.50
$3.00
$4.00
$3.50
2017 2018 2019
Avg of other NEOs ($ mill)
Salary Bonus Long-term Incentives
EXECUTIVE PAY IN SUMMARY
The following charts summarize year over year changes to Target Total Pay* from 2017 through 2019 for our CEO and our four otherNamed Executive Officers (shown in average).
$1.59 $1.66 $1.74
$2.38 $2.66 $2.79
$9.64$10.09
$10.99
$0.71 $0.68 $0.70
$0.62 $0.53 $0.58
$1.92$1.55
$2.40
* Base salary plus target bonus plus target long-term incentives value.
Target Total Pay increased from 2018 to 2019 for the CEO and the four other Named Executive Officers (NEOs). The decrease inaverage NEO pay in 2018 was due to a CFO transition.
2020 PROXY STATEMENT 31
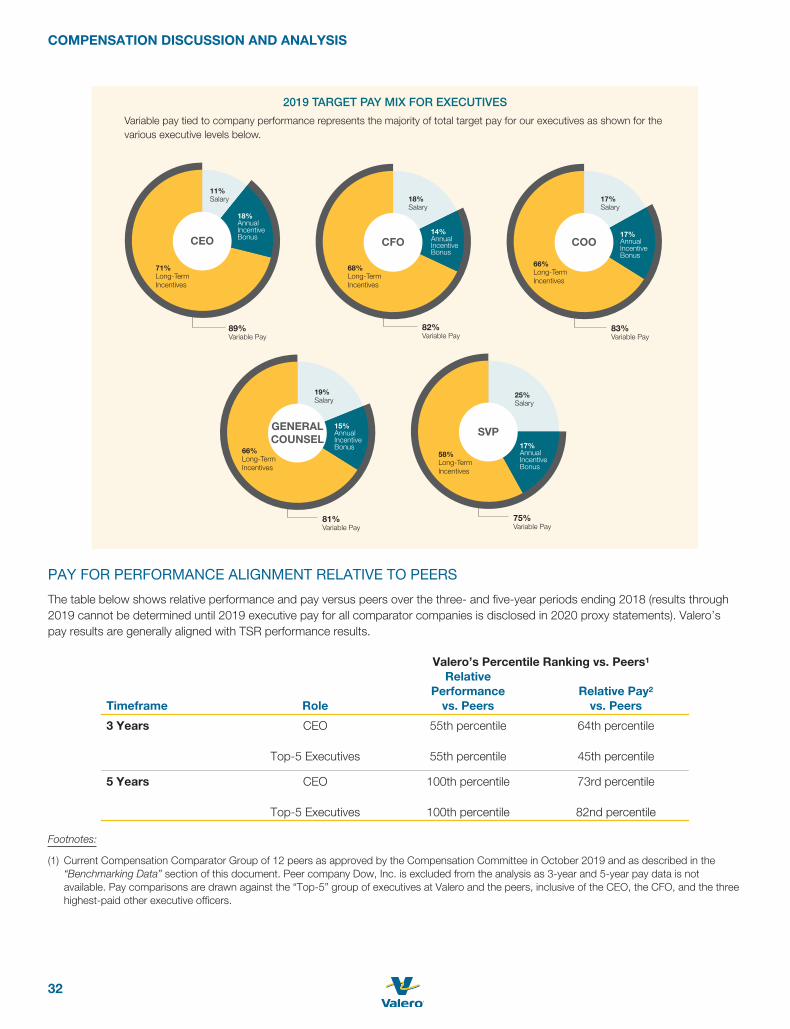
COMPENSATION DISCUSSION AND ANALYSIS
89%Variable Pay
82%Variable Pay
83%Variable Pay
81%Variable Pay
75%Variable Pay
2019 TARGET PAY MIX FOR EXECUTIVES
Variable pay tied to company performance represents the majority of total target pay for our executives as shown for the various executive levels below.
CEO
11%Salary
18%AnnualIncentiveBonus
71%Long-TermIncentives
CFO
18%Salary
14%
68%Long-TermIncentives
COO
17%Salary
66%Long-TermIncentives
19%Salary
15%SVP
25%Salary
58%Long-TermIncentives
AnnualIncentiveBonus
17%AnnualIncentiveBonus
GENERALCOUNSEL
AnnualIncentiveBonus 17%
AnnualIncentiveBonus
66%Long-TermIncentives
PAY FOR PERFORMANCE ALIGNMENT RELATIVE TO PEERS
The table below shows relative performance and pay versus peers over the three- and five-year periods ending 2018 (results through2019 cannot be determined until 2019 executive pay for all comparator companies is disclosed in 2020 proxy statements). Valero’spay results are generally aligned with TSR performance results.
Valero’s Percentile Ranking vs. Peers1
Timeframe Role
RelativePerformance
vs. PeersRelative Pay2
vs. Peers
3 Years CEO 55th percentile 64th percentile
Top-5 Executives 55th percentile 45th percentile
5 Years CEO 100th percentile 73rd percentile
Top-5 Executives 100th percentile 82nd percentile
Footnotes:
(1) Current Compensation Comparator Group of 12 peers as approved by the Compensation Committee in October 2019 and as described in the“Benchmarking Data” section of this document. Peer company Dow, Inc. is excluded from the analysis as 3-year and 5-year pay data is notavailable. Pay comparisons are drawn against the “Top-5” group of executives at Valero and the peers, inclusive of the CEO, the CFO, and the threehighest-paid other executive officers.
32

COMPENSATION DISCUSSION AND ANALYSIS
Footnotes (cont.):
(2) Represents “realizable” pay as reported in company annual proxy statements and includes: salaries; annual bonuses earned; long-term incentiveawards that have vested or been exercised; the increase/decrease in long-term incentive awards that are still outstanding; and one-off payments likeseverance to outgoing executives and sign-on awards for incoming executives.
The chart below illustrates the CEO three-year relationship between relative pay and relative performance versus the peers through2018 (referenced in the preceding table).
3-YEAR CUMULATIVE REALIZABLE COMPENSATION PERCENTILE VS.CUMULATIVE TOTAL SHAREHOLDER RETURN PERCENTILE
(1/1/16 – 12/31/18)
0% 10% 20% 30% 40% 50% 60% 70% 80% 90% 100%
10%
20%
30%
40%
50%
60%
70%
80%
90%
100%
Total Shareholder Return Percentile
Rea
lizab
le C
ompe
nsat
ion
Per
cent
ile
HollyFrontier
EOG Resources
Exxon Mobil
General Motors
Halliburton
Marathon Petroleum
Occidental Petroleum
Valero Energy*
Phillips 66
Chevron
ConocoPhillips
Ford Motor
ShareholderReturns
Exceed CompensationDelivery
CompensationDeliveryExceeds
Shareholder Returns
Pay forPerformance
Aligned
* Three-year pay history reflects Mr. Gorder’s realizable pay during this period.
Compensation Discussion and Analysis—Detail
Adoption of Compensation Governance Best PracticesWe use executive pay arrangements that are commonly recognized as best practices. Our executive pay program includes theseleading practices.
PAY FOR PERFORMANCE
• Incentive compensation (annual bonus and long-term incentives) represents the majority (ranging from 75 percent to89 percent) of the targeted direct compensation of our named executive officers.
• We target 50 percent of the long-term incentive value granted to our named executive officers to be awarded in the form ofperformance shares tied to relative TSR performance.
2020 PROXY STATEMENT 33

COMPENSATION DISCUSSION AND ANALYSIS
STOCKHOLDER ALIGNMENT
• We use multiple performance metrics to motivate achievements that complement one another and that contribute to the long-term creation of stockholder value.
• Our executive officers and directors are subject to meaningful stock ownership guidelines.• We engage in stockholder outreach to solicit the input of stockholders to our pay programs (including participation by the
chair of our Compensation Committee).
PROGRAM DESIGN
• Incentives are balanced between absolute performance goals (rewarding the achievement of pre-established goals) andrelative measures (linking the incentives to surpassing the performance of our peers).
• We have maximum payout ceilings on both our annual bonus opportunities and our performance shares.• Our executive pay programs include design features that mitigate against the risk of inappropriate behaviors.
PAY BENCHMARKING
• Valero’s revenues and market capitalization are within a reasonable range of the median revenues and market capitalization ofthe peer group of companies within our industry against which we benchmark our executives’ pay, reflecting that we makepay comparisons in a size-appropriate fashion.
• We benchmark against the median pay levels of the peer group for each of base pay, annual bonus, long-term incentives,and total target pay.
AVOID PROBLEMATIC PAY PRACTICES
• We have eliminated all change-in-control gross-ups for potential parachute excise taxes and maintain a policy against theimplementation of change-in-control arrangements that contain gross-ups.
• We have a policy stipulating that grants of performance shares contain “double trigger” terms and conditions for vesting in achange-of-control context such that performance shares will vest on a partial, pro rata basis following termination ofemployment (rather than vesting automatically in full upon the change of control).
• Our long-term incentive program mandates that stock options cannot be re-priced without stockholder approval.• Our executive officers and directors are prohibited from pledging shares of Common Stock as collateral or security for
indebtedness, and may not purchase, sell, or write calls, puts, or other options or derivative instruments that are designed tohedge or offset any decrease in the market value of our Common Stock.
• We have a “clawback” policy requiring the return of incentive payments in certain restatement situations.
STRONG GOVERNANCE
• Our Compensation Committee is composed entirely of directors who meet the independence requirements of the SEC andNYSE as well as pertinent tax requirements for preserving the deductibility of executive pay.
• Our Compensation Committee retains the services of an independent executive compensation consultant that providesservices directly to the Committee.
• We conduct an annual say-on-pay vote as recommended by our stockholders.• We have a declassified board of directors; all of our directors stand for re-election each year.• Our Board has approved a limitation on the amount of equity compensation that may be paid to our non-employee directors
in any year.• We have ten independent directors who serve on three fully independent committees.• Five of the ten independent directors represent diversity of ethnicity or gender (including three women).• Our Bylaws grant proxy access to our stockholders.• Our Bylaws permit stockholders to call special meetings of stockholders.
Dialogue With StockholdersValero’s strong corporate governance principles, implemented under the guidance of the Board, are a major driving force inencouraging constructive dialogue with stockholders and other stakeholders. Valero’s senior management team reaches out tostockholders for dialogue concerning our compensation programs and other matters of concern to our stockholders. Our stockholderoutreach efforts have been constructive and have provided management with insight on executive compensation issues and othermatters that are important to our stockholders.
34

COMPENSATION DISCUSSION AND ANALYSIS
We carefully consider the results of the most recent stockholder advisory vote on executive compensation (say-on-pay). As part of ourdialogue with stockholders, we determine how the stockholders have voted on our say-on-pay proposals, and we discuss any issuesof concern. Certain members of our board of directors, including the chairs of our Compensation Committee and Nominating/Governance and Public Policy Committee have participated in this outreach.
Our engagements with stockholders have provided management with the opportunity to review our executive compensation practicesand explain the principles on which they were designed. Input from our stockholders through these engagements was considered bythe Compensation Committee when establishing Valero’s 2020 executive compensation programs, which will include the followingchanges.
• Within the 2020 Annual Incentive Bonus program, the Strategic segment includes an expanded array of strategic initiativesand projects, which will be assessed annually. Included are financial, operational, organizational and ESG-related initiatives,which contribute to the overall success of the company during the year and support the company’s long-term strategy. Thechange is more fully described under the caption, “Annual Incentive Bonus.”
• The 2020 Performance Shares component of the Long-term Incentives program has been expanded to include a returns-based performance measure (Return on Invested Capital) in addition to continued utilization of a relative TSR performancemeasure. The change is more fully described under the caption, “Long-term Incentive Awards.”
Our engagement process is described further in this proxy statement in the “Stockholder Engagement” section.
Administration of Executive Compensation ProgramsOur executive compensation programs are administered by our Board’s Compensation Committee. The Committee is composed ofthree independent directors from our Board. They do not participate in our executive compensation programs. Policies adopted by theCommittee are implemented by our compensation and benefits staff. In 2019, the Committee retained Exequity LLP as an independentcompensation consultant for executive and director compensation matters. The nature and scope of the consultant’s services aredescribed below under the caption, “Compensation Consultant Disclosures.”
BENCHMARKING DATA
The Compensation Committee uses peer group compensation data to assess benchmarks of base salary, annual incentivecompensation, and long-term incentive compensation. The Committee uses the Compensation Comparator Group (further describedbelow) to benchmark compensation for our named executive officers. This reference is sometimes referred to in this proxy statementas “compensation survey data” or “competitive survey data.”
Compensation Comparator Group
The Compensation Comparator Group (applicable to 2019 salary and bonus decisions) comprises the following companies thatengage in U.S. domestic oil and gas operations:
BP p.l.c. Marathon Oil CorporationChevron Corporation Marathon Petroleum CorporationExxon Mobil Corporation Murphy Oil CorporationHess Corporation Phillips 66HollyFrontier Corporation Royal Dutch Shell plc
The Compensation Comparator Group is relevant to our business because we compete with the member companies for talent at everylevel from entry-level employees to senior executives. We believe that our pay comparisons are size-appropriate because the medianrevenues and market capitalization of the Compensation Comparator Group are both within a reasonable range of Valero’s revenuesand market capitalization for the period covered in the pay study. Both were below Valero’s revenues and market capitalization. Ourunderstanding of this group’s compensation programs and levels is vitally important in order to remain competitive in the market foremployee talent.
Given Valero’s size and complexity, our employees at all levels would be qualified candidates for similar jobs at any of the companiesincluded in this group. The Compensation Comparator Group was approved by the Compensation Committee in October 2018 when2019 executive pay levels were initially considered and established according to the annual pay review process as described furtherunder the caption, “Process and Timing of Compensation Decisions.”
2020 PROXY STATEMENT 35
COMPENSATION DISCUSSION AND ANALYSIS
In October 2019, the Compensation Committee considered and approved changes to the Compensation Comparator Group, whichwas utilized in establishing 2019 LTI targets and awards as described further under the caption, “Long-term Incentive Awards.” TheCompensation Committee established the new group after considering (i) companies with geographic proximity to Valero;(ii) companies within an appropriate and comparable size based on revenues and market capitalization, (iii) companies generallyemploying typical U.S.-based approaches to executive pay; and (iv) companies outside of the oil and gas industry that have similarorganizational complexity, operational scope, and that perform similarly to Valero.
Changes to the Compensation Comparator Group include the elimination of BP p.l.c., Royal Dutch Shell plc, Hess Corporation,Marathon Oil Corporation, and Murphy Oil Corporation; the addition of ConocoPhillips, EOG Resources, Inc., Halliburton Company,Occidental Petroleum Corporation, Dow Inc., Ford Motor Company, and General Motors Company. Marathon Petroleum Corporation,Phillips 66, Chevron Corporation, Exxon Mobil Corporation, and HollyFrontier Corporation were retained as peer companies.
Our compensation and benefits staff, under supervision of the Compensation Committee, develops recommendations for base salary,bonuses, and other compensation arrangements using the compensation survey data with assistance from Exequity. Our use of thedata is consistent with our philosophy of providing executive compensation and benefits that are competitive with companies that wecompete with for executive talent. In addition, the competitive compensation survey data and analyses assist the CompensationCommittee in assessing our pay levels and targets relative to companies in the Compensation Comparator Group. See “Elements ofExecutive Compensation—Benchmarking Competitive Pay Levels.”
Performance Peer Group
We also use a peer group for purposes of determining the relative performance of Valero’s total stockholder return (TSR). We use thisrelative TSR metric in our performance shares incentive program. The 2019 performance peer group was selected based on themembers’ engagement in U.S. domestic refining and marketing operations or due to the members’ strong stock price correlation toValero.
Our use of different peer groups for compensation and performance is based on our belief that when measuring businessperformance, companies with a similar business model should be included. But we also recognize that comparing the performance ofValero’s generally non-integrated operations with those of upstream and integrated oil companies can result in anomalies due to themismatch in how similar industry-specific events can impact companies with these varying business models. In addition, there arerelatively few companies in our business against which clear comparisons can be drawn, rendering a peer group composition morechallenging than in most industries.
In October 2019, the Compensation Committee established a peer group for TSR measurement applicable to the 2019 awards ofperformance shares (which have TSR measurement periods ending in 2020, 2021, and 2022). Removed from the peer group for the2019 awards were BP p.l.c. and Royal Dutch Shell plc, while ConocoPhillips, EOG Resources, Inc., and Occidental PetroleumCorporation were added. Also added was the Energy Select Sector SPDR Fund (XLE) index, which includes 30 energy companies andserves as a proxy for stock price performance of the energy sector and includes companies with which we compete for capital. Thechange in the index price across the designated performance periods will be measured as TSR. The Compensation Committeebelieves that the revised performance peer group represents an improved group of companies for making head-to-head performancecomparisons in a competitive operating environment that is primarily characterized by US-based downstream refining operations.Valero is included in this peer group when results are calculated. In addition to Valero, the performance peer group for the 2019awards is composed of the following 10 members.
ConocoPhillips Marathon Petroleum CorporationCVR Energy Inc. Occidental Petroleum CorporationDelek US Holdings PBF Energy Inc.EOG Resources, Inc. Phillips 66HollyFrontier Corporation Energy Select Sector SPDR Fund (XLE)
PROCESS AND TIMING OF COMPENSATION DECISIONS
The Compensation Committee has reviewed and approved all compensation targets and payments for the named executive officerseach year in conjunction with Valero’s annual strategic planning meeting (October or November). The Chief Executive Officer evaluatesthe performance of the other executive officers and develops individual recommendations based upon the competitive survey data. TheChief Executive Officer and the Committee may make adjustments to the recommended compensation based upon an assessment ofan individual’s performance and contributions to Valero. The compensation for the Chief Executive Officer is reviewed by theCompensation Committee and recommended to the Board’s independent directors for approval. This assessment is based on the
36

COMPENSATION DISCUSSION AND ANALYSIS
competitive survey data and other factors described in this Compensation Discussion and Analysis, and adjustments may be madebased upon the independent directors’ evaluation of the Chief Executive Officer’s performance and contributions.
We evaluate the total compensation opportunity offered to each executive officer at least once annually. The Compensation Committeeestablishes the target levels of annual incentive and long-term incentive compensation for the current fiscal year based upon its reviewof competitive market data provided by Exequity. The Compensation Committee also reviews competitive market data for annual salaryrates for executive officer positions for the next fiscal year and recommends new salary rates to become effective the next fiscal year.The Compensation Committee may, however, review salaries or grant long-term incentive awards at other times during the yearbecause of new appointments or promotions. Our Compensation Committee does not time the grants of long-term incentive awardsaround Valero’s release of undisclosed material information.
In January 2020 the Compensation Committee approved a change to the timing of the annual grant of long-term incentive awards toexecutive officers. In 2019 and prior years, annual grants were administered in the fourth quarter in conjunction with the annual reviewof executive compensation. Beginning in 2020, annual grants of long-term incentive awards are now administered in the first quarter tobetter align with market practices and to more closely coincide with base salary changes, which typically occur effective January 1. The2020 annual long-term incentive awards for executive officers were administered in February 2020.
Elements of Executive CompensationOur executive compensation programs include the following material elements:
ANNUALINCENTIVE BONUS
LONG-TERMEQUITY-BASED
INCENTIVES
MEDICAL& INSURANCE
BENEFITS
RETIREMENTBENEFITS
BASESALARY
We chose these elements to foster the potential for both current and long-term compensation opportunities and to attract and retainexecutive talent. We believe that variable pay (i.e., annual incentive bonus and long-term equity-based incentives that do not become apermanent part of base salary)—when delivered through appropriate incentives—is ultimately the best way to drive total compensationamong our executive officers.
We believe that a significant portion of the compensation paid to our named executive officers should be incentive-based anddetermined by both company and individual performance. Our executive compensation program is designed to accomplish thefollowing long-term objectives:
• to provide compensation payouts that are tied to the performance of internal and external metrics both on a relative andabsolute basis;
• to align executives’ pay opportunities with stockholder value creation; and• to attract, motivate, and retain the best executive talent in our industry.
We believe that superior performance is motivated when an executive’s earn-out of his or her full compensation opportunities iscontingent on achieving performance results that exceed pre-established goals and/or outperforming our industry peers.
Our annual incentive program rewards are tied to:
• Valero’s attainment of key financial performance measures;• Valero’s success in key operational and strategic measures;• safe operations;• environmental stewardship;• reliable operations; and• cost management.
2020 PROXY STATEMENT 37

COMPENSATION DISCUSSION AND ANALYSIS
Our long-term equity incentive awards are designed to tie executives’ financial reward opportunities with increased stockholder valuecreation as measured by:
• long-term stock price performance (both absolute and relative to our peer group); and• payment of regular dividends.
Base salary is designed to provide a fixed level of competitive pay that reflects the executive officer’s primary duties and responsibilities,and to provide a base upon which incentive opportunities and benefit levels are established.
The long-term incentive awards in our compensation program include performance shares and restricted stock. We believe thatincentives that drive stockholder value should also drive executive officer pay. We note that performance shares, when issued, do notassure a payout to the executive officer unless and until stockholder value is created through both company performance and TSRrelative to our peers. We also believe that executive officers should hold an equity stake in the company to further motivate the creationof stockholder value, which is why we include awards of restricted stock in our long-term incentive program coupled with stockownership guidelines.
BENCHMARKING COMPETITIVE PAY LEVELS
Our Compensation Committee benchmarks base salaries for our named executive officers against the 50th percentile (median) ofcompetitive survey data and may make decisions to pay above or below this target based on individual circumstances (e.g.,performance of the executive, internal parity, and management succession planning).
We also benchmark annual bonus, long-term incentive targets (expressed as a percentage of base salary), and total targeted pay foreach executive position by reference to the 50th percentile (median) benchmark of the Compensation Comparator Group, and maymake decisions to award above or below these targets based on individual circumstances (e.g., performance of the executive, internalparity, and management succession planning). Preserving flexibility to award incentive opportunities above or below the median peerlevels helps tailor the incentives to the executive and the role, resulting in a more customized match of competitive pay opportunitiesand pay-for-performance design attributes.
In addition to benchmarking competitive pay levels to establish compensation levels and targets, we also consider the relativeimportance of a particular management position in comparison to other management positions in the organization. In this regard, whensetting the level and targets for compensation for a particular position, we evaluate that position’s scope and nature of responsibilities,size of business unit, complexity of duties and responsibilities, as well as that position’s relationship to managerial authoritiesthroughout the management ranks of Valero.
RELATIVE SIZE OF MAJOR COMPENSATION ELEMENTS
An executive officer’s Total Target Pay is structured so that realizing the targeted amount is highly contingent on Valero’s performancedue to the executive’s level of at-risk pay. We use the term “Total Target Pay” to refer to the sum of an executive’s base salary,targeted incentive bonus, and the target values of long-term incentive awards.
38
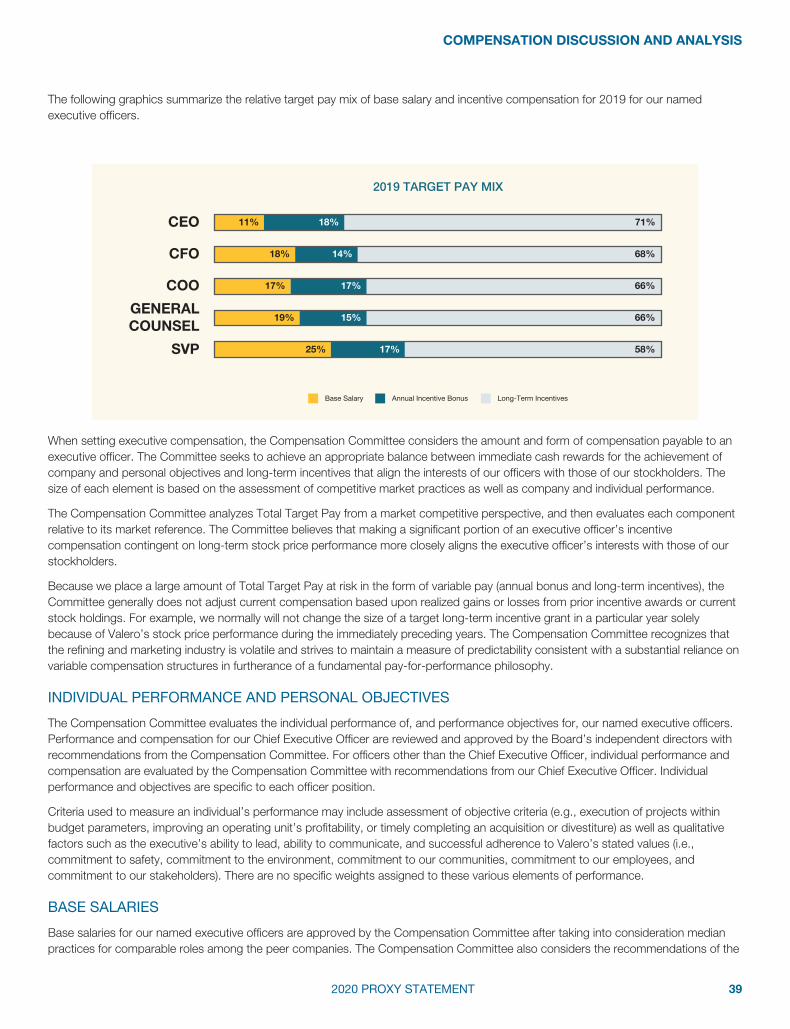
COMPENSATION DISCUSSION AND ANALYSIS
The following graphics summarize the relative target pay mix of base salary and incentive compensation for 2019 for our namedexecutive officers.
2019 TARGET PAY MIX
17% 17% 66%
19% 15% 66%
18% 14% 68%
25% 17% 58%
11% 18% 71%CEO
CFO
COO
GENERALCOUNSEL
SVP
Base Salary Annual Incentive Bonus Long-Term Incentives
When setting executive compensation, the Compensation Committee considers the amount and form of compensation payable to anexecutive officer. The Committee seeks to achieve an appropriate balance between immediate cash rewards for the achievement ofcompany and personal objectives and long-term incentives that align the interests of our officers with those of our stockholders. Thesize of each element is based on the assessment of competitive market practices as well as company and individual performance.
The Compensation Committee analyzes Total Target Pay from a market competitive perspective, and then evaluates each componentrelative to its market reference. The Committee believes that making a significant portion of an executive officer’s incentivecompensation contingent on long-term stock price performance more closely aligns the executive officer’s interests with those of ourstockholders.
Because we place a large amount of Total Target Pay at risk in the form of variable pay (annual bonus and long-term incentives), theCommittee generally does not adjust current compensation based upon realized gains or losses from prior incentive awards or currentstock holdings. For example, we normally will not change the size of a target long-term incentive grant in a particular year solelybecause of Valero’s stock price performance during the immediately preceding years. The Compensation Committee recognizes thatthe refining and marketing industry is volatile and strives to maintain a measure of predictability consistent with a substantial reliance onvariable compensation structures in furtherance of a fundamental pay-for-performance philosophy.
INDIVIDUAL PERFORMANCE AND PERSONAL OBJECTIVES
The Compensation Committee evaluates the individual performance of, and performance objectives for, our named executive officers.Performance and compensation for our Chief Executive Officer are reviewed and approved by the Board’s independent directors withrecommendations from the Compensation Committee. For officers other than the Chief Executive Officer, individual performance andcompensation are evaluated by the Compensation Committee with recommendations from our Chief Executive Officer. Individualperformance and objectives are specific to each officer position.
Criteria used to measure an individual’s performance may include assessment of objective criteria (e.g., execution of projects withinbudget parameters, improving an operating unit’s profitability, or timely completing an acquisition or divestiture) as well as qualitativefactors such as the executive’s ability to lead, ability to communicate, and successful adherence to Valero’s stated values (i.e.,commitment to safety, commitment to the environment, commitment to our communities, commitment to our employees, andcommitment to our stakeholders). There are no specific weights assigned to these various elements of performance.
BASE SALARIES
Base salaries for our named executive officers are approved by the Compensation Committee after taking into consideration medianpractices for comparable roles among the peer companies. The Compensation Committee also considers the recommendations of the
2020 PROXY STATEMENT 39
COMPENSATION DISCUSSION AND ANALYSIS
Chief Executive Officer for officers other than the Chief Executive Officer. The base salary and all other compensation of the ChiefExecutive Officer are reviewed and approved by the independent directors of the Board.
Base salaries are reviewed annually and may be adjusted to reflect promotions, the assignment of additional responsibilities, individualperformance, or the performance of Valero. Salary changes resulting from the annual review are typically made effective on January 1.Salaries are also periodically adjusted to remain competitive with companies within the compensation survey data. An executive’scompensation typically increases in relation to his or her responsibilities within Valero.
ANNUAL INCENTIVE BONUS
We believe that the achievement of short-term financial and operational performance objectives is critical to creating long-termstockholder value. The annual incentive bonus is designed to incentivize executives to achieve industry-leading results as reflectedthrough business-critical financial, operational, and strategic performance measures. We continue as the premier operator in the fuelsmanufacturing and marketing industry through disciplined execution of our strategic plan and daily focus on operational excellence byour employees and management team. The annual incentive bonus design guides and incentivizes this daily focus with particularemphasis on ensuring safety and protection of our employees, contractors and communities. Our additional focus on operating ourplants reliably at the lowest cost allows us to maximize profitability in all margin environments.
The Compensation Committee considers the following to determine bonuses for each officer:
• the position of the named executive officer, which is used to determine a targeted percentage of base salary that may beawarded as incentive bonus;
• pre-established performance objectives that include a quantitative financial performance goal (Financial Performance Goal),operational performance goals (Operational Performance Goals), and qualitative goals and objectives including the effectiveuse of capital (Strategic Company Performance Goals) for the completed fiscal year; and
• a qualitative evaluation of the individual’s performance.
Thus, the amount of the bonus ultimately paid to a named executive officer takes into consideration the Compensation Committee’sassessment of Valero’s and each executive’s performance in relation to the pre-established performance goals more fully describedbelow.
Financial Performance Goal
The Financial Performance Goal considered for our annual incentive bonus targets is EPS, adjusted for special items and impairmentsthat are non-recurring and/or not indicative of our core performance. The Compensation Committee establishes minimum, target, andmaximum levels for EPS in the first quarter of the performance year. We believe that this measure appropriately reflects our businessplanning process and corporate philosophy regarding financial performance measurement. Valero’s performance in 2019 was$5.88 per share (versus a target of $6.65 per share). The following table describes the adjustment to Valero’s 2019 EPS for purposesof the 2019 Financial Performance Goal.
Earnings per common share – assuming dilution $ 5.84
Exclude:Loss on early redemption of debt (1) (0.04)
Adjusted EPS for Financial Performance Goal $ 5.88
(1) The penalty and other expenses incurred in connection with the early redemption of our 6.125% senior notes due Feb. 1, 2020 are notassociated with the ongoing costs of our borrowing and financing activities.
Operational Performance Goals
The Operational Performance Goals considered for our annual incentive bonuses, as established and approved by the CompensationCommittee in the first quarter of the performance year, are measured against:
• Valero’s achievements in the areas of health, safety, and environmental stewardship including environmental scorecardincidents, process safety incidents, reportable spills, environmental management system scores, and health & safetymanagement system scores;
• Valero’s achievements in improving refining competitiveness through improved mechanical availability; and• Valero’s achievements in managing refinery operating costs.
40

COMPENSATION DISCUSSION AND ANALYSIS
These Operational Performance Goals are set at levels deemed to be challenging to achieve, but reasonably attainable with strongperformance. We believe that these measures appropriately reflect key business objectives of Valero. After completion of the fiscal year,each of the Operational Performance Goals is measured against Valero’s actual performance in these areas and the minimum, target,and maximum levels established by the Compensation Committee. Valero’s performance score for 2019 for this category was85.30 percent (versus a target score of 40.00 percent). For additional details on Valero’s 2019 performance versus targeted amountsfor our Operational Performance Goals, see the “Annual Incentive Bonus Performance Goals” table that follows in this section.
Strategic Company Performance Goals
Valero’s Strategic Company Performance Goals were established in the first quarter of the 2019 performance year by the ChiefExecutive Officer and approved by the Compensation Committee. Included in these goals for 2019 was a qualitative capital-basedperformance measure assessed by the Compensation Committee through Return on Capital Employed (ROCE) and a qualitativeassessment by the Compensation Committee of cost control initiatives. After completion of the fiscal year, the Strategic CompanyPerformance Goals were evaluated as a whole.
Significant achievements in this area for 2019 included: (i) the creation of long-term stockholder value and the return of cash tostockholders through a quarterly cash dividend increase from $0.80 per share to $0.90 per share and $0.78 billion of common stockrepurchases; (ii) the return of 43% of adjusted net cash provided by operating activities to stockholders through dividends and stockbuybacks which is in line with management’s payout goal; (iii) the successful completion of capital projects to expand our market reachand capture margins including the completion of an alkylation unit at our Houston refinery and of the Central Texas Pipelines andTerminals project; (iv) the successful execution of Valero’s capital expenditures plan, which totaled $2.6 billion for 2019; (v) ROCEachievement of 6.9%; and (vi) identified cost savings and expense management totaling $177 million. Valero’s performance score for2019 for this category was 20.0 percent (versus a target score of 20.0 percent).
In January 2020, the Compensation Committee approved changes to the Strategic Company Performance Goals component of the2020 Annual Incentive Bonus program. This component now includes evaluation by the Compensation Committee of accomplishmentsrelated to a comprehensive array of strategic initiatives and projects (detailed in the table below), which contribute to the overallsuccess of the company during the year and support the company’s long-term strategy.
Strategic Area Initiative/Project/Objective
Returns to Stockholders • Return cash to stockholders through dividends and stock buybacks
Disciplined Use of Capital • Balanced utilization of sustaining and growth capital vs target
Operational Excellence• Execution of capital projects and turnarounds• Margin improvement and market expansion• Cost management and expense control
Organizational Excellence
• Strategic communications• Succession planning and leadership development• Innovation• Public policy
Environmental, Social andGovernance (ESG) Efforts &
Improvement
• Environmental stewardship• Sustainability• Diversity and inclusion• Compliance• Corporate citizenship and community
2020 PROXY STATEMENT 41

COMPENSATION DISCUSSION AND ANALYSIS
Valero’s Achievement of Performance Goals for 2019
The following table details the performance targets and final results of Valero’s achievements in 2019 for each of the sub-componentsof the bonus program’s Financial Performance Goal, Operational Performance Goals, and Strategic Goals.
Annual Incentive Bonus Performance Goals and Achievement
Component Weighting Minimum Target MaximumAchievedin 2019
BonusPercent
Earned (1)
Financial Performance Goal
I. EPS, adjusted ($/share) 40.00% $ 1.66 $ 6.65 $13.30 $5.88 39.78%
Operational
II. Health, Safety, and Environmental (2) 13.33% 0.0% 112.5% 225.0% 221.87% 29.58%
III. Mechanical Availability (3) 13.33% 95.6 96.2 97.6 97.0 25.72%
IV. Refining Cash Operating Expense Management (4)($/EDC)
13.34% $145 $120 $111 $110 30.00%
subtotal 40.00% subtotal 86.30%
Strategic
V. Company Goals and Objectives (5) 20.00% 20.00%
Total 100.00% 145.08%
Footnotes:
(1) Represents performance achieved in 2019 and component percent weighting.
(2) Consists of 14 separately weighted health, safety, and environmental metrics across Valero’s three business units with an aggregated performancescore opportunity ranging from 0% to 225%. Performance measures include environmental scorecard incidents, process safety incidents, reportablespills, environmental management system scores, and health & safety management system scores. Performance “achieved” was at 98.6% ofmaximum.
(3) Using the Mechanical Availability scoring from the industry-standard Solomon Associates survey in which “Target” represents median performance.
(4) Using the Cash Operating Expense per EDC (Equivalent Distillation Capacity) metric as reported in the industry-standard Solomon Associates surveyin which “Target” represents median performance (lower is better).
(5) As established by the Compensation Committee in consultation with the CEO, and includes a qualitative assessment of progress against strategicobjectives, use of capital and cost control initiatives. Performance “achieved” was at maximum. Changes to the Strategic segment for 2020 aredescribed more fully under the caption, “Strategic Company Performance Goals” in this section.
The final 2019 bonus amounts paid to our named executive officers were determined as a function of: (i) Valero’s performance asmeasured against the financial, operational, and strategic performance goals, and (ii) the Committee’s assessment of the namedexecutive officers’ individual performance in 2019.
The following table summarizes the 2019 bonus amounts paid to our named executive officers:
Gorder Titzman Riggs Fraser Simmons
Base Salary (1) $1,745,000 $ 725,000 $ 840,000 $ 600,000 $ 650,000
Bonus Target Percentage (2) 160% 80% 100% 80% 65%
Bonus Target Amount (3) $2,792,000 $ 580,000 $ 840,000 $ 480,000 $ 422,500
Bonus Percentage Achieved (4) 145.08% 145.08% 145.08% 145.08% 145.08%
Earned Target Incentive Bonus (5) $4,050,634 $ 841,464 $1,218,672 $ 696,384 $ 612,963
Bonus Amount Paid (6) $4,100,000 $ 842,000 $1,250,000 $ 700,000 $ 625,000
Footnotes:
(1) Base salary is the officer’s base salary at December 31, 2019.
(2) Bonus target as a percentage of base salary.
42

COMPENSATION DISCUSSION AND ANALYSIS
Footnotes (cont.):
(3) Determined by multiplying “Bonus target percentage” times “Base salary.”
(4) Valero’s performance score for “Bonus percentage achieved” was 145.08% based on results of the Annual Incentive Bonus Performance Goalsdetailed in the previous table.
(5) Determined by multiplying “Bonus target amount” times “Bonus percentage achieved.”
(6) As disclosed in the Summary Compensation Table. The actual amount paid was determined based on: (i) Valero’s performance as measuredagainst financial, operational, and strategic goals, and (ii) the Committee’s assessment of the named executive officers’ individual performance in2019.
LONG-TERM INCENTIVE AWARDS
We provide stock-based, long-term compensation to our executive officers through our stockholder-approved equity plan. The planprovides for a variety of stock and stock-based awards, including restricted stock which vests over a period (at least three years)determined by the Compensation Committee, and performance shares that vest (become non-forfeitable) contingent upon Valero’sachievement of an objective performance goal.
For 2019, the mix of long-term incentives awarded to our named executive officers was split evenly, on a share value basis, betweengrants of restricted stock and awards of performance shares. We believe that these awards create a powerful link between the creationof stockholder value and executive pay delivered. In addition, we believe that the balance between absolute performance alignmentthrough restricted shares, and the relative performance objectives underscored by the relative TSR performance shares, is appropriate.In order for executives to fully realize their targeted opportunities, Valero must both perform well and beat the stock price performanceof companies in the Performance Peer Group listed above under the caption “Administration of Executive Compensation Programs—Benchmarking Data—Performance Peer Group.”
For each officer, a target amount of long-term incentives is established and is expressed as a percentage of base salary. In establishingaward sizes, the Compensation Committee makes primary reference to median peer company grant levels and makes individualizeddeterminations of award sizes based on additional factors such as: each executive’s experience and contribution to company success,internal parity, and management succession. In addition, an executive’s targeted award may be adjusted based upon theCompensation Committee’s determination of the officer’s individual performance, which (for officers other than the Chief ExecutiveOfficer) takes into consideration the recommendation of the Chief Executive Officer.
Performance Shares
For 2019, performance share targets represent 50 percent of each executive officer’s long-term incentive target on a share value basis.Performance shares are payable in shares of Common Stock on the vesting dates of the performance shares. Shares of CommonStock are earned with respect to vesting performance shares only upon Valero’s achievement of TSR objectives (measured in relationto the TSR of our peers). Shares not earned in a given performance period expire and are forfeited. Performance shares are alsosubject to potential forfeiture if an executive terminates his or her employment prior to vesting.
The performance shares awarded in 2019 are subject to vesting in three increments, based upon our TSR compared to our peer groupduring one-year, two-year, and three-year performance periods. Performance periods measure TSR based on the average closingstock prices for the final 15 trading days of December at the beginning and end of the performance periods, including dividends. At theend of each performance period, our TSR for the period is compared to the TSR of our performance peer group. Shares of CommonStock are awarded based on Valero’s TSR performance versus the peers’ TSR. If Valero’s relative TSR ranking equals the median ofthe peer group, 100% of the target shares are earned; if Valero ranks in the first or second position among the peers, 200% of thetarget shares will be earned; if Valero ranks in the last or second-to-last position among the peers, 0% of the target shares will beearned. TSR performance ranking between the second and second-to-last positions will result in payouts determined by straight-lineinterpolation (unless Valero’s TSR rank equals the median in which case 100% of the target shares will be earned).
Additional shares of Common Stock may be earned based on the accumulated value of dividends paid on Valero’s Common Stockduring the pertinent performance period. The amount of accumulated dividends is multiplied by the earned percentage payout (if any)for the performance shares, and the product is divided by the fair market value of the Common Stock on the performance shares’vesting date. The resulting amount is paid in a whole number of shares of Common Stock. The value of the dividends credited to theoutstanding performance shares is paid to participants only to the extent that the underlying performance shares earn shares ofCommon Stock, based on Valero’s TSR performance, and is paid (in shares of Common Stock) only when the underlying performanceshares vest.
Upon vesting, officers can designate up to 50% of the after-tax vested shares of Common Stock to be delivered in cash. If a cashpayment is elected, the total number of after-tax shares to be delivered is multiplied by the fair market value of the Common Stock on
2020 PROXY STATEMENT 43

COMPENSATION DISCUSSION AND ANALYSIS
the performance shares’ vesting date, and the product is multiplied by the cash payment election percentage designated by the awardrecipient. The resulting amount is paid in cash, with the remainder paid in shares of Common Stock.
As shown in the following table, the vesting outcomes for Valero’s previously granted and outstanding Performance Shares which hadperformance periods ending on December 31, 2019 effectively demonstrates the alignment of Valero’s long-term incentive program tothe interests of Valero’s stockholders.
Performance Shares Grant(Year & Segment)
Final Percentile TSR Rankingversus Peers
Vesting Percentage of Target(Target = 100%)
(Range of 0% to 200%)
2016 (final of 3 segments) 3 of 9 200.0% (1)
2017 (2nd of 3 segments) 3 of 9 166.7%
2018 (1st of 3 segments) 2 of 9 200.0%
(1) The 2016 TSR performance measurement scale provided for maximum payout (200% of target) if Valero’s TSR performance was in the75th percentile or above of performance within the peer group. This differs from the 2017 and 2018 TSR performance measurement scales whichmatch the 2019 measurement scale as described previously in this section and which require a TSR rank of 1st or 2nd position within the peergroup for maximum payout.
In 2020, the Compensation Committee approved new metrics for purposes of the Performance Shares component of the 2020 AnnualLong-term Incentive program. In addition to continued utilization of a performance measure based on TSR performance relative to apeer group, the performance shares will also include a performance measure based on Valero’s Return on Invested Capital (ROIC) overa three-year period versus a target. The performance shares awards for 2020 retain the primary design elements as previouslydescribed in this section, but will now have the performance-based vesting criteria segmented such that 75% of the target award willbe measured against Valero’s relative TSR versus a peer group performance measure and the remaining 25% measured againstValero’s ROIC versus a target performance measure.
Restricted Stock
Restricted stock targets represent the remaining 50 percent of each executive officer’s long-term incentive target on a share valuebasis. Restricted stock is subject to forfeiture if an executive terminates his or her employment prior to vesting (other than uponretirement and other than following a permitted voluntary termination following a change in control). Dividends are paid on shares ofrestricted stock as and when dividends are declared and paid on Valero’s outstanding common stock.
Our mix of long-term incentives provides an appropriate balance between the pay-for-performance attributes of performance sharesand the equity alignment and retentive qualities of restricted shares. This mix also generally aligns with market practices, and thussupports recruitment and retention of top-quality executive talent.
The Compensation Committee considers and grants long-term incentive awards to our officers and certain other employees annually;grants were made previously during the fourth quarter in conjunction with the last regularly scheduled meeting of the CompensationCommittee for the year. The performance shares and restricted stock components of our executive officers’ 2019 long-term incentiveawards were granted in October 2019. Beginning in 2020, long-term incentive awards to our officers will be granted annually during thefirst quarter of the year in order to better align annual pay decisions and awards across salary, target bonus, and long-term incentives,and to align with competitive practices.
Long-Term Incentive Agreement with Mr. Riggs. On Nov. 2, 2019, Mr. Riggs’s operations responsibilities were expanded tooversee not only refining operations but also Valero’s mid-stream and renewable fuels operations. In order to reward Mr. Riggs for hisexpanded role, and also to help ensure continued retention over the coming years, the Compensation Committee approved restrictedshare awards to Mr. Riggs in December 2019. The long-term incentive package awarded to Mr. Riggs in December is valued at$5 million and comprises three grants of restricted shares that are scheduled to vest over a three-year period. In addition toappropriately rewarding Mr. Riggs for his expanded role, the long-term incentive agreement is intended to incentivize excellentperformance and to ensure the retention of critical talent.
The first grant of 10,548 restricted shares (valued at $1 million) is included in the disclosures for the Summary Compensation Table andGrants of Plan-Based Awards table in this proxy statement. The second grant (27,194 restricted shares, valued at $2 million) wasmade on Feb. 26, 2020. The third grant of restricted shares (to be valued at $2 million) is scheduled to be made in February 2021,subject to the continued employment of Mr. Riggs on that date.
44
COMPENSATION DISCUSSION AND ANALYSIS
The target pay mix and other descriptions of Mr. Riggs’s annual compensation included in this Compensation Discussion and Analysisexcludes the values and terms specific to the long-term incentive agreement described above. The long-term incentive agreementpertains to an award that is specifically targeted at the retention of Mr. Riggs throughout the covered period and is not an integral partof his regular, annual compensation program.
PERQUISITES AND OTHER BENEFITS
Consistent with our goal of providing compensation and benefits that are aligned with market practices among our peers, officers areeligible to receive reimbursement for club dues, federal income tax preparation, home security protection, and an annual healthexamination. We do not provide executive officers with automobiles or automobile allowances or supplemental executive medicalcoverage.
We provide other benefits, including medical, life, dental, and disability insurance in line with competitive market conditions. Our namedexecutive officers are eligible for the same benefit plans provided to our other employees, including our Thrift Plan and insurance andsupplemental plans chosen and paid for by employees who desire additional coverage.
Consistent with typical practices among our peers, executive officers and other employees whose compensation exceeds certain limitsare eligible to participate in non-qualified excess benefit programs whereby those individuals can choose to make larger contributionsthan allowed under the qualified plan rules and receive correspondingly higher benefits. These plans are described below.
POST-EMPLOYMENT BENEFITS
Pension Plans
We have a noncontributory defined benefit Pension Plan in which most of our employees, including our named executive officers, areeligible to participate and under which contributions by individual participants are neither required nor permitted. We also have anoncontributory, non-qualified Excess Pension Plan and a non-qualified Supplemental Executive Retirement Plan (SERP), whichprovide supplemental pension benefits to certain highly compensated employees. Our named executive officers are participants in theSERP. The SERP is offered to align with competitive practices among our peers, and to thus support recruitment and retention ofcritical executive talent. The Excess Pension Plan and the SERP provide eligible employees with additional retirement savingsopportunities that cannot be achieved with tax-qualified plans due to Internal Revenue Code limits on (i) annual compensation that canbe taken into account under qualified plans, or (ii) annual benefits that can be provided under qualified plans. These plans are furtherdescribed in the disclosures under the caption “Executive Compensation—Post-Employment Compensation.”
Nonqualified Deferred Compensation Plans
Deferred Compensation Plan. Our named executive officers are eligible to participate in our Deferred Compensation Plan (“DC Plan”).The DC Plan is offered to align with competitive practices among our peers, and thereby support recruitment and retention of executivetalent. The DC Plan permits eligible employees to defer a portion of their salary and/or bonus until separation (i.e., retirement ortermination of employment). Under the DC Plan, each year eligible employees are permitted to elect to defer up to 30 percent of theirsalary and/or 50 percent of their cash bonuses to be earned for services performed during the following year. We have not madediscretionary contributions to participants’ accounts, and currently we have no plans to do so.
All amounts credited under the DC Plan (other than discretionary credits) are immediately 100 percent vested. Any discretionarycredits, if ever granted, will vest in accordance with the vesting schedule determined at the time of the grant of discretionary credits.Participant accounts are credited with earnings (or losses) based on investment fund choices made by the participants among availablefunds selected by Valero’s Benefits Plans Administrative Committee.
Excess Thrift Plan. Our Excess Thrift Plan provides benefits to participants in our Thrift Plan whose annual additions to the Thrift Planare subject to the limitations on annual additions as provided under Section 415 of the Internal Revenue Code, and/or who areconstrained from making maximum contributions under the Thrift Plan by Section 401(a)(17) of the Internal Revenue Code, which limitsthe amount of an employee’s annual compensation which may be taken into account under that plan. Two separate componentscomprise the Excess Thrift Plan: (i) an “excess benefit plan” as defined under Section 3(36) of ERISA; and (ii) a plan that is unfundedand maintained primarily for the purpose of providing deferred compensation for a select group of management or highly compensatedemployees.
Additional information about these plans and contributions made by Valero and each of our named executive officers under non-qualified defined contribution and other deferred compensation plans are presented in this proxy statement under the caption“Executive Compensation—Nonqualified Deferred Compensation.”
2020 PROXY STATEMENT 45

COMPENSATION DISCUSSION AND ANALYSIS
Change of Control Severance Arrangements
We have change of control severance agreements with each of our named executive officers. The agreements are intended to assurethe continued objectivity and availability of the officers in the event of any merger or acquisition that would likely threaten the jobsecurity of many top executives. These arrangements are also intended to maintain executive focus and productivity in a period ofuncertainty. If a change of control occurs during the term of an agreement, the agreement becomes operative for a fixed three-yearperiod. The agreements provide generally that the officers’ terms and conditions of employment will not be adversely changed duringthe three-year period after a change of control. For information regarding payments that may be made under these agreements, seethe disclosures in this proxy statement under the caption “Executive Compensation—Potential Payments upon Termination or Changeof Control.”
Accounting and Tax Treatment
ACCOUNTING TREATMENT
Compensation expense for our share-based compensation plans is based on the fair value of the awards granted and is recognized inincome on a straight-line basis over the shorter of (a) the requisite service period of each award, or (b) the period from the grant date tothe date retirement eligibility is achieved if that date is expected to occur during the nominal vesting period. Specific components of ourstock-based compensation programs are discussed in Note 14 of Notes to Consolidated Financial Statements in Valero’s AnnualReport on Form 10-K for the year ended Dec. 31, 2019.
TAX TREATMENT
Section 162(m) of the Internal Revenue Code of 1986 generally limits the deductibility of compensation paid to certain top executives to$1 million. In previous years, there was an exemption from this $1 million deduction limit for compensation payments that qualified as“performance-based” under applicable regulations. However, the enactment of the Tax Cuts and Jobs Act of 2017 eliminated theperformance-based compensation exemption, except with respect to certain grandfathered arrangements.
We believe that outstanding stock options, as well as performance shares granted in 2017, continue to qualify as performance-basedcompensation under the grandfather rules provided under the Tax Cuts and Jobs Act of 2017. Grants of restricted stock that are notsubject to specific quantitative performance measures, and that were awarded in 2017 and earlier years, will likely not qualify asperformance-based compensation under the Section 162(m) grandfather rules, and in such event, would be subject to Section 162(m)deduction restrictions.
Prospectively, for pay vehicles granted and earned in 2019 and beyond, the Tax Cuts and Jobs Acts of 2017 eliminated thedeductibility of most components of pay to certain top executives to the extent that such pay exceeds $1 million in a year. Consistentwith Valero’s historic approach to deductibility under former Section 162(m), the Compensation Committee will continue to exerciseflexibility and discretion in determining whether any given form of pay should be designed and administered to qualify for fulldeductibility.
Compensation-Related Policies
POLICY ON VESTING OF PERFORMANCE SHARES UPON CHANGE OF CONTROL OF VALERO
Our Board has adopted a policy regarding the vesting of performance shares upon a change of control of Valero. The policy providesthat performance shares granted to participants in Valero’s equity incentive plans will not vest automatically upon the date of a changeof control (as defined in the applicable plan) of Valero. The policy further provides that in making awards of performance shares toparticipants, the Compensation Committee may provide in the award agreement with the participant that if a participant’s employmentwith Valero is terminated following a change of control, any unvested performance shares held by the participant will vest on a partial,pro rata basis on the date of the participant’s termination of employment, with such qualifications for an award as the Committee maydetermine. The policy is available on our website at www.valero.com > Investors > Corporate Governance > Governance Documents.
EXECUTIVE COMPENSATION CLAWBACK POLICY
Under our executive compensation clawback policy, in the event of a material restatement of Valero’s financial results, the Board, orthe appropriate committee thereof, will review all bonuses and other incentive and equity compensation awarded to our executive
46

COMPENSATION DISCUSSION AND ANALYSIS
officers. The policy provides that if the bonuses and other incentive and equity compensation would have been lower had they beencalculated based on such restated results, the Board (or committee), will, to the extent permitted by governing law and as appropriateunder the circumstances, seek to recover for the benefit of Valero all or a portion of the specified compensation awarded to executiveofficers whose fraud or misconduct caused or partially caused such restatement, as determined by the Board (or committee). Indetermining whether to seek recovery, the policy states that the Board (or committee) shall take into account such considerations as itdeems appropriate, including governing law and whether the assertion of a claim may prejudice the interests of Valero in any relatedproceeding or investigation. The policy is available on our website at www.valero.com > Investors > Corporate Governance >Governance Documents.
COMPENSATION CONSULTANT DISCLOSURE POLICY
Per the terms of our compensation consultant disclosure policy, Valero will make certain disclosures pertaining to compensationconsultants in our proxy statements for annual meetings of stockholders. For any compensation consultant retained by theCompensation Committee to provide compensation advice with respect to the compensation disclosed in the Summary CompensationTable in the proxy statement, we will disclose (i) the total fees paid annually to the consultant for compensation-related services andnon-compensation-related services, (ii) a description of any non-compensation-related services provided by the consultant, and (iii) anyservices that the consultant has provided to senior executives of Valero and the nature of those services. The policy is available on ourwebsite at www.valero.com > Investors > Corporate Governance > Governance Documents.
STOCK OWNERSHIP GUIDELINES
We have adopted stock ownership guidelines applicable to our officers and non-employee directors. The guidelines require that non-employee directors acquire and hold during their service shares of Common Stock equal in value to at least five times their annual cashretainer. Our officers are required to meet the applicable guidelines stated below.
Officer Position Value of Shares Owned
Chief Executive Officer 5x Base SalaryPresident 3x Base SalaryExecutive Vice Presidents 2x Base SalarySenior Vice Presidents 1x Base SalaryVice Presidents 1x Base Salary
Officers and non-employee directors have five years after becoming subject to the guidelines to meet the requisite ownership thresholdand, once attained, are expected to continuously own sufficient shares to meet that threshold.
PROHIBITION AGAINST HEDGING AND PLEDGING
Our policies prohibit our directors, officers, and employees from speculating in our stock, which includes short selling (profiting if themarket price of our stock decreases), buying or selling publicly traded options (including writing covered calls), hedging, or any othertype of derivative arrangement that has a similar economic effect. In addition, our directors and officers are prohibited from pledgingshares of Common Stock as collateral or security for indebtedness. Compliance with the guidelines is monitored by the CompensationCommittee. The full text of our guidelines is included in our Corporate Governance Guidelines (as Article IX), available on our website atwww.valero.com > Investors Relations > Corporate Governance > Governance Documents.
INSIDER TRADING POLICY
Our Securities Trading Policy prohibits our officers, directors, and employees from purchasing or selling Valero securities while inpossession of material, nonpublic information, or otherwise using such information for their personal benefit or in any manner thatwould violate applicable laws and regulations.
2020 PROXY STATEMENT 47
COMPENSATION CONSULTANT DISCLOSURES
Our Compensation Committee may, in its sole discretion, retain or obtain the advice of a compensation consultant, independent legalcounsel, or other adviser, and is directly responsible for the appointment, compensation, and oversight of the work of anycompensation consultant, independent legal counsel, or other adviser retained by the Committee. Valero is obligated to provideappropriate funding for the Committee’s retention of a consultant, counsel, or adviser.
In 2019, the Committee retained Exequity LLP as an independent compensation consultant. Exequity provided to the Committeeobjective expert analysis and independent advice regarding executive and director compensation. For the 2019 executive and directorcompensation services rendered to the Committee, Exequity earned professional fees of $516,374. Exequity did not provide otherconsulting services to the Committee, to Valero, or to any senior executives of Valero. Exequity is an independent adviser asdetermined under the SEC’s rules and the NYSE’s listing standards.
During 2019, Exequity’s executive and director compensation consulting services included:
• assistance with establishing our overall executive compensation philosophy in light of our business strategies;• assistance with selecting peer and comparator companies for benchmarking executive pay and monitoring Valero’s
performance;• assessment of competitive pay for our executives, with separate analyses of base salary, annual incentive, and long-term
incentive compensation;• assessment of, and recommendations for, our annual incentive bonus program;• assessment of, and recommendation of enhancements to, our long-term incentive program strategy, including (i) the design
of an appropriate mix of equity incentive vehicles, (ii) determination of performance measures and measurement techniques,and (iii) determination of competitive equity grant guidelines consistent with our overall pay philosophy;
• assistance with implementation of the 2020 Omnibus Stock Incentive Plan;• updates on trends and developments in executive compensation, new regulatory issues, and best practices;• assessment of competitive pay for our directors; and• assistance with proxy statement disclosures.
48

EQUITY COMPENSATION PLAN INFORMATION
The following table presents information regarding our equity compensation plans as of December 31, 2019.
Number ofSecurities
to be IssuedUpon Exerciseof Outstanding
Options, Warrantsand Rights (#)
Weighted-Average
Exercise Priceof Outstanding
Options, Warrantsand Rights ($)
Number ofSecurities
Remaining Availablefor Future
Issuance UnderEquity Compensation
Plans (1)
Approved by stockholders:2011 Omnibus Stock Incentive Plan (2) 349,462 $34.94 7,740,665
2005 Omnibus Stock Incentive Plan 47,792 17.74 —
Not approved by stockholders:none — — —
Total 397,254 27.68 7,740,665
Footnotes:
(1) Securities available for future issuance under these plans can be issued in various forms, including restricted stock, performance shares, stock unitawards, and stock options.
(2) The number of securities remaining available for future issuance under the 2011 Omnibus Stock Incentive Plan (2011 OSIP) as of Feb. 28, 2020, is7,202,491.
Additional disclosures about the 2011 OSIP may be found in Proposal No. 4—Approve the 2020 Omnibus Stock Incentive Plan.
Our equity plans are described further in Note 14 of Notes to Consolidated Financial Statements for the fiscal year ended December 31, 2019, includedin Valero’s Annual Report on Form 10-K.
2020 PROXY STATEMENT 49

EXECUTIVE COMPENSATION
The following tables disclose compensation paid to or earned by our named executive officers for 2019. We use captions and headingsin these tables that correspond to the SEC regulations requiring these disclosures. The footnotes to these tables provide importantinformation to explain the values presented in the tables.
Summary Compensation Table
This table summarizes the compensation paid to our named executive officers for fiscal years 2019, 2018, and 2017. The elements ofcompensation listed in the table are described in the Compensation Discussion and Analysis section of this proxy statement and in thetable’s footnotes. The officers’ titles listed below are their current titles.
Principal Position (1) YearSalary
($)
StockAwards($)(2)(3)
Non-EquityIncentive PlanCompensation
($)(4)
Change inPension Value
and Non-qualifiedDeferred
CompensationEarnings ($)(5)
All OtherCompensation
($)(6) Total ($)
TotalExcludingChange inPension
Value($)(7)
Joseph W. Gorder,Chairman of the Boardand CEO
2019 1,745,000 14,485,699 4,100,000 7,484,813 360,440 28,175,952 20,691,139
2018 1,660,000 10,931,251 4,625,000 1,353,779 189,126 18,759,156 17,405,377
2017 1,585,000 12,734,060 3,800,000 4,269,202 143,998 22,532,260 18,263,058
Donna M. Titzman,EVP and Chief FinancialOfficer
2019 725,000 2,685,278 842,000 3,573,309 80,275 7,905,862 4,332,553
2018 641,667 1,508,905 840,000 382,570 70,593 3,443,735 3,061,165
(8)
R. Lane Riggs,President and ChiefOperating Officer
2019 840,000 4,792,892 1,250,000 4,245,462 108,056 11,236,410 6,990,948
2018 800,000 2,200,997 1,110,000 — 103,172 4,214,169 4,214,169
2017 700,000 2,710,576 925,000 1,743,387 96,683 6,175,646 4,432,259
Jason W. Fraser,EVP and General Counsel
2019 600,000 2,280,836 700,000 1,811,402 110,874 5,503,112 3,691,710
(9)
(9)
Gary K. Simmons,EVP and ChiefCommercial Officer
2019 650,000 1,787,833 625,000 2,535,277 175,412 5,773,522 3,238,245
2018 625,000 1,174,051 705,000 — 81,590 2,585,641 2,585,641
2017 600,000 1,398,749 620,000 1,345,120 88,961 4,052,830 2,707,710
Footnotes to Summary Compensation Table:
(1) The persons listed in this table are referred to in this proxy statement as our “named executive officers” (NEOs).
(2) The amount shown is the “grant date fair value” of stock awards (restricted stock and performance shares) computed under Financial AccountingStandards Board Accounting Standards Codification Topic 718, Compensation–Stock Compensation (FASB ASC Topic 718). The grant date fairvalues are higher than the “target value” of stock awards for each NEO due to reasons more fully described in Compensation Discussion andAnalysis and below in this footnote. The target values of stock awards for the NEOs were (rounded): Mr. Gorder ($10,990,000), Ms. Titzman($2,500,000), Mr. Riggs ($3,360,000), Mr. Fraser ($2,250,000), and Mr. Simmons ($1,500,000)
The grant date fair values disclosed under FASB ASC Topic 718 for our performance share awards include the values of certain tranches ofunvested performance shares that were awarded in years prior to the fiscal year shown in the table. The computations of grant date fair values forperformance shares are more fully described in footnote (6) to the Grants of Plan-Based Awards table in this proxy statement.
(footnote (2) continues on the following page)
50
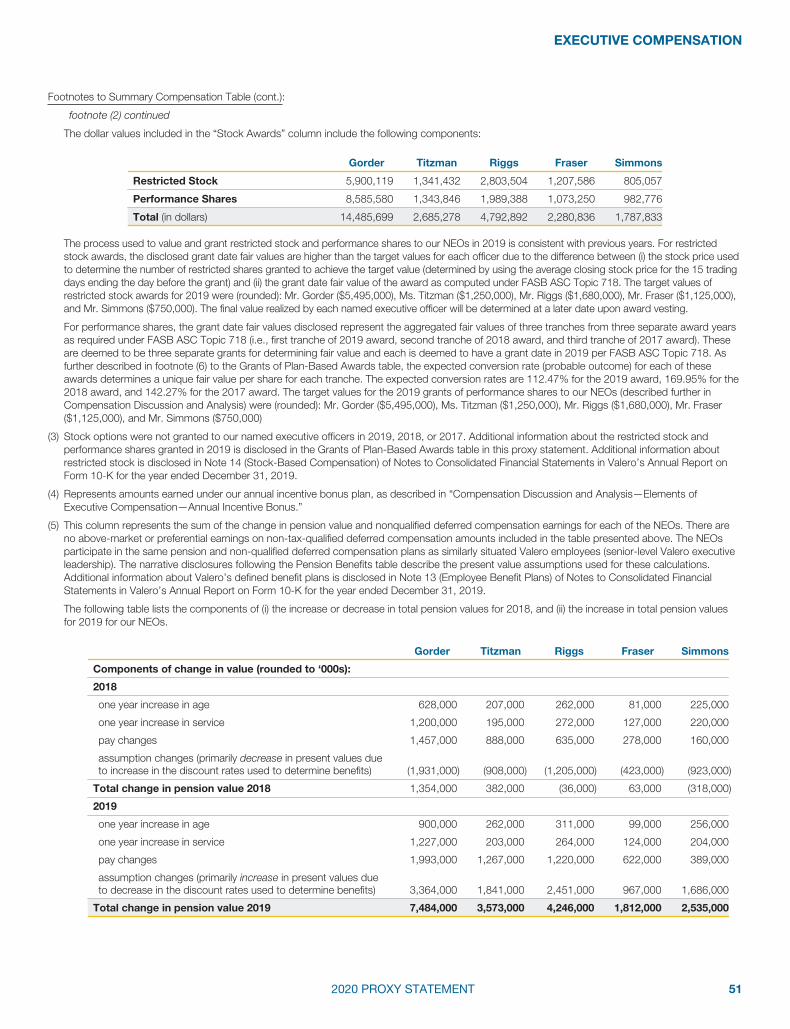
EXECUTIVE COMPENSATION
Footnotes to Summary Compensation Table (cont.):
footnote (2) continued
The dollar values included in the “Stock Awards” column include the following components:
Gorder Titzman Riggs Fraser Simmons
Restricted Stock 5,900,119 1,341,432 2,803,504 1,207,586 805,057
Performance Shares 8,585,580 1,343,846 1,989,388 1,073,250 982,776
Total (in dollars) 14,485,699 2,685,278 4,792,892 2,280,836 1,787,833
The process used to value and grant restricted stock and performance shares to our NEOs in 2019 is consistent with previous years. For restrictedstock awards, the disclosed grant date fair values are higher than the target values for each officer due to the difference between (i) the stock price usedto determine the number of restricted shares granted to achieve the target value (determined by using the average closing stock price for the 15 tradingdays ending the day before the grant) and (ii) the grant date fair value of the award as computed under FASB ASC Topic 718. The target values ofrestricted stock awards for 2019 were (rounded): Mr. Gorder ($5,495,000), Ms. Titzman ($1,250,000), Mr. Riggs ($1,680,000), Mr. Fraser ($1,125,000),and Mr. Simmons ($750,000). The final value realized by each named executive officer will be determined at a later date upon award vesting.
For performance shares, the grant date fair values disclosed represent the aggregated fair values of three tranches from three separate award yearsas required under FASB ASC Topic 718 (i.e., first tranche of 2019 award, second tranche of 2018 award, and third tranche of 2017 award). Theseare deemed to be three separate grants for determining fair value and each is deemed to have a grant date in 2019 per FASB ASC Topic 718. Asfurther described in footnote (6) to the Grants of Plan-Based Awards table, the expected conversion rate (probable outcome) for each of theseawards determines a unique fair value per share for each tranche. The expected conversion rates are 112.47% for the 2019 award, 169.95% for the2018 award, and 142.27% for the 2017 award. The target values for the 2019 grants of performance shares to our NEOs (described further inCompensation Discussion and Analysis) were (rounded): Mr. Gorder ($5,495,000), Ms. Titzman ($1,250,000), Mr. Riggs ($1,680,000), Mr. Fraser($1,125,000), and Mr. Simmons ($750,000)
(3) Stock options were not granted to our named executive officers in 2019, 2018, or 2017. Additional information about the restricted stock andperformance shares granted in 2019 is disclosed in the Grants of Plan-Based Awards table in this proxy statement. Additional information aboutrestricted stock is disclosed in Note 14 (Stock-Based Compensation) of Notes to Consolidated Financial Statements in Valero’s Annual Report onForm 10-K for the year ended December 31, 2019.
(4) Represents amounts earned under our annual incentive bonus plan, as described in “Compensation Discussion and Analysis—Elements ofExecutive Compensation—Annual Incentive Bonus.”
(5) This column represents the sum of the change in pension value and nonqualified deferred compensation earnings for each of the NEOs. There areno above-market or preferential earnings on non-tax-qualified deferred compensation amounts included in the table presented above. The NEOsparticipate in the same pension and non-qualified deferred compensation plans as similarly situated Valero employees (senior-level Valero executiveleadership). The narrative disclosures following the Pension Benefits table describe the present value assumptions used for these calculations.Additional information about Valero’s defined benefit plans is disclosed in Note 13 (Employee Benefit Plans) of Notes to Consolidated FinancialStatements in Valero’s Annual Report on Form 10-K for the year ended December 31, 2019.
The following table lists the components of (i) the increase or decrease in total pension values for 2018, and (ii) the increase in total pension valuesfor 2019 for our NEOs.
Gorder Titzman Riggs Fraser Simmons
Components of change in value (rounded to ‘000s):
2018
one year increase in age 628,000 207,000 262,000 81,000 225,000
one year increase in service 1,200,000 195,000 272,000 127,000 220,000
pay changes 1,457,000 888,000 635,000 278,000 160,000
assumption changes (primarily decrease in present values dueto increase in the discount rates used to determine benefits) (1,931,000) (908,000) (1,205,000) (423,000) (923,000)
Total change in pension value 2018 1,354,000 382,000 (36,000) 63,000 (318,000)
2019
one year increase in age 900,000 262,000 311,000 99,000 256,000
one year increase in service 1,227,000 203,000 264,000 124,000 204,000
pay changes 1,993,000 1,267,000 1,220,000 622,000 389,000
assumption changes (primarily increase in present values dueto decrease in the discount rates used to determine benefits) 3,364,000 1,841,000 2,451,000 967,000 1,686,000
Total change in pension value 2019 7,484,000 3,573,000 4,246,000 1,812,000 2,535,000
2020 PROXY STATEMENT 51
EXECUTIVE COMPENSATION
Footnotes to Summary Compensation Table (cont.):
footnote (5) continued
The discount rates used in 2019, 2018, and 2017 to determine the present value of accumulated benefits are listed in the disclosures following thePension Benefits table.
Disclosures in the Summary Compensation Table for 2018 compensation show a zero value for Mr. Riggs and Mr. Simmons per Instruction 3 toItem 402(c)(2)(viii) of Regulation S-K. The actual aggregate changes in the actuarial present value of these officers’ accumulated benefits under theirdefined benefit and actuarial pension plans (including supplemental plans) were negative values. These negative values were: Mr. Riggs (-$35,467),Mr. Simmons (-$317,781).
(6) Amounts listed as “All Other Compensation” for 2019 are composed of the following items. Any amount in excess of $10,000 (whether or not suchamount may be deemed to be a perquisite or other personal benefit) is separately quantified.
For Mr. Gorder: Valero contributions to the officer’s Thrift Plan account ($19,600), Valero contributions to the officer’s Excess Thrift Plan account($102,550), home security ($28,449), gross up payment for home security imputed income ($18,458), an executive physical exam, reimbursement ofclub membership dues, Valero-provided dollars for the purchase of health and welfare benefits ($26,779), imputed income related to payment of UKincome tax for trailing income from prior work assignment in England ($153,847), imputed income for tax return preparation fees.
For Ms. Titzman: Valero contributions to the officer’s Thrift Plan account ($19,600), Valero contributions to the officer’s Excess Thrift Plan account($31,150), an executive physical exam, Valero-provided dollars for the purchase of health and welfare benefits ($24,895), imputed income for taxreturn preparation fees.
For Mr. Riggs: Valero contributions to the officer’s Thrift Plan account ($19,600), Valero contributions to the officer’s Excess Thrift Plan account($39,200), home security, gross up payment for home security imputed income, an executive physical exam, reimbursement of club membershipdues, Valero-provided dollars for the purchase of health and welfare benefits ($30,084), imputed income for tax return preparation fees.
For Mr. Fraser: Valero contributions to the officer’s Thrift Plan account ($19,600), Valero contributions to the officer’s Excess Thrift Plan account($22,400), home security, gross up payment for home security imputed income, reimbursement of club membership dues, Valero-provided dollarsfor the purchase of health and welfare benefits ($30,084), imputed income related to payment of UK income tax for trailing income from prior workassignment in England ($17,699), imputed income for tax return preparation fees.
For Mr. Simmons: Valero contributions to the officer’s Thrift Plan account ($19,600), Valero contributions to the officer’s Excess Thrift Plan account($25,900), home security ($52,155), gross up payment for home security imputed income ($33,839), an executive physical exam, reimbursement ofclub membership dues ($10,904), Valero-provided dollars for the purchase of health and welfare benefits ($30,084).
(7) The values in this column represent the “Total” compensation for 2019 for each NEO when excluding the year-over-year changes to the presentvalues of accumulated benefits under the pension and nonqualified deferred compensation plans, which can increase or decrease significantly fromyear-to-year due to the actuarial assumptions used in a given year (primarily the discount rates used to determine the present value of accumulatedbenefits). See footnote (5) above for the specific impact of assumption changes to the total change in pension values in 2019 versus 2018.
The amounts reported in this column are calculated by subtracting the change in pension values reported in the Change in Pension Value andNonqualified Deferred Compensation Earnings column, from the amounts reported in the Total compensation column. The amounts reported in thiscolumn differ from, and are not substitutes for, the amounts reported in the Total compensation column.
(8) Ms. Titzman was not a named executive officer for 2017.
(9) Mr. Fraser was not a named executive officer for 2018 or 2017.
52
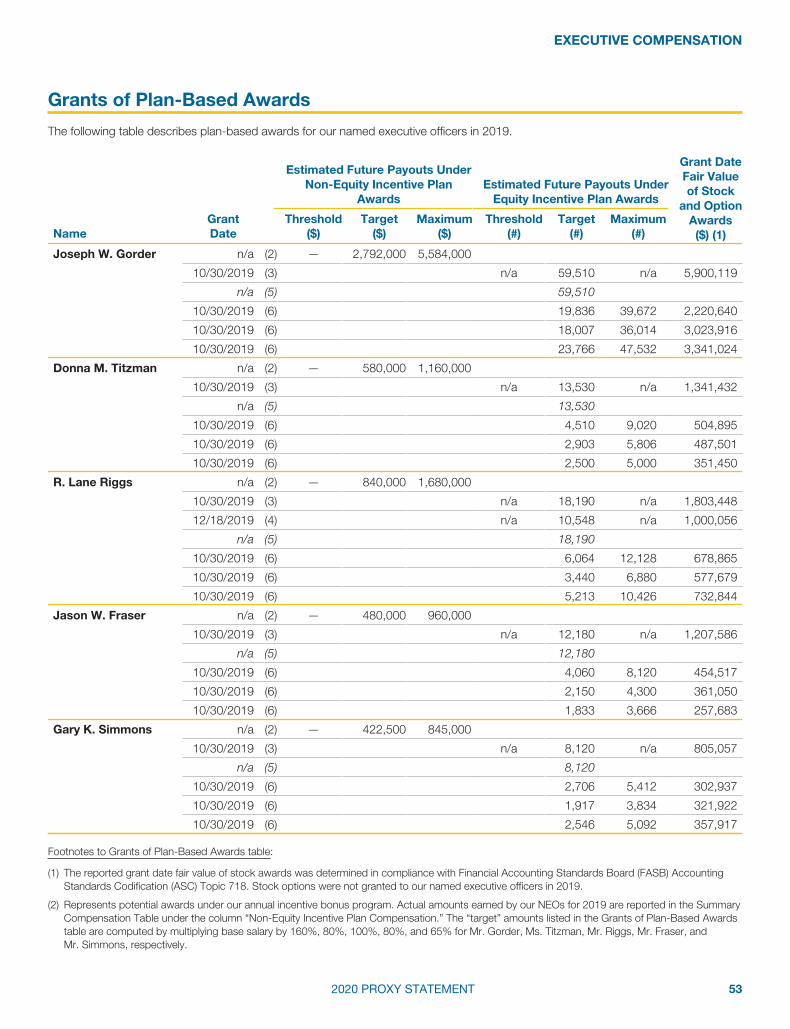
EXECUTIVE COMPENSATION
Grants of Plan-Based Awards
The following table describes plan-based awards for our named executive officers in 2019.
Estimated Future Payouts UnderNon-Equity Incentive Plan
AwardsEstimated Future Payouts Under
Equity Incentive Plan Awards
Grant DateFair Valueof Stock
and OptionAwards($) (1)Name
GrantDate
Threshold($)
Target($)
Maximum($)
Threshold(#)
Target(#)
Maximum(#)
Joseph W. Gorder n/a (2) — 2,792,000 5,584,000
10/30/2019 (3) n/a 59,510 n/a 5,900,119
n/a (5) 59,510
10/30/2019 (6) 19,836 39,672 2,220,640
10/30/2019 (6) 18,007 36,014 3,023,916
10/30/2019 (6) 23,766 47,532 3,341,024
Donna M. Titzman n/a (2) — 580,000 1,160,000
10/30/2019 (3) n/a 13,530 n/a 1,341,432
n/a (5) 13,530
10/30/2019 (6) 4,510 9,020 504,895
10/30/2019 (6) 2,903 5,806 487,501
10/30/2019 (6) 2,500 5,000 351,450
R. Lane Riggs n/a (2) — 840,000 1,680,000
10/30/2019 (3) n/a 18,190 n/a 1,803,448
12/18/2019 (4) n/a 10,548 n/a 1,000,056
n/a (5) 18,190
10/30/2019 (6) 6,064 12,128 678,865
10/30/2019 (6) 3,440 6,880 577,679
10/30/2019 (6) 5,213 10,426 732,844
Jason W. Fraser n/a (2) — 480,000 960,000
10/30/2019 (3) n/a 12,180 n/a 1,207,586
n/a (5) 12,180
10/30/2019 (6) 4,060 8,120 454,517
10/30/2019 (6) 2,150 4,300 361,050
10/30/2019 (6) 1,833 3,666 257,683
Gary K. Simmons n/a (2) — 422,500 845,000
10/30/2019 (3) n/a 8,120 n/a 805,057
n/a (5) 8,120
10/30/2019 (6) 2,706 5,412 302,937
10/30/2019 (6) 1,917 3,834 321,922
10/30/2019 (6) 2,546 5,092 357,917
Footnotes to Grants of Plan-Based Awards table:
(1) The reported grant date fair value of stock awards was determined in compliance with Financial Accounting Standards Board (FASB) AccountingStandards Codification (ASC) Topic 718. Stock options were not granted to our named executive officers in 2019.
(2) Represents potential awards under our annual incentive bonus program. Actual amounts earned by our NEOs for 2019 are reported in the SummaryCompensation Table under the column “Non-Equity Incentive Plan Compensation.” The “target” amounts listed in the Grants of Plan-Based Awardstable are computed by multiplying base salary by 160%, 80%, 100%, 80%, and 65% for Mr. Gorder, Ms. Titzman, Mr. Riggs, Mr. Fraser, andMr. Simmons, respectively.
2020 PROXY STATEMENT 53

EXECUTIVE COMPENSATION
Footnotes to Grants of Plan-Based Awards table (cont.):
(3) Represents an award of restricted stock granted Oct. 30, 2019. The shares are scheduled to vest (become nonforfeitable) annually in equal one-thirdincrements. Dividends on the restricted shares are paid as and when dividends are declared and paid on our Common Stock. Restricted stockawards are more fully described in “Compensation Discussion and Analysis—Elements of Executive Compensation—Long-Term Incentive Awards—Restricted Stock.” For each NEO, the dollar amount stated in the column “Grant Date Fair Value of Stock and Option Awards” is included within theamount listed in the “Stock Awards” column of the Summary Compensation Table and in footnote (2) to the Summary Compensation Table.
(4) Represents an award of restricted stock granted Dec. 18, 2019. The shares are scheduled to vest (become nonforfeitable) annually in equal one-third increments. The grant was made pursuant to a long-term incentive agreement with Mr. Riggs. The agreement is described in “CompensationDiscussion and Analysis—Elements of Executive Compensation—Long-Term incentive Awards—Restricted Stock—Long-Term Incentive Agreementwith Mr. Riggs.” The dollar amount stated in the column “Grant Date Fair Value of Stock and Option Awards” is included within the amount listed inthe “Stock Awards” column of the Summary Compensation Table and in footnote (2) to the Summary Compensation Table.
(5) Represents the number of performance shares awarded under our 2011 Omnibus Stock Incentive Plan to our NEOs on Oct. 30, 2019 under ourlong-term incentive awards program described in “Compensation Discussion and Analysis—Elements of Executive Compensation—Long-TermIncentive Awards—Performance Shares.” Per the awards’ terms, on a normal vesting date officers can earn, in shares of Common Stock, from0% to 200% of the number of performance shares that are vesting, based upon Valero’s achievement of objective performance measures during theperformance periods prescribed by our Compensation Committee.
The performance shares are scheduled to vest annually in one-third increments (tranches) in January 2021, January 2022, and January 2023, withany resulting payout at those times conditioned upon Valero’s performance during the pertinent performance periods. Only the first tranche of theseperformance shares is deemed to have a “grant date” in 2019, as explained in footnote (6) below. Our disclosures referenced by footnote (5) are forinformation purposes only, and tie to the disclosures made by our NEOs in 2019 on Forms 4 in compliance with Section 16 of the Exchange Act.Our disclosures in footnote (6) below are intended to comply with the requirements of Item 402 of Regulation S-K with respect to “grants” ofperformance shares.
(6) Item 402(d)(2)(viii) of Regulation S-K requires us to disclose the “grant date fair value” of equity awards “computed in accordance with FASB ASCTopic 718” (Topic 718). Our performance shares are awarded in three tranches, with the tranches having measurement periods (the performanceperiod) of differing lengths. The first tranche of an award has a performance period of 12 months, the second tranche of an award has aperformance period of 24 months, and the third tranche of an award has a performance period of 36 months.
The amounts referenced by footnote (6) in the Grants of Plan-Based Awards table above represent three tranches from three separate awardyears—namely, the first tranche of performance shares awarded in 2019 (awarded on Oct. 30, 2019), the second tranche of performance sharesawarded in 2018 (awarded on Oct. 31, 2018), and the third tranche of performance shares awarded in 2017 (awarded on Nov. 1, 2017). UnderTopic 718, each of these tranches is deemed to be a separate “grant” for fair value purposes, and each is deemed to have a “grant date” in 2019,that is, Oct. 30, 2019, the date when the Compensation Committee established the peer group of companies for these tranches. The dollar amountsincluded in the table represent the grant date fair values from the three tranches that are deemed to have a grant date in 2019.
For each NEO, the sum of the dollar amounts stated in the Grants of Plan-Based Awards table’s column entitled “Grant Date Fair Value of Stock andOption Awards” is also included in the Summary Compensation Table, first, within the amount listed in the “Stock Awards” column of the SummaryCompensation Table, and second, in footnote (2) to the Summary Compensation Table.
(footnote (6) continues on the following page)
54
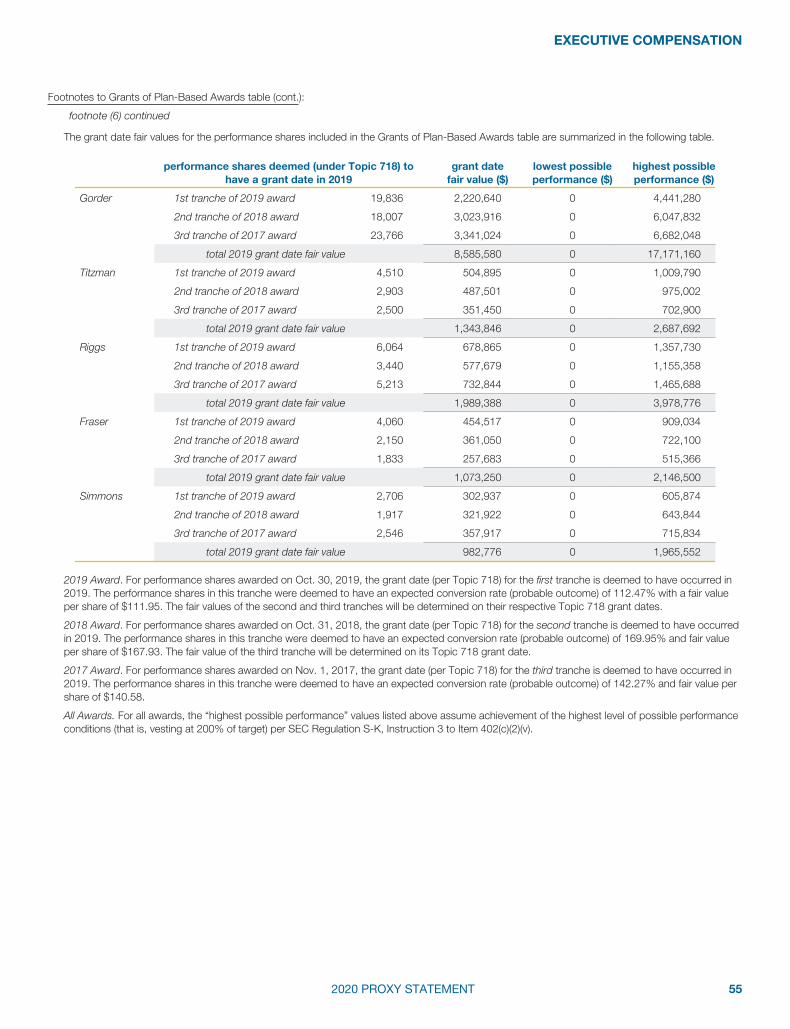
EXECUTIVE COMPENSATION
Footnotes to Grants of Plan-Based Awards table (cont.):
footnote (6) continued
The grant date fair values for the performance shares included in the Grants of Plan-Based Awards table are summarized in the following table.
performance shares deemed (under Topic 718) tohave a grant date in 2019
grant datefair value ($)
lowest possibleperformance ($)
highest possibleperformance ($)
Gorder 1st tranche of 2019 award 19,836 2,220,640 0 4,441,280
2nd tranche of 2018 award 18,007 3,023,916 0 6,047,832
3rd tranche of 2017 award 23,766 3,341,024 0 6,682,048
total 2019 grant date fair value 8,585,580 0 17,171,160
Titzman 1st tranche of 2019 award 4,510 504,895 0 1,009,790
2nd tranche of 2018 award 2,903 487,501 0 975,002
3rd tranche of 2017 award 2,500 351,450 0 702,900
total 2019 grant date fair value 1,343,846 0 2,687,692
Riggs 1st tranche of 2019 award 6,064 678,865 0 1,357,730
2nd tranche of 2018 award 3,440 577,679 0 1,155,358
3rd tranche of 2017 award 5,213 732,844 0 1,465,688
total 2019 grant date fair value 1,989,388 0 3,978,776
Fraser 1st tranche of 2019 award 4,060 454,517 0 909,034
2nd tranche of 2018 award 2,150 361,050 0 722,100
3rd tranche of 2017 award 1,833 257,683 0 515,366
total 2019 grant date fair value 1,073,250 0 2,146,500
Simmons 1st tranche of 2019 award 2,706 302,937 0 605,874
2nd tranche of 2018 award 1,917 321,922 0 643,844
3rd tranche of 2017 award 2,546 357,917 0 715,834
total 2019 grant date fair value 982,776 0 1,965,552
2019 Award. For performance shares awarded on Oct. 30, 2019, the grant date (per Topic 718) for the first tranche is deemed to have occurred in2019. The performance shares in this tranche were deemed to have an expected conversion rate (probable outcome) of 112.47% with a fair valueper share of $111.95. The fair values of the second and third tranches will be determined on their respective Topic 718 grant dates.
2018 Award. For performance shares awarded on Oct. 31, 2018, the grant date (per Topic 718) for the second tranche is deemed to have occurredin 2019. The performance shares in this tranche were deemed to have an expected conversion rate (probable outcome) of 169.95% and fair valueper share of $167.93. The fair value of the third tranche will be determined on its Topic 718 grant date.
2017 Award. For performance shares awarded on Nov. 1, 2017, the grant date (per Topic 718) for the third tranche is deemed to have occurred in2019. The performance shares in this tranche were deemed to have an expected conversion rate (probable outcome) of 142.27% and fair value pershare of $140.58.
All Awards. For all awards, the “highest possible performance” values listed above assume achievement of the highest level of possible performanceconditions (that is, vesting at 200% of target) per SEC Regulation S-K, Instruction 3 to Item 402(c)(2)(v).
2020 PROXY STATEMENT 55
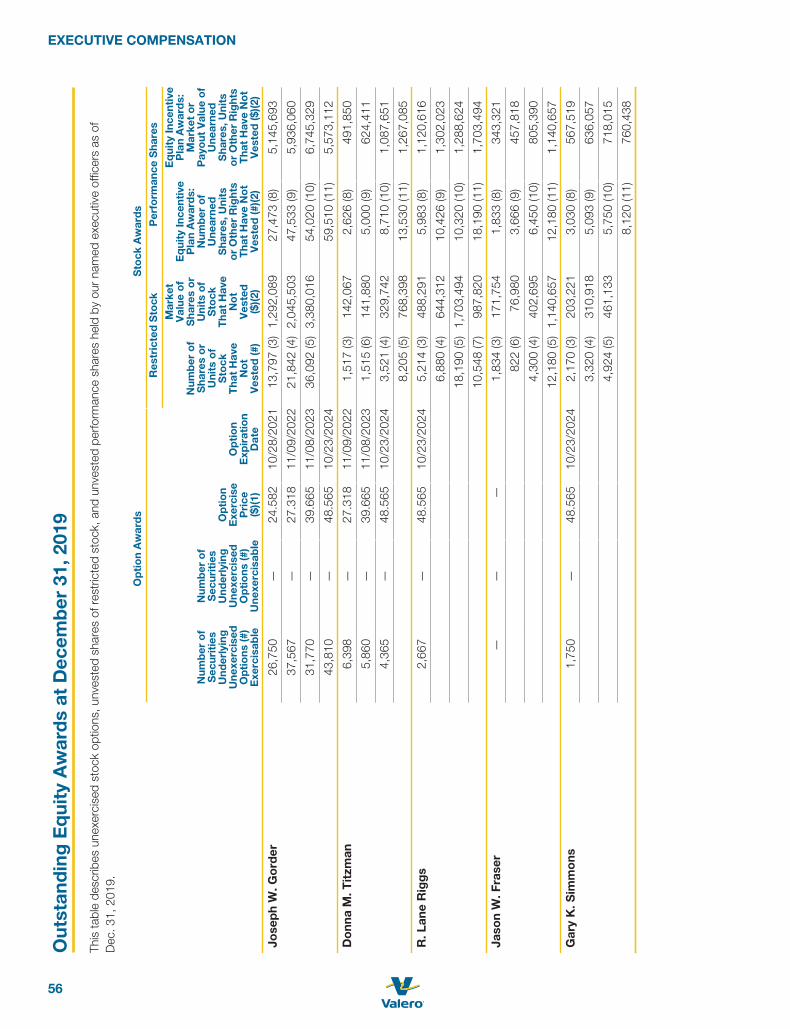
EXECUTIVE COMPENSATION
Out
stan
din
gE
qui
tyA
war
ds
atD
ecem
ber
31,2
019
This
tabl
ede
scrib
esun
exer
cise
dst
ock
optio
ns,u
nves
ted
shar
esof
rest
ricte
dst
ock,
and
unve
sted
perfo
rman
cesh
ares
held
byou
rna
med
exec
utiv
eof
ficer
sas
ofD
ec.3
1,20
19.
Op
tio
nA
war
ds
Sto
ckA
war
ds
Res
tric
ted
Sto
ckP
erfo
rman
ceS
hare
s
Num
ber
of
Sec
urit
ies
Und
erly
ing
Une
xerc
ised
Op
tio
ns(#
)E
xerc
isab
le
Num
ber
of
Sec
urit
ies
Und
erly
ing
Une
xerc
ised
Op
tio
ns(#
)U
nexe
rcis
able
Op
tio
nE
xerc
ise
Pri
ce($
)(1)
Op
tio
nE
xpir
atio
nD
ate
Num
ber
of
Sha
res
or
Uni
tso
fS
tock
Tha
tH
ave
No
tV
este
d(#
)
Mar
ket
Val
ueo
fS
hare
so
rU
nits
of
Sto
ckT
hat
Hav
eN
ot
Ves
ted
($)(2
)
Eq
uity
Ince
ntiv
eP
lan
Aw
ard
s:N
umb
ero
fU
near
ned
Sha
res,
Uni
tso
rO
ther
Rig
hts
Tha
tH
ave
No
tV
este
d(#
)(2)
Eq
uity
Ince
ntiv
eP
lan
Aw
ard
s:M
arke
to
rP
ayo
utV
alue
of
Une
arne
dS
hare
s,U
nits
or
Oth
erR
ight
sT
hat
Hav
eN
ot
Ves
ted
($)(2
)
Jose
ph
W.G
ord
er26
,750
—24
.582
10/2
8/20
2113
,797
(3)
1,29
2,08
927
,473
(8)
5,14
5,69
3
37,5
67—
27.3
1811
/09/
2022
21,8
42(4
)2,
045,
503
47,5
33(9
)5,
936,
060
31,7
70—
39.6
6511
/08/
2023
36,0
92(5
)3,
380,
016
54,0
20(1
0)6,
745,
329
43,8
10—
48.5
6510
/23/
2024
59,5
10(1
1)5,
573,
112
Do
nna
M.T
itzm
an6,
398
—27
.318
11/0
9/20
221,
517
(3)
142,
067
2,62
6(8
)49
1,85
0
5,86
0—
39.6
6511
/08/
2023
1,51
5(6
)14
1,88
05,
000
(9)
624,
411
4,36
5—
48.5
6510
/23/
2024
3,52
1(4
)32
9,74
28,
710
(10)
1,08
7,65
1
8,20
5(5
)76
8,39
813
,530
(11)
1,26
7,08
5
R.L
ane
Rig
gs
2,66
7—
48.5
6510
/23/
2024
5,21
4(3
)48
8,29
15,
983
(8)
1,12
0,61
6
6,88
0(4
)64
4,31
210
,426
(9)
1,30
2,02
3
18,1
90(5
)1,
703,
494
10,3
20(1
0)1,
288,
624
10,5
48(7
)98
7,82
018
,190
(11)
1,70
3,49
4
Jaso
nW
.Fra
ser
——
—1,
834
(3)
171,
754
1,83
3(8
)34
3,32
1
822
(6)
76,9
803,
666
(9)
457,
818
4,30
0(4
)40
2,69
56,
450
(10)
805,
390
12,1
80(5
)1,
140,
657
12,1
80(1
1)1,
140,
657
Gar
yK
.Sim
mo
ns1,
750
—48
.565
10/2
3/20
242,
170
(3)
203,
221
3,03
0(8
)56
7,51
9
3,32
0(4
)31
0,91
85,
093
(9)
636,
057
4,92
4(5
)46
1,13
35,
750
(10)
718,
015
8,12
0(1
1)76
0,43
8
56
EXECUTIVE COMPENSATIONFo
otno
tes
toO
utst
andi
ngE
quity
Aw
ards
tabl
e:
(1)
Our
equi
typl
ans
prov
ide
that
the
exer
cise
pric
efo
rall
stoc
kop
tions
mus
tnot
bele
ssth
anth
em
ean
ofou
rCom
mon
Sto
ck’s
high
and
low
NY
SE
repo
rted
sale
spr
ice
pers
hare
onth
eda
teof
gran
t.
(2)
The
assu
med
mar
ketv
alue
sw
ere
dete
rmin
edus
ing
the
clos
ing
mar
ketp
rice
ofou
rCom
mon
Sto
ckon
Dec
.31,
2019
($93
.65
pers
hare
).Fo
rafu
rthe
rdis
cuss
ion
ofth
eve
stin
gof
perfo
rman
cesh
are
awar
ds(a
sno
ted
inth
efo
llow
ing
foot
note
s),s
ee“C
ompe
nsat
ion
Dis
cuss
ion
and
Ana
lysi
s—E
lem
ents
ofE
xecu
tive
Com
pens
atio
n—Lo
ng-T
erm
Ince
ntiv
eA
war
ds—
Per
form
ance
Sha
res.
”
(3)
The
unve
sted
port
ion
ofth
isaw
ard
issc
hedu
led
tove
ston
Nov
.1,2
020.
(4)
The
unve
sted
port
ion
ofth
isaw
ard
issc
hedu
led
tove
stin
equa
lins
tallm
ents
onO
ct.3
1,20
20an
dO
ct.3
1,20
21.
(5)
The
unve
sted
port
ion
ofth
isaw
ard
issc
hedu
led
tove
stin
equa
lins
tallm
ents
onO
ct.3
0,20
20;O
ct.3
0,20
21;a
ndO
ct.3
0,20
22.
(6)
The
unve
sted
port
ion
ofth
isaw
ard
issc
hedu
led
tove
stin
equa
lins
tallm
ents
onM
ay3,
2020
and
May
3,20
21.
(7)
The
unve
sted
port
ion
ofth
isaw
ard
issc
hedu
led
tove
stin
equa
lins
tallm
ents
onD
ec.1
8,20
20;D
ec.1
8,20
21;a
ndD
ec.1
8,20
22.
(8)
Thes
epe
rform
ance
shar
esve
sted
onJa
n.23
,202
0at
200%
ofta
rget
.The
valu
esh
own
inth
eco
lum
n,“E
quity
Ince
ntiv
eP
lan
Aw
ards
:Mar
keto
rPay
outV
alue
ofU
near
ned
Sha
res,
Uni
tsor
Oth
erR
ight
sTh
atH
ave
Not
Ves
ted,
”re
pres
ents
the
mar
ketv
alue
of20
0%(th
eac
tual
payo
utam
ount
)oft
hepe
rform
ance
shar
esat
the
clos
ing
pric
eof
ourC
omm
onS
tock
onD
ec.3
1,20
19($
93.6
5pe
rsha
re).
(9)
One
-hal
foft
hese
perfo
rman
cesh
ares
vest
edon
Jan.
23,2
020
at16
6.7%
ofta
rget
;the
othe
rhal
fis
sche
dule
dto
vest
inJa
nuar
y20
21.T
heva
lue
show
nin
the
colu
mn,
“Equ
ityIn
cent
ive
Pla
nA
war
ds:M
arke
torP
ayou
tVal
ueof
Une
arne
dS
hare
s,U
nits
orO
ther
Rig
hts
That
Hav
eN
otV
este
d,”
repr
esen
ts,f
orth
epe
rform
ance
shar
esth
atve
sted
onJa
n.23
,202
0,th
em
arke
tval
ueof
166.
7%(th
eac
tual
payo
utam
ount
)oft
hepe
rform
ance
shar
esat
the
clos
ing
pric
eof
ourC
omm
onS
tock
onD
ec.3
1,20
19($
93.6
5pe
rsha
re),
and
fort
here
mai
ning
one-
half,
the
mar
ketv
alue
of10
0%(a
ssum
ed)o
fthe
clos
ing
pric
eof
ourC
omm
onS
tock
onD
ec.3
1,20
19.
(10)
One
-thi
rdof
thes
epe
rform
ance
shar
esve
sted
onJa
n.23
,202
0at
200%
ofta
rget
;an
addi
tiona
lone
-thi
rdis
sche
dule
dto
vest
inJa
nuar
y20
21,a
ndth
efin
alon
e-th
irdis
sche
dule
dto
vest
inJa
nuar
y20
22.T
heva
lue
show
nin
the
colu
mn,
“Equ
ityIn
cent
ive
Pla
nA
war
ds:M
arke
torP
ayou
tVal
ueof
Une
arne
dS
hare
s,U
nits
orO
ther
Rig
hts
That
Hav
eN
otV
este
d,”
repr
esen
ts,f
orth
epe
rform
ance
shar
esth
atve
sted
onJa
n.23
,202
0,th
em
arke
tval
ueof
200%
(the
actu
alpa
yout
amou
nt)o
fthe
perfo
rman
cesh
ares
atth
ecl
osin
gpr
ice
ofou
rC
omm
onS
tock
onD
ec.3
1,20
19($
93.6
5pe
rsha
re),
and
fort
here
mai
ning
two-
third
s,th
em
arke
tval
ueof
100%
(ass
umed
)oft
hecl
osin
gpr
ice
ofou
rCom
mon
Sto
ckon
Dec
.31,
2019
.
(11)
Thes
epe
rform
ance
shar
esar
esc
hedu
led
tove
stin
one-
third
incr
emen
tsin
each
ofJa
nuar
y20
21,J
anua
ry20
22,a
ndJa
nuar
y20
23.T
heva
lue
show
nin
the
colu
mn,
“Equ
ityIn
cent
ive
Pla
nA
war
ds:M
arke
torP
ayou
tVal
ueof
Une
arne
dS
hare
s,U
nits
orO
ther
Rig
hts
That
Hav
eN
otV
este
d,”
repr
esen
tsth
em
arke
tval
ueof
100%
ofth
epe
rform
ance
shar
esat
the
clos
ing
pric
eof
ourC
omm
onS
tock
onD
ec.3
1,20
19.
2020 PROXY STATEMENT 57

EXECUTIVE COMPENSATION
Option Exercises and Stock Vested
The following table provides information regarding (i) stock option exercises by our named executive officers, and (ii) the vesting ofrestricted stock and performance shares held by our named executive officers during 2019 on an aggregated basis.
Option Awards Stock Awards (1)
Name
No. ofShares
Acquired onExercise
(#)(2)
ValueRealized on
Exercise($)(3)
No. ofShares
Acquiredon Vesting
(#)(2)
ValueRealized
on Vesting($)(4)
Joseph W. Gorder 21,400 1,665,531
(5) 40,667 4,038,762
(6) 13,544 1,072,211
Donna M. Titzman — —
(5) 5,628 549,836
(6) 1,383 109,485
R. Lane Riggs — —
(5) 14,637 1,454,775
(6) 2,478 196,171
Jason W. Fraser — —
(5) 6,229 612,637
(6) 923 73,069
Gary K. Simmons — —
(5) 5,667 561,752
(6) 1,614 127,772
Footnotes to Option Exercises and Stock Vested table:
(1) Represents shares of Common Stock from the vesting of restricted stock and performance shares in 2019.
(2) Represents the gross number of shares received by the named executive officer before deducting any shares withheld from (i) an option’s exerciseto pay the exercise price and/or tax obligation, or (ii) the vesting of restricted stock or performance shares to pay the resulting tax obligation.
(3) The reported value is determined by multiplying (i) the number of option shares, times (ii) the difference between the market price of the CommonStock on the date of exercise and the exercise price of the stock option. The value is stated before payment of applicable taxes.
(4) The reported value is determined by multiplying number of vested shares by the market value of the shares on the vesting date. The value is statedbefore payment of applicable taxes.
(5) Represents number of shares of Common Stock and value related to vesting of restricted stock.
(6) Represents number of shares of Common Stock and value related to vesting of performance shares.
58
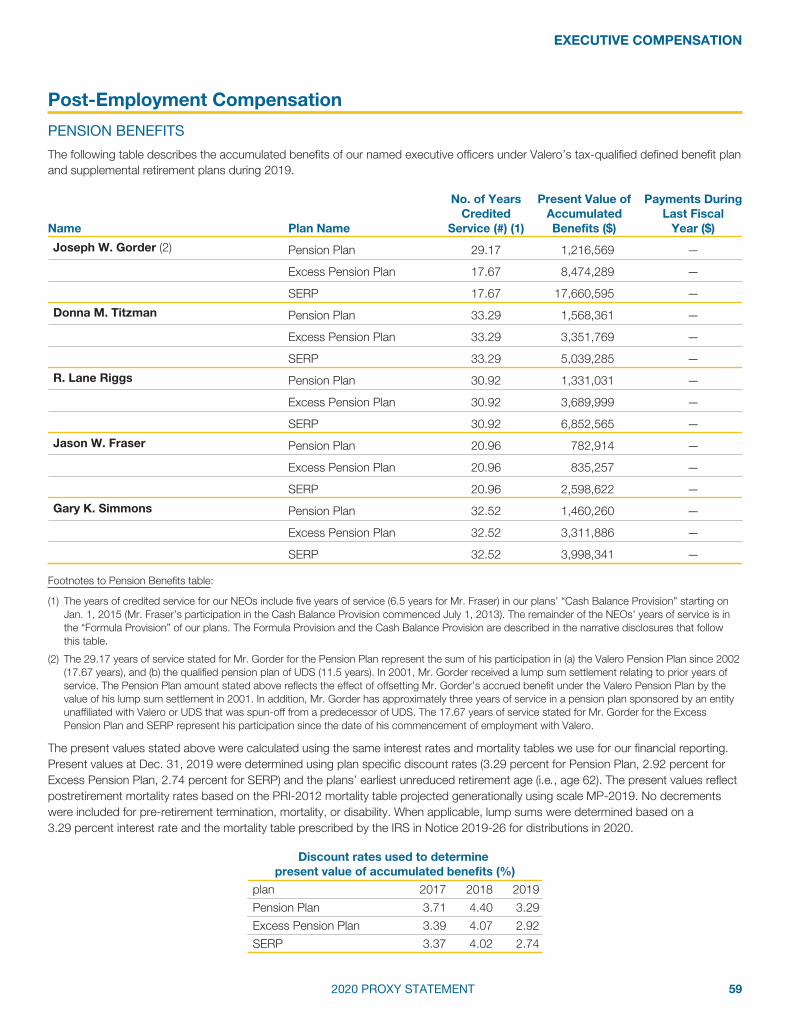
EXECUTIVE COMPENSATION
Post-Employment Compensation
PENSION BENEFITS
The following table describes the accumulated benefits of our named executive officers under Valero’s tax-qualified defined benefit planand supplemental retirement plans during 2019.
Name Plan Name
No. of YearsCredited
Service (#) (1)
Present Value ofAccumulatedBenefits ($)
Payments DuringLast Fiscal
Year ($)
Joseph W. Gorder (2) Pension Plan 29.17 1,216,569 —
Excess Pension Plan 17.67 8,474,289 —
SERP 17.67 17,660,595 —
Donna M. Titzman Pension Plan 33.29 1,568,361 —
Excess Pension Plan 33.29 3,351,769 —
SERP 33.29 5,039,285 —
R. Lane Riggs Pension Plan 30.92 1,331,031 —
Excess Pension Plan 30.92 3,689,999 —
SERP 30.92 6,852,565 —
Jason W. Fraser Pension Plan 20.96 782,914 —
Excess Pension Plan 20.96 835,257 —
SERP 20.96 2,598,622 —
Gary K. Simmons Pension Plan 32.52 1,460,260 —
Excess Pension Plan 32.52 3,311,886 —
SERP 32.52 3,998,341 —
Footnotes to Pension Benefits table:
(1) The years of credited service for our NEOs include five years of service (6.5 years for Mr. Fraser) in our plans’ “Cash Balance Provision” starting onJan. 1, 2015 (Mr. Fraser’s participation in the Cash Balance Provision commenced July 1, 2013). The remainder of the NEOs’ years of service is inthe “Formula Provision” of our plans. The Formula Provision and the Cash Balance Provision are described in the narrative disclosures that followthis table.
(2) The 29.17 years of service stated for Mr. Gorder for the Pension Plan represent the sum of his participation in (a) the Valero Pension Plan since 2002(17.67 years), and (b) the qualified pension plan of UDS (11.5 years). In 2001, Mr. Gorder received a lump sum settlement relating to prior years ofservice. The Pension Plan amount stated above reflects the effect of offsetting Mr. Gorder’s accrued benefit under the Valero Pension Plan by thevalue of his lump sum settlement in 2001. In addition, Mr. Gorder has approximately three years of service in a pension plan sponsored by an entityunaffiliated with Valero or UDS that was spun-off from a predecessor of UDS. The 17.67 years of service stated for Mr. Gorder for the ExcessPension Plan and SERP represent his participation since the date of his commencement of employment with Valero.
The present values stated above were calculated using the same interest rates and mortality tables we use for our financial reporting.Present values at Dec. 31, 2019 were determined using plan specific discount rates (3.29 percent for Pension Plan, 2.92 percent forExcess Pension Plan, 2.74 percent for SERP) and the plans’ earliest unreduced retirement age (i.e., age 62). The present values reflectpostretirement mortality rates based on the PRI-2012 mortality table projected generationally using scale MP-2019. No decrementswere included for pre-retirement termination, mortality, or disability. When applicable, lump sums were determined based on a3.29 percent interest rate and the mortality table prescribed by the IRS in Notice 2019-26 for distributions in 2020.
Discount rates used to determinepresent value of accumulated benefits (%)
plan 2017 2018 2019
Pension Plan 3.71 4.40 3.29
Excess Pension Plan 3.39 4.07 2.92
SERP 3.37 4.02 2.74
2020 PROXY STATEMENT 59
EXECUTIVE COMPENSATION
Pension Plan. Under our Pension Plan, an eligible employee who is at least 55 years old may elect to retire prior to the normalretirement age of 65, provided the employee has completed as least five years of vesting service. Under the plan’s early retirementprovisions, an employee may elect to commence a benefit upon retirement or delay payments to a later date. Pension payments fromthe Formula Provision (defined below) that begin after age 55 and before age 62 are reduced by four percent for each full year betweenthe benefit start date and the employee’s 62nd birthday. The four-percent reduction is prorated for a partial year. The formula used tocalculate the benefit and the optional forms of payment are otherwise the same as for normal retirement. Mr. Gorder, Ms. Titzman, andMr. Simmons were eligible for early retirement benefits.
For employees hired prior to Jan. 1, 2010, the Pension Plan (supplemented, as necessary, by the Excess Pension Plan) provides amonthly pension at normal retirement equal to 1.6 percent of the participant’s average monthly compensation (based upon earningsduring the three consecutive calendar years during the last 10 years of the participant’s credited service affording the highest suchaverage) times the participant’s years of credited service. This is known as the “Formula Provision.” Each of our named executiveofficers was hired prior to Jan. 1, 2010.
For employees hired on or after Jan. 1, 2010, the Pension Plan (supplemented, as necessary, by the Excess Pension Plan) is a cashbalance benefit that provides a monthly pension at normal retirement based on annual employer contributions that are based on yearsof service, eligible compensation, and pay credits. This is known as the “Cash Balance Provision.” After a one-year waiting period, paycredits are retroactive to the participant’s date of hire and are based on years of service and eligible compensation.
points (age and vesting service) annual pay credit percentage
under 35 6.0% of eligible pay35–49 7.5% of eligible pay50–64 9.0% of eligible pay65–79 10.5% of eligible pay80+ 12.0% of eligible pay
In addition to pay credits, participants will also be eligible for monthly interest credits based on the 10-Year U.S. treasury note rate witha minimum of 3 percent.
In 2013, we began to implement changes to certain of our U.S. qualified pension plans that cover the majority of our U.S. employees.Benefits under our primary pension plan changed from a final average pay formula (the Formula Provision) to the Cash BalanceProvision with staged effective dates from July 1, 2013 through Jan. 1, 2015, depending on the age and service of the affectedemployees. All final average pay benefits under the Formula Provision were frozen as of Dec. 31, 2014. On Jan. 1, 2015, participantsformerly under the Formula Provision in the Pension Plan transitioned to the Cash Balance Provision, with all future Pension Planbenefits to be earned under the new cash balance formula.
Excess Pension Plan. Our Excess Pension Plan provides benefits to those employees whose pension benefits under our definedbenefit Pension Plan are subject to limitations under the Internal Revenue Code, or are otherwise indirectly constrained by the Codefrom realizing the maximum benefit available to them under the terms of Pension Plan. The Excess Pension Plan is designed as an“excess benefit plan” as defined under §3(36) of ERISA, for those benefits provided in excess of section 415 of the Code. The ExcessPension Plan is not intended to be either a qualified plan under the provisions of Section 401(a) of the Code, or a funded plan subjectto the funding requirements of ERISA.
Subject to other terms of the Excess Pension Plan, the benefit payable under the plan in the Formula Provision is generally an amountequal to “x” minus “y”, where “x” is equal to 1.6 percent of a participant’s final average monthly earnings (as determined under theExcess Pension Plan) multiplied by the participant’s number of years of credited service, and “y” is equal to the participant’s benefit thatis payable under the Pension Plan. The benefit payable under the Excess Pension Plan in the Cash Balance Provision is generally anamount equal to “x” minus “y”, where “x” is equal to the accumulated account balance that the participant would be entitled to receivewithout regard to the limitations, and “y” is equal to the participant’s accumulated account balance that is payable under the PensionPlan. The Excess Pension Plan benefit is made in a lump sum. A participant’s benefits under the Excess Pension Plan will vestconcurrently with the vesting of the participant’s benefits under the Pension Plan.
SERP. Our Supplemental Executive Retirement Plan (SERP) provides an additional benefit equal to 0.35 percent times the product ofthe participant’s years of credited service (maximum 35 years) multiplied by the excess of the participant’s average monthlycompensation over the lesser of 1.25 times the monthly average (without indexing) of the social security wage bases for the 35-yearperiod ending with the year the participant attains social security retirement age, or the monthly average of the social security wage
60

EXECUTIVE COMPENSATION
base in effect for the year that the participant retires. The participant’s most highly compensated consecutive 36 months of service areconsidered. The SERP benefit payment is made in a lump sum. A participant in the SERP will vest in the SERP benefit when he or shereaches age 55 (and has completed at least five years of credited service). An executive will become a participant in the SERP as of thedate he or she is selected and named in the minutes of the Compensation Committee for inclusion as a participant in the SERP.
Compensation for purposes of the Pension Plan, Excess Pension Plan, and SERP includes salary and bonus. No extra years ofcredited service have been granted to any of our named executive officers.
Nonqualified Deferred Compensation
The following table describes contributions by Valero and each named executive officer under our nonqualified defined contribution andother deferred compensation plans during 2019. The table also presents each named executive officer’s earnings, withdrawals (if any),and year-end balances in these plans.
ExecutiveContributionsin Last FY ($)
RegistrantContributions
in LastFY ($) (1)
AggregateEarnings inLast FY ($)
AggregateWithdrawals/
Distributions ($)
AggregateBalanceat LastFYE ($)
Joseph W. Gorder Excess Thrift Plan — 102,550 — — 1,411,478
Donna M. Titzman Excess Thrift Plan — 31,150 — — 785,911
R. Lane Riggs Excess Thrift Plan — 39,200 — — 403,859
UDS Nonqualified401(k) Plan (2) — — 4,066 — 47,883
Jason W. Fraser Excess Thrift Plan — 22,400 — — 96,258
Gary K. Simmons Excess Thrift Plan — 25,900 — — 303,061
UDS Nonqualified401(k) Plan (2) — — 27,849 — 124,877
Footnotes to Nonqualified Deferred Compensation table:
(1) All of the amounts included in this column are also included within the amounts reported as “All Other Compensation” for 2019 in the SummaryCompensation Table.
(2) Valero assumed the UDS Nonqualified 401(k) Plan when Valero acquired UDS in 2001. This plan is frozen.
Our Deferred Compensation Plan and Excess Thrift Plan are described in “Compensation Discussion and Analysis—Elements ofExecutive Compensation—Post-Employment Benefits.” The following terms also apply to these plans.
Under the Deferred Compensation Plan (DC Plan), participants may elect when and over what period of time their deferrals will bedistributed based on plan provisions. Participants may elect to have their accounts distributed in a lump sum on a specified date, atleast three-to-five years after the year of the deferral election. Participants may, at the time of their deferral elections, choose to havetheir accounts distributed as soon as reasonably practical following retirement or other termination, or on the first day of Januaryfollowing the date of retirement or termination. Participants may also elect to have their accounts distributed in one lump-sum paymentor in two- to 15-year installments upon retirement. Upon a participant’s death, the participant’s beneficiary will receive the participant’sDC Plan balance in one lump-sum payment within 90 days following the participant’s death. Upon a change in control of Valero, all DCPlan accounts are immediately vested in full, and distributions are thereafter made in accordance with the plan’s normal distributionprovisions. None of our named executive officers participated in the DC Plan in 2019.
The Excess Thrift Plan provides benefits to participants of our qualified thrift plan whose accounts would not otherwise be credited withcompany matching contributions due to certain IRS limits on contributions and/or compensation. The Excess Thrift Plan is neither aqualified plan for federal tax purposes nor a funded plan subject to ERISA. Two separate components comprise the Excess Thrift Plan:(i) an “excess benefit plan” as defined under Section 3(36) of ERISA; and (ii) a plan that is unfunded and maintained primarily for thepurpose of providing deferred compensation for a select group of management or highly compensated employees.
2020 PROXY STATEMENT 61

EXECUTIVE COMPENSATION
Potential Payments Upon Termination or Change of Control
CHANGE OF CONTROL SEVERANCE AGREEMENTS
Our executive officers have change of control severance agreements with Valero. The agreements seek to assure the continuedavailability of the officers in the event of a change of control of Valero. When a change of control occurs, the agreements becomeoperative for a fixed three-year period. The agreements provide that the officers’ terms of employment will not be changed materiallyduring the three years following a change of control. Each agreement subjects the officer to certain obligations of confidentiality, bothduring the term and after termination, for information relating to Valero that the officer acquired during his employment. The footnotesto the tables that accompany these disclosures further describe the terms and conditions of the agreements.
When determining the amounts and benefits payable under the agreements, the Compensation Committee and Valero sought tosecure compensation that is competitive in our market to recruit and retain executive talent. Consideration was given to the principaleconomic terms found in change of control severance agreements of other publicly traded companies.
POLICY FEATURES
Our Board has adopted a policy regarding the vesting of performance shares in a change-of-control context. The policy provides thatperformance shares will not vest automatically upon the date of a change of control of Valero. Instead, the performance shareagreements contain a double trigger feature, so that accelerated vesting of performance shares will not occur until the officer’semployment is terminated following a change of control. At that time, any unvested performance shares held by the officer will vest ona partial, pro rata basis, commensurate with the officer’s months of service during the applicable performance period.
Our change of control severance agreements do not contain tax gross-up benefits. In 2013, all agreements were amended to eliminatethe gross-up benefit that formerly entitled the officers to receive a payment to make them whole for any excise tax on excess parachutepayments imposed under Section 4999 of the Internal Revenue Code. Valero has adopted a policy that this benefit may not beincluded in any future change of control agreements.
TERMS AND CONDITIONS
For purposes of the agreements, “change of control” means any of the following (subject to additional particulars as stated in theagreements):
• acquisition by an individual, entity, or group of beneficial ownership of 20 percent or more of our outstanding Common Stock;• ouster from the Board of a majority of the incumbent directors;• consummation of a business combination (e.g., merger, share exchange).
In the agreements, “cause” is defined to mean, generally, the willful and continued failure of the officer to perform substantially theofficer’s duties or illegal or gross misconduct by the officer that is materially and demonstrably injurious to Valero. “Good reason” isdefined to mean, generally:
• a diminution in the executive officer’s position, authority, duties and responsibilities;• relocation of the executive (or increased travel requirements); or• failure of Valero’s successor to assume and perform under the agreement.
The following tables disclose potential payments (calculated per SEC regulations) to our named executive officers in connection with achange of control of Valero. If an officer’s employment is terminated for “cause,” the officer will not receive any benefits orcompensation other than accrued salary or vacation pay that was unpaid as of the date of termination; therefore, there is nopresentation of termination for “cause” in the following tables. Values in the tables assume that a change of control occurred onDec. 31, 2019, and that the officer’s employment was terminated on that date.
Mr. Gorder and Ms. Titzman have grandfathered forms of agreements entered into in 2007. The form of agreement for Messrs. Riggs,Fraser, and Simmons (entered into in 2016 and thereafter) represent the current form of agreement approved by our CompensationCommittee for our executive officers. The current form of agreement requires termination of employment following a change of control(double trigger) for accelerated vesting of stock options and restricted stock (the grandfathered agreements for Mr. Gorder andMs. Titzman accelerate vesting of stock options and restricted stock upon occurrence of the change of control). All forms of agreement
62

EXECUTIVE COMPENSATION
for our NEOs require a double trigger for the acceleration of performance shares. Other differences in benefits payable under thegrandfathered agreements and our current form of agreement are described in the footnotes to the following table.
Potential Payments Under Change of Control Severance Agreements
A. Termination of Employment (i) by the Company other thanfor “Cause” or (ii) by the Executive for “Good Reason” (1) ($)
Component of Payment Gorder Titzman Riggs Fraser Simmons
Salary (2) 5,235,000 1,450,000 1,680,000 1,200,000 1,300,000
Bonus (2) 13,875,000 1,684,000 1,680,000 960,000 845,000
Pension, Excess Pension, and SERP 10,270,498 2,785,082 — — —
Contributions under Defined Contribution Plans 366,450 101,500 — — —
Health & Welfare Plan Benefits (3) 80,337 49,790 60,168 60,168 60,168
Outplacement Services 25,000 25,000 25,000 25,000 25,000
Accelerated Vesting of Restricted Stock (4) 6,717,608 1,382,087 3,823,917 1,792,086 975,271
Accelerated Vesting of Performance Shares (5) 3,180,448 420,769 654,333 310,356 339,856
B. Continued Employment Following Change of Control (6) ($)
Component of Payment Gorder Titzman Riggs Fraser Simmons
Salary, Bonus, Pension, Excess Pension, SERP, Contributionsunder Defined Contribution Plans, Health & Welfare Benefits (6) (6) (6) (6) (6)
Accelerated Vesting of Restricted Stock (4) 6,717,608 1,382,087 — — —
Footnotes for Potential Payments Under Change of Control Severance Agreements tables:
(1) If the officer’s employment is terminated by the company other than for “cause,” or if the officer terminates his or her employment for “good reason,”the officer is generally entitled to receive the following:
(a) a lump sum cash payment equal to the sum of:
(i) accrued and unpaid compensation through the date of termination, including a pro-rata annual bonus (for this table, we assumed that theofficer’s bonus for the year of termination was paid at year-end);
(ii) two times (three times for Mr. Gorder, per his grandfathered form of agreement) the sum of (A) the officer’s annual base salary plus (B) theofficer’s eligible bonus amount;
(iii) the actuarial present value of the pension benefits (qualified and nonqualified) Mr. Gorder would have received for an additional three years ofservice (two years of service for Ms. Titzman) (Messrs. Riggs, Fraser, and Simmons do not participate in this element of compensation); and
(iv) for Mr. Gorder, the equivalent of three years (two years for Ms. Titzman) of employer contributions under Valero’s tax-qualified andsupplemental defined contribution plans (Messrs. Riggs, Fraser and Simmons do not participate in this element of compensation);
(b) continued welfare benefits for two years (three years for Mr. Gorder); and
(c) up to $25,000 of outplacement services.
If employment is terminated by reason of death or disability, the officer’s estate will be entitled to receive a lump sum cash payment equal to anyaccrued and unpaid salary and vacation pay plus a prorated bonus amount earned per the terms of the agreement. In the case of disability, theofficer would be entitled to disability and related benefits at least as favorable as those provided by Valero under its programs during the 120 daysprior to the officer’s termination of employment.
If the officer voluntarily terminates employment other than for “good reason,” he or she will be entitled to a lump sum cash payment equal to anyaccrued and unpaid salary and vacation pay plus a prorated bonus amount earned per the terms of the agreement.
2020 PROXY STATEMENT 63
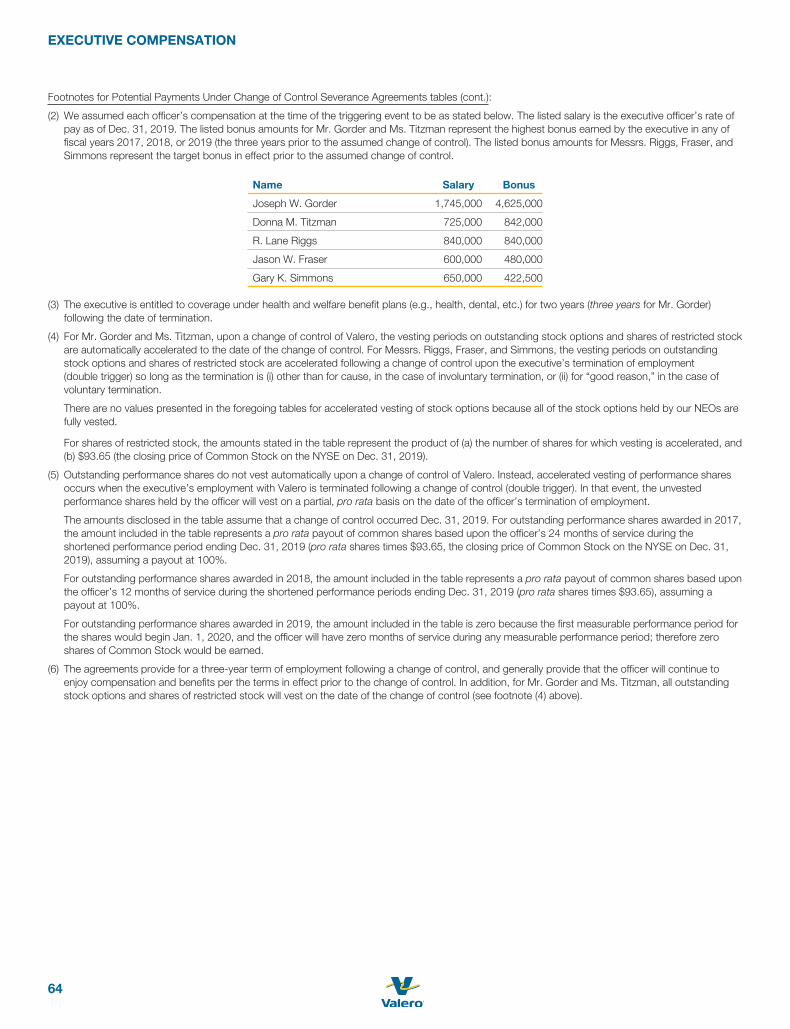
EXECUTIVE COMPENSATION
Footnotes for Potential Payments Under Change of Control Severance Agreements tables (cont.):
(2) We assumed each officer’s compensation at the time of the triggering event to be as stated below. The listed salary is the executive officer’s rate ofpay as of Dec. 31, 2019. The listed bonus amounts for Mr. Gorder and Ms. Titzman represent the highest bonus earned by the executive in any offiscal years 2017, 2018, or 2019 (the three years prior to the assumed change of control). The listed bonus amounts for Messrs. Riggs, Fraser, andSimmons represent the target bonus in effect prior to the assumed change of control.
Name Salary Bonus
Joseph W. Gorder 1,745,000 4,625,000
Donna M. Titzman 725,000 842,000
R. Lane Riggs 840,000 840,000
Jason W. Fraser 600,000 480,000
Gary K. Simmons 650,000 422,500
(3) The executive is entitled to coverage under health and welfare benefit plans (e.g., health, dental, etc.) for two years (three years for Mr. Gorder)following the date of termination.
(4) For Mr. Gorder and Ms. Titzman, upon a change of control of Valero, the vesting periods on outstanding stock options and shares of restricted stockare automatically accelerated to the date of the change of control. For Messrs. Riggs, Fraser, and Simmons, the vesting periods on outstandingstock options and shares of restricted stock are accelerated following a change of control upon the executive’s termination of employment(double trigger) so long as the termination is (i) other than for cause, in the case of involuntary termination, or (ii) for “good reason,” in the case ofvoluntary termination.
There are no values presented in the foregoing tables for accelerated vesting of stock options because all of the stock options held by our NEOs arefully vested.
For shares of restricted stock, the amounts stated in the table represent the product of (a) the number of shares for which vesting is accelerated, and(b) $93.65 (the closing price of Common Stock on the NYSE on Dec. 31, 2019).
(5) Outstanding performance shares do not vest automatically upon a change of control of Valero. Instead, accelerated vesting of performance sharesoccurs when the executive’s employment with Valero is terminated following a change of control (double trigger). In that event, the unvestedperformance shares held by the officer will vest on a partial, pro rata basis on the date of the officer’s termination of employment.
The amounts disclosed in the table assume that a change of control occurred Dec. 31, 2019. For outstanding performance shares awarded in 2017,the amount included in the table represents a pro rata payout of common shares based upon the officer’s 24 months of service during theshortened performance period ending Dec. 31, 2019 (pro rata shares times $93.65, the closing price of Common Stock on the NYSE on Dec. 31,2019), assuming a payout at 100%.
For outstanding performance shares awarded in 2018, the amount included in the table represents a pro rata payout of common shares based uponthe officer’s 12 months of service during the shortened performance periods ending Dec. 31, 2019 (pro rata shares times $93.65), assuming apayout at 100%.
For outstanding performance shares awarded in 2019, the amount included in the table is zero because the first measurable performance period forthe shares would begin Jan. 1, 2020, and the officer will have zero months of service during any measurable performance period; therefore zeroshares of Common Stock would be earned.
(6) The agreements provide for a three-year term of employment following a change of control, and generally provide that the officer will continue toenjoy compensation and benefits per the terms in effect prior to the change of control. In addition, for Mr. Gorder and Ms. Titzman, all outstandingstock options and shares of restricted stock will vest on the date of the change of control (see footnote (4) above).
64

DIRECTOR COMPENSATION
This table summarizes compensation earned by our directors in 2019.
Fees Earned or Paidin Cash ($) Stock Awards ($) (1) Total ($)
H. Paulett Eberhart 130,000 175,000 305,000
Joseph W. Gorder — — (2)
Kimberly S. Greene 130,000 175,000 305,000
Deborah P. Majoras 150,000 175,000 325,000
Eric D. Mullins — — (3)
Donald L. Nickles 130,000 175,000 305,000
Philip J. Pfeiffer 130,000 175,000 305,000
Robert A. Profusek 160,000 175,000 335,000
Stephen M. Waters 130,000 175,000 305,000
Randall J. Weisenburger 150,000 175,000 325,000
Rayford Wilkins, Jr. 150,000 175,000 325,000
Footnotes to Director Compensation table:
(1) The amounts shown represent the grant date fair value of stock unit awards granted in 2019, computed in compliance with FASB ASC Topic 718.Valero did not grant stock options to any director in 2019. The following table presents for each non-employee director nominee the number ofunvested restricted shares of Common Stock and stock units held as of Dec. 31, 2019. There are no outstanding stock options (vested or unvested)held by any of our non-employee directors.
NameUnvested
Restricted Stock
UnvestedStockUnits
H. Paulett Eberhart 903 2,164
Kimberly S. Greene 903 2,164
Deborah P. Majoras 903 2,164
Eric D. Mullins — —
Donald L. Nickles 903 2,164
Philip J. Pfeiffer 903 2,164
Robert A. Profusek 903 2,164
Stephen M. Waters 903 1,933
Randall J. Weisenburger 903 2,164
Rayford Wilkins, Jr. 903 2,164
(2) Mr. Gorder did not receive any compensation as director of Valero in 2019. His compensation for service as an executive officer in 2019 is presentedin this proxy statement in the compensation tables for our named executive officers.
(3) Mr. Mullins joined the Board on Jan. 23, 2020.
Our non-employee directors earn an annual cash retainer of $130,000. Valero pays an annual retainer in lieu of separate meeting fees.In addition to the retainer, in 2019, directors who chaired the Audit, Compensation, and Nominating/Governance and Public PolicyCommittees earned an additional $20,000 cash payment for their service as Chair, and Mr. Profusek earned an additional $30,000cash payment for his service as Lead Director. Directors are reimbursed for expenses of meeting attendance. Directors who areemployees of Valero do not receive compensation for serving as directors.
In addition to annual cash payments, in 2019, each non-employee director who was re-elected on the date of our annual stockholdersmeeting received an equity grant in the form of stock units (described below) valued at $175,000 (calculated pursuant to FASB ASCTopic 718). Grants of equity awards supplement the cash compensation paid to our non-employee directors and serve to increase our
2020 PROXY STATEMENT 65

DIRECTOR COMPENSATION
directors’ identification with the interests of our stockholders through ownership of Common Stock. Non-employee directors areexpected to hold shares of Common Stock having a value equal to five times the annual cash retainer and have five years from thedate of their initial election to the Board to meet that guideline.
Each stock unit represents the right to receive one share of Valero Common Stock, and is scheduled to vest (become nonforfeitable) infull on the date of Valero’s next annual meeting of stockholders for the election of directors. Directors may elect to defer receipt of thecommon shares for an additional one-year following the vesting date of the stock units. The stock unit award includes a dividendequivalent award, representing the right to receive, on the vesting date of the stock unit award, a payment in cash in an amount equalto the cumulative amount of dividends paid to holders of Common Stock during the period when the stock unit remained outstandingprior to vesting — calculated as if each stock unit held by the director was an outstanding share of Common Stock.
The Compensation Committee reviews our director compensation program at least annually with assistance and input from ourcompensation consultant. The annual review includes an assessment of the director compensation programs of our peers and ofindustry trends and developments. On Sept. 5, 2019, following our Compensation Committee’s review of our non-employee directorcompensation program and the programs of our peers, the Board adopted certain changes to our director compensation program.These changes, effective Jan. 1, 2020, are (i) an increase in the value of annual equity awards to $200,000, (ii) an increase in LeadDirector pay to $35,000 per year, and (iii) an increase in committee chair pay to $25,000 per year. The annual cash retainer of$130,000 for each director remained unchanged. The changes were approved to more closely align our program with that of our peersand with general industry practice.
The Board previously approved a limitation on the amount of equity compensation that may be paid to our non-employee directors inany year. The limitation was implemented via an amendment to our 2011 Omnibus Stock Incentive Plan (the same limitation iscontained in the proposed 2020 Omnibus Stock Incentive Plan). The limitation provides that a non-employee director may not receivein any calendar year awards payable in shares of Common Stock that have a fair market value greater than $500,000 in the aggregate.We selected $500,000 as the amount of the limitation because we believe that it places a meaningful limit on awards to our non-employee directors. While the amount of equity compensation awarded to our non-employee directors in recent years has beenconsiderably lower than this limit, we believe that setting a limitation at this level provides us with a reasonable degree of flexibility tomake adjustments that we may in the future deem appropriate or necessary for our compensation program to remain competitive inthe market.
66
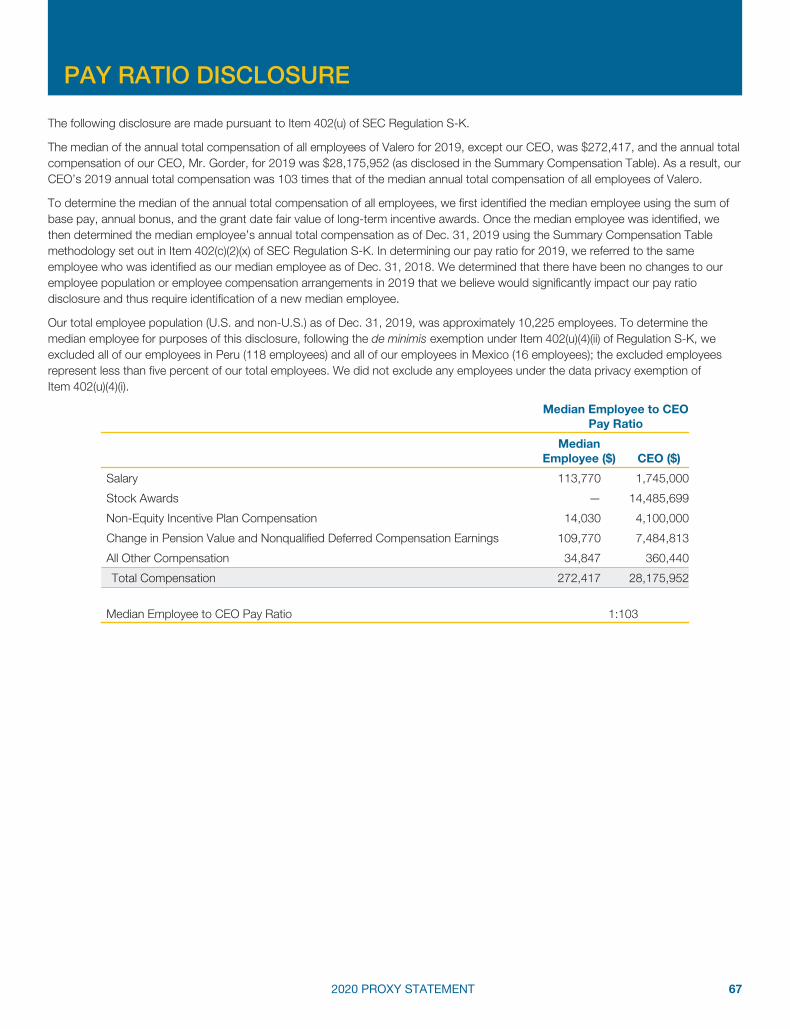
PAY RATIO DISCLOSURE
The following disclosure are made pursuant to Item 402(u) of SEC Regulation S-K.
The median of the annual total compensation of all employees of Valero for 2019, except our CEO, was $272,417, and the annual totalcompensation of our CEO, Mr. Gorder, for 2019 was $28,175,952 (as disclosed in the Summary Compensation Table). As a result, ourCEO’s 2019 annual total compensation was 103 times that of the median annual total compensation of all employees of Valero.
To determine the median of the annual total compensation of all employees, we first identified the median employee using the sum ofbase pay, annual bonus, and the grant date fair value of long-term incentive awards. Once the median employee was identified, wethen determined the median employee’s annual total compensation as of Dec. 31, 2019 using the Summary Compensation Tablemethodology set out in Item 402(c)(2)(x) of SEC Regulation S-K. In determining our pay ratio for 2019, we referred to the sameemployee who was identified as our median employee as of Dec. 31, 2018. We determined that there have been no changes to ouremployee population or employee compensation arrangements in 2019 that we believe would significantly impact our pay ratiodisclosure and thus require identification of a new median employee.
Our total employee population (U.S. and non-U.S.) as of Dec. 31, 2019, was approximately 10,225 employees. To determine themedian employee for purposes of this disclosure, following the de minimis exemption under Item 402(u)(4)(ii) of Regulation S-K, weexcluded all of our employees in Peru (118 employees) and all of our employees in Mexico (16 employees); the excluded employeesrepresent less than five percent of our total employees. We did not exclude any employees under the data privacy exemption ofItem 402(u)(4)(i).
Median Employee to CEOPay Ratio
MedianEmployee ($) CEO ($)
Salary 113,770 1,745,000
Stock Awards — 14,485,699
Non-Equity Incentive Plan Compensation 14,030 4,100,000
Change in Pension Value and Nonqualified Deferred Compensation Earnings 109,770 7,484,813
All Other Compensation 34,847 360,440
Total Compensation 272,417 28,175,952
Median Employee to CEO Pay Ratio 1:103
2020 PROXY STATEMENT 67

CERTAIN RELATIONSHIPS AND RELATED TRANSACTIONS
Review
Our Board adopted a Related Party Transaction Policy to establish procedures for the notification, review, approval, ratification, anddisclosure of related party transactions. Under the policy, a related party transaction is a transaction, arrangement, or relationship inwhich (i) Valero (including any of its subsidiaries) was, is or will be a participant, (ii) the amount involved exceeds $120,000, and (iii) any“related person” had, has or will have a direct or indirect material interest. Under the policy, a related person means, generally, anyperson who would be deemed to be a “related person” as defined in Item 404 of SEC’s Regulation S-K. Under the policy, a relatedparty transaction must be submitted to the Board’s Nominating/Governance and Public Policy Committee for review and approval. Thepolicy is available on our website at www.valero.com > Investors > Corporate Governance > Governance Documents.
We also have a Conflict of Interest Policy to address instances in which an employee or director’s private interests may conflict with theinterests of Valero. The policy is published on our intranet website. We have a Conflicts of Interest Committee (composed of Valeroemployees) to help administer our conflicts policy and to determine whether any employee or director’s private interests may interferewith the interests of Valero. Conflicts of interest are also addressed in our Code of Business Conduct and Ethics. Any waiver of anyprovision of this code for executive officers or directors may be made only by the Board, and will be promptly disclosed as required bylaw or NYSE rule.
68

PROPOSAL NO. 2—RATIFY APPOINTMENT OF KPMG LLPAS INDEPENDENT AUDITORS
(ITEM 2 ON THE PROXY CARD)
The Audit Committee determined on Feb. 26, 2020, to engage KPMG LLP (“KPMG”) as Valero’s independent registered publicaccounting firm for the fiscal year ending Dec. 31, 2020. KPMG has served as Valero’s independent registered public accounting firmsince 2004.
The Audit Committee is directly responsible for the appointment, compensation determination, retention, and oversight of theindependent auditors retained to audit Valero’s financial statements. The Audit Committee is responsible for the audit fee negotiationsand fee approval associated with Valero’s retention of the independent auditing firm.
The Audit Committee annually reviews and evaluates the qualifications, performance, and independence of Valero’s independentauditing firm, and reviews and evaluates the lead partner of the independent auditor team. In conjunction with the mandated rotation ofthe audit firm’s lead engagement partner, the Audit Committee is involved in the selection of the audit firm’s new lead engagementpartner. To monitor auditor independence, the Audit Committee periodically considers whether there should be a rotation of theindependent auditing firm.
The members of the Audit Committee and the Board believe that the continued retention of KPMG to serve as Valero’s independentregistered public accounting firm for the fiscal year ending Dec. 31, 2020, is in the best interests of Valero and its investors.Accordingly, the Board requests stockholder approval of the following resolution.
“RESOLVED, that the appointment of the firm of KPMG LLP as Valero’s independent registered public accounting firm for thepurpose of conducting an audit of the consolidated financial statements and the effectiveness of internal control over financialreporting of Valero and its subsidiaries for the fiscal year ending Dec. 31, 2020, is hereby approved and ratified.”
Representatives of KPMG are expected to be present at the Annual Meeting to respondto appropriate questions raised at the Annual Meeting or make appropriate statements atthe Annual Meeting. The Board recommends that the
stockholders vote “FOR” thisproposal.
The affirmative vote of a majority of the voting power of the shares present in person or by proxy and entitled to vote is required foradoption of this proposal. If the appointment is not approved, the adverse vote will be considered as an indication to the AuditCommittee that it should select another independent registered public accounting firm for the following year. Because of the difficultyand expense of making any substitution of public accountants so long after the beginning of the current year, it is contemplated thatthe appointment for 2020 will be permitted to stand unless the Audit Committee finds other good reason for making a change.
2020 PROXY STATEMENT 69

KPMG LLP FEES
The following table presents fees for services provided to us by KPMG for the years shown ($ in millions).
2019 2018
Audit Fees (1) 8.7 9.0
Audit-Related Fees (2) 0.4 0.4
Tax Fees (3) 0.2 0.5
All Other Fees (4) — —
total 9.3 9.9
Notes:
(1) Represents fees for professional services rendered for the audit of the annual financial statements included in Valero’s annual reports on Form 10-K,review of Valero’s interim financial statements included in Valero’s Forms 10-Q, the audit of the effectiveness of Valero’s internal control over financialreporting, and services that are normally provided by the principal auditor (e.g., comfort letters, statutory audits, attest services, consents, andassistance with and review of documents filed with the SEC).
(2) Represents fees for assurance and related services that are reasonably related to the performance of the audit or review of Valero’s financialstatements and not reported under the caption for Audit Fees. The fees listed above are related primarily to the audit of Valero’s benefit plans.
(3) Represents fees for professional services rendered by KPMG for tax compliance and tax consulting services. For 2019 and 2018, the fees relateprimarily to property tax consulting and compliance services.
(4) Category represents fees for professional services, if any, other than the services reported under the preceding captions.
Audit Committee Pre-Approval Policy
The Audit Committee adopted a pre-approval policy to address the pre-approval of certain services rendered to Valero by itsindependent auditor. The text of that policy appears in Exhibit 99.01 to Valero’s Annual Report on Form 10-K for the year endedDec. 31, 2017.
All of the services rendered by KPMG to Valero for 2019 were pre-approved specifically by the Audit Committee or pursuant to our pre-approval policy. None of the services provided by KPMG were approved by the Audit Committee under the pre-approval waiverprovisions of paragraph (c)(7)(i)(C) of Rule 2-01 of Regulation S-X.
70

REPORT OF THE AUDIT COMMITTEE FOR FISCAL YEAR 2019
Management is responsible for Valero’s internal controls and financial reporting process. KPMG LLP (KPMG), Valero’s independentregistered public accounting firm for the fiscal year ended Dec. 31, 2019, is responsible for performing an independent audit of Valero’sconsolidated financial statements in accordance with the standards of the Public Company Accounting Oversight Board (PCAOB), andan audit of the effectiveness of Valero’s internal control over financial reporting in accordance with the standards of the PCAOB, and toissue KPMG’s reports thereon. The Audit Committee monitors and oversees these processes. The Audit Committee approves theselection and appointment of Valero’s independent registered public accounting firm and recommends the ratification of its selectionand appointment to our Board.
The Audit Committee has reviewed and discussed Valero’s audited financial statements with management and KPMG. The committeehas discussed with KPMG the matters required to be discussed by the applicable requirements of the PCAOB and the SEC. Thecommittee has received the written disclosures and the letter from KPMG required by applicable requirements of the PCAOB regardingthe independent accountant’s communications with the audit committee concerning independence, and has discussed with KPMGthat firm’s independence.
Based on the foregoing review, discussions, and other matters the Audit Committee deemed relevant and appropriate, the committeerecommended to the Board that the audited financial statements of Valero be included in its Annual Report on Form 10-K for the yearended Dec. 31, 2019, for filing with the SEC.
Members of the Audit Committee:
Randall J. Weisenburger, ChairmanH. Paulett EberhartStephen M. Waters
The material in this Report of the Audit Committee is not “soliciting material,” is not deemed filed with the SEC, and is not to beincorporated by reference in any of Valero’s filings under the Securities Act or the Exchange Act, respectively, whether made before orafter the date of this proxy statement and irrespective of any general incorporation language therein.
2020 PROXY STATEMENT 71
PROPOSAL NO. 3—ADVISORY VOTE TO APPROVECOMPENSATION OF NAMED EXECUTIVE OFFICERS
(ITEM 3 ON THE PROXY CARD)
Our Board and our stockholders have determined to hold an advisory vote on executive compensation (“say-on-pay”) every year.Accordingly, we are asking stockholders to vote to approve the 2019 compensation of our named executive officers as suchcompensation is disclosed pursuant to Item 402 of the SEC’s Regulation S-K, including the Compensation Discussion and Analysis,the compensation tables, and other narrative compensation disclosures required by Item 402. This proxy statement contains all ofthese required disclosures.
We request the stockholders to approve the following resolution:
“RESOLVED, that the compensation paid to Valero’s named executive officers, as disclosed pursuant to Item 402 of RegulationS-K, including the Compensation Discussion and Analysis, compensation tables, and narrative discussion, is hereby approved.”
Because the vote on this proposal is advisory, it will not affect compensation already paid or awarded to any named executive officerand will not be binding on Valero, the Board, or the Compensation Committee. The Board and Compensation Committee, however,will review the voting results and take into account the outcome in determining future annual compensation for the named executiveofficers.
Proxies will be voted for approval of the proposal unless otherwise specified. Approval ofthis proposal requires the affirmative vote of a majority of the shares present in person orrepresented by proxy at the meeting and entitled to vote on the proposal. The Board recommends that the
stockholders vote “FOR” thisproposal.
72

PROPOSAL NO. 4—APPROVE THE 2020 OMNIBUSSTOCK INCENTIVE PLAN
(ITEM 4 ON THE PROXY CARD)
We are asking stockholders to approve the Valero Energy Corporation 2020 Omnibus Stock Incentive Plan (the “2020 OSIP”). TheCompensation Committee and the Board of Directors have approved the 2020 OSIP, subject to approval by Valero’s stockholders.
The Board requests that you approve the following resolution.
RESOLVED, that the stockholders hereby approve the Valero Energy Corporation 2020 Omnibus Stock Incentive Plan.
The affirmative vote of a majority of the voting power of the shares present in person or byproxy and entitled to vote is required for adoption of this proposal. Pursuant to rules of theNYSE, brokers will not have discretion to vote on this proposal. The Board recommends that
stockholders vote “FOR” thisproposal.
The purpose of the 2020 OSIP is to attract and retain the services of eligible individuals, to provide them with a proprietary interest inValero, and to motivate them using stock-based incentives linked to long-range performance goals and the interests of Valero’sstockholders.
Our employees, non-employee directors, and third-party services providers will be eligible to participate in the 2020 OSIP. As ofJan. 31, 2020, we had 10,222 employees and 10 non-employee directors. On March 4, 2020, the closing price of our Common Stockon the NYSE was $64.15 per share.
With the 2020 OSIP, we are seeking approval for a total number of shares equal to the sum of:
(1) 8,580,000, plus
(2) any shares of Common Stock available for grant under the 2011 OSIP (defined below) as of the date when the 2020 OSIP isapproved by Valero’s stockholders, plus
(3) shares of Common Stock previously subject to awards under the 2011 OSIP or 2020 OSIP that are forfeited, terminated,canceled or rescinded, settled in cash in lieu of Common Stock, or exchanged for awards that do not involve Common Stock,or expire unexercised on or after the effective date of the 2020 OSIP.
No awards or grants have been made under the 2020 OSIP, and no awards or grants will be made under the 2020 OSIP unless it isapproved by the stockholders. We will register the shares to be issued from the 2020 OSIP on a registration statement on Form S-8 assoon as practicable after stockholder approval of the plan. If the 2020 OSIP is not approved by the stockholders, it will not becomeeffective.
We presently use our 2011 Omnibus Stock Incentive Plan (2011 OSIP) for stock-based awards. If stockholders approve the2020 OSIP, no further awards will be made under the 2011 OSIP and it will be terminated. Additional information about our stock-based compensation plans is provided in this proxy statement under the caption, “Equity Compensation Plan Information.”
As of Dec. 31, 2019, we had 7,740,665 shares available for issuance under the 2011 OSIP.
As of Feb. 28, 2020, we had 7,202,491 shares available for issuance under the 2011 OSIP. The decrease is due primarily to the 2020grants of annual long-term incentive awards made to our executive officers on Feb. 26, 2020.
As shown in the following table, the total number of shares subject to outstanding stock options, restricted shares, performance sharesand stock units under the 2011 OSIP as of Feb. 28, 2020 was 2,167,923.
2020 PROXY STATEMENT 73

PROPOSAL NO. 4—APPROVE THE 2020 OMNIBUS STOCK INCENTIVE PLAN
The following provides information about outstanding equity awards under the 2011 OSIP as of Dec. 31, 2019, and Feb. 28, 2020.
2011 OSIP
Outstanding Stock Options
as oftotal #
outstandingweighted average
exercise priceweighted average
remaining term
Dec. 31, 2019 349,462 $ 34.94 3.33 yrs
Feb. 28, 2020 349,462 $ 34.94 3.17 yrs
Total # of other outstanding equity awards
RestrictedStock
PerformanceShares (target)
StockUnits
Dec. 31, 2019 1,091,854 499,857 19,245
Feb. 28, 2020 1,267,275 531,186 20,000
Dilution and Run Rate
The 7,202,491 shares available under the 2011 OSIP as of Feb. 28, 2020, and the 8,580,000 new shares being requested for the2020 OSIP, represent 1.76% and 2.10%, respectively, and 3.86% in the aggregate of our 408,932,677 common shares outstandingas of Feb. 28, 2020. No additional awards will be made under the 2011 OSIP upon approval of the 2020 OSIP by the stockholders.
The following table describes the run rate with respect to equity awards issued under the 2011 OSIP. The run rate is determined bydividing the sum of (i) restricted shares granted, (ii) stock units granted, (iii) common shares earned upon the settlement of performanceshares, and (iv) stock options granted, by the basic weighted-average total shares of our outstanding Common Stock for the pertinentyear. A calculation of our run rate for the last three fiscal years appears below:
Fiscal YearRestricted
Shares GrantedStock Units
Granted
Common SharesEarned fromSettlement of
Performance Shares
StockOptionsGranted Total
Basic Weighted AverageCommon Shares
Outstanding Run Rate
2019 677,482 19,245 29,714 — 726,441 413,225,530 0.18%
2018 628,908 14,013 217,485 — 860,406 426,437,617 0.20%
2017 739,393 — 318,400 — 1,057,793 441,619,203 0.24%
Three-Year Average Run Rate 0.21%
Anticipated Awards to Participants
Because awards under the 2020 OSIP would be granted at the discretion of the Compensation Committee, it is not possible for us todetermine the amount of awards that may be granted from the 2020 OSIP to the named executive officers listed in the SummaryCompensation Table or to any other potential participants.
Summary
The following summary of the material terms of the 2020 OSIP does not purport to be complete and is subject to and qualified in itsentirety by reference to the complete text of the 2020 OSIP, which is attached to this proxy statement as Appendix A. If this summaryconflicts with the terms of the Plan, the terms of the Plan will govern. In this summary:
• “shares” means Valero’s $0.01 par value common stock;• “stock unit” means a unit or right whose value is based on the value of a share;• “Plan” means the 2020 Omnibus Stock Incentive Plan; and• “Committee” means the Compensation Committee of the Board.
74

PROPOSAL NO. 4—APPROVE THE 2020 OMNIBUS STOCK INCENTIVE PLAN
Administration. The Plan is administered by the Committee. The Committee is composed of directors appointed by the Board whoare non-employee directors, as defined by Rule 16b-3 of the Securities Exchange Act of 1934. The Committee is authorized, subject tothe terms of the Plan, to determine which participants will receive awards, the times when such awards will be made, the times whensuch awards will vest, the types of awards, the number of shares to be issued under the awards, and other terms and conditions ofawards.
Share Counting. All awards granted under the Plan will be counted against the aggregate number of shares that may be awardedunder the Plan on a one-for-one basis. If an award granted under the Plan is subsequently forfeited or cancelled without the paymentof consideration, then, subject to the terms of the Plan, the shares allocable to the forfeited or cancelled portion of the award will beadded back to the aggregate number available for grant under the Plan, and may again be subject to an award granted under the Plan.
If, however, shares are delivered or tendered to Valero for repurchase to satisfy the exercise price of an option award, those sharesmay not be added back to the aggregate number of shares available for grants under the Plan. In addition, if any shares are withheldfrom issuance to satisfy tax obligations associated with an award, those shares will count against the aggregate number of sharesavailable for future grants under the Plan.
Limitations on Awards. The following limitations apply:
• The exercise price of stock options cannot be less than 100 percent of the fair market value of a share at the time the optionis granted.
• The grant price of a stock appreciation right (“SAR”) cannot be less than 100 percent of the fair market value of a share at thetime the SAR is granted.
• Repricing or the cashing out of stock options and SARs is not permitted, subject to limited exceptions in connection withcertain extraordinary transactions affecting Valero as further specified in the Plan.
• No participant may receive during any calendar year awards that are to be settled in shares covering an aggregate of morethan 1,000,000 shares.
• A non-employee director may not receive in any calendar year awards that are to be settled in shares having an aggregate fairmarket value that is greater than $500,000.
• No participant may receive during any calendar year awards that are to be settled in cash covering an aggregate of more than$20,000,000.
• The terms of awards may not exceed 10 years.• The Plan does not contain an evergreen provision.
Vesting. No award granted under the Plan shall become exercisable or vested prior to the one-year anniversary of the award’s date ofgrant; provided, however, that, such restriction shall not apply to awards granted under the Plan with respect to the number of shareswhich, in the aggregate, does not exceed five percent of the total number of shares that were authorized to be issued as awards underthe Plan.
Types of Awards. The Plan permits grants of: (i) restricted stock and restricted stock units; (ii) stock options (including incentive andnon-qualified stock options); (iii) SARs; (iv) performance awards of cash, stock, or other securities; and (v) other stock-based awards(e.g., stock unit awards). Awards may be granted alone, in addition to, or in combination with, any other awards under the Plan or anyother compensation plan. Awards can be granted for cash or other consideration as determined by the Committee or as required byapplicable law (or for no cash consideration). Awards may provide that upon the grant or exercise thereof, the holder will receive cash,shares or other securities, or any combination of these.
Restricted Stock and Restricted Stock Units. Restricted stock is an award of shares subject to a restriction period specified in theaward. During the restriction period, the shares may not be transferred or pledged and are subject to forfeiture. Potential events offorfeiture include early termination of employment. The holder is otherwise usually treated as a registered stockholder with the right toreceive dividends and vote the shares during the restriction period. Restricted stock units are similar to restricted stock except that theaward takes the form of stock units instead of shares. During the restriction period, a holder of restricted stock units may be paid cash(dividend equivalents) that are equal in timing and amount to share dividends, but does not have voting or other stockholder rights. Theunits may be settled in cash or shares.
Stock Options and Stock Appreciation Rights. Stock options give the holder the right to purchase shares at the exercise pricespecified in the award. SARs give the holder the right to receive an amount in cash or shares equal to the spread between the exerciseprice specified in the award and the market price of a share at the time of exercise. SARs may be granted alone or with stock options.Stock options and SARs granted under the Plan are subject to the terms and conditions determined by the Committee, except that theexercise price cannot be less than 100 percent of the fair market value of a share at the time of the grant and the maximum term is
2020 PROXY STATEMENT 75

PROPOSAL NO. 4—APPROVE THE 2020 OMNIBUS STOCK INCENTIVE PLAN
10 years. The Committee determines the form in which payment of the exercise price may be made. Incentive Stock Options may begranted, provided that they meet the requirements of the Internal Revenue Code. Stock options and SARs generally are subject toforfeiture upon a participant’s termination of employment or service.
Performance Awards. Performance awards that may be granted under the Plan may consist of a right payable in cash, shares, othersecurities or other property upon the achievement of certain performance goals. The Committee shall determine the performance goalsto be achieved during any performance period, the length of any performance period, the amount of any performance award, and theamount of any payment or transfer to be made pursuant to any performance award. Performance awards may be paid in a lump sum,installments, on a deferred basis or otherwise as prescribed by the Committee. Performance awards generally are subject to forfeitureupon a participant’s termination of employment or service. Performance goals may be particular to a Plan participant, may relate to theperformance of Valero or one of its subsidiaries or divisions, or a combination thereof.
Stock Compensation and Other Stock-Based Awards. The Committee may grant other forms of awards based on, payable in, orotherwise related in whole or in part to shares under the Plan. Subject to the terms of the Plan, the Committee shall determine the termsand conditions of any such other stock-based awards. The number and type of shares to be distributed in lieu of the cash compensationapplicable to any award as well as the terms and conditions of any bonus awards shall be determined by the Committee.
Adjustments. The Committee may make appropriate adjustments in the number of shares available under the Plan to reflect anystock split, stock dividend, recapitalization, reorganization, consolidation, merger, combination or exchange of shares, distribution tostockholders, liquidation, dissolution, or other similar event.
Change of Control. Upon a change of control as defined in the Plan, the Committee generally is authorized to cause outstandingawards to be assumed, or new rights substituted therefor, by the surviving entity in the change of control. In addition, subject toapplicable laws, any change of control agreement or any policy previously adopted by the Board, for participants whose employmenthas been terminated in connection with the change of control, the Committee may accelerate vesting periods, provide for extendedexercise periods (for options), or waive other conditions applicable to the outstanding awards so that the terminated participant’soutstanding awards may be vested, exercised, paid, or distributed in full on or before a date fixed by the Committee. Also inconnection with a participant’s termination of employment as a result of the change of control, the Committee may provide for thepurchase of outstanding awards from the participant for cash.
Amendment/Limitations on Amendments. The Committee, or as applicable, the Board, may terminate or amend the Plan withoutparticipant or stockholder approval, except that stockholder approval is required for any amendment that would require stockholderapproval under the rules of the NYSE, or as otherwise may be required by applicable rule or regulation. No option or SAR may becanceled and replaced with an option or SAR having a lower exercise price, except in connection with a stock dividend, stock split orsimilar event as specified in the Plan in order to prevent dilution or enlargement of benefits intended under the Plan.
Effective Date and Termination. The Plan will become effective on the date of its approval by Valero’s stockholders. If the Plan isapproved at the 2020 annual meeting, it will continue in force for a period of ten years, after which no additional awards may be madeunder the Plan.
Federal Income Tax Consequences
The following discussion summarizes certain federal income tax consequences of the issuance and receipt of 2020 OSIP awards. Therules governing the tax treatment of such awards are complex, so the following discussion of tax consequences is necessarily generalin nature and is not complete. In addition, statutory provisions are subject to change, as are their interpretations, and their applicationmay vary in individual circumstances. This summary does not purport to cover all federal employment tax or other federal taxconsequences associated with the 2020 OSIP, nor does it address state, local, or non-U.S. taxes. The 2020 OSIP is not qualifiedunder the provisions of Section 401(a) of the Internal Revenue Code (Code), and is not subject to the provisions of the EmployeeRetirement Income Security Act of 1974.
Options, SARs, Performance Unit Awards, Restricted Stock Unit Awards and Other Stock-Based Awards. A participantgenerally is not required to recognize income on the grant of an option, SAR, restricted stock unit award, performance unit award orother stock-based award. Instead, ordinary income generally is required to be recognized on the date the option or SAR is exercised(but see the discussion on Incentive Stock Options), or in the case of restricted stock unit awards, performance unit awards or otherstock-based awards, upon the issuance of shares and/or the payment of cash pursuant to the terms of the award when the awardvests. In general, the amount of ordinary income required to be recognized is: (a) in the case of an option, an amount equal to theexcess, if any, of the fair market value of the shares on the exercise date over the exercise price; (b) in the case of a SAR, the fairmarket value of any shares or cash received upon exercise; and (c) in the case of restricted stock unit awards, performance unitawards or other stock-based awards, the amount of cash and/or the fair market value of any shares received in respect thereof.
76

PROPOSAL NO. 4—APPROVE THE 2020 OMNIBUS STOCK INCENTIVE PLAN
Incentive Stock Options. When a participant is granted an incentive stock option, or when the participant exercises the incentivestock option, the participant will generally not recognize taxable income (except for purposes of alternative minimum tax). If theparticipant holds the shares for at least two years from the date of grant, and one year from the date of exercise, then any gain or losswill be treated as long-term capital gain or loss. If, however, the shares are disposed of during this period, the option will be treated asa non-qualified stock option, and the participant will recognize ordinary income equal to the lesser of the fair market value of the shareson the exercise date minus the exercise price or the amount realized on disposition minus the exercise price. Any gain in excess of theordinary income portion will be taxable as long-term or short-term capital gain.
Cash-Based Awards. Upon payment of a cash-based award, a participant is required to recognize ordinary income in the amount ofthe award.
Restricted Stock and Performance Share Awards. Unless a participant who receives an award of restricted stock or performanceshares makes an election under Section 83(b) of the Code as described below, the participant generally is not required to recognizeordinary income on the award of restricted stock or performance shares. Instead, on the date the shares vest (i.e., become transferableand no longer subject to forfeiture), the participant will be required to recognize ordinary income in an amount equal to the excess, ifany, of the fair market value of the shares on such date over the amount, if any, paid for such shares. If a Section 83(b) election has notbeen made, any dividends received with respect to restricted stock or performance shares that are subject at that time to a risk offorfeiture or restrictions on transfer generally will be treated as compensation that is taxable as ordinary income to the recipient. If aparticipant makes a Section 83(b) election within 30 days of the date of transfer of the restricted stock or performance shares, theparticipant will recognize ordinary income on the date the shares are awarded. The amount of ordinary income required to berecognized is an amount equal to the excess, if any, of the fair market value of the shares on the date of award over the amount, if any,paid for such shares. In such case, the participant will not be required to recognize additional ordinary income when the shares vest.
Gain or Loss on Sale or Exchange of Shares. In general, gain or loss from the sale or exchange of shares granted or awardedunder the 2020 OSIP will be treated as capital gain or loss, provided that the shares are held as capital assets at the time of the sale orexchange.
Deductibility by Valero. To the extent that a participant recognizes ordinary income in the circumstances described above, Valero willbe entitled to a corresponding deduction, provided that, among other things, the income meets the test of reasonableness, is anordinary and necessary business expense, is not disallowed by Section 162(m) of the Code and is not an “excess parachute payment”within the meaning of Section 280G of the Code (see the discussions on Section 162(m) and Parachute Payments below).
Section 162(m). Section 162(m) of the Code generally limits the deductibility of compensation paid to certain top executives to $1million. In previous years, there was an exemption from this $1 million deduction limit for compensation payments that qualified as“performance-based” under applicable regulations. However, the enactment of the Tax Cuts and Jobs Act of 2017 eliminated theperformance-based compensation exemption, except with respect to certain grandfathered arrangements. Prospectively, for payvehicles granted and earned in 2019 and beyond, the Tax Cuts and Jobs Acts of 2017 eliminated the deductibility of most componentsof pay to certain top executives to the extent that such pay exceeds $1 million in a year. Consistent with Valero’s historic approach todeductibility under former Section 162(m), the Committee will continue to exercise flexibility and discretion in determining whether anygiven form of pay should be designed and administered to qualify for full deductibility.
Parachute Payments. Under the provisions of Section 280G of the Code, the accelerated vesting of options and benefits paid underother awards in connection with a change in control of a corporation may be required to be valued and taken into account indetermining whether participants have received compensatory payments, contingent upon a change in control, in excess of certainlimits. If these limits are exceeded, a portion of the amounts payable to the participant may be subject to an additional 20 percentfederal tax and may be nondeductible to the corporation.
Withholding. Awards under the 2020 OSIP may be subject to tax withholding. When an award results in income subject towithholding, we may require the participant to remit the withholding amount to Valero or cause our shares to be withheld from issuanceor sold in order to satisfy the tax withholding obligations.
Section 409A. Section 409A of the Code (Section 409A) applies to compensation plans providing deferred compensation to employees,directors and consultants, and potentially could apply to the different awards available under the 2020 OSIP. Generally, to the extent thatdeferrals of these awards fail to meet certain requirements under Section 409A, such awards will be subject to immediate taxation andtax penalties in the year they vest unless the requirements of Section 409A are satisfied. Valero’s intent is that awards under the2020 OSIP will be structured and administered in a manner that either complies with or is exempt from the requirements ofSection 409A. If any provision or award under the 2020 OSIP would result in the imposition of an applicable tax under Section 409A andrelated regulations and Treasury pronouncements, then that provision or award may be reformed to avoid imposition of the applicabletax and no action taken to comply with Section 409A shall be deemed to adversely affect the participant’s rights to an award.
2020 PROXY STATEMENT 77

MISCELLANEOUS
Governance Documents and Codes of Ethics
Our Code of Ethics for Senior Financial Officers applies to our principal executive officer, principal financial officer, and controller. Thecode charges these officers with responsibilities regarding honest and ethical conduct, the preparation and quality of the disclosures indocuments and reports we file with the SEC, and compliance with applicable laws, rules, and regulations. We have also adopted aCode of Business Conduct and Ethics which applies to all of our employees and directors.
We post the following documents on our website at www.valero.com > Investors > Corporate Governance > Governance Documents.A printed copy of these documents is available to any stockholder upon request. Requests for documents must be in writing anddirected to Valero’s Secretary at the address indicated on the cover page of this proxy statement.
• Restated Certificate of Incorporation• Bylaws• Code of Business Conduct and Ethics• Code of Ethics for Senior Financial Officers• Corporate Governance Guidelines• Audit Committee Charter• Compensation Committee Charter• Nominating/Governance and Public Policy Committee Charter• Related Party Transactions Policy• Compensation Consultant Disclosures Policy• Policy on Executive Compensation in Restatement Situations• Policy on Political Contributions, Lobbying, and Trade Associations• Policy on Vesting of Performance Shares• Health, Safety and Environmental Policy• Human Rights Policy
Stockholder Communications, Nominations, and Proposals
Stockholders and other interested parties may communicate with the Board, its non-management directors, or the Lead Director bysending a written communication addressed to “Board of Directors,” “Non-Management Directors,” or “Lead Director” in care ofValero’s Secretary at the address indicated on the cover page of this proxy statement.
In order to submit a stockholder proposal for inclusion in our proxy statement for the 2021 annual meeting of stockholders pursuant toRule 14a-8 of the Exchange Act, we must receive your written proposal on or before Nov. 20, 2020. The proposal must comply withRule 14a-8, which lists the requirements for the inclusion of stockholder proposals in company-sponsored proxy materials.
To present a stockholder proposal at the 2021 annual meeting of stockholders that is not the subject of a proposal pursuant to Rule 14a-8 of the Exchange Act, or to recommend to the Board’s Nominating/Governance and Public Policy Committee the nomination of a personfor election to the Board, you must follow the procedures stated in Article I, Section 9 of our bylaws. These procedures include therequirement that your proposal must be delivered to Valero’s Secretary not later than the close of business on the 90th day or earlier thanthe close of business on the 120th day prior to the first anniversary of the preceding year’s annual meeting. If the date of the annualmeeting is more than 30 days before or more than 60 days after such anniversary date, your notice must be delivered not earlier than theclose of business on the 120th day prior to such annual meeting and not later than the close of business on the later of the 90th day priorto such annual meeting or the 10th day following the day we publicly announce the date of the 2021 annual meeting of stockholders.
An eligible stockholder, or eligible group of stockholders, that wants to nominate a candidate for election to the Board pursuant to theproxy access provisions of our bylaws must follow the procedures stated in Article I, Section 9A of our bylaws. These proceduresinclude the requirement that your nomination must be delivered to Valero’s Secretary not later than the close of business on the 120thday or earlier than the close of business on the 150th day prior to the first anniversary of the preceding year’s annual meeting. If thedate of the annual meeting is more than 30 days before or more than 60 days after such anniversary date, your notice must bedelivered not later than the 120th day prior to such annual meeting or, if later, the 10th day following the day we publicly announce thedate of the 2021 annual meeting of stockholders. Our bylaws are available on our website at www.valero.com > Investors > CorporateGovernance > Governance Documents. Stockholders are urged to review all applicable rules and consult legal counsel beforesubmitting a nomination or proposal to Valero.
78

MISCELLANEOUS
Other Business
If any matters not referred to in this proxy statement properly come before the Annual Meeting or any adjournments or postponementsthereof, the enclosed proxies will be deemed to confer discretionary authority on the individuals named as proxies to vote the sharesrepresented by proxy in accordance with their best judgments. The Board is not currently aware of any other matters that may bepresented for action at the Annual Meeting.
Financial Statements
Consolidated financial statements and related information for Valero, including audited financial statements for the fiscal year endedDec. 31, 2019, are contained in Valero’s Annual Report on Form 10-K. We have filed our Annual Report on Form 10-K with the SEC.You may review this report on the internet as indicated in the Notice and through our website (www.valero.com > Investors > FinancialInformation > SEC Filings).
Householding
The SEC’s rules allow companies to send a single Notice or single copy of annual reports, proxy statements, prospectuses, and otherdisclosure documents to two or more stockholders sharing the same address, subject to certain conditions. These “householding”rules are intended to provide greater convenience for stockholders, and cost savings for companies, by reducing the number ofduplicate documents that stockholders receive. If your shares are held by an intermediary broker, dealer, or bank in “street name,” yourconsent to householding may be sought, or may already have been sought, by or on behalf of the intermediary. If you prefer to receiveyour own set of proxy materials now or in future years, you may request a duplicate set by phone at 800-579-1639, or you maycontact your broker.
Transfer Agent
Computershare Investor Services serves as our transfer agent, registrar, and dividend paying agent with respect to our CommonStock. Correspondence relating to any stock accounts, dividends, or transfers of stock certificates should be addressed to:
Computershare Investor ServicesShareholder Communications
by regular mail:P.O. Box 505000Louisville, KY 40233-5000
by overnight delivery:462 South 4th StreetSuite 1600Louisville, KY 40202
(888) 470-2938(312) 360-5261www.computershare.com
2020 PROXY STATEMENT 79


Appendix A
VALERO ENERGY CORPORATION2020 OMNIBUS STOCK INCENTIVE PLAN
This Valero Energy Corporation 2020 Omnibus Stock Incentive Plan (hereinafter called the “Plan”) was approved by the Company’sBoard on February 26, 2020, and subject to approval by the Company’s stockholders, the Plan will become effective as of the EffectiveDate. Upon the Effective Date, no further awards will be granted under the Prior Plan and it will be terminated.
ARTICLE 1. PURPOSE
The purpose of the Plan is to attract and retain the services of eligible individuals, to provide them with a proprietary interest in theCompany, and to motivate them using stock-based incentives linked to long-range performance goals and the interests of theCompany’s stockholders.
ARTICLE 2. DEFINITIONS
For the purpose of the Plan, unless the context requires otherwise, the following terms shall have the meanings indicated:
2.1 “Affiliate” shall mean any corporation or other entity (including, but not limited to, a partnership or a limited liability company),that is affiliated with the Company through stock or equity ownership or otherwise, and is designated as an Affiliate for purposes of thisPlan by the Committee.
2.2 “Award” means the grant of any Incentive Stock Option, Non-qualified Stock Option, SAR, Restricted Stock, Restricted StockUnit, Stock Unit Award, Performance Share, Performance Unit, Performance Cash, Other Stock Based Awards, or Dividend Equivalentwhether granted singly, in combination or in tandem (each individually referred to herein as an “Incentive”).
2.3 “Award Agreement” means a written or electronic agreement between a Participant and the Company, which contains theterms of the grant of an Award.
2.4 “Award Period” means the period during which one or more Incentives granted under an Award may be exercised or earned.
2.5 “Board” means the board of directors of the Company.
2.6 “Cause” means the:
(a) conviction of the Participant by a state or federal court of (i) a felony involving moral turpitude or (ii) embezzlement ormisappropriation of funds of the Company,
(b) the Company’s reasonable determination that the Participant has (i) committed an act of fraud, embezzlement, theft, ormisappropriation of funds in connection with such Participant’s duties in the course of his or her employment with theCompany (or applicable Subsidiary), or (ii) engaged in gross mismanagement, negligence or misconduct that causes orcould potentially cause material loss, damage or injury to the Company, any of its Subsidiaries, or their respectiveemployees, or
(c) the Company’s reasonable determination that (i) the Participant has violated any company policy, including but not limitedto, policies regarding sexual harassment, insider trading, confidentiality, substance abuse and/or conflicts of interest,which violation could result in the termination of the Participant’s employment or service as a Non-employee Director, or(ii) the Participant has failed to satisfactorily perform the material duties of the Participant’s position with the Company orany of its Subsidiaries.
2.7 “Change of Control.” A Change of Control shall be deemed to occur when:
(a) following approval by the stockholders of the Company, an agreement or transaction is consummated pursuant towhich: (i) the Company merges or consolidates with any other Person (other than a wholly owned subsidiary of theCompany) and is not the surviving entity (or in which the Company survives only as the subsidiary of another entity);(ii) the Company sells all or substantially all of its assets to any other Person (other than a wholly owned subsidiary of theCompany); or (iii) the Company is liquidated or dissolved; or
2020 PROXY STATEMENT A-1

(b) consummation by any “person” or “group” of a tender offer or exchange offer for 20 percent or more of the Shares thenoutstanding, or for any number or amount of Shares which, if the tender or exchange offer were to be fully subscribedand all Shares for which the tender or exchange offer is made were to be purchased or exchanged pursuant to the offer,would result in the acquiring person or group directly or indirectly beneficially owning 50 percent or more of the Sharesthen outstanding; or
(c) individuals who, as of any date, constitute the Board (the “Incumbent Board”) thereafter cease for any reason toconstitute at least a majority of the Board, provided that any individual becoming a director whose election, or nominationfor election by the Company’s stockholders, was approved by a vote of at least a majority of the directors thencomprising the Incumbent Board shall be considered as though such individual were a member of the Incumbent Board,but excluding, for this purpose, any such individual whose initial assumption of office occurs as a result of an actual orthreatened election contest with respect to the election or removal of directors or other actual or threatened solicitation ofproxies or consents by or on behalf of a person or group other than the Board.
2.8 “Code” means the Internal Revenue Code of 1986, as amended, together with the published rulings, regulations, andinterpretations promulgated thereunder.
2.9 “Committee” means the Compensation Committee of the Board or such other Committee appointed or designated by theBoard to administer the Plan in accordance with Article 3 of this Plan.
2.10 “Common Stock” means the Company’s $0.01 par value common stock, which the Company is currently authorized to issueor may in the future be authorized to issue.
2.11 “Company” means Valero Energy Corporation, a Delaware corporation, and any successor entity.
2.12 “Date of Grant” means the effective date on which an Award is made to a Participant as set forth in the applicable AwardAgreement.
2.13 “Dividend Equivalent” means an Award, designated as a Dividend Equivalent, granted to Participants pursuant to Section 6.8hereof, or in conjunction with other Awards, the value of which is determined, in whole or in part, by the value of payments tied to orbased on the payment of dividends to holders of Common Stock and may be conditioned on the attainment of Performance Goals in amanner deemed appropriate by the Committee and described in the Award Agreement.
2.14 “Effective Date” means the date this Plan is duly approved by the Company’s stockholders.
2.15 “Employee” means common law employee (as defined in accordance with the Regulations and Revenue Rulings thenapplicable under Section 3401(c) of the Code) of the Company or any Subsidiary, or an individual who has agreed to become anemployee of the Company or any Subsidiary and actually becomes such an employee within six months of such agreement.
2.16 “Fair Market Value” of a share of Common Stock is the mean of the highest and lowest prices per share on the New YorkStock Exchange on the pertinent date, or in the absence of reported sales on such day, then on the next following day for which saleswere reported.
2.17 “Good Reason” means that the Participant’s employment may be terminated by the Employee for Good Reason following aChange of Control, or anytime within two years following the date of Change of Control, when Good Reason means:
(a) The assignment to the Employee of any duties inconsistent in any respect with the Employee’s position (including status,offices, titles and reporting requirements), authority, duties, or responsibilities or any other action by the Company thatresults in a diminution in such position’s, authority, duties, or responsibilities, excluding for this purpose an isolated,insubstantial , and inadvertent action not taken in bad faith and that is remedied by the Company promptly after receiptof notice thereof given by the Employee;
(b) Any reduction in the Employee’s base salary, annual incentive target opportunity, and/or long-term incentive targetopportunity below the level at which the Employee was awarded compensation immediately prior to the Change ofControl;
(c) The Company’s requiring that the Employee to be based at any office or location other than the location at which theEmployee was based immediately preceding the Change of Control or a location other than the principal executiveoffices of the Company, without the Employee’s written consent; or
(d) Any requirement for the Employee to travel on Company business to a substantially greater extent than requiredimmediately prior to the Change of Control.
A-2

2.18 “Incentive” means an Award under the Plan as defined by Section 2.2 of Article 2.
2.19 “Incentive Stock Option” or “ISO” means an incentive stock option within the meaning of Section 422 of the Code, grantedpursuant to this Plan.
2.20 “Limited SAR” or “Limited Stock Appreciation Right” means an Award designated as an SAR as defined in this Article 2, whichis granted with certain limiting features as determined by the Committee and as set forth in the Award Agreement at the time of grant.
2.21 “Limited SAR Price” means the Fair Market Value of each share of Common Stock covered by a Limited SAR on the Date ofGrant of the Limited SAR.
2.22 “Non-Employee Director” means a member of the Board who is not an Employee or, for purposes of eligibility to receive anAward under the Plan and become a Participant, also includes a member of the board of directors or board of managers at any Affiliateor Subsidiary.
2.23 “Non-qualified Stock Option” or “NQSO” means a stock option, granted pursuant to this Plan that is not intended to complywith the requirements set forth in Section 422 of the Code.
2.24 “NYSE” means the New York Stock Exchange.
2.25 “Option Price” means the price which must be paid by a Participant upon exercise of a Stock Option to purchase a share ofCommon Stock.
2.26 “Other Stock Based Awards” means an Award granted pursuant to Section 6.8.
2.27 “Participant” shall mean an Employee, Non-Employee Director, or Third Party Service Provider to whom an Award is grantedunder this Plan.
2.28 “Performance Award” means an Award made pursuant to this Plan to a Participant that is subject to the attainment of one ormore Performance Goals. Performance Awards may be in the form of Performance Shares, Performance Units, Performance Cash, orDividend Equivalents.
2.29 “Performance Cash” means an Award, designated as Performance Cash and denominated in cash, granted to a Participantpursuant to Section 6.7 hereof, the value of which is conditioned, in whole or in part, by the attainment of Performance Goals in amanner deemed appropriate by the Committee and described in the Award Agreement.
2.30 “Performance Criteria” or “Performance Goals” or “Performance Measures” mean the objectives established by theCommittee for a Performance Period, for the purpose of determining when an Award subject to such objectives is earned.
2.31 “Performance Period” means the time period designated by the Committee during which Performance Goals must be met.
2.32 “Performance Share” means an Award, designated as a Performance Share in the form of shares of Common Stock or othersecurities of the Company, granted to a Participant pursuant to Section 6.7 hereof, the value of which is determined, in whole or inpart, by the value of Common Stock and/or conditioned on the attainment of Performance Goals in a manner deemed appropriate bythe Committee and described in the Award Agreement.
2.33 “Performance Unit” means an Award, designated as a Performance Unit, granted to a Participant pursuant to Section 6.7hereof, the value of which is determined, in whole or in part, by the attainment of Performance Goals in a manner deemed appropriateby the Committee and described in the Award Agreement.
2.34 “Person” shall mean any individual, corporation, partnership, association, joint-stock company, trust, unincorporatedorganization, government or political subdivision thereof or other entity.
2.35 “Plan” means this Valero Energy Corporation 2020 Omnibus Stock Incentive Plan, as amended from time to time.
2.36 “Prior Plan” means the Valero Energy Corporation 2011 Omnibus Stock Incentive Plan, as amended from time to time.
2.37 “Restricted Stock” means shares of Common Stock issued or transferred to a Participant pursuant to Section 6.4 of this Planthat are subject to restrictions or limitations set forth in this Plan and in the related Award Agreement.
2.38 “Restricted Stock Unit” means a fixed or variable dollar-denominated right to acquire Common Stock, which may or may notbe subject to restrictions, contingently awarded under Section 6.4 of the Plan.
2020 PROXY STATEMENT A-3

2.39 “Retirement” means any termination of service due to retirement upon attainment of certain age and/or service requirementsas specified by the Company’s qualified retirement program(s) or successor programs or as determined by the Committee in the eventof early retirement.
2.40 “SAR” or “Stock Appreciation Right” means the right to receive a payment, in cash and/or Common Stock, equal to theexcess of the Fair Market Value of a specified number of shares of Common Stock on the date the SAR is exercised over the SARPrice for such shares, and may be granted as a Limited SAR.
2.41 “SAR Price” means the Fair Market Value of each share of Common Stock covered by an SAR on the Date of Grant of theSAR.
2.42 “SEC” shall mean the Securities and Exchange Commission.
2.43 “Share” means a share of Common Stock.
2.44 “Stock Option” means a Non-qualified Stock Option or an Incentive Stock Option.
2.45 “Stock Unit Award” means awards of Common Stock or other awards pursuant to Section 6.8 hereof that are valued in wholeor in part by reference to, or are otherwise based on, shares of Common Stock or other securities of the Company.
2.46 “Subsidiary” means any entity for which Valero Energy Corporation is the ultimate parent company and in which all of theequity, partnership, member or other interests are owned by Valero Energy Corporation or another one of its Subsidiaries.“Subsidiaries” means more than one of any such entities.
2.47 “Third Party Service Provider” means any consultant, agent, advisor, or independent contractor who renders services to theCompany, a Subsidiary, or an Affiliate that (a) are not in connection with the offer and sale of the Company’s securities in a capitalraising transaction, and (b) do not directly or indirectly promote or maintain a market for the Company’s securities.
ARTICLE 3. ADMINISTRATION
3.1 The Committee shall administer the Plan unless otherwise determined by the Board. The administering Committee shallconsist of not fewer than three persons. Any member of the Committee may be removed at any time, with or without cause, byresolution of the Board; and any vacancy occurring in the membership of the Committee may be filled by appointment by the Board onthe recommendation of the Nominating/Governance and Public Policy Committee of the Board.
3.2 The Board shall select one of the members of the Committee to act as the Committee’s Chair. A majority of the Committeeshall constitute a quorum, and the act of a majority of the members of the Committee present at a meeting at which a quorum ispresent shall be the act of the Committee.
3.3 The Committee shall determine and designate from time to time the eligible persons to whom Awards will be granted andshall set forth in each related Award Agreement the Award Period, the Date of Grant, and such other terms and conditions as may beapproved by the Committee not inconsistent with the Plan. The Committee shall determine whether an Award shall include one type ofIncentive, two or more Incentives granted in combination, or two or more Incentives granted in tandem.
3.4 The Committee, in its discretion, shall (i) interpret the Plan, (ii) prescribe, amend, and rescind any rules and regulationsnecessary or appropriate for the administration of the Plan, and (iii) make such other determinations and take such other action as itdeems necessary or advisable in the administration of the Plan. Any interpretation, determination, or other action made or taken by theCommittee shall be final, binding, and conclusive on all interested parties.
3.5 With respect to restrictions in the Plan that are based on the requirements of Rule 16b-3 under the Securities Exchange Act of1934, Section 422 of the Code, the rules of the NYSE or any exchange or inter-dealer quotation system upon which the Company’ssecurities are listed or quoted, or any other applicable law, rule or restriction (collectively, “applicable law”), to the extent that any suchrestrictions are no longer required by applicable law, the Committee shall have the sole discretion and authority to grant Awards thatare not subject to such mandated restrictions and/or to waive any such mandated restrictions with respect to outstanding Awards.
3.6 Subject to the terms of the Plan and applicable law, the Committee may delegate to one or more officers or managers of theCompany or any Affiliate, or to a committee of such officers or managers, the authority, subject to the terms and limitations theCommittee shall determine, to grant Awards or to cancel, modify or waive rights with respect to, or to amend, suspend, or terminateAwards.
A-4
ARTICLE 4. ELIGIBILITY
Employees (including Employees who are also a director or an officer), Non-Employee Directors, and Third Party Service Providers areeligible to participate in the Plan. The Committee, in its discretion, may grant, but shall not be required to grant, an Award to anyEmployee, Non-Employee Director, or Third Party Service Provider. Awards may be granted by the Committee at any time and fromtime to time selectively to one or more new Participants, or to then Participants, or to a greater or lesser number of Participants, andmay include or exclude previous Participants, all as the Committee shall determine. Except as may be required by the Plan, Awardsneed not be uniform.
ARTICLE 5. SHARES SUBJECT TO PLAN
5.1 Total Shares Available. Subject to adjustment as provided in Articles 12 and 13, the maximum number of shares of CommonStock that may be delivered pursuant to Awards granted under the Plan is the sum of (a) 8,580,000, plus (b) any shares of CommonStock available for grants of Awards under the Prior Plan as of the Effective Date, plus (c) shares of Common Stock previously subject toAwards under the Plan or the Prior Plan that are forfeited, terminated, cancelled or rescinded, settled in cash in lieu of Common Stock, orexchanged for Awards that do not involve Common Stock, or expire unexercised on or after the Effective Date.
5.2 Source of Shares. Shares to be issued may be made available from authorized but unissued Common Stock, CommonStock held by the Company in its treasury, or Common Stock purchased by the Company on the open market or otherwise. During theterm of this Plan, the Company will at all times reserve and keep available a number of shares of Common Stock that shall be sufficientto satisfy the requirements of this Plan.
5.3 Restoration and Retention of Shares (“Share Counting”). If any shares of Common Stock subject to an Award shall not beissued or transferred to a Participant and shall cease to be issuable or transferable to a Participant because of the forfeiture,termination, expiration or cancellation, in whole or in part, of such Award or for any other reason, or if any such shares shall, afterissuance or transfer, be reacquired by the Company because of the Participant’s failure to comply with the terms and conditions of anAward or for any other reason, the shares not so issued or transferred, or the shares so reacquired by the Company, as the case maybe, shall no longer be charged against the limitation provided for in Section 5.1 and may be used thereafter for additional Awards underthe Plan. The following additional parameters shall apply:
(a) To the extent an Award under the Plan is settled or paid in cash, Shares subject to such Award will not be considered tohave been issued and will not be applied against the maximum number of shares of Common Stock provided for inSection 5.1.
(b) If an Award may be settled in shares of Common Stock or cash, such shares shall be deemed issued only when and tothe extent that settlement or payment is actually made in shares of Common Stock. To the extent an Award is settled orpaid in cash, and not shares of Common Stock, any Shares previously reserved for issuance or transfer pursuant to suchAward will again be deemed available for issuance or transfer under the Plan, and the maximum number of shares ofCommon Stock that may be issued or transferred under the Plan shall be reduced only by the number of Shares actuallyissued and transferred to the Participant.
(c) Notwithstanding the foregoing: (i) Shares withheld or tendered to pay withholding taxes or the exercise price of an Awardshall not again be available for the grant of Awards under the Plan, and (ii) the full number of Shares subject to a StockOption or SAR granted that are settled by the issuance of Shares shall be counted against the Shares authorized forissuance under this Plan, regardless of the number of Shares actually issued upon the settlement of such Stock Optionor SAR.
(d) Any Shares repurchased by the Company on the open market using the proceeds from the exercise of an Award shallnot increase the number of Shares available for the future grant of Awards.
5.4 Uncertificated Shares. Shares issued under the Plan will be registered in uncertificated book-entry form (unless a holder ofCommon Stock requests a certificate representing such holder’s shares of Common Stock). As a result, instead of receiving CommonStock certificates, holders of Common Stock will receive account statements reflecting their ownership interest in shares of CommonStock. The book-entry Shares will be held with the Company’s transfer agent, which will serve as the record keeper for all shares ofCommon Stock being issued in connection with the Plan. Computershare Investor Services, Chicago, Illinois, currently serves astransfer agent, registrar and dividend paying agent for the Common Stock. Correspondence relating to any stock accounts, dividendsor transfers of Common Stock should be addressed to: Computershare Investor Services Shareholder Communications, P.O. Box505000, Louisville, KY 40233-5000, (888) 470-2938 or (312) 360-5261, www.computershare.com.
2020 PROXY STATEMENT A-5

ARTICLE 6. GRANTS OF AWARDS
6.1 In General.
(a) The grant of an Award shall be authorized by the Committee and may be evidenced by an Award Agreement setting forth theIncentive or Incentives being granted, the total number of shares of Common Stock subject to the Incentive(s) or the value ofthe Performance Award (if applicable), the Option Price (if applicable), the Award Period, the Date of Grant, and such otherterms as are approved by the Committee not inconsistent with the Plan. The Company may execute an Award Agreementwith a Participant after the Committee approves the issuance of an Award. Any Award granted pursuant to this Plan must begranted within 10 years of the Effective Date of this Plan. The grant of an Award to a Participant shall not be deemed either toentitle the Participant to, or to disqualify the Participant from, receipt of any other Award under the Plan.
(b) If the Committee establishes a Date of Grant purchase price for an Award, the Participant must pay such purchase pricewithin 30 days (or such shorter period as the Committee may specify) after the Date of Grant.
6.2 Limitations on Awards
(a) The Plan is subject to the following additional limitations:
(i) The Option Price of Stock Options cannot be less than 100 percent of the Fair Market Value of a share of CommonStock on the Date of Grant of the Stock Option.
(ii) The SAR Price of an SAR cannot be less than 100 percent of the Fair Market Value of a share of Common Stock onthe Date of Grant of the SAR.
(iii) Repricing of Stock Options and SARs or other downward adjustments in the Option Price or SAR Price of previouslygranted Stock Options or SARs, respectively, are prohibited, except in connection with a corporate transactioninvolving the Company such as any stock dividend, stock split, extraordinary cash dividend, recapitalization,reorganization, merger, consolidation, split-up, spin-off, combination, or exchange of shares, provided that the termsof outstanding Awards may not be amended without stockholder approval to reduce the exercise price ofoutstanding Stock Options or SARs or cancel outstanding Stock Options or SARs in exchange for cash, otherawards or Stock Options or SARs having an exercise price that is less than the exercise price of the original StockOption or SAR.
(iv) No Participant may receive during any calendar year Awards that are to be settled in Shares of Common Stockcovering an aggregate of more than 1,000,000 Shares. In addition, a Participant who is a Non-Employee Directormay not receive in any calendar year Awards that are to be settled in Shares having a Fair Market Value (measured onthe Date(s) of Grant) that is greater than $500,000 in the aggregate.
(v) No Participant may receive during any calendar year Awards that are to be settled in cash covering an aggregate ofmore than $20,000,000.
(vi) The term of Awards may not exceed 10 years.
(b) Limited SARs granted in tandem with Stock Options or other Awards shall not be counted towards the maximum individualgrant limitation set forth in this Section, as the Limited SAR will expire based on conditions described in Section 6.5(b), below.
6.3 Rights as Stockholder. Except as provided in Section 6.4 of this Plan, until the issuance of the Shares of Common Stock (asevidenced by the appropriate entry on the books of the Company or its transfer agent), no right to vote or receive dividends or anyother rights as a stockholder of the Company shall exist with respect to such Shares, notwithstanding the exercise of any Incentive orAward. No adjustment will be made for a dividend or other rights for which the record date is prior to the date Shares are issued,except as otherwise provided in this Plan.
6.4 Restricted Stock/Restricted Stock Units. If Restricted Stock and/or Restricted Stock Units are granted to a Participant underan Award, the Committee shall establish: (i) the number of shares of Restricted Stock and/or the number of Restricted Stock Unitsawarded, (ii) the price, if any, to be paid by the Participant for such Restricted Stock and/or Restricted Stock Units, (iii) the time(s) withinwhich such Award may be subject to forfeiture, (iv) specified Performance Goals of the Company, a Subsidiary, any division thereof orany group of Employees of the Company, or other criteria, if any, which the Committee determines must be met in order to remove anyrestrictions (including vesting) on such Award, and (v) all other terms of the Restricted Stock and/or Restricted Stock Units, which shallbe consistent with this Plan. The provisions of Restricted Stock and/or Restricted Stock Units need not be the same with respect toeach Participant.
A-6

(a) Record of Shares. Each Participant who is awarded Restricted Stock shall be issued the number of shares of CommonStock specified in the Award Agreement for such Restricted Stock, and such shares shall be recorded in the sharetransfer records of the Company and ownership of such shares shall be evidenced by a book entry notation in the sharetransfer records of the Company’s transfer agent. Such shares shall be registered in the name of the Participant, subjectto any restrictions in effect for the Award.
(b) Restrictions and Conditions. Shares of Restricted Stock and Restricted Stock Units shall be subject to the followingrestrictions and conditions:
(i) Subject to the other provisions of this Plan and the terms of the particular Award Agreements, during such period asmay be determined by the Committee commencing on the Date of Grant (the “Restriction Period”), the Participantshall not be permitted to sell, transfer, pledge or assign shares of Restricted Stock and/or Restricted Stock Units.
(ii) Except as provided in subparagraph (i) above and subject to the terms of a Participant’s Award Agreement, theParticipant shall have, with respect to his or her Restricted Stock, all of the rights of a stockholder of the Company,including the right to vote the Shares, and the right to receive any dividends thereon. Certificates or other evidenceof ownership of shares of Common Stock free of restriction under this Plan shall be delivered to the Participantpromptly after, and only after, the Restriction Period shall expire without forfeiture in respect of such shares ofCommon Stock. Each Participant, by his or her acceptance of Restricted Stock, shall irrevocably grant to theCompany a power of attorney to transfer any forfeited Shares to the Company and agrees to execute anydocuments requested by the Company in connection with such forfeiture and transfer.
(iii) The Restriction Period of Restricted Stock and/or Restricted Stock Units shall commence on the Date of Grant and,subject to Article 13 of the Plan, unless otherwise established by the Committee in the Award Agreement settingforth the terms of the Restricted Stock and/or Restricted Stock Units, shall expire upon satisfaction of the conditionsset forth in the Award Agreement; such conditions may provide for vesting based on (i) length of continuous service,(ii) achievement of specific business objectives, (iii) increases in specified indices, (iv) attainment of specified growthrates, or (v) other comparable Performance Measurements, as may be determined by the Committee in its solediscretion.
(c) Forfeiture. Except as otherwise determined by the Committee or the Chief Executive Officer, the provisions of Article 8shall apply with respect to Restricted Stock granted hereunder.
6.5 SARs and Limited SARs.
(a) An SAR shall entitle the Participant at his or her election to surrender to the Company the SAR, or portion thereof, as theParticipant shall choose, and to receive from the Company in exchange therefore cash in an amount equal to the excess(if any) of the Fair Market Value (as of the date of the exercise of the SAR) per share over the SAR Price per sharespecified in the Award Agreement with respect to such SAR, multiplied by the total number of shares of the SAR beingsurrendered. In the discretion of the Committee, the Company may satisfy its obligation upon exercise of an SAR by thedistribution of that number of shares of Common Stock having an aggregate Fair Market Value (as of the date of theexercise of the SAR) equal to the amount of cash otherwise payable to the Participant (with a cash settlement to bemade for any fractional share interests), or the Company may settle such obligation in part with shares of Common Stockand in part with cash.
(b) A Limited SAR shall allow the Participant to receive from the Company cash in an amount equal to the excess (if any) ofthe Fair Market Value (as of the date of the exercise of the Limited SAR) per share over the Limited SAR Price per sharespecified in such Limited SAR, multiplied by the total number of shares of the Limited SAR being surrendered. In thediscretion of the Committee, the Company may satisfy its obligation upon exercise of a Limited SAR by the distribution ofthat number of shares of Common Stock having an aggregate Fair Market Value (as of the date of the exercise of theLimited SAR) equal to the amount of cash otherwise payable to the Participant (with a cash settlement to be made forany fractional share interests), or the Company may settle such obligation in part with shares of Common Stock and inpart with cash. Limited SARs will expire without consideration upon the vesting, exercise, or settlement, in shares and/orin cash, of Awards for which the Limited SAR was granted in tandem.
6.6 Tandem Awards. The Committee may grant two or more Incentives in one Award in the form of a “tandem award,” so thatthe right of the Participant to exercise one Incentive shall be canceled if, and to the extent, the other Incentive is exercised. Forexample, if a Stock Option and an SAR are issued in a tandem Award, and the Participant exercises the SAR with respect to 100shares of Common Stock, the right of the Participant to exercise the related Stock Option shall be canceled to the extent of 100 sharesof Common Stock.
2020 PROXY STATEMENT A-7

6.7 Performance Based Awards.
(a) Grant of Performance Awards. The Committee may issue Performance Awards in the form of Performance Units,Performance Shares, Performance Cash, Other Stock Based Awards, or Dividend Equivalents to Participants subject tothe Performance Goals and Performance Period as it shall determine. The terms and conditions of each PerformanceAward will be set forth in the Award Agreement. The Committee shall have complete discretion in determining thenumber and/or value of Performance Awards granted to each Participant. Participants receiving Performance Awards arenot required to pay the Company therefor (except for applicable tax withholding) other than the rendering of services.
(b) Value of Performance Awards. The Committee shall set Performance Goals in its discretion for each Participant who isgranted a Performance Award. Such Performance Goals may be particular to a Participant, may relate to theperformance of the Subsidiary or division which employs him or her, may be based on the performance of the Companygenerally, or a combination of the foregoing. The Performance Goals may be based on achievement of financialstatement objectives, or any other objectives established by the Committee. The Performance Goals may be absolute intheir terms or measured in relationship to other companies similarly or otherwise situated. The extent to which suchPerformance Goals are met will determine the number and/or value of the Performance Awards that will be paid out tothe Participant and/or the portion of an Award that may be exercised by the Participant.
(c) Form of Payment. Payment of the amount to which a Participant shall be entitled upon the settlement of a PerformanceAward shall be made in a lump sum or installments in cash, shares of Common Stock, or a combination thereof asdetermined by the Committee. Dividend Equivalents may not be paid on unvested Performance Shares.
6.8 Other Stock Based Awards.
(a) Grant of Other Stock Based Awards. The Committee may issue to Participants, either alone or in addition to otherAwards made under the Plan, Stock Unit Awards which may be in the form of Common Stock or other securities. Thevalue of each such Award shall be based, in whole or in part, on the value of the underlying Common Stock or othersecurities. The Committee, in its discretion, may determine that an Award, either in the form of a Stock Unit Award underthis Section or as an Award granted pursuant to the other provisions of this Article, may provide to the Participant(i) dividends or Dividend Equivalents (payable on a current or deferred basis, except not for Stock Options and unvestedSARs) and (ii) cash payments in lieu of or in addition to an Award. The Committee shall determine the terms, restrictions,conditions, vesting requirements, and payment rules (all of which are sometimes hereinafter collectively referred to as“rules”) of the Award and shall set forth those rules in the related Award Agreement.
(b) Rules for Stock Unit Awards. The Committee, in its sole and complete discretion, may grant a Stock Unit Award subjectto the following rules:
(i) All rights with respect to such Stock Unit Awards granted to a Participant under the Plan shall be exercisable duringhis or her lifetime only by such Participant or his or her guardian or legal representative.
(ii) Stock Unit Awards may require the payment of cash consideration by the Participant in receipt of the Award orprovide that the Award, and any Common Stock or other securities issued in conjunction with the Award bedelivered without the payment of cash consideration.
(iii) The Committee, in its sole and complete discretion, may establish certain Performance Criteria that may relate inwhole or in part to receipt of the Stock Unit Awards.
(iv) Stock Unit Awards may be subject to a deferred payment schedule and/or vesting over a specified employmentperiod.
ARTICLE 7. AWARD PERIOD; VESTING
7.1 Award Period. Subject to the other provisions of this Plan, no Incentive granted under the Plan may be exercised at any timeafter the end of its Award Period.
7.2 Vesting. No Award granted under the Plan shall become exercisable or vested prior to the one-year anniversary of the Date ofGrant; provided, however, that, such restriction shall not apply to Awards granted under this Plan with respect to a number of Shareswhich, in the aggregate, does not exceed five percent (5%) of the total number of Shares authorized under Section 5.1 of the Plan fordelivery in connection with Awards under the Plan, as such number may be adjusted in accordance with Article 12 and Article 13. ThisSection 7.2 shall not restrict the right of the Committee to provide for the acceleration or continued vesting or exercisability of an Awardupon or after a Change of Control or termination of employment or otherwise pursuant to the terms of the Plan.
A-8
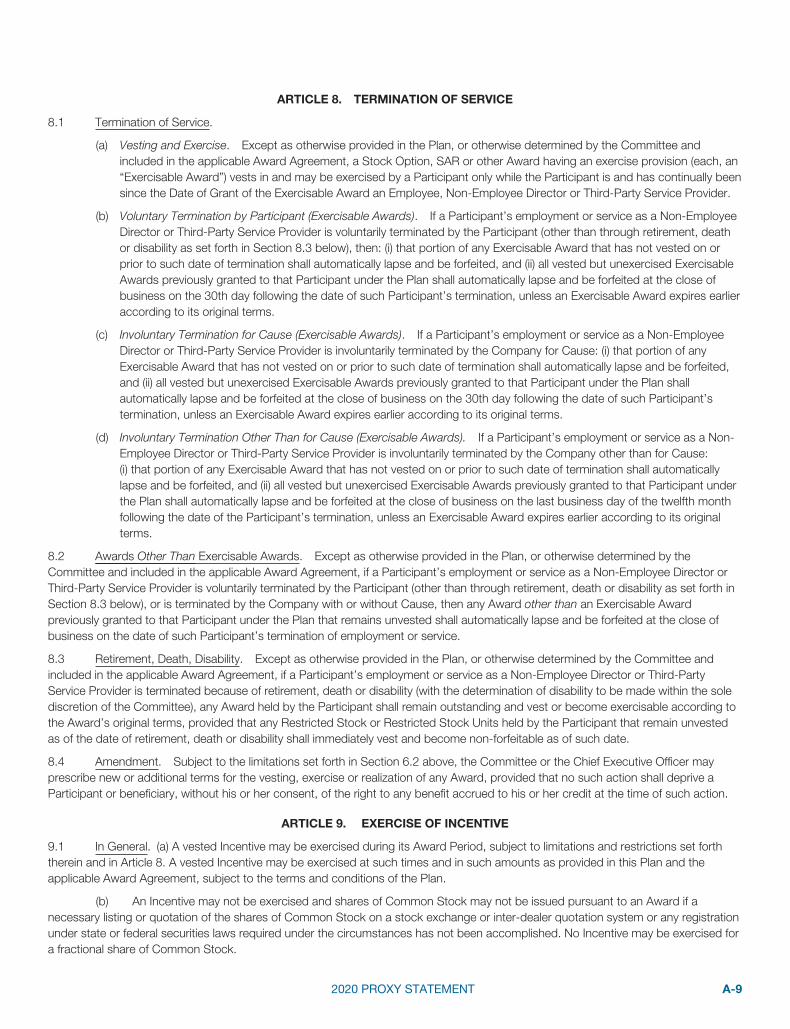
ARTICLE 8. TERMINATION OF SERVICE
8.1 Termination of Service.
(a) Vesting and Exercise. Except as otherwise provided in the Plan, or otherwise determined by the Committee andincluded in the applicable Award Agreement, a Stock Option, SAR or other Award having an exercise provision (each, an“Exercisable Award”) vests in and may be exercised by a Participant only while the Participant is and has continually beensince the Date of Grant of the Exercisable Award an Employee, Non-Employee Director or Third-Party Service Provider.
(b) Voluntary Termination by Participant (Exercisable Awards). If a Participant’s employment or service as a Non-EmployeeDirector or Third-Party Service Provider is voluntarily terminated by the Participant (other than through retirement, deathor disability as set forth in Section 8.3 below), then: (i) that portion of any Exercisable Award that has not vested on orprior to such date of termination shall automatically lapse and be forfeited, and (ii) all vested but unexercised ExercisableAwards previously granted to that Participant under the Plan shall automatically lapse and be forfeited at the close ofbusiness on the 30th day following the date of such Participant’s termination, unless an Exercisable Award expires earlieraccording to its original terms.
(c) Involuntary Termination for Cause (Exercisable Awards). If a Participant’s employment or service as a Non-EmployeeDirector or Third-Party Service Provider is involuntarily terminated by the Company for Cause: (i) that portion of anyExercisable Award that has not vested on or prior to such date of termination shall automatically lapse and be forfeited,and (ii) all vested but unexercised Exercisable Awards previously granted to that Participant under the Plan shallautomatically lapse and be forfeited at the close of business on the 30th day following the date of such Participant’stermination, unless an Exercisable Award expires earlier according to its original terms.
(d) Involuntary Termination Other Than for Cause (Exercisable Awards). If a Participant’s employment or service as a Non-Employee Director or Third-Party Service Provider is involuntarily terminated by the Company other than for Cause:(i) that portion of any Exercisable Award that has not vested on or prior to such date of termination shall automaticallylapse and be forfeited, and (ii) all vested but unexercised Exercisable Awards previously granted to that Participant underthe Plan shall automatically lapse and be forfeited at the close of business on the last business day of the twelfth monthfollowing the date of the Participant’s termination, unless an Exercisable Award expires earlier according to its originalterms.
8.2 Awards Other Than Exercisable Awards. Except as otherwise provided in the Plan, or otherwise determined by theCommittee and included in the applicable Award Agreement, if a Participant’s employment or service as a Non-Employee Director orThird-Party Service Provider is voluntarily terminated by the Participant (other than through retirement, death or disability as set forth inSection 8.3 below), or is terminated by the Company with or without Cause, then any Award other than an Exercisable Awardpreviously granted to that Participant under the Plan that remains unvested shall automatically lapse and be forfeited at the close ofbusiness on the date of such Participant’s termination of employment or service.
8.3 Retirement, Death, Disability. Except as otherwise provided in the Plan, or otherwise determined by the Committee andincluded in the applicable Award Agreement, if a Participant’s employment or service as a Non-Employee Director or Third-PartyService Provider is terminated because of retirement, death or disability (with the determination of disability to be made within the solediscretion of the Committee), any Award held by the Participant shall remain outstanding and vest or become exercisable according tothe Award’s original terms, provided that any Restricted Stock or Restricted Stock Units held by the Participant that remain unvestedas of the date of retirement, death or disability shall immediately vest and become non-forfeitable as of such date.
8.4 Amendment. Subject to the limitations set forth in Section 6.2 above, the Committee or the Chief Executive Officer mayprescribe new or additional terms for the vesting, exercise or realization of any Award, provided that no such action shall deprive aParticipant or beneficiary, without his or her consent, of the right to any benefit accrued to his or her credit at the time of such action.
ARTICLE 9. EXERCISE OF INCENTIVE
9.1 In General. (a) A vested Incentive may be exercised during its Award Period, subject to limitations and restrictions set forththerein and in Article 8. A vested Incentive may be exercised at such times and in such amounts as provided in this Plan and theapplicable Award Agreement, subject to the terms and conditions of the Plan.
(b) An Incentive may not be exercised and shares of Common Stock may not be issued pursuant to an Award if anecessary listing or quotation of the shares of Common Stock on a stock exchange or inter-dealer quotation system or any registrationunder state or federal securities laws required under the circumstances has not been accomplished. No Incentive may be exercised fora fractional share of Common Stock.
2020 PROXY STATEMENT A-9

9.2 Stock Options. (a) Subject to such administrative regulations as the Committee may from time to time adopt, a Stock Optionmay be exercised by the delivery of written notice to the Company setting forth the number of shares of Common Stock with respectto which the Stock Option is to be exercised (the “Exercise Notice”) and the date of exercise thereof (the “Exercise Date”) inaccordance with procedures established by the Company. On the Exercise Date, the Participant shall deliver to the Companyconsideration with a value equal to the total Option Price of the Shares to be purchased, payable as follows: (i) cash, check, bank draft,or money order payable to the order of the Company, (ii) Common Stock (including Restricted Stock) owned by the Participant on theExercise Date, valued at its Fair Market Value on the Exercise Date, (iii) by delivery (including by fax) to the Company or its designatedagent of an executed irrevocable option exercise form together with irrevocable instructions from the Participant to a broker or dealer,reasonably acceptable to the Company, to sell certain of the shares of Common Stock purchased upon exercise of the Stock Optionand promptly deliver to the Company the amount of sale proceeds necessary to pay such purchase price, and/or (iv) in any other formof valid consideration that is acceptable to the Company in its sole discretion. If shares of Restricted Stock are tendered asconsideration for the exercise of a Stock Option, a number of shares of Common Stock issued upon the exercise of the Stock Optionequal to the number of shares of Restricted Stock used as consideration therefor shall be subject to the same restrictions andprovisions as the Restricted Stock so submitted, as well as any additional restrictions that may be imposed by the Committee.
(b) Upon payment of all amounts due from the Participant, the Company shall cause shares of the Common Stock thenbeing purchased to be delivered as directed by the Participant (or the person exercising the Participant’s Stock Option in the event ofhis death) promptly after the Exercise Date, provided that if the Participant has exercised an Incentive Stock Option, the Company mayat its option retain possession of the Shares acquired upon exercise until the expiration of the holding periods described inSection 422(a)(1) of the Code. The obligation of the Company to deliver shares of Common Stock shall, however, be subject to thecondition that if at any time the Committee shall determine in its discretion that the listing, registration, or qualification of the StockOption or the Common Stock upon any securities exchange or inter-dealer quotation system or under any state or federal law, or theconsent or approval of any governmental regulatory body, is necessary or desirable as a condition of, or in connection with, the StockOption or the issuance or purchase of shares of Common Stock thereunder, the Stock Option may not be exercised in whole or in partunless such listing, registration, qualification, consent, or approval shall have been effected or obtained free of any conditions notacceptable to the Committee.
(c) If the Participant fails to pay for any of the Common Stock specified in such notice or fails to accept delivery thereof,the Participant’s right to purchase such Common Stock may be terminated by the Company.
9.3 SARs. Subject to the conditions of this Section 9.3 and such administrative regulations as the Committee may from time totime adopt, an SAR may be exercised by the delivery (including by fax) of written notice to the Committee setting forth the number ofshares of Common Stock with respect to which the SAR is to be exercised and the date of exercise thereof in accordance withprocedures established by the Company. On the SAR exercise date, the Participant shall receive from the Company in exchangetherefore cash in an amount equal to the excess (if any) of the Fair Market Value (as of the date of the exercise of the SAR) per share ofCommon Stock over the SAR Price per share specified in such SAR, multiplied by the total number of shares of Common Stock of theSAR being surrendered. In the discretion of the Committee, the Company may satisfy its obligation upon exercise of an SAR by thedistribution of that number of shares of Common Stock having an aggregate Fair Market Value (as of the date of the exercise of theSAR) equal to the amount of cash otherwise payable to the Participant, with a cash settlement to be made for any fractional shareinterests, or the Company may settle such obligation in part with shares of Common Stock and in part with cash.
9.4 Tax Payment Election. Subject to the approval of the Committee, and to any rules and limitations as the Committee mayadopt, a person exercising an Incentive may make the payment of the amount of any taxes required to be collected or withheld by theCompany in connection with such exercise in whole or in part by electing, at or before the time of exercise, either (i) to have theCompany withhold from the number of Shares otherwise deliverable a number of Shares whose Fair Market Value equals the amountof the applicable supplemental wage withholding required plus any required state, local or employment tax withholdings, or (ii) to delivercertificates for other Shares owned by the person exercising the Award, endorsed in blank with appropriate signature guarantee,having a Fair Market Value equal to the amount otherwise to be collected or withheld.
9.5 Valuation. Any calculation with respect to a Participant’s income, required tax withholding or other matters required to bemade by the Company upon the exercise of an Incentive shall be made using the Fair Market Value of the shares of Common Stock onthe Exercise Date, whether or not the Exercise Notice is delivered to the Company before or after the close of trading on that date,unless otherwise specified by the Committee. Notwithstanding the foregoing, for Stock Option exercises using the Company’s “same-day-sale for cash method” or “broker sale for stock method,” a Participant’s taxable gain and related tax withholding on the exercisewill be calculated using the actual market price at which Shares were sold in the transaction.
A-10
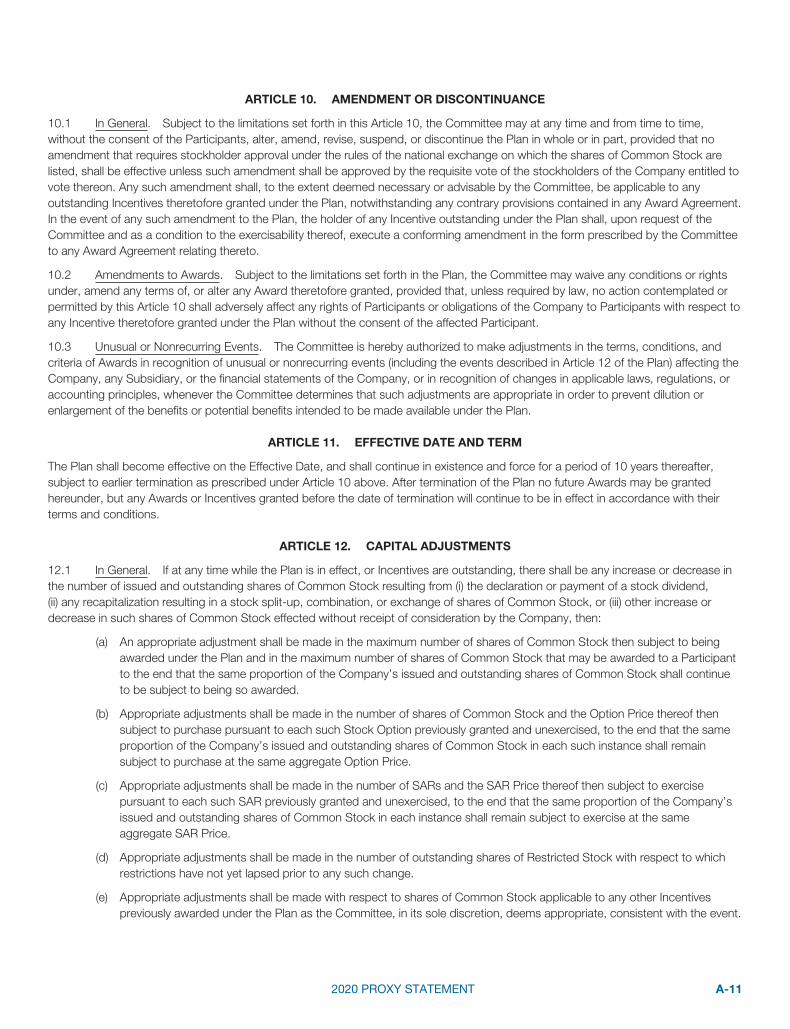
ARTICLE 10. AMENDMENT OR DISCONTINUANCE
10.1 In General. Subject to the limitations set forth in this Article 10, the Committee may at any time and from time to time,without the consent of the Participants, alter, amend, revise, suspend, or discontinue the Plan in whole or in part, provided that noamendment that requires stockholder approval under the rules of the national exchange on which the shares of Common Stock arelisted, shall be effective unless such amendment shall be approved by the requisite vote of the stockholders of the Company entitled tovote thereon. Any such amendment shall, to the extent deemed necessary or advisable by the Committee, be applicable to anyoutstanding Incentives theretofore granted under the Plan, notwithstanding any contrary provisions contained in any Award Agreement.In the event of any such amendment to the Plan, the holder of any Incentive outstanding under the Plan shall, upon request of theCommittee and as a condition to the exercisability thereof, execute a conforming amendment in the form prescribed by the Committeeto any Award Agreement relating thereto.
10.2 Amendments to Awards. Subject to the limitations set forth in the Plan, the Committee may waive any conditions or rightsunder, amend any terms of, or alter any Award theretofore granted, provided that, unless required by law, no action contemplated orpermitted by this Article 10 shall adversely affect any rights of Participants or obligations of the Company to Participants with respect toany Incentive theretofore granted under the Plan without the consent of the affected Participant.
10.3 Unusual or Nonrecurring Events. The Committee is hereby authorized to make adjustments in the terms, conditions, andcriteria of Awards in recognition of unusual or nonrecurring events (including the events described in Article 12 of the Plan) affecting theCompany, any Subsidiary, or the financial statements of the Company, or in recognition of changes in applicable laws, regulations, oraccounting principles, whenever the Committee determines that such adjustments are appropriate in order to prevent dilution orenlargement of the benefits or potential benefits intended to be made available under the Plan.
ARTICLE 11. EFFECTIVE DATE AND TERM
The Plan shall become effective on the Effective Date, and shall continue in existence and force for a period of 10 years thereafter,subject to earlier termination as prescribed under Article 10 above. After termination of the Plan no future Awards may be grantedhereunder, but any Awards or Incentives granted before the date of termination will continue to be in effect in accordance with theirterms and conditions.
ARTICLE 12. CAPITAL ADJUSTMENTS
12.1 In General. If at any time while the Plan is in effect, or Incentives are outstanding, there shall be any increase or decrease inthe number of issued and outstanding shares of Common Stock resulting from (i) the declaration or payment of a stock dividend,(ii) any recapitalization resulting in a stock split-up, combination, or exchange of shares of Common Stock, or (iii) other increase ordecrease in such shares of Common Stock effected without receipt of consideration by the Company, then:
(a) An appropriate adjustment shall be made in the maximum number of shares of Common Stock then subject to beingawarded under the Plan and in the maximum number of shares of Common Stock that may be awarded to a Participantto the end that the same proportion of the Company’s issued and outstanding shares of Common Stock shall continueto be subject to being so awarded.
(b) Appropriate adjustments shall be made in the number of shares of Common Stock and the Option Price thereof thensubject to purchase pursuant to each such Stock Option previously granted and unexercised, to the end that the sameproportion of the Company’s issued and outstanding shares of Common Stock in each such instance shall remainsubject to purchase at the same aggregate Option Price.
(c) Appropriate adjustments shall be made in the number of SARs and the SAR Price thereof then subject to exercisepursuant to each such SAR previously granted and unexercised, to the end that the same proportion of the Company’sissued and outstanding shares of Common Stock in each instance shall remain subject to exercise at the sameaggregate SAR Price.
(d) Appropriate adjustments shall be made in the number of outstanding shares of Restricted Stock with respect to whichrestrictions have not yet lapsed prior to any such change.
(e) Appropriate adjustments shall be made with respect to shares of Common Stock applicable to any other Incentivespreviously awarded under the Plan as the Committee, in its sole discretion, deems appropriate, consistent with the event.
2020 PROXY STATEMENT A-11

12.2 Issuance of Stock or Other Convertible Securities. Except as otherwise expressly provided herein, the issuance by theCompany of shares of its capital stock of any class, or securities convertible into shares of capital stock of any class, either inconnection with a direct sale or upon the exercise of rights or warrants to subscribe therefor, or upon conversion of shares orobligations of the Company convertible into such shares or other securities, shall not affect, and no adjustment by reason thereof shallbe made with respect to (i) the number of or Option Price of shares of Common Stock then subject to outstanding Stock Optionsgranted under the Plan, (ii) the number of or SAR Price of shares of Common Stock then subject to outstanding SARs granted underthe Plan, (iii) the number of outstanding shares of Restricted Stock, or (iv) the number of shares of Common Stock otherwise payableunder any other Incentive.
12.3 Notification. Upon the occurrence of each event requiring an adjustment with respect to any Incentive, the Company shallnotify each affected Participant of its computation of such adjustment, which shall be conclusive and shall be binding upon each suchParticipant.
ARTICLE 13. RECAPITALIZATION, MERGER AND CONSOLIDATION;CHANGE OF CONTROL
13.1 Adjustments, Recapitalizations, Reorganizations, or Other Adjustments. The existence of this Plan and Incentives grantedhereunder shall not affect in any way the right or power of the Company or its stockholders to make or authorize any or all adjustments,recapitalizations, reorganizations, or other changes in the Company’s capital structure and its business, or any merger or consolidationof the Company, or any issue of bonds, debentures, preferred or preference stocks ranking prior to or otherwise affecting the CommonStock or the rights thereof (or any rights, options, or warrants to purchase same), or the dissolution or liquidation of the Company, orany sale or transfer of all or any part of its assets or business, or any other corporate act or proceeding, whether of a similar characteror otherwise.
13.2 Acquiring Entity. Subject to any required action by the stockholders, if the Company shall be the surviving or resultingcorporation in any merger, consolidation or share exchange, any Incentive granted hereunder shall pertain to and apply to thesecurities or rights (including cash, property, or assets) to which a Participant would have been entitled.
13.3 Acquired Entity. In the event of any merger, consolidation or share exchange pursuant to which the Company is not thesurviving or resulting corporation, there shall be substituted for each share of Common Stock subject to the unexercised portions ofsuch outstanding Incentives, that number of shares of each class of stock or other securities or that amount of cash, property, orassets of the surviving, resulting or consolidated company that were distributed or distributable to the stockholders of the Company inrespect to each share of Common Stock held by them, such outstanding Incentives to be thereafter exercisable for such stock,securities, cash, or property in accordance with their terms.
13.4 Change of Control. Unless otherwise specified in a change of control severance agreement between a Participant and theCompany, and unless otherwise specifically prohibited under applicable laws, or by the rules of any governing governmental agency orauthority or national securities exchange, or any policy previously adopted by the Board, the Committee may, in its sole discretion, atthe time an Award is made or granted hereunder or at any time prior to, coincident with, or after the time of a Change of Control, takeone of the following actions which shall apply only upon the occurrence of a Change of Control or, if later, upon the action being taken:
(a) Provide for the acceleration of any time periods, or the waiver of any other conditions, relating to the vesting, exercise,payment, or distribution of an Award so that any Award to a Participant whose employment has been terminated as aresult of a Change of Control may be vested, exercised, paid, or distributed in full on or before a date fixed by theCommittee, and in connection therewith the Committee may (i) provide for an extended period to exercise Stock Optionsor SARs (not to exceed the original term) and (ii) determine the level of attainment of any applicable performance goals;
(b) Provide for the purchase of any Awards from a participant whose employment has been terminated as a result of a Changeof Control, upon the Participant’s request, for an amount of cash equal to the amount that could have been obtained uponthe exercise, payment, or distribution of such rights had such Award been currently exercisable or payable; or
(c) Cause the Awards then outstanding to be assumed, or new rights substituted therefore, by the surviving corporation insuch Change of Control.
For purposes of sub-paragraphs (a) and (b) above, any Participant whose employment is either (i) terminated by the Company otherthan for “Cause,” or (ii) terminated by the Participant for “Good Reason” (each as defined in this Plan) in either case upon, or on or priorto the second anniversary of a Change of Control, shall be deemed to have been terminated as a result of the Change of Control.
A-12

ARTICLE 14. LIQUIDATION OR DISSOLUTION
In case the Company shall, at any time while any Incentive under this Plan shall be in force and remain unexpired, sell all or substantiallyall of its property (other than in connection with a Change of Control Event), or dissolve, liquidate, or wind up its affairs (each, a“Dissolution Event”), then each Participant shall be thereafter entitled to receive, in lieu of each share of Common Stock of theCompany which such Participant would have been entitled to receive under the Incentive, the same kind and amount of any securitiesor assets as may be issuable, distributable, or payable upon any such sale, dissolution, liquidation, or winding up with respect to eachshare of Common Stock of the Company. If the Company shall, at any time prior to the expiration of any Incentive, make any partialdistribution of its assets, in the nature of a partial liquidation, whether payable in cash or in kind (but excluding the distribution of a cashdividend payable out of earned surplus and designated as such) then in such event the Option Prices or SAR Prices then in effect withrespect to each Stock Option or SAR shall be reduced, on the payment date of such distribution, in proportion to the percentagereduction in the tangible book value of the shares of the Company’s Common Stock (determined in accordance with generallyaccepted accounting principles) resulting by reason of such distribution.
ARTICLE 15. ADDITIONAL AUTHORITY OF COMMITTEE
In addition to the Committee’s authority set forth elsewhere in this Plan, in order to maintain a Participant’s rights in the event of anyChange of Control or Dissolution Event described under Articles 13 and 14, the Committee, as constituted before the Change ofControl or Dissolution Event, is hereby authorized, and has sole discretion, as to any Incentive, either at the time the Award is madehereunder or any time thereafter, to take any one or more of the following actions:
(a) provide for the purchase of any Incentive, upon the Participant’s request, for an amount of cash equal to the amount thatcould have been attained upon the exercise of the Incentive or realization of the Participant’s rights in the Incentive hadthe Incentive been currently exercisable or payable;
(b) adjust any outstanding Incentive as the Committee deems appropriate to reflect the Change of Control or DissolutionEvent; or
(c) cause any outstanding Incentive to be assumed, or new rights substituted therefor, by the acquiring or survivingcorporation after a Change of Control or successor following a Dissolution Event.
(d) The Committee may in its discretion include other provisions and limitations in any Award Agreement as it may deemequitable and in the best interests of the Company.
ARTICLE 16. INCENTIVES IN SUBSTITUTION FORINCENTIVES GRANTED BY OTHER CORPORATIONS
Incentives may be granted under the Plan from time to time in substitution for similar instruments held by employees of a corporationwho become or are about to become Employees of the Company or any Subsidiary as a result of a merger or consolidation of theemploying corporation with the Company or the acquisition by the Company of stock of the employing corporation. The terms andconditions of the substitute Incentives so granted may vary from the terms and conditions set forth in this Plan to such extent as theBoard at the time of grant may deem appropriate to conform, in whole or in part, to the provisions of the instruments in substitution forwhich they are granted.
ARTICLE 17. MISCELLANEOUS PROVISIONS
17.1 Code Section 409A. Notwithstanding anything in this Plan to the contrary, if any Plan provision or Award under the Planwould result in the imposition of an applicable tax under Section 409A of the Internal Revenue Code of 1986, as amended and relatedregulations and Treasury pronouncements (“Code Section 409A”), that Plan provision or Award may be reformed to avoid imposition ofthe applicable tax and no action taken to comply with Code Section 409A shall be deemed to adversely affect the Participant’s rightsto an Award. This Plan is intended to comply, and shall be administered consistently in all respects, with Code Section 409A, and theregulations and additional guidance promulgated thereunder to the extent applicable. Accordingly, the Company shall have theauthority to take any action, or refrain from taking any action, with respect to this Plan or any Award hereunder that is reasonablynecessary to ensure compliance with Code Section 409A (provided that the Company shall choose the action that best preserves thevalue of payments and benefits provided to Participant that is consistent with Code Section 409A); this Plan shall be interpreted in amanner that is consistent with Code Section 409A. In furtherance, but not in limitation of the foregoing:
(a) in no event may a Participant designate, directly or indirectly, the calendar year of any payment to be made hereunder;
2020 PROXY STATEMENT A-13
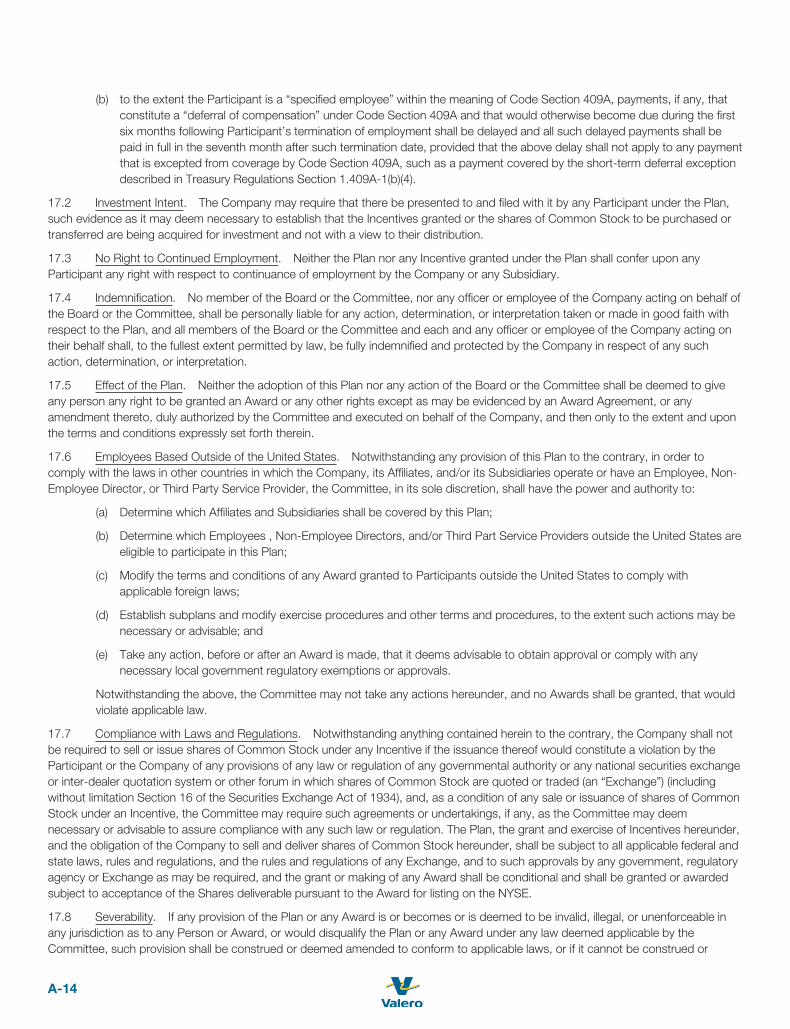
(b) to the extent the Participant is a “specified employee” within the meaning of Code Section 409A, payments, if any, thatconstitute a “deferral of compensation” under Code Section 409A and that would otherwise become due during the firstsix months following Participant’s termination of employment shall be delayed and all such delayed payments shall bepaid in full in the seventh month after such termination date, provided that the above delay shall not apply to any paymentthat is excepted from coverage by Code Section 409A, such as a payment covered by the short-term deferral exceptiondescribed in Treasury Regulations Section 1.409A-1(b)(4).
17.2 Investment Intent. The Company may require that there be presented to and filed with it by any Participant under the Plan,such evidence as it may deem necessary to establish that the Incentives granted or the shares of Common Stock to be purchased ortransferred are being acquired for investment and not with a view to their distribution.
17.3 No Right to Continued Employment. Neither the Plan nor any Incentive granted under the Plan shall confer upon anyParticipant any right with respect to continuance of employment by the Company or any Subsidiary.
17.4 Indemnification. No member of the Board or the Committee, nor any officer or employee of the Company acting on behalf ofthe Board or the Committee, shall be personally liable for any action, determination, or interpretation taken or made in good faith withrespect to the Plan, and all members of the Board or the Committee and each and any officer or employee of the Company acting ontheir behalf shall, to the fullest extent permitted by law, be fully indemnified and protected by the Company in respect of any suchaction, determination, or interpretation.
17.5 Effect of the Plan. Neither the adoption of this Plan nor any action of the Board or the Committee shall be deemed to giveany person any right to be granted an Award or any other rights except as may be evidenced by an Award Agreement, or anyamendment thereto, duly authorized by the Committee and executed on behalf of the Company, and then only to the extent and uponthe terms and conditions expressly set forth therein.
17.6 Employees Based Outside of the United States. Notwithstanding any provision of this Plan to the contrary, in order tocomply with the laws in other countries in which the Company, its Affiliates, and/or its Subsidiaries operate or have an Employee, Non-Employee Director, or Third Party Service Provider, the Committee, in its sole discretion, shall have the power and authority to:
(a) Determine which Affiliates and Subsidiaries shall be covered by this Plan;
(b) Determine which Employees , Non-Employee Directors, and/or Third Part Service Providers outside the United States areeligible to participate in this Plan;
(c) Modify the terms and conditions of any Award granted to Participants outside the United States to comply withapplicable foreign laws;
(d) Establish subplans and modify exercise procedures and other terms and procedures, to the extent such actions may benecessary or advisable; and
(e) Take any action, before or after an Award is made, that it deems advisable to obtain approval or comply with anynecessary local government regulatory exemptions or approvals.
Notwithstanding the above, the Committee may not take any actions hereunder, and no Awards shall be granted, that wouldviolate applicable law.
17.7 Compliance with Laws and Regulations. Notwithstanding anything contained herein to the contrary, the Company shall notbe required to sell or issue shares of Common Stock under any Incentive if the issuance thereof would constitute a violation by theParticipant or the Company of any provisions of any law or regulation of any governmental authority or any national securities exchangeor inter-dealer quotation system or other forum in which shares of Common Stock are quoted or traded (an “Exchange”) (includingwithout limitation Section 16 of the Securities Exchange Act of 1934), and, as a condition of any sale or issuance of shares of CommonStock under an Incentive, the Committee may require such agreements or undertakings, if any, as the Committee may deemnecessary or advisable to assure compliance with any such law or regulation. The Plan, the grant and exercise of Incentives hereunder,and the obligation of the Company to sell and deliver shares of Common Stock hereunder, shall be subject to all applicable federal andstate laws, rules and regulations, and the rules and regulations of any Exchange, and to such approvals by any government, regulatoryagency or Exchange as may be required, and the grant or making of any Award shall be conditional and shall be granted or awardedsubject to acceptance of the Shares deliverable pursuant to the Award for listing on the NYSE.
17.8 Severability. If any provision of the Plan or any Award is or becomes or is deemed to be invalid, illegal, or unenforceable inany jurisdiction as to any Person or Award, or would disqualify the Plan or any Award under any law deemed applicable by theCommittee, such provision shall be construed or deemed amended to conform to applicable laws, or if it cannot be construed or
A-14

deemed amended without, in the determination of the Committee, materially altering the intent of the Plan or the Award, such provisionshall be stricken as to such jurisdiction, Person or Award and the remainder of the Plan and any such Award shall remain in full forceand effect.
17.9 Tax Requirements, Withholding. The Company or any Affiliate is hereby authorized to withhold from any Award, from anypayment due or transfer made under any Award or under the Plan or from any compensation or other amount owing to a Participantthe amount (in cash, Shares, other securities, other Awards or other property) of any applicable withholding taxes with respect to anAward, its exercise, the lapse of restrictions thereon, payment or transfer under an Award or under the Plan, and to take any otheraction necessary in the opinion of the Company to satisfy all obligations for the payment of the taxes. Notwithstanding the foregoing, inthe event of an assignment of a Non-qualified Stock Option or SAR, the Participant who assigns the Non-qualified Stock Option orSAR shall remain subject to withholding taxes upon exercise of the Non-qualified Stock Option or SAR by the transferee to the extentrequired by the Code or the rules and regulations promulgated thereunder. Such payments shall be required to be made prior to thedelivery of any shares of Common Stock. Such payment may be made in cash, by check, or through the delivery of shares of CommonStock owned by the Participant (which may be effected by the actual delivery of shares of Common Stock by the Participant or by theCompany’s withholding a number of shares of Common Stock to be issued upon the exercise of a Stock Option or an SAR, ifapplicable), which shares of Common Stock have an aggregate Fair Market Value equal to the required minimum withholding payment,or any combination thereof.
17.10 No Representations or Warranties Regarding Tax Effect. Notwithstanding any provision of the Plan to the contrary, theCompany, its Affiliates and Subsidiaries, the Board and the Committee make no representation or warranty with respect to the taxtreatment under any federal, state, local or foreign laws and regulations thereunder (individually and collectively referred to as the “TaxLaws”) of any Award granted or any amounts paid to any Participant under the Plan including, but not limited to, when and to whatextent such Awards or amounts may be subject to tax, penalties and interest under the Tax Laws.
17.11 Assignability. (a) Incentive Stock Options may not be transferred or assigned other than by will or the laws of descent anddistribution and may be exercised during the lifetime of the Participant only by the Participant or the Participant’s legally authorizedrepresentative, and each Award Agreement in respect of an Incentive Stock Option shall so provide. The designation by a Participant ofa beneficiary will not constitute a transfer of the Stock Option. The Committee may waive or modify any limitation contained in thepreceding sentences of this Section 17.11 that is not required for compliance with Section 422 of the Code.
(b) The Committee may, in its discretion, authorize all or a portion of a Non-qualified Stock Option or SAR to be granted toa Participant to be on terms which permit transfer by such Participant to (i) the spouse, children or grandchildren of the Participant(“Immediate Family Members”), (ii) a trust or trusts for the exclusive benefit of such Immediate Family Members, or (iii) a partnership inwhich such Immediate Family Members are the only partners, (iv) an entity exempt from federal income tax pursuant toSection 501(c)(3) of the Code or any successor provision, or (v) a split interest trust or pooled income fund described inSection 2522(c)(2) of the Code or any successor provision, provided that (a) there shall be no consideration for any such transfer,(b) the Award Agreement pursuant to which such Non-qualified Stock Option or SAR is granted must be approved by the Committeeand must expressly provide for transferability in a manner consistent with this Section, and (c) subsequent transfers of transferred Non-qualified Stock Options or SARs shall be prohibited except those by will or the laws of descent and distribution or pursuant to aqualified domestic relations order as defined in the Code or Title I of the Employee Retirement Income Security Act of 1974, asamended. Following transfer, any such Non-qualified Stock Option or SAR shall continue to be subject to the same terms andconditions as were applicable immediately prior to transfer, provided that for purposes of Articles 9, 10, 12, 14 and 16 hereof the term“Participant” shall be deemed to include the transferee. The events for termination of service described in Section 8.1 shall continue tobe applied with respect to the original Participant, following which the Non-qualified Stock Options and SARs shall be exercisable bythe transferee only to the extent and for the periods specified in the Award Agreement. The Committee and the Company shall have noobligation to inform any transferee of a Non-qualified Stock Option or SAR of any expiration, termination, lapse or acceleration of suchNon-qualified Stock Option or SAR. The Company shall have no obligation to register with any federal or state securities commission oragency any Common Stock issuable or issued under a Non-qualified Stock Option or SAR that has been transferred by a Participantunder this Section 17.11.
17.12 No Trust or Fund Created. Neither the Plan nor any Award shall create or be construed to create a trust or separate fund ofany kind or any fiduciary relationship between the Company or any Affiliate, on the one hand, and a Participant or any other Person, onthe other hand. To the extent that any Person acquires a right to receive payments from the Company or any Affiliate pursuant to anAward, such right shall be no greater than the right of any unsecured general creditor of the Company or any Affiliate.
17.13 Governing Law. The validity, construction and effect of the Plan and any actions taken or relating to the Plan shall bedetermined in accordance with the laws of the State of Texas and applicable federal law.
2020 PROXY STATEMENT A-15

17.14 Successors and Assigns. The Company will require any successor (whether direct or indirect, by purchase, merger,consolidation or otherwise) to all or substantially all of the business and/or assets of the Company, expressly to assume and agree toperform the Company’s obligations under this Plan in the same manner and to the same extent that the Company would be required toperform them if no such succession had taken place. As used herein, the “Company” shall mean the Company as herein beforedefined and any aforesaid successor to its business and/or assets.
17.15 No Fractional Shares. No fractional Shares shall be issued or delivered pursuant to the Plan or any Award, and theCommittee shall determine whether cash, other securities, or other property shall be paid or transferred in lieu of any fractional Sharesor whether fractional Shares or any rights thereto shall be canceled, terminated, or otherwise eliminated.
A-16

UNITED STATTT ESSECURITIES AND EXCHANGE COMMISSION
Washington, D.C. 20549FORM 10-K
(Mark One)
☑ ANNUAL REPORTRR PURSUANT TO SECTION 13 OR 15(d) OF THE SECURITIES EXCHANGEACT OF 1934For the fiscal year ended December 31, 2019
OR
☐ TRANSITION REPORTRR PURSUANT TO SECTION 13 OR 15(d) OF THE SECURITIES EXCHANGEACT OF 1934For the transition period from _______________ to _______________
Commission file number 001-13175
VALERO ENERGYCORPORATIONAA(Exact name of registrant as specified in its charter)
Delaware 74-1828067(State or other jurisdiction of (I.R.S. Employerincorporation or organization) Identification No.)
One Valero WaySan Antonio, Texas 78249
(Address of principal executive offices)ff (Zip Code)
Registrant’s telephone number, including area code: (210) 345-2000
Securities registered pursuant to Section 12(b) of the Act:
Title of each class Trading Symbol(s) Name of each exchange on which registeredCommon stock VLO New York Stock Exchange
g y ( ) g g
Securities registered pursuant to Section 12(g) of the Act: None.Indicate by check mark if the registrant is a well-known seasoned issuer, as defined in Rule 405 of the Securities Act.Yes ☑ No ☐Indicate by check mark if the registrant is not required to file reports pursuant to Section 13 or Section 15(d) of the Act.Yes ☐ No ☑Indicate by check mark whether the registrant (1) has filed all reports required to be filed by Section 13 or 15(d) of the SecuritiesExchange Act of 1934 during the preceding 12 months (or for such shorter period that the registrant was required to file suchreports), and (2) has been subject to such filing requirements for the past 90 days. Yes☑ No ☐Indicate by check mark whether the registrant has submitted electronically every Interactive Data File required to be submittedpursuant to Rule 405 of Regulation S-T (§232.405 of this chapter) during the preceding 12 months (or for such shorter period thatthe registrant was required to submit such files). Yes☑ No ☐Indicate by check mark whether the registrant is a large accelerated filer, an accelerated filer, a non-accelerated filer, a smallerreporting company,yy or an emerging growth company. See the definitions of “large accelerated filer,” “accelerated filer,” “smallerreporting company,”yy and “emerging growth company” in Rule 12b-2 of the Exchange Act.
Large accelerated filer ☑ Accelerated filer ☐ Non-accelerated filer ☐Smaller reporting company ☐ Emerging growth company ☐
If an emerging growth company,yy indicate by check mark if the registrant has elected not to use the extended transition period forcomplying with any new or revised financial accounting standards provided pursuant to Section 13(a) of the Exchange Act. ☐Indicate by check mark whether the registrant is a shell company (as defined in Rule 12b-2 of the Exchange Act). Yes ☐ No ☑The aggregate market value of the voting and non-voting common stock held by non-affiliatesff was approximately $35.5 billionbased on the last sales price quoted as of June 28, 2019 on the NewYork Stock Exchange, the last business day of the registrant’smost recently completed second fiscal quarter.As of January 31, 2020, 409,337,126 shares of the registrant’s common stock were outstanding.
DOCUMENTS INCORPORATEDAA BYREFERENCEWeintend to filewith theSecurities andExchangeCommissionadefinitiveProxyStatement for ourAnnualMeetingofStockholdersscheduled forApril 30, 2020, at which directors will be elected. Portions of the 2020 Proxy Statement are incorporated by referencein Part III of this Form 10-K and are deemed to be a part of this report.


CROSS-REFERENCE SHEET
The following table indicates the headings in the 2020 Proxy Statement where certain information requiredin Part III of this Form 10-K may be found.
Form 10-K Item No. and Captionp Heading in 2020 Proxy Statementg y
10. Directors, Executive Officersff andCorporate Governance
Information Regardingrr the Boardrr of Directors,rrIndependent Directors,rr Audit Committee, Proposalrr No. 1Election of Directorsrr , Information Concerning Nomineesand Other Directors,rr Identification of Executive Officers,and Governance Documents and Codes of Ethics
11. Executive Compensation Compensation Committee, Compensation Discussionand Analysis, Executive Compensation, DirectorrrCompensation, Pay Ratio Disclosure,rr and CertainRelationships and Related Transactions
12. Security Ownership of Certain BeneficialOwners and Management and RelatedStockholder Matters
Beneficial Ownership of Valerorr Securities and EquityCompensation Plan Information
13. Certain Relationships and RelatedTransactions, andDirector Independence
Certain Relationships and Related Transactions andIndependent Directorsrr
14. Principal Accountant Fees and Services KPMG LLP Fees and Audit Committee Pre-Apprrr ovalrrPolicy
Copies of all documents incorporated by reference, other than exhibits to such documents, will be providedwithout charge to each person who receives a copy of this Form 10-K upon written request to Valero EnergyCorporation, Attn: Secretary,yy P.O. Box 696000, San Antonio, Texas 78269-6000.
i

CONTENTS
PAGEPART I 1Items 1. & 2. Business and Properties 1
Overview 1Available Information 1Valero’s Operations 2Environmental Matters 9Properties 9
Item 1A. Risk Factors 10Item 1B. Unresolved Staffff Comments 18Item 3. Legal Proceedings 18Item 4. Mine Safety Disclosures 19
PART II 20Item 5. Market for Registrant’s Common Equity,yy Related Stockholder Matters and
Issuer Purchases of Equity Securities 20Item 6. Selected Financial Data 22Item 7. Management’s Discussion and Analysis of Financial Condition and
Results of Operations 23Item 7A. Quantitative and Qualitative Disclosures About Market Risk 57Item 8. Financial Statements and Supplementary Data 59Item 9. Changes in and Disagreements with Accountants on Accounting and
Financial Disclosure 146Item 9A. Controls and Procedures 146Item 9B. Other Information 146
PART III 146Item 10. Directors, Executive Officersff and Corporate Governance 146Item 11. Executive Compensation 146Item 12. Security Ownership of Certain Beneficial Owners and Management and
Related Stockholder Matters 146Item 13. Certain Relationships and Related Transactions, and Director Independence 146Item 14. Principal Accountant Fees and Services 146
PART IV 147Item 15. Exhibits and Financial Statement Schedules 147
Signature 151
ii

The terms “Valero,”VV “we,” “our,” and “us,” as used in this report, may refer to Valero Energy Corporation,to one or more of its consolidated subsidiaries, or to all of them taken as a whole. In this Form 10-K, wemake certain forward-looking statements, including statements regarding our plans, strategies, objectives,expectations, intentions, and resources under the safe harbor provisions of the Private Securities LitigationReformAct of 1995.You should read our forward-looking statements togetherwith our disclosures beginningon page 23 of this report under the heading: “CAUTIONARYRR STATTT EMENTFORTHEPURPOSEOFSAFEHARBOR PROVISIONS OF THE PRIVATVV E SECURITIES LITIGATIONAA REFORMACT OF 1995.”
1
PART I
ITEMS 1. and 2. BUSINESS AND PROPERTIESRR
OVERVIEWRR
We are a Fortune 500 company based in San Antonio, Texas. Our corporate officesff are at One Valero Way,San Antonio, Texas, 78249, and our telephone number is (210) 345-2000.Wewere incorporated inDelawarein 1981 under the name Valero Refining and Marketing Company. We changed our name to Valero EnergyCorporation onAugust 1, 1997. Our common stock trades on the NewYork Stock Exchange (NYSE) underthe trading symbol “VLO.” On January 31, 2020, we had 10,222 employees.
We own 15 petroleum refineries located in theUnited States (U.S.), Canada, and theUnited Kingdom (U.K.)with a combined throughput capacity of approximately 3.15 million barrels per day (BPD). Our refineriesproduce conventional gasolines, premium gasolines, gasoline meeting the specifications of the CaliforniaAir Resources Board (CARB), diesel, low-sulfur diesel, ultra-low-sulfur diesel, CARB diesel, otherdistillates, jet fuel, asphalt, petrochemicals, lubricants, and other refined petroleum products. We also own14 ethanol plants located in the Mid-Continent region of the U.S. with a combined production capacity ofapproximately 1.73 billion gallons per year. We are also a joint venture partner in Diamond Green DieselHoldings LLC (DGD), which owns and operates a renewable diesel plant in Norco, Louisiana. We sell ourproducts in the wholesale rack or bulk markets in the U.S., Canada, the U.K., Ireland, and Latin America.Approximately 7,000 outlets carry our brand names.
On January 10, 2019, we completed our acquisition of all of the outstanding publicly held common units ofValero Energy Partners LP (VLP) as described in Note 2 of Notes to Consolidated Financial Statements,which is incorporated herein by reference.
AVAILABLE INFORMATIONAA
Our website address is www.valero.com. Information on our website is not part of this report. Our annualreports on Form 10-K, quarterly reports on Form 10-Q, current reports on Form 8-K, and other reports, aswell as any amendments to those reports, filed with (or furnished to) the U.S. Securities and ExchangeCommission (SEC) are available on our website (under About Valero > Investor Relations > FinancialInformation > SEC Filings) free of charge, soon after we file or furnish such material. In this same location,we also post our corporate governance guidelines and other governance policies, codes of ethics, and thecharters of the committees of our board of directors.These documents are available in print to any stockholderthat makes a written request to Valero Energy Corporation, Attn: Secretary,yy P.O. Box 696000, San Antonio,Texas 78269-6000.
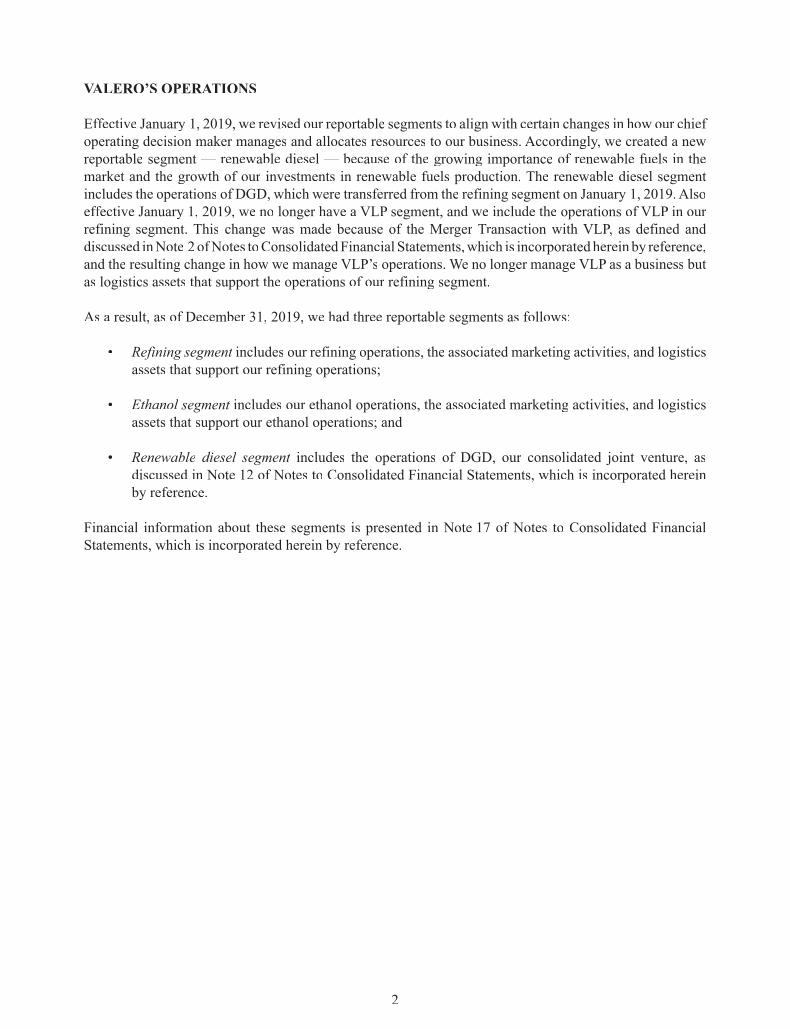
VALERO’S OPERATIONSAA
Effectiveff January 1, 2019, we revised our reportable segments to align with certain changes in how our chiefoperating decision maker manages and allocates resources to our business. Accordingly,yy we created a newreportable segment — renewable diesel — because of the growing importance of renewable fuels in themarket and the growth of our investments in renewable fuels production. The renewable diesel segmentincludes the operations of DGD, which were transferred from the refining segment on January 1, 2019.Alsoeffectiveff January 1, 2019, we no longer have a VLP segment, and we include the operations of VLP in ourrefining segment. This change was made because of the Merger Transaction with VLP,PP as defined anddiscussed inNote 2 ofNotes toConsolidatedFinancial Statements,which is incorporated herein by reference,and the resulting change in how we manage VLP’s operations. We no longer manage VLP as a business butas logistics assets that support the operations of our refining segment.
As a result, as of December 31, 2019, we had three reportable segments as follows:
• Refining segment includes our refining operations, the associated marketing activities, and logisticsassets that support our refining operations;
• Ethanol segment includes our ethanol operations, the associated marketing activities, and logisticsassets that support our ethanol operations; and
• Renewable diesel segment includes the operations of DGD, our consolidated joint venture, asdiscussed in Note 12 of Notes to Consolidated Financial Statements, which is incorporated hereinby reference.
Financial information about these segments is presented in Note 17 of Notes to Consolidated FinancialStatements, which is incorporated herein by reference.
2
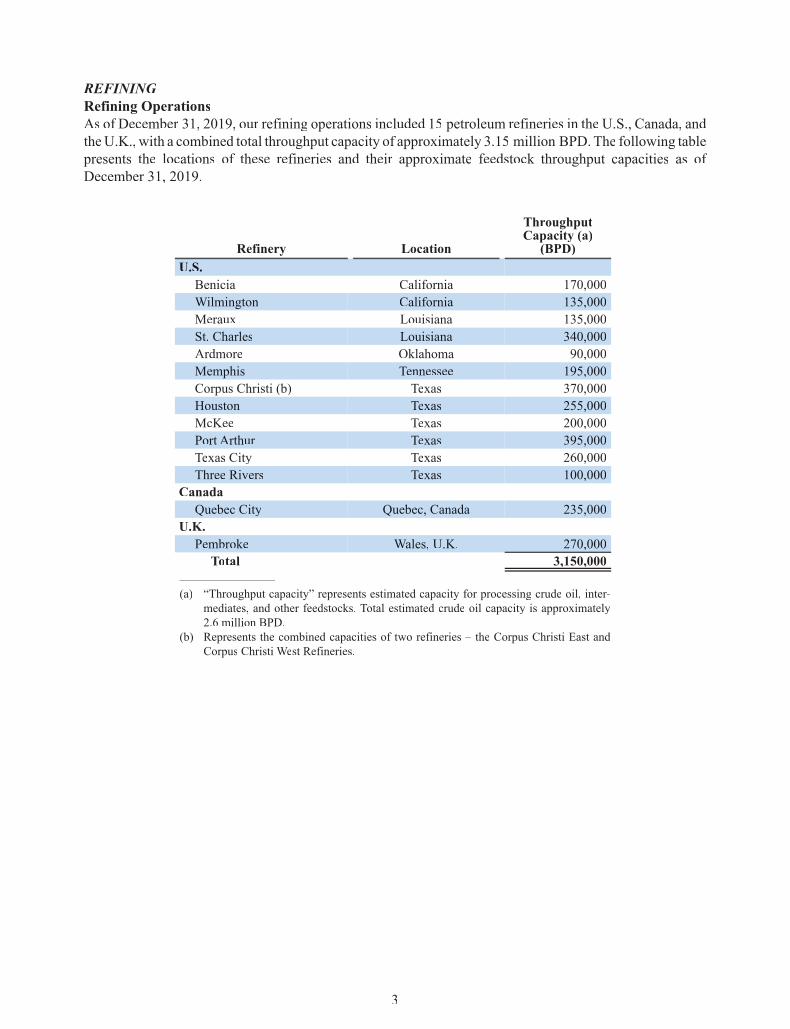
REFININGRefining OperationsAs of December 31, 2019, our refining operations included 15 petroleum refineries in the U.S., Canada, andtheU.K., with a combined total throughput capacity of approximately 3.15 million BPD.The following tablepresents the locations of these refineries and their approximate feedstock throughput capacities as ofDecember 31, 2019.
Refinery Location
ThroughputCapacity (a)(BPD)
U.S.Benicia California 170,000Wilmington California 135,000Meraux Louisiana 135,000St. Charles Louisiana 340,000Ardmore Oklahoma 90,000Memphis Tennessee 195,000Corpus Christi (b) Texas 370,000Houston Texas 255,000McKee Texas 200,000Port Arthur Texas 395,000Texas City Texas 260,000Three Rivers Texas 100,000
CanadaQuebec City Quebec, Canada 235,000
U.K.Pembroke Wales, U.K. 270,000Total 3,150,000, ,
________________________
(a) “Throughput capacity” represents estimated capacity for processing crude oil, inter-mediates, and other feedstocks. Total estimated crude oil capacity is approximately2.6 million BPD.
(b) Represents the combined capacities of two refineries – the Corpus Christi East andCorpus Christi West Refineries.
3
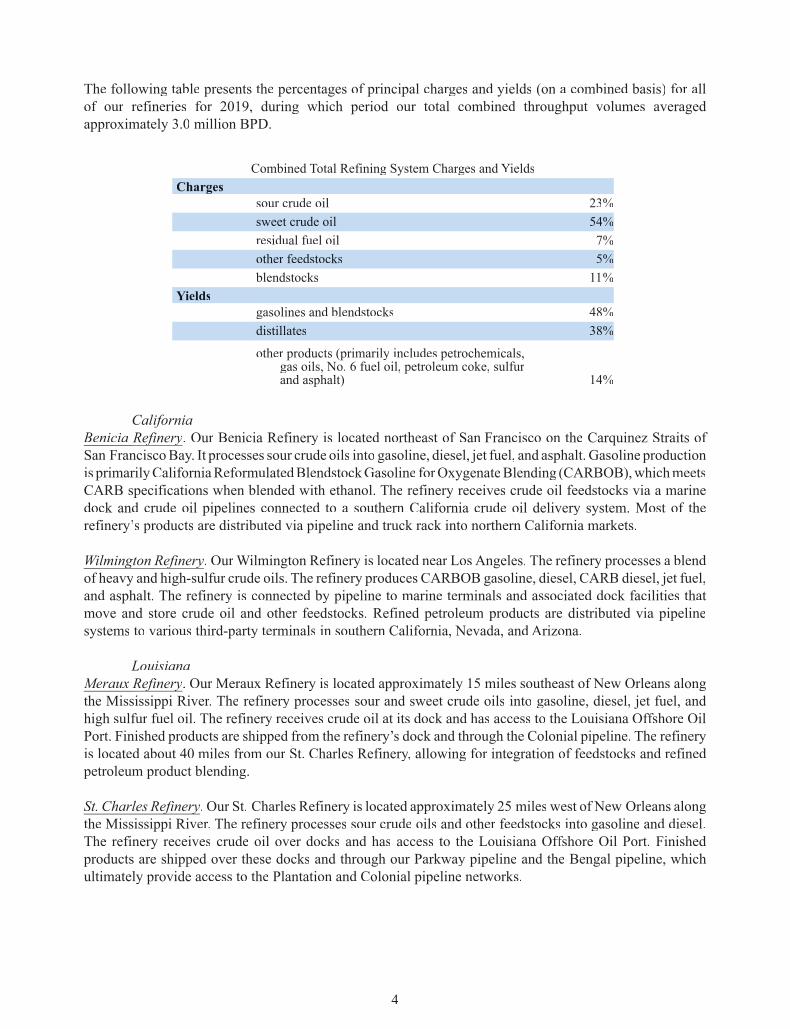
The following table presents the percentages of principal charges and yields (on a combined basis) for allof our refineries for 2019, during which period our total combined throughput volumes averagedapproximately 3.0 million BPD.
Combined Total Refining System Charges and YieldsCharges
sour crude oil 23%sweet crude oil 54%residual fuel oil 7%other feedstocks 5%blendstocks 11%
Yieldsgasolines and blendstocks 48%distillates 38%
other products (primarily includes petrochemicals,gas oils, No. 6 fuel oil, petroleum coke, sulfurand asphalt) 14%
CaliforniaBenicia Refineryf y. Our Benicia Refinery is located northeast of San Francisco on the Carquinez Straits ofSan FranciscoBay. It processes sour crude oils into gasoline, diesel, jet fuel, and asphalt. Gasoline productionis primarilyCaliforniaReformulatedBlendstockGasoline forOxygenateBlending (CARBOB),whichmeetsCARB specifications when blended with ethanol. The refinery receives crude oil feedstocks via a marinedock and crude oil pipelines connected to a southern California crude oil delivery system. Most of therefinery’s products are distributed via pipeline and truck rack into northern California markets.
Wilmington Refineryg f y. OurWilmington Refinery is located near Los Angeles. The refinery processes a blendof heavy and high-sulfur crude oils. The refinery produces CARBOB gasoline, diesel, CARB diesel, jet fuel,and asphalt. The refinery is connected by pipeline to marine terminals and associated dock facilities thatmove and store crude oil and other feedstocks. Refined petroleum products are distributed via pipelinesystems to various third-party terminals in southern California, Nevada, and Arizona.
LouisianaMeraux Refineryf y. Our Meraux Refinery is located approximately 15 miles southeast of New Orleans alongthe Mississippi River. The refinery processes sour and sweet crude oils into gasoline, diesel, jet fuel, andhigh sulfur fuel oil. The refinery receives crude oil at its dock and has access to the Louisiana Offshoreff OilPort. Finished products are shipped from the refinery’s dock and through the Colonial pipeline. The refineryis located about 40 miles from our St. Charles Refinery,yy allowing for integration of feedstocks and refinedpetroleum product blending.
St. Charles Refineryf y. Our St. Charles Refinery is located approximately 25 miles west of New Orleans alongthe Mississippi River. The refinery processes sour crude oils and other feedstocks into gasoline and diesel.The refinery receives crude oil over docks and has access to the Louisiana Offshoreff Oil Port. Finishedproducts are shipped over these docks and through our Parkway pipeline and the Bengal pipeline, whichultimately provide access to the Plantation and Colonial pipeline networks.
4

OklahomaArdmorrr err Refineryf y. Our Ardmore Refinery is located in Oklahoma, approximately 100 miles south ofOklahoma City. It processes sweet and sour crude oils into gasoline, diesel, and asphalt. The refinerypredominantly receives Permian Basin and Cushing-sourced crude oil via third-party pipelines. Refinedpetroleum products are transported via rail, trucks, and the Magellan pipeline system.
TennesseeMemphis Refineryp f y. Our Memphis Refinery is located in Tennessee along the Mississippi River. It processesprimarily sweet crude oils. Most of its production is gasoline, diesel, and jet fuels. Crude oil supply isprimarily from Cushing, Oklahoma over the Diamond Pipeline. Crude oil can also be received, along withother feedstocks, via barge. Most of the refinery’s products are distributed via truck rack and barges.
TexaseeCorpus Christi East and West Refineriesp f . Our Corpus Christi East and West Refineries are located on theTexas Gulf Coast along the Corpus Christi Ship Channel. The East Refinery processes sour crude oil, andtheWest Refinery processes sweet crude oil, sour crude oil, and residual fuel oil. The feedstocks are deliveredby tanker and barge via deepwater docking facilities along the Corpus Christi Ship Channel, andWest Texasor South Texas crude oil is delivered via pipelines. The refineries’ physical locations allow for the transferof various feedstocks and blending components between them. The refineries produce gasoline, aromatics,jet fuel, diesel, andasphalt.Truckrr racks service localmarkets for gasoline, diesel, jet fuels, liquefiedpetroleumgases, and asphalt. These and other finished products are also distributed by ship and barge across docksand third-party pipelines.
Houston Refineryf y. Our Houston Refinery is located on the Houston Ship Channel. It processes sweet crudeand intermediate oils into gasoline, jet fuel, and diesel. The refinery successfully commissioned a newalkylation unit in 2019. The refinery receives its feedstocks primarily by various interconnecting pipelinesand also haswaterborne-receiving capability at deepwater docking facilities along theHoustonShipChannel.Themajority of its finished products are delivered to local,mid-continentU.S., and northeasternU.S.marketsthrough various pipelines, including the Colonial and Explorer pipelines.
McKee Refineryf y. Our McKee Refinery is located in the Texas Panhandle. It processes primarily sweet crudeoils into gasoline, diesel, jet fuels, and asphalt. The refinery has access to local and Permian Basin crude oilsources via third-party pipelines. Refined petroleum products are transported primarily via third-partypipelines and rail to markets in Texas, New Mexico, Arizona, Colorado, Oklahoma, and Mexico.
Port Arthur Refineryf y. Our Port Arthur Refinery is located on the Texas Gulf Coast approximately 90 mileseast of Houston. The refinery processes heavy sour crude oils and other feedstocks into gasoline, diesel, andjet fuel. The refinery receives crude oil by rail, marine docks, and pipelines. Finished products are distributedinto the Colonial, Explorer, and other pipelines, and across the refinery docks into ships and barges.
Texasee City Refineryy f y. Our Texas City Refinery is located southeast of Houston on the Houston Ship Channel.The refinery processes crude oils into gasoline, diesel, and jet fuel. The refinery receives its feedstocks bypipeline and by ship or barge via deepwater docking facilities along the Houston Ship Channel. The refineryuses ships and barges, as well as the Colonial, Explorer, and other pipelines for distribution of its products.
Threerr Rivers Refineryf y. Our Three Rivers Refinery is located in South Texas between Corpus Christi andSan Antonio. It primarily processes sweet crude oils into gasoline, distillates, and aromatics. The refineryhas access to crude oil from West Texas and South Texas through third-party pipelines and trucks. Therefinery distributes its refined petroleum products primarily through third-party pipelines.
5

CanadaQuebecCity RefineryQ y f y. OurQuebec CityRefinery is located in Lévis, Canada (nearQuebec City). It processessweet crude oils into gasoline, diesel, jet fuel, heating oil, and low-sulfur fuel oil. The refinery receives crudeoil by ship at its deepwater dock on the St. Lawrence River and by pipeline and ship from western Canada.The refinery transports its products through our pipeline from Quebec City to our terminal in Montreal andto various other terminals throughout eastern Canada by rail, ships, trucks, and third-party pipelines.
U.K.Pembrokerr Refineryf y. Our Pembroke Refinery is located in the County of Pembrokeshire in southwest Wales,U.K. The refinery processes primarily sweet crude oils into gasoline, diesel, jet fuel, heating oil, and low-sulfur fuel oil. The refinery receives all of its feedstocks and delivers some of its products by ship and bargevia deepwater docking facilities along the Milford Haven Waterway,yy with its remaining products beingdelivered through our Mainline pipeline system and by trucks.
Feedstock SupplyOur crude oil feedstocks are purchased through a combination of term and spot contracts. Our term supplyagreements are at market-related prices and are purchased directly or indirectly from various national oilcompanies as well as international and U.S. oil companies. The contracts generally permit the parties toamend the contracts (or terminate them), effectiveff as of the next scheduled renewal date, by giving the otherparty proper notice within a prescribed period of time (e.g., 60 days, 6 months) before expiration of thecurrent term. The majority of the crude oil purchased under our term contracts is purchased at the producer’sofficialff stated price (i.e., the “market” price established by the seller for all purchasers) and not at a negotiatedprice specific to us.
MarketingOverview
We sell refined petroleum products in both the wholesale rack and bulk markets. These sales include refinedpetroleum products that are manufactured in our refining operations, as well as refined petroleum productspurchased or received on exchange from third parties. Most of our refineries have access to marinetransportation facilities and interconnect with common-carrier pipeline systems, allowing us to sell productsin the U.S., Canada, the U.K., and other countries.
Wholesale Rack SalesWe sell our gasoline and distillate products, as well as other products, such as asphalt, lube oils, and naturalgas liquids (NGLs), on a wholesale basis through an extensive rack marketing network. The principalpurchasers of our refinedpetroleumproducts from terminal truck racks arewholesalers, distributors, retailers,and truck-delivered end users throughout the U.S., Canada, the U.K., Ireland, and Latin America.
The majority of our rack volume is sold through unbranded channels. The remainder is sold to distributorsand dealers that are members of the Valero-brand family that operate 5,158 branded sites in the U.S.,874 branded sites in the U.K. and Ireland, and 795 branded sites in Canada as of December 31, 2019. Thesesites are independently owned and are supplied by us under multi-year contracts. For branded sites, productsare sold under the Valero®, Beacon®, Diamond Shamrock®, and Shamrock® brands in the U.S., the Texaco®
brand in the U.K. and Ireland, and the Ultramar® brand in Canada.
Bulk SalesWe also sell our gasoline and distillate products, as well as other products, such as asphalt, petrochemicals,and NGLs, through bulk sales channels in the U.S. and international markets. Our bulk sales are made to
6
various oil companies, traders, and bulk end-users, such as railroads, airlines, and utilities. Our bulk salesare transported primarily by pipeline, barges, and tankers to major tank farms and trading hubs.
We also enter into refined petroleum product exchange and purchase agreements. These agreements helpminimize transportation costs, optimize refinery utilization, balance refined petroleum product availability,yybroaden geographic distribution, and provide access tomarkets not connected to our refined product pipelinesystems. Exchange agreements provide for the delivery of refined petroleum products by us to unaffiliatedffcompanies at our and third-parties’terminals in exchange fordeliveryof a similar amountof refinedpetroleumproducts to us by these unaffiliatedff companies at specified locations. Purchase agreements involve ourpurchase of refined petroleum products from third parties with delivery occurring at specified locations.
LogisticsWe own logistics assets (crude oil pipelines, refined petroleum product pipelines, terminals, tanks, marinedocks, truck rack bays, and other assets) that support our refining operations.
ETHANOLWe own 14 ethanol plants with a combined ethanol production capacity of 1.73 billion gallons per year. Ourethanol plants are dry mill facilities that process corn to produce ethanol, distillers grains, and corn oil.Wesource our corn supply from local farmers and commercial elevators. Our facilities receive corn primarilyby rail and truck.We publish on our website a corn bid for local farmers and cooperative dealers to facilitatecorn supply transactions.
We sell our ethanol primarily to refiners and gasoline blenders under term and spot contracts in bulk marketssuch as New York, Chicago, the U.S. Gulf Coast, Florida, and the U.S. West Coast. We also export ourethanol into the global markets. We ship our dry distillers grains (DDGs) by truck or rail primarily to animalfeed customers in the U.S. and Mexico. We also sell modified distillers grains locally at our plant sites, andcorn oil by truck and rail. We distribute our ethanol through logistics assets, which include railcars ownedby us.
7

The following table presents the locations of our ethanol plants, their approximate annual productioncapacities for ethanol (in millions of gallons) and DDGs (in tons), and their approximate annual cornprocessing capacities (in millions of bushels).
State City
EthanolProductionCapacity
Productionof DDGs
CornProcessed
Indiana Blufftonff 115 302,000 40Linden 135 355,000 47Mount Vernon 100 263,000 35
Iowa Albert City 135 355,000 47Charles City 140 368,000 49Fort Dodge 140 368,000 49Hartley 140 368,000 49Lakota 110 289,000 38
Michigan Riga 55 145,000 19Minnesota Welcome 140 368,000 49Nebraska Albion 135 355,000 47Ohio Bloomingburg 135 355,000 47South Dakota Aurora 140 368,000 49Wisconsin Jeffersonff 110 352,000 41Total 1,730 4,611,000 606
The combined production of ethanol from our plants averaged 4.3 million gallons per day for 2019.
RENEWABLEWW DIESELOur renewable segment includes the operations of DGD, which owns and operates a biomass-based dieselplant (the DGD Plant) that processes animal fats, used cooking oils, and other vegetable oils into renewablediesel. The DGD Plant is located next to our St. Charles Refinery in Norco, Louisiana. During 2019, theDGD Plant’s capacity was approximately 18,000 BPD. The DGD Plant is capable of annually convertingapproximately 2.3 billion pounds of rendered and recycled material into more than 275 million gallons ofrenewable diesel. In 2019, we began an expansion of the DGD Plant that is expected to increase productionup to 675 million gallons of renewable diesel annually. DGD is in the advanced engineering review phasefor a potential new renewable diesel plant to be located in Port Arthur, Texas.
8
ENVIRONMENTALTT MATTERSAA
We incorporate by reference into this Item the environmental disclosures contained in the following sectionsof this report:
• Item 1A, “RISK FACTORS”—Compliance with and changes in environmentalrr laws,including proposedrr climate change laws and regulations,e could adversely affect ourperformance;
• Item 1A, “RISK FACTORS”—Compliance with the U.S. Environmentalrr ProtectionrrAgency (EPA)PP Renewable Fuel Standardrr (RFS) could adversely affect our performance;
• Item 1A, “RISK FACTORS”—We may incur additional costs as a result of our use ofrail cars for the transportation of crude oil and the productsrr that we manufacturerr ;
• Item 3, “LEGAL PROCEEDINGS” under the caption “ENVIRONMENTALTTENFORCEMENTMATTERS,”AA and;
• Item 8, “FINANCIALSTATTT EMENTSAND SUPPLEMENTARTT YRR DATAAA ” in Note 8 ofNotes to Consolidated Financial Statements.
Capital Expendituresrr Attributable to Compliance with Environmentalrr Regulations. In 2019, our capitalexpenditures attributable to compliance with environmental regulations were $235 million, and they arecurrently estimated to be $14 million for 2020 and $20 million for 2021. The estimates for 2020 and 2021do not include amounts related to capital investments at our facilities that management has deemed to bestrategic investments. These amounts could materially change as a result of governmental and regulatoryactions.
9
PROPERTIESRR
Our principal properties are described above under the caption “VALERO’SVV OPERATIONS,”AA and thatinformation is incorporated herein by reference. We believe that our properties and facilities are generallyadequate for our operations and that our facilities aremaintained in a good state of repair.As ofDecember 31,2019, we were the lessee under a number of cancelable and noncancelable leases for certain properties. Ourleases are discussed in Note 5 of Notes to Consolidated Financial Statements, which is incorporated hereinby reference. Financial information about our properties is presented in Note 6 of Notes to ConsolidatedFinancial Statements, which is incorporated herein by reference.
Ourpatents relating toour refiningoperationsarenotmaterial tousasawhole.The trademarksand tradenamesunder which we conduct our branded wholesale business — Valero®, Diamond Shamrock®, Shamrock®,Ultramar®, Beacon®, and Texaco®— and other trademarks employed in the marketing of refined petroleumproducts are integral to our wholesale rack marketing operations.
ITEM 1A. RISK FACTORS
You should carefully consider the following risk factors in addition to the other information included in thisreport. Each of these risk factors could adversely affectff our business, operating results, and/or financialcondition, as well as adversely affectff the value of an investment in our common stock.
Our financial results are affectedff by volatile refining margins, which are dependent upon factors beyondour control, including the price of crude oil and the market price at which we can sell refined petroleumproducts.
Our financial results are primarily affectedff by the relationship, ormargin, between refined petroleum productprices and the prices for crude oil and other feedstocks. Historically,yy refining margins have been volatile,and we believe they will continue to be volatile in the future. Our cost to acquire feedstocks and the priceat which we can ultimately sell refined petroleum products depend upon several factors beyond our control,including regional and global supply of and demand for crude oil, gasoline, diesel, and other feedstocks andrefined petroleum products. These in turn depend on, among other things, the availability and quantity ofimports, the production levels of U.S. and international suppliers, levels of refined petroleum productinventories, productivity and growth (or the lack thereof) of U.S. and global economies, U.S. relationshipswith foreign governments, political affairs,ff and the extent of governmental regulation.
Some of these factors can vary by region and may change quickly,yy adding to market volatility,yy while othersmay have longer-term effects.ff The longer-term effectsff of these and other factors on refining and marketingmargins are uncertain.We do not produce crude oil and must purchase all of the crude oil we refine.We maypurchase our crude oil and other refinery feedstocks long beforewe refine them and sell the refined petroleumproducts. Price level changes during the period between purchasing feedstocks and selling the refinedpetroleum products from these feedstocks could have a significant effectff on our financial results. A declinein market prices may negatively impact the carrying value of our inventories.
Economic turmoil and political unrest or hostilities, including the threat of future terrorist attacks, couldaffectff the economies of the U.S. and other countries. Lower levels of economic activity could result indeclines in energy consumption, including declines in the demand for and consumption of our refinedpetroleum products, which could cause our revenues and margins to decline and limit our future growthprospects.
Refining margins are also significantly impacted by additional refinery conversion capacity through theexpansionof existing refineries or the constructionof new refineries.Worldwide refining capacity expansionsmay result in refining production capability exceeding refined petroleumproduct demand, whichwould havean adverse effectff on refining margins.
Asignificantportionofourprofitability isderived fromtheability topurchaseandprocess crudeoil feedstocksthat historically have been cheaper than benchmark crude oils, such as Louisiana Light Sweet (LLS) andBrent crude oils. These crude oil feedstock differentialsff vary significantly depending on overall economicconditions and trends and conditions within the markets for crude oil and refined petroleum products, andthey could decline in the future, which would have a negative impact on our results of operations.
10
Compliance with and changes in environmental laws, including proposed climate change laws andregulations, could adversely affectff our performance.
The principal environmental risks associated with our operations are emissions into the air and releases intothe soil, surface water, or groundwater. Our operations are subject to extensive environmental laws andregulations, including those relating to the discharge of materials into the environment, waste management,pollution prevention measures, greenhouse gas (GHG) emissions, and characteristics and composition offuels, includinggasoline anddiesel.Certain of these laws and regulations could impose obligations to conductassessment or remediation effortsff at our facilities as well as at formerly owned properties or third-party siteswhere we have taken wastes for disposal or where our wastes have migrated. Environmental laws andregulations also may impose liability on us for the conduct of third parties, or for actions that complied withapplicable requirements when taken, regardless of negligence or fault. If we violate or fail to comply withthese laws and regulations, we could be fined or otherwise sanctioned.
Because environmental laws and regulations are becoming more stringent and new environmental laws andregulations are continuously being enacted or proposed, such as those relating toGHG emissions and climatechange, the level of expenditures required for environmental matters could increase in the future. Currentand future legislative action and regulatory initiatives could result in changes to operating permits, materialchanges in operations, increased capital expenditures and operating costs, increased costs of the goods wesell, and decreased demand for our products that cannot be assessed with certainty at this time. We may berequired to make expenditures to modify operations, discontinue use of certain process units, or installpollution control equipment that could materially and adversely affectff our business, financial condition,results of operations, and liquidity.
For example, in 2015, the U.S., Canada, and the U.K. participated in the United Nations Conference onClimate Change, which led to the creation of the Paris Agreement. The Paris Agreement, which was signedby the U.S. in April 2016, requires countries to review and “represent a progression” in their intendednationally determined contributions (which set GHG emission reduction goals) every five years beginningin 2020. In November 2019, the current U.S. administration served notice on the United Nations that theU.S. would withdraw from the Paris Agreement in 2020. There are no guarantees that the Paris Agreementwill not be re-implemented in theU.S. or re-implemented in part by specific U.S. states or local governments.Regardless, the Paris Agreement could still affectff our operations in Canada, the U.K., Ireland, and LatinAmerica. Restrictions on emissions of methane or carbon dioxide that have been or may be imposed invarious U.S. states, at the U.S. federal level, or in other countries could adversely affectff the oil and gasindustry.
Investor sentiment towards climate change, fossil fuels, and sustainability could adversely affectff ourbusiness and our stock price.
There have been effortsff in recent years aimed at the investment community,yy including investment advisors,sovereign wealth funds, public pension funds, universities and other groups, to promote the divestment ofshares of energy companies, as well as to pressure lenders and other financial services companies to limitor curtail activities with energy companies. If these effortsff are successful, our stock price and our ability toaccess capital markets may be negatively impacted.
Members of the investment community are also increasing their focus on sustainability practices, includingpractices related to GHGs and climate change, in the energy industry. As a result, we may face increasingpressure regarding our sustainability disclosures and practices. Additionally,yy members of the investmentcommunity may screen companies such as ours for sustainability performance before investing in our stock.
11

If we are unable to meet the sustainability standards set by these investors, we may lose investors, our stockprice may be negatively impacted and our reputation may be negatively affected.ff
Severe weather events may have an adverse effectff on our assets and operations.
Severe weather events, such as storms, droughts, or floods, could have an adverse effectff on our operations.Members within the scientific community believe that an increasing concentration of GHG emissions in theEarth’s atmosphere may contribute to climate changes that can have significant physical effects,ff includingan increased frequency and severity of these types of events.
Compliance with the U.S. Environmental Protection Agency (EPA)PP Renewable Fuel Standard (RFS)could adversely affectff our performance.
The U.S. EPAPP has implemented the RFS pursuant to the Energy Policy Act of 2005 and the EnergyIndependence and Security Act of 2007. The RFS program sets annual quotas for the quantity of renewablefuels (such as ethanol and diesel) that must be blended into transportation fuels consumed in the U.S.A Renewable Identification Number (RIN) is assigned to each gallon of renewable fuel produced in orimported into the U.S. As a producer of petroleum-based transportation fuels, we are obligated to blendrenewable fuels into the products we produce at a rate that is at least commensurate to the U.S. EPA’PP s quotaand, to the extent we do not, we must purchase RINs in the open market to satisfy our obligation under theRFS program.
We are exposed to the volatility in the market price of RINs. We cannot predict the future prices of RINs.RINs prices are dependent upon a variety of factors, including U.S. EPAPP regulations, the availability of RINsfor purchase, and levels of transportation fuels produced,which can vary significantly fromquarter to quarter.If sufficientff RINs are unavailable for purchase, if we have to pay a significantly higher price for RINs, or ifwe are otherwise unable to meet the U.S. EPA’PP s RFS mandates, our results of operations and cash flowscould be adversely affected.ff
Disruption of our ability to obtain crude oil could adversely affectff our operations.
A significant portion of our feedstock requirements is satisfied through supplies originating in the MiddleEast,Africa,Asia, NorthAmerica, and SouthAmerica.We are, therefore, subject to the political, geographic,and economic risks attendant to doing business with suppliers located in, and supplies originating from,these areas. If one ormore of our supply contractswere terminated, or if political events disrupt our traditionalcrude oil supply,yy we believe that adequate alternative supplies of crude oil would be available, but it ispossible that we would be unable to find alternative sources of supply. If we are unable to obtain adequatecrude oil volumes or are able to obtain such volumes only at unfavorable prices, our results of operationscould be materially adversely affected,ff including reduced sales volumes of refined petroleum products orreduced margins as a result of higher crude oil costs.
In addition, the U.S. government can prevent or restrict us from doing business in or with other countries.These restrictions, and those of other governments, could limit our ability to gain access to businessopportunities in various countries.Actions by both the U.S. and other countries have affectedff our operationsin the past and will continue to do so in the future.
Any attempt by the U.S. government to withdraw from or materially modify existing international tradeagreements could adversely affectff our business, financial condition, and results of operations.
The currentU.S. administration has questioned certain existing and proposed trade agreements. For example,the administration withdrew the U.S. from the Trans-Pacific Partnership. In addition, the administration has
12

implemented and proposed various trade tariffs,ff which have resulted in foreign governments respondingwith tariffsff on U.S. goods.
Changes in U.S. social, political, regulatory,yy and economic conditions or in laws and policies governingforeign trade,manufacturing, development and investment could adversely affectff our business. For example,the imposition of tariffsff or other trade barrierswith other countries could affectff our ability to obtain feedstocksfrom international sources, increase our costs and reduce the competitiveness of our products.
While there is currently a lack of certainty around the likelihood, timing, and details of any such policiesand reforms, if the current U.S. administration takes action to withdraw from, or materially modify,yy existinginternational trade agreements, our business, financial condition, and results of operations could be adverselyaffected.ff
Weare subject to interruptions and increased costs as a result of our reliance on third-party transportationof crude oil and the products that we manufacture.
We use the services of third parties to transport feedstocks to our facilities and to transport the products wemanufacture to market. If we experience prolonged interruptions of supply or increases in costs to deliverour products to market, or if the ability of the pipelines, vessels, or railroads to transport feedstocks orproducts is disrupted because of weather events, accidents, derailment, collision, fire, explosion,governmental regulations, or third-party actions, it could have a material adverse effectff on our financialposition, results of operations, and liquidity.
We may incur additional costs as a result of our use of rail cars for the transportation of crude oil andthe products that we manufacture.
We currently use rail cars for the transportation of some feedstocks to certain of our facilities and for thetransportation of some of the products we manufacture to their markets. We own and lease rail cars for ouroperations. Rail transportation is subject to a variety of federal, state, and local regulations, aswell as industrypractices and customs.New laws and regulations, and changes in existing laws and regulations, are frequentlyenacted or proposed, and could result in increased expenditures for compliance, either directly through costsfor our owned and leased rail assets, or as passed along to us by rail carriers and operators. For example, inthe past several years, the Department of Transportation and various agencies within the Department ofTransportation, including the Surface Transportation Board, the Pipeline and Hazardous Materials SafetyAdministration, and the FederalRailroadAdministration, have issued orders and rules pursuant to the FederalRailroad SafetyAct of 1970, the Interstate Commerce Commission TerminationAct of 1995, the Rail SafetyImprovement Act of 2008, Fixing America’s Surface Transportation Act of 2015 and other statutoryauthorities concerning such matters as enhanced tank car standards, positive train control and otheroperational controls, safety training programs, and notification requirements. The general trend has beentoward greater regulation of rail transportation over recent years. We do not believe these orders and ruleswill have a material impact on our financial position, results of operations, and liquidity,yy although furtherchanges in law,ww regulations, or industry practices could require us to incur additional costs to the extent theyare applicable to us.
Competitors that produce their own supply of feedstocks,ff own their own retail sites, have greater financialresources, or provide alternative energy sources may have a competitive advantage.
The refining and marketing industry is highly competitive with respect to both feedstock supply and refinedpetroleum product markets. We compete with many companies for available supplies of crude oil and otherfeedstocks and for sites for our refined petroleumproducts.We do not produce any of our crude oil feedstocksand, following the separation of our retail business in 2013, we do not have a company-owned retail network.
13

Many of our competitors, however, obtain a significant portion of their feedstocks from company-ownedproduction and some have extensive retail sites. Such competitors are at times able to offsetff losses fromrefining operations with profits from producing or retailing operations, and may be better positioned towithstand periods of depressed refining margins or feedstock shortages.
Some of our competitors also have materially greater financial and other resources than we have. Suchcompetitors have a greater ability to bear the economic risks inherent in all phases of our industry. In addition,we compete with other industries that provide alternative means to satisfy the energy and fuel requirementsof our industrial, commercial, and individual consumers.
Uncertainty and illiquidity in credit and capital markets can impair our ability to obtain credit andfinancing on acceptable terms, and can adversely affectff the financial strength of our business partners.
Our ability to obtain credit and capital depends in large measure on capital markets and liquidity factors thatwe do not control. Our ability to access credit and capital markets may be restricted at a time when we wouldlike, or need, to access those markets, which could have an impact on our flexibility to react to changingeconomic and business conditions. In addition, the cost and availability of debt and equity financing maybe adversely impacted by unstable or illiquid market conditions. Protracted uncertainty and illiquidity inthese markets also could have an adverse impact on our lenders, commodity hedging counterparties, or ourcustomers, causing them to fail to meet their obligations to us. In addition, decreased returns on pensionfund assets may also materially increase our pension funding requirements.
Our access to credit and capitalmarkets also depends on the credit ratings assigned to our debt by independentcredit rating agencies. We currently maintain investment-grade ratings by Standard & Poor’s RatingsServices, Moody’s Investors Service, and Fitch Ratings on our senior unsecured debt. Ratings from creditagencies are not recommendations to buy,yy sell, or hold our securities. Each rating should be evaluatedindependently of any other rating. We cannot provide assurance that any of our current ratings will remainin effectff for any given period of time or that a rating will not be lowered or withdrawn entirely by a ratingagency if, in its judgment, circumstances so warrant. Specifically,yy if ratings agencies were to downgrade ourlong-term rating, particularly below investment grade, our borrowing costs may increase, which couldadversely affectff our ability to attract potential investors and our funding sources could decrease. In addition,we may not be able to obtain favorable credit terms from our suppliers or they may require us to providecollateral, letters of credit, or other forms of security,yy which would increase our operating costs. As a result,a downgrade below investment grade in our credit ratings could have a material adverse impact on ourfinancial position, results of operations, and liquidity.
From time to time, our cash needs may exceed our internally generated cash flow,ww and our business couldbe materially and adversely affectedff if we were unable to obtain necessary funds from financing activities.From time to time, we may need to supplement our cash generated from operations with proceeds fromfinancing activities. We have existing revolving credit facilities, committed letter of credit facilities, and anaccounts receivable sales facility to provide us with available financing to meet our ongoing cash needs. Inaddition, we rely on the counterparties to our derivative instruments to fund their obligations under sucharrangements. Uncertainty and illiquidity in financial markets may materially impact the ability of theparticipating financial institutions and other counterparties to fund their commitments to us under our variousfinancing facilities or our derivative instruments, which could have a material adverse effectff on our financialposition, results of operations, and liquidity.
14

A significant interruption in one or more of our refineries could adversely affectff our business.
Our refineries are our principal operating assets. As a result, our operations could be subject to significantinterruption if one or more of our refineries were to experience a major accident or mechanical failure, bedamaged by severe weather or other natural or man-made disaster, such as an act of terrorism, or otherwisebe forced to shut down. If any refinery were to experience an interruption in operations, earnings from therefinery could be materially adversely affectedff (to the extent not recoverable through insurance) because oflost production and repair costs. Significant interruptions in our refining system could also lead to increasedvolatility in prices for crude oil feedstocks and refined petroleum products, and could increase instability inthe financial and insurance markets, making it more difficultff for us to access capital and to obtain insurancecoverage that we consider adequate.
A significant interruption related to our information technology systems could adversely affectff ourbusiness.
Our information technology systems and network infrastructure may be subject to unauthorized access orattack,which could result in (i) a loss of intellectual property,yy proprietary information, or employee, customeror vendor data; (ii) public disclosure of sensitive information; (iii) increased costs to prevent, respond to, ormitigate cybersecurity events, such as deploying additional personnel and protection technologies, trainingemployees, and engaging third-party experts and consultants; (iv) systems interruption; (v) disruption of ourbusiness operations; (vi) remediation costs for repairs of system damage; (vii) reputational damage thatadversely affectsff customer or investor confidence; and (viii) damage to our competitiveness, stock price,and long-term stockholder value. A breach could also originate from, or compromise, our customers’ andvendors’ or other third-party networks outside of our control. A breach may also result in legal claims orproceedings against us by our shareholders, employees, customers, vendors, and governmental authorities(U.S. and non-U.S.). There can be no assurance that our infrastructure protection technologies and disasterrecovery plans can prevent a technology systems breach or systems failure, which could have a materialadverse effectff on our financial position or results of operations. Furthermore, the continuing and evolvingthreat of cyberattacks has resulted in increased regulatory focus onprevention.To the extentwe face increasedregulatory requirements, we may be required to expend significant additional resources to meet suchrequirements.
Increasingregulatory focusyy onprivacyandsecurity issuesandexpanding lawscouldexposeus to increasedliability,yy subject us to lawsuits, investigations and other liabilities and restrictions on our operations thatcould significantly and adversely affectff our business.
Along with our own data and information in the normal course of our business, we and our partners collectand retain certain data that is subject to specific laws and regulations. The transfer and use of this data bothdomestically and across international borders is becoming increasingly complex. This data is subject togovernmental regulation at the federal, state, international, national, provincial and local levels inmany areasof our business, including data privacy and security laws such as the European Union (EU) General DataProtection Regulation (GDPR) and the California Consumer Privacy Act (CCPA).PP
The GDPR applies to activities regarding personal data that may be conducted by us, directly or indirectlythrough vendors and subcontractors, from an establishment in the EU.As interpretation and enforcement oftheGDPR evolves, it creates a range of new compliance obligations, which could cause us to incur additionalcosts. Failure to comply could result in significant penalties of up to a maximum of 4 percent of our globalturnover that may materially adversely affectff our business, reputation, results of operations, and cash flows.
The CCPA,PP which came into effectff on January 1, 2020, gives California residents specific rights in relationto their personal information, requires that companies take certain actions, including notifications for security
15
incidents and may apply to activities regarding personal information that is collected by us, directly orindirectly,yy from California residents. As interpretation and enforcement of the CCPAPP evolves, it creates arangeofnewcomplianceobligations,with thepossibility for significant financialpenalties fornoncompliancethat may materially adversely affectff our business, reputation, results of operations, and cash flows.
The GDPR and CCPA,PP as well as other data privacy laws that may become applicable to our business, poseincreasingly complex compliance challenges and potentially elevate our costs. Any failure by us to complywith these laws and regulations, including as a result of a security or privacy breach, could result in significantpenalties and liabilities for us.Additionally,yy if we acquire a company that has violated or is not in compliancewith applicable data protection laws, we may incur significant liabilities and penalties as a result.
Our business may be negatively affectedff by work stoppages, slowdowns or strikes by our employees, aswell as new labor legislation issued by regulators.
Workers at some of our refineries are covered by collective bargaining or similar agreements. To the extentwe are in negotiations for labor agreements expiring in the future, there is no assurance an agreement willbe reached without a strike, work stoppage, or other labor action. Any prolonged strike, work stoppage, orother labor action could have an adverse effectff on our financial condition or results of operations. In addition,future federal, state, or foreign labor legislation could result in labor shortages and higher costs, especiallyduring critical maintenance periods.
We are subject to operational risks and our insurance may not be sufficientff to cover all potential lossesarising from operating hazards. Failure by one or more insurers to honor its coverage commitments foran insured event could materially and adversely affectff our financial position, results of operations, andliquidity.
Our operations are subject to various hazards common to the industry,yy including explosions, fires, toxicemissions, maritime hazards, and natural catastrophes. As protection against these hazards, we maintaininsurance coverage against some, but not all, potential losses and liabilities. We may not be able to maintainor obtain insurance of the type and amount we desire at reasonable rates. As a result of market conditions,premiumsanddeductibles for certain of our insurancepolicies could increase substantially. In some instances,certain insurance could become unavailable or available only for reduced amounts of coverage. For example,coverage for hurricane damage is very limited, and coverage for terrorism risks includes very broadexclusions. If we were to incur a significant liability for which we were not fully insured, it could have amaterial adverse effectff on our financial position, results of operations, and liquidity.
Our insurance program includes a number of insurance carriers. Significant disruptions in financial marketscould lead to a deterioration in the financial condition of many financial institutions, including insurancecompanies. We can make no assurances that we will be able to obtain the full amount of our insurancecoverage for insured events.
Large capital projects can take many years to complete, and market conditions could deteriorate overtime, negatively impacting project returns.
We may engage in capital projects based on the forecasted project economics and level of return on thecapital to be employed in the project. Large-scale projects takemanyyears to complete, andmarket conditionscan change from our forecast. As a result, we may be unable to fully realize our expected returns, whichcould negatively impact our financial condition, results of operations, and cash flows.
16

Compliance with and changes in tax laws could adversely affectff our performance.
We are subject to extensive tax liabilities imposed by multiple jurisdictions, including income taxes, indirecttaxes (excise/duty,yy sales/use, gross receipts, and value-added taxes), payroll taxes, franchise taxes,withholding taxes, and ad valorem taxes. New tax laws and regulations and changes in existing tax laws andregulations are continuously being enacted or proposed that could result in increased expenditures for taxliabilities in the future.Manyof these liabilities are subject toperiodic auditsby the respective taxingauthority.Subsequent changes to our tax liabilities as a result of these audits may subject us to interest and penalties.
OnDecember 22, 2017, tax legislation commonly known as the Tax Cuts and JobsAct of 2017 (TaxTT Reform)was enacted. Among other things, Tax Reform reduced the U.S. corporate income tax rate from 35 percentto 21 percent and implemented a new system of taxation for non-U.S. earnings, including by imposing aone-time tax on the deemed repatriation of undistributed earnings of non-U.S. subsidiaries. Tax Reform alsogenerally (i) repealed the manufacturing deduction we previously were able to claim, (ii) resulted in a shiftfrom a worldwide system of taxation to a territorial system of taxation, resulting in a minimum tax on theincome of international subsidiaries (the GILTILL tax) rather than a tax deferral on such earnings in certaincircumstances, (iii) limits our annual deductions for interest expense to no more than 30 percent of our“adjusted taxable income” (plus 100 percent of our business interest income) for the year and (iv) permitsus to offsetff only 80 percent (rather than 100 percent) of our taxable income with any net operating losseswe generate after 2017. We have evaluated the effectsff of Tax Reform, including the one-time deemedrepatriation tax and the re-measurement of our deferred tax assets and liabilities, and the provisions of TaxReform, taken as a whole, did not have an adverse impact on our cash tax liabilities, results of operations,or financial condition. We have used reasonable interpretations and assumptions in applying Tax Reform,but it is possible that the Internal Revenue Service (IRS) could issue subsequent guidance or take positionson audit that differff from our prior interpretations and assumptions, which could adversely impact our cashtax liabilities, results of operations, and financial condition.
Our investments in joint ventures and other entities decrease our ability to manage risk.
We conduct some of our operations through joint ventures in which we may share control over certaineconomic and business interests with our joint venture partners and in some entities in which we have noownership or control. Our joint venture partners may have economic, business or legal interests or goals thatare inconsistent with our goals and interests or may be unable to meet their obligations. Failure by us, or anentity in which we have a joint-venture interest, to adequately manage the risks associated with anyacquisitions or joint ventures could have a material adverse effectff on our, or our joint ventures’, financialposition, results of operations, and liquidity.
We maya incur losses and additional costs as a result of our forward-contract activities and derivativetransactions.
We currently use commodity derivative instruments, and we expect to continue their use in the future. If theinstruments we use to hedge our exposure to various types of risk are not effective,ff we may incur losses. Inaddition, we may be required to incur additional costs in connection with future regulation of derivativeinstruments to the extent it is applicable to us.
Changes in the method of determining the London Interbank Offeredff Rate (LIBOR), or the replacementof LIBOR with an alternative reference rate, may adversely affectff interest rates.
On July 27, 2017, the Financial Conduct Authority in the U.K. announced that it would phase out LIBORasabenchmarkby theendof2021. It is unclearwhethernewmethodsof calculatingLIBORwill beestablishedsuch that it continues to exist after 2021, or whether differentff benchmark rates used to price indebtedness
17

will develop. In the future, we may need to renegotiate our financial agreements, including, but not limitedto, our revolving credit facility (the Valero Revolver), or incur other indebtedness, and the phase-out ofLIBORmay negatively impact the terms of such indebtedness. In addition, the overall financial market maybe disrupted as a result of the phase-out or replacement of LIBOR. Disruption in the financial market couldhave a material adverse effectff on our financial position, results of operations, and liquidity.
Changes in the U.K.’s’’ economic and other relationships with the EU could adversely affectff us.
In June 2016, theU.K. elected towithdraw from theEU in a national referendum (Brexit). TheU.K.withdrewfrom the EU on January 31, 2020, consistent with the terms of the EU-U.K. Withdrawal Agreement. Theterms of that agreement provide for a transition period, from January 31, 2020 to December 31, 2020, duringwhich the trading relationship between the U.K. and the EU will remain the same while the U.K. and theEU try to negotiate an agreement regarding their future trading relationship. The ultimate effectsff of Brexitwill depend on whether an agreement is reached, or on the specific terms of any such agreement that isreached, either of which outcomes could adversely impact the ability to trade freely between the U.K. andthe EU at the end of the transition period and could negatively impact our competitive position, supplier andcustomer relationships, and financial performance.
18
ITEM 1B. UNRESOLVEDLL STAFFTT COMMENTS
None.
ITEM 3. LEGALPROCEEDINGS
LITIGATIONAA
We incorporate by reference into this Item our disclosures made in Part II, Item 8 of this report included inNote 1 of Notes to Consolidated Financial Statements under the caption “Legal Contingencies.”
ENVIRONMENTALTT ENFORCEMENTMATTERSAA
While it is not possible to predict the outcome of the following environmental proceedings, if any one ormore of them were decided against us, we believe that there would be no material effectff on our financialposition, results of operations, or liquidity. We are reporting these proceedings to comply with SECregulations, which require us to disclose certain information about proceedings arising under federal, state,or local provisions regulating the discharge of materials into the environment or protecting the environmentif we reasonably believe that such proceedings will result in monetary sanctions of $100,000 or more.
U.S. EPAPP (Fuels). In our annual report on Form 10-K for the year ended December 31, 2018, we reportedthat we had an outstanding Notice of Violation (NOV) from the U.S. EPAPP related to violations from a 2015Mobile Source Inspection. In the fourth quarter of 2019, we received a draft Consent Order from the U.S.EPAPP proposing penalties of $3.4 million. We are working with the U.S. EPAPP to resolve this matter.
Attorney General of the State of Texasee (TexasTT AG) (Corpus Christi Asphalt Plant). In our quarterly report onForm 10-Q for the quarter endedMarch 31, 2019, we reported that we had received a letter and draftAgreedFinal Judgment from the Texas AG related to a contaminated water backflow incident that occurred at theValero Corpus Christi Asphalt Plant. The draft Agreed Final Judgment assesses proposed penalties in theamount of $1.3 million. We are working with the Texas AG to resolve this matter.

Texasee AG (Port Arthur Refinery). In our quarterly report on Form 10-Q for the quarter ended June 30, 2019,we reported that the Texas AG had filed suit against our Port Arthur Refinery in the 419th Judicial DistrictCourt of Travis County,yy Texas, Cause No. D-1-GN-19-004121, for alleged violations of the Clean Air Actseeking injunctive relief and penalties. We are working with the Texas AG to resolve this matter.
Texasee AG (Houston Terminal). In our annual report on Form 10-K for the year ended December 31, 2018,we reported that we had an outstanding Notice of Enforcement (NOE) from the Texas Commission onEnvironmental Quality (TCEQ), and an outstandingViolationNotice (VN) from theHarris County PollutionControl Services Department, both alleging excess emissions fromTank 003 that occurred during HurricaneHarvey. On January 27, 2020, the Texas AG filed suit related to this incident against our Houston Terminalin the419th JudicialDistrictCourt ofTravisCounty,yy Texas,CauseNo.D-1-GN-20-000516 seeking injunctiverelief and penalties. We are working with the Texas AG to resolve this matter.
Bay Arearr Air Quality Management District (BAAQMD) and Solano County Department of ResourcerrManagement Certified Unified Programrr Agency (Solano County) (Benicia Refinery). In our quarterly reporton Form 10-Q for the quarter ended March 31, 2019, we reported that we had received multiple VNs issuedby the BAAQMD related to an upset of the Flue Gas Scrubber (FGS) at our Benicia Refinery,yy and a draftConsent from Solano County related to the FGS incident proposing penalties of $242,840. In our quarterlyreport on Form 10-Q for the quarter ended September 30, 2019, we reported that we had resolved the matterwith Solano County. We continue to work with the BAAQMD on a final resolution of the remaining VNs.
BAAQMD (Benicia Refinery). In our annual report on Form 10-K for the year ended December 31, 2018,we reported that we had multiple outstanding VNs issued by the BAAQMD. These VNs are for variousalleged air regulation and air permit violations at our Benicia Refinery and asphalt plant. We continue towork with the BAAQMD to resolve these VNs.
South Coast Air Quality Management District (SCAQMD) (WilmingtonWW Refinery). In our annual report onForm 10-K for the year ended December 31, 2018, we reported that we had outstanding Notices of Violation(NOVs) issued by the SCAQMD. These NOVs are for alleged reporting violations and excess emissions atour Wilmington Refinery. We are working with the SCAQMD to resolve these NOVs.
TCEQ (PortArthur). In our annual report on Form 10-K for the year ended December 31, 2018, we reportedthat we had an outstanding NOE from the TCEQ alleging unauthorized emissions associated with aNovember 18, 2017 release of crude oil from the 24-inch fill pipe of Tank T-285. We are working with theTCEQ to resolve this matter.
19
ITEM 4. MINE SAFETY DISCLOSURES
None.

PART II
20
ITEM 5. MARKET FOR REGISTRANT’S COMMON EQUITY,YY RELATEDAA STOCKHOLDERMATTERSAA AND ISSUER PURCHASES OF EQUITY SECURITIES
Our common stock trades on the NYSE under the trading symbol “VLO.”
As of January 31, 2020, there were 5,082 holders of record of our common stock.
Dividends are considered quarterly by the board of directors, may be paid only when approved by the board,and will depend on our financial condition, results of operations, cash flows, prospects, industry conditions,capital requirements, and other factors and restrictions our board deems relevant. There can be no assurancethat we will pay a dividend at the rates we have paid historically,yy or at all, in the future.
The following table discloses purchases of shares of our common stock made by us or on our behalf duringthe fourth quarter of 2019.
Period
Total Numberof SharesPurchased
AveragePrice Paidper Share
Total Number ofShares Not
Purchased as Part ofPublicly AnnouncedPlans or Programs (a)
Total Number ofShares Purchased asPart of Publicly
Announced Plans orPrograms
Approximate DollarValue of Shares thatMay Yet Be PurchasedUnder the Plans orPrograms (b)
October 2019 332,704 $ 88.06 98,396 234,308 $1.6 billionNovember 2019 1,565,500 $ 99.21 107,914 1,457,586 $1.5 billionDecember 2019 393,694 $ 94.61 6,984 386,710 $1.5 billionTotal 2,291,898 $ 96.80 213,294 2,078,604 $1.5 billion____________________________________
(a) The shares reported in this column represent purchases settled in the fourth quarter of 2019 relating to (i) ourpurchases of shares in open-market transactions to meet our obligations under stock-based compensation plansand (ii) our purchases of shares from our employees and non-employee directors in connection with the exerciseof stock options, the vesting of restricted stock, and other stock compensation transactions in accordance withthe terms of our stock-based compensation plans.
(b) On January 23, 2018, we announced that our board of directors authorized our purchase of up to $2.5 billion ofour outstanding common stock (the 2018 Program), with no expiration date. As of December 31, 2019, we had$1.5 billion remaining available for purchase under the 2018 Program.

The following performance graph is not “soliciting material,” is not deemed filed with the SEC, and is notto be incorporated by refere encerr into any of Valerorr ’s filings under the Securities Act of 1933 or the SecuritiesExchange Act of 1934, as amended, respectively.
This performance graph and the related textual information are based on historical data and are not indicativeof future performance. The following line graph compares the cumulative total return(a) on an investment inour common stock against the cumulative total return of the S&P 500 Composite Index and an index of peercompanies (that we selected) for the five-year period commencing December 31, 2014 and endingDecember 31, 2019. Our peer group comprises the following eight companies: BP plc; CVR Energy,yy Inc.;Delek US Holdings, Inc.; HollyFrontier Corporation; Marathon Petroleum Corporation; PBF Energy Inc.;Phillips 66; and Royal Dutch Shell plc.
COMPARISONPP OF 5 YEAR CUMULATIVEAA TOTALRETURN(a)
Among Valero Energy Corporation, the S&P 500 Index,and Peer Group
As of December 31,2014 2015 2016 2017 2018 2019
Valero Common Stock $ 100.00 $ 146.79 $ 147.94 $ 207.10 $ 174.54 $ 227.53S&P 500 100.00 101.38 113.51 138.29 132.23 173.86Peer Group 100.00 88.46 106.16 134.53 125.35 137.49____________________________________
(a) Assumes that an investment inValero common stock and each indexwas $100 onDecember 31, 2014. “Cumulative total return”is based on share price appreciation plus reinvestment of dividends from December 31, 2014 through December 31, 2019.
21
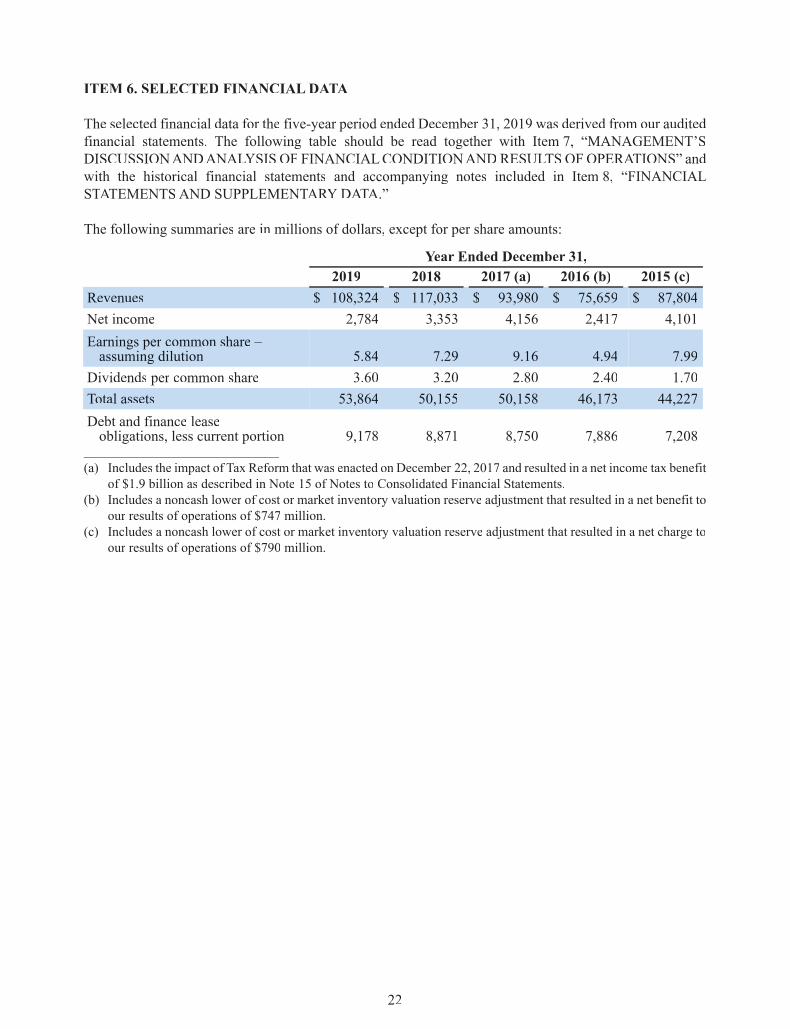
ITEM 6. SELECTED FINANCIALDATAAA
The selected financial data for the five-year period ended December 31, 2019 was derived from our auditedfinancial statements. The following table should be read together with Item 7, “MANAGEMENT’SDISCUSSIONANDANALYSISLL OF FINANCIALCONDITIONANDRESULTSLL OFOPERATIONS”AA andwith the historical financial statements and accompanying notes included in Item 8, “FINANCIALSTATTT EMENTSAND SUPPLEMENTARTT YRR DATAAA .”
The following summaries are in millions of dollars, except for per share amounts:
Year Ended December 31,2019 2018 2017 (a) 2016 (b) 2015 (c)
Revenues $ 108,324 $ 117,033 $ 93,980 $ 75,659 $ 87,804Net income 2,784 3,353 4,156 2,417 4,101Earnings per common share –assuming dilution 5.84 7.29 9.16 4.94 7.99
Dividends per common share 3.60 3.20 2.80 2.40 1.70Total assets 53,864 50,155 50,158 46,173 44,227Debt and finance leaseobligations, less current portion 9,178 8,871 8,750 7,886 7,208
_________________________________________________
(a) Includes the impact of Tax Reform that was enacted on December 22, 2017 and resulted in a net income tax benefitof $1.9 billion as described in Note 15 of Notes to Consolidated Financial Statements.
(b) Includes a noncash lower of cost or market inventory valuation reserve adjustment that resulted in a net benefit toour results of operations of $747 million.
(c) Includes a noncash lower of cost or market inventory valuation reserve adjustment that resulted in a net charge toour results of operations of $790 million.
22
ITEM 7. MANAGEMENT’S DISCUSSION AND ANALYSISLL OF FINANCIAL CONDITION ANDRESULTSLL OFOPERATIONSAA
The following review of our results of operations and financial condition should be read in conjunction withItem 1A, “RISK FACTORS,” and Item 8, “FINANCIAL STATTT EMENTS AND SUPPLEMENTARTT YRRDATAAA ,” included in this report.
23
CAUTIONARYRR STATTT EMENT FOR THE PURPOSE OF SAFE HARBOR PROVISIONS OF THEPRIVATVV E SECURITIES LITIGATIONAA REFORMACT OF 1995
This report, including without limitation our disclosures below under the heading “OVERVIEWRR ANDOUTLOOK,” includes forward-looking statements within the meaning of Section 27Aof the SecuritiesActof 1933 and Section 21E of the Securities Exchange Act of 1934. You can identify our forward-lookingstatements by the words “anticipate,” “believe,” “expect,” “plan,” “intend,” “scheduled,” “estimate,”“project,” “projection,” “predict,” “budget,” “forecast,” “goal,” “guidance,” “target,” “could,” “would,”“should,” “will,” “may,”yy and similar expressions.
These forward-looking statements include, among other things, statements regarding:
• futureff refining segment margins, including gasoline and distillate margins;• futureff ethanol segment margins;• futureff renewable diesel segment margins;• expectations regarding feedstock costs, including crude oil differentials,ff and operating expenses;• anticipated levels of crude oil and refined petroleum product inventories;• our anticipated level of capital investments, including deferred turnaround and catalyst cost
expenditures, capital expenditures for environmental and other purposes, and joint ventureinvestments, and the effectff of those capital investments on our results of operations;
• anticipated trends in the supply of and demand for crude oil and other feedstocks and refinedpetroleum products in the regions where we operate, as well as globally;
• expectations regarding environmental, tax, and other regulatory initiatives; and• the effectff of general economic and other conditions on refining, ethanol, and renewable diesel
industry fundamentals.
We based our forward-looking statements on our current expectations, estimates, and projections aboutourselves and our industry. We caution that these statements are not guarantees of future performance andinvolve risks, uncertainties, and assumptions that we cannot predict. In addition, we based many of theseforward-looking statements on assumptions about future events thatmayprove to be inaccurate.Accordingly,yyour actual results may differff materially from the future performance that we have expressed or forecast inthe forward-looking statements. Differencesff between actual results and any future performance suggestedin these forward-looking statements could result from a variety of factors, including the following:
• acts of terrorism aimed at either our facilities or other facilities that could impair our ability toproduce or transport refined petroleum products or receive feedstocks;
• political and economic conditions in nations that produce crude oil or consume refined petroleumproducts;
• demand for, and supplies of, refined petroleum products (such as gasoline, diesel, jet fuel, andpetrochemicals), ethanol, and renewable diesel;
• demand for, and supplies of, crude oil and other feedstocks;
• the ability of the members of the Organization of Petroleum Exporting Countries to agree on and tomaintain crude oil price and production controls;
• the level of consumer demand, including seasonal fluctuations;• refinery overcapacity or undercapacity;• our ability to successfully integrate any acquired businesses into our operations;• the actions taken by competitors, including both pricing and adjustments to refining capacity in
response to market conditions;• the level of competitors’ imports into markets that we supply;• accidents, unscheduled shutdowns, or other catastrophes affectingff our refineries, machinery,yy
pipelines, equipment, and information systems, or those of our suppliers or customers;• changes in the cost or availability of transportation for feedstocks and refined petroleum products;• the price, availability,yy and acceptance of alternative fuels and alternative-fuel vehicles;• the levels of government subsidies for alternative fuels;• the volatility in the market price of biofuel credits (primarily RINs needed to comply with the RFS)
and GHG emission credits needed to comply with the requirements of various GHG emissionprograms;
• delay of, cancellation of, or failure to implement planned capital projects and realize the variousassumptions and benefits projected for such projects or cost overruns in constructing such plannedcapital projects;
• earthquakes, hurricanes, tornadoes, and irregular weather, which can unforeseeably affectff the priceor availability of natural gas, crude oil, grain and other feedstocks, refined petroleum products,ethanol, and renewable diesel;
• rulings,rr judgments, or settlements in litigation or other legal or regulatory matters, includingunexpected environmental remediation costs, in excess of any reserves or insurance coverage;
• legislative or regulatory action, including the introduction or enactment of legislation or rulemakingsby governmental authorities, including tariffsff and tax and environmental regulations, such as thoseimplemented under the California cap-and-trade system and similar programs, and the U.S. EPA’PP sregulation of GHGs, which may adversely affectff our business or operations;
• changes in the credit ratings assigned to our debt securities and trade credit;• changes in currency exchange rates, including the value of the Canadian dollar, the pound sterling,
the euro, the Mexican peso, and the Peruvian sol relative to the U.S. dollar;• overall economic conditions, including the stability and liquidity of financial markets; and• other factors generally described in the “RISK FACTORS” section included in Item 1A, “RISK
FACTORS” in this report.
Any one of these factors, or a combination of these factors, could materially affectff our future results ofoperations andwhether any forward-looking statements ultimately prove to be accurate.Our forward-lookingstatements are not guarantees of future performance, and actual results and future performance may differffmaterially from those suggested in any forward-looking statements. We do not intend to update thesestatements unless we are required by the securities laws to do so.
All subsequent written and oral forward-looking statements attributable to us or persons acting on our behalfare expressly qualified in their entirety by the foregoing.We undertake no obligation to publicly release anyrevisions to any such forward-looking statements that may be made to reflect events or circumstances afterthe date of this report or to reflect the occurrence of unanticipated events.
24

NON-GAAP FINANCIALMEASURES
The discussions in “OVERVIEWRR AND OUTLOOK” and “RESULTSLL OF OPERATIONS”AA below includereferences to financial measures that are not defined under U.S. generally accepted accounting principles(GAAP). These non-GAAP financial measures include adjusted operating income (including adjustedoperating income for each of our reportable segments) and refining, ethanol, and renewable diesel segmentmargin.We have included these non-GAAP financial measures to help facilitate the comparison of operatingresults between years. See the tables in note (f) beginning on page 39 for reconciliations of these non-GAAPfinancial measures to their most directly comparable U.S. GAAP financial measures. Also in note (f), wedisclose the reasonswhywebelieveouruseof thenon-GAAPfinancialmeasuresprovidesuseful information.
25
OVERVIEWRR AND OUTLOOK
OverviewFor 2019, we reported net income attributable toValero stockholders of $2.4 billion compared to $3.1 billionfor 2018, which represents a decrease of $700 million. This decrease is the result of a $569 million decreasein net income and a $131 million increase in net income attributable to noncontrolling interests. The increasein net income attributable to noncontrolling interests is primarily due to a $279 million pre-tax increase inblender’s tax credits recognized in 2019 compared to 2018, of which 50 percent is attributable to the holderof the noncontrolling interest, as described in note (a) on page 38. The decrease in net income is primarilydue to a decrease of $736 million in operating income between the periods, net of the resulting $177 milliondecrease in income tax expense.
While operating income decreased by $736 million in 2019 compared to 2018, adjusted operating incomedecreased by $1.0 billion. Adjusted operating income excludes adjustments reflected in the table in note (f)on page 42.
The $1.0 billion decrease in adjusted operating income is primarily due to the following:
• Refining segment. Refining segment adjusted operating income decreased by $1.1 billion primarilydue to weaker discounts on crude oils and other feedstocks and lower throughput volumes, partiallyoffsetff by improved distillate margins. This is more fully described on pages 31 and 32.
• Ethanol segment. Ethanol segment adjusted operating income decreased by $78 million primarilydue to higher corn prices and higher operating expenses (excluding depreciation and amortizationexpense), partially offsetff by higher ethanol prices. This is more fully described on page 33.
• Renewable diesel segment. Renewable diesel segment adjusted operating income increased by$259 million primarily due to an increase in renewable diesel sales volumes and an increase in thebenefit from the blender’s tax credit resulting from an increase in the volume of renewable dieselblended with petroleum-based diesel in 2019 compared to 2018. This is more fully described onpages 34 and 35.
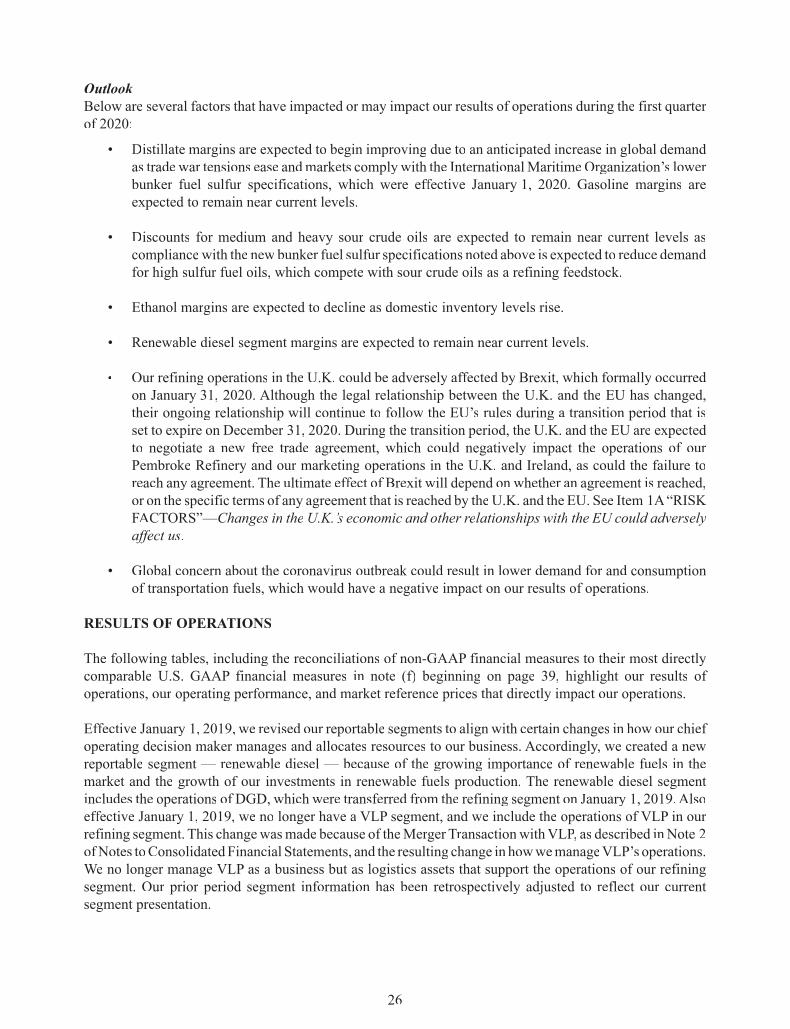
OutlookBelow are several factors that have impacted or may impact our results of operations during the first quarterof 2020:
• Distillate margins are expected to begin improving due to an anticipated increase in global demandas trade war tensions ease andmarkets comply with the InternationalMaritimeOrganization’s lowerbunker fuel sulfur specifications, which were effectiveff January 1, 2020. Gasoline margins areexpected to remain near current levels.
• Discounts for medium and heavy sour crude oils are expected to remain near current levels ascompliancewith the new bunker fuel sulfur specifications noted above is expected to reduce demandfor high sulfur fuel oils, which compete with sour crude oils as a refining feedstock.
• Ethanol margins are expected to decline as domestic inventory levels rise.
• Renewable diesel segment margins are expected to remain near current levels.
• Our refining operations in the U.K. could be adversely affectedff by Brexit, which formally occurredon January 31, 2020. Although the legal relationship between the U.K. and the EU has changed,their ongoing relationship will continue to follow the EU’s rules during a transition period that isset to expire on December 31, 2020. During the transition period, the U.K. and the EU are expectedto negotiate a new free trade agreement, which could negatively impact the operations of ourPembroke Refinery and our marketing operations in the U.K. and Ireland, as could the failure toreach any agreement. The ultimate effectff of Brexit will depend on whether an agreement is reached,or on the specific terms of any agreement that is reached by the U.K. and the EU. See Item 1A“RISKFACTORS”—Changes in the U.K.’s economic and other relationships with the EU could adverselyaffect us.
• Global concern about the coronavirus outbreak could result in lower demand for and consumptionof transportation fuels, which would have a negative impact on our results of operations.
26
RESULTSLL OFOPERATIONSAA
The following tables, including the reconciliations of non-GAAP financial measures to their most directlycomparable U.S. GAAP financial measures in note (f) beginning on page 39, highlight our results ofoperations, our operating performance, and market reference prices that directly impact our operations.
Effectiveff January 1, 2019, we revised our reportable segments to align with certain changes in how our chiefoperating decision maker manages and allocates resources to our business. Accordingly,yy we created a newreportable segment — renewable diesel — because of the growing importance of renewable fuels in themarket and the growth of our investments in renewable fuels production. The renewable diesel segmentincludes the operations of DGD, which were transferred from the refining segment on January 1, 2019.Alsoeffectiveff January 1, 2019, we no longer have a VLP segment, and we include the operations of VLP in ourrefining segment. This changewasmade because of theMerger TransactionwithVLP,PP as described inNote 2ofNotes toConsolidatedFinancial Statements, and the resulting change in howwemanageVLP’s operations.We no longer manage VLP as a business but as logistics assets that support the operations of our refiningsegment. Our prior period segment information has been retrospectively adjusted to reflect our currentsegment presentation.

2019 Compared to 2018p
Financial Highlights by Segment and Total Company(millions of dollars)
________________
See note references on pages 38 through 42.
Year Ended December 31, 2019
Refining EthanolRenewableDiesel
Corporateand
Eliminations TotalRevenues:Revenues from external customers $ 103,746 $ 3,606 $ 970 $ 2 $ 108,324Intersegment revenues 18 231 247 (496) —Total revenues 103,764 3,837 1,217 (494) 108,324
Cost of sales:Cost of materials and other (a) 93,371 3,239 360 (494) 96,476Operating expenses (excluding depreciation andamortization expense reflected below) 4,289 504 75 — 4,868
Depreciation and amortization expense 2,062 90 50 — 2,202Total cost of sales 99,722 3,833 485 (494) 103,546
Other operating expenses (b) 20 1 — — 21General and administrative expenses (excludingdepreciation and amortization expense reflectedbelow) — — — 868 868
Depreciation and amortization expense — — — 53 53Operating income by segment $ 4,022 $ 3 $ 732 $ (921) 3,836Other income, net (d) 104Interest and debt expense, net of capitalizedinterest (454)
Income before income tax expense 3,486Income tax expense 702Net income 2,784Less: Net income attributable to noncontrollinginterests (a) 362
Net income attributable toValero Energy Corporation stockholders $ 2,422
,
27

Financial Highlights by Segment and Total Company (continued)(millions of dollars)
Year Ended December 31, 2018
Refining EthanolRenewableDiesel
Corporateand
Eliminations TotalRevenues:Revenues from external customers $ 113,093 $ 3,428 $ 508 $ 4 $ 117,033Intersegment revenues 25 210 170 (405) —Total revenues 113,118 3,638 678 (401) 117,033
Cost of sales:Cost of materials and other (a) 101,866 3,008 262 (404) 104,732Operating expenses (excluding depreciation andamortization expense reflected below) 4,154 470 66 — 4,690
Depreciation and amortization expense 1,910 78 29 — 2,017Total cost of sales 107,930 3,556 357 (404) 111,439
Other operating expenses (b) 45 — — — 45General and administrative expenses (excludingdepreciation and amortization expense reflectedbelow) (c) — — — 925 925
Depreciation and amortization expense — — — 52 52Operating income by segment $ 5,143 $ 82 $ 321 $ (974) 4,572Other income, net (d) 130Interest and debt expense, net of capitalizedinterest (470)
Income before income tax expense 4,232Income tax expense (e) 879Net income 3,353Less: Net income attributable to noncontrollinginterests (a) 231
Net income attributable toValero Energy Corporation stockholders $ 3,122
,
________________
See note references on pages 38 through 42.
28

Average Market Reference Prices and Differentialsff
Year Ended December 31,2019 2018 Change
RefiningFeedstocks (dollars per barrel)Brent crude oil $ 64.18 $ 71.62 $ (7.44)Brent less West Texas Intermediate (WTI) crude oil 7.15 6.71 0.44Brent less Alaska North Slope (ANS) crude oil (0.86) 0.31 (1.17)Brent less LLS crude oil 1.47 1.72 (0.25)Brent less Argus Sour Crude Index (ASCI) crude oil 3.56 5.20 (1.64)Brent less Maya crude oil 6.57 9.22 (2.65)LLS crude oil 62.71 69.90 (7.19)LLS less ASCI crude oil 2.09 3.48 (1.39)LLS less Maya crude oil 5.10 7.50 (2.40)WTI crude oil 57.03 64.91 (7.88)
Natural gas (dollars per million British Thermal Units(MMBtu)) 2.47 3.23 (0.76)
Products (dollars per barrel)U.S. Gulf Coast:Conventional Blendstock of Oxygenate Blending(CBOB) gasoline less Brent 4.37 4.81 (0.44)Ultra-low-sulfur (ULS) diesel less Brent 14.90 14.02 0.88Propylene less Brent (22.31) (2.86) (19.45)CBOB gasoline less LLS 5.84 6.53 (0.69)ULS diesel less LLS 16.37 15.74 0.63Propylene less LLS (20.84) (1.14) (19.70)U.S. Mid-Continent:CBOB gasoline less WTI 13.62 13.70 (0.08)ULS diesel less WTI 22.77 22.82 (0.05)North Atlantic:CBOB gasoline less Brent 7.20 7.59 (0.39)ULS diesel less Brent 17.22 16.29 0.93U.S. West Coast:CARBOB 87 gasoline less ANS 16.28 13.05 3.23CARB diesel less ANS 19.30 18.13 1.17CARBOB 87 gasoline less WTI 24.29 19.45 4.84CARB diesel less WTI 27.31 24.53 2.78
29
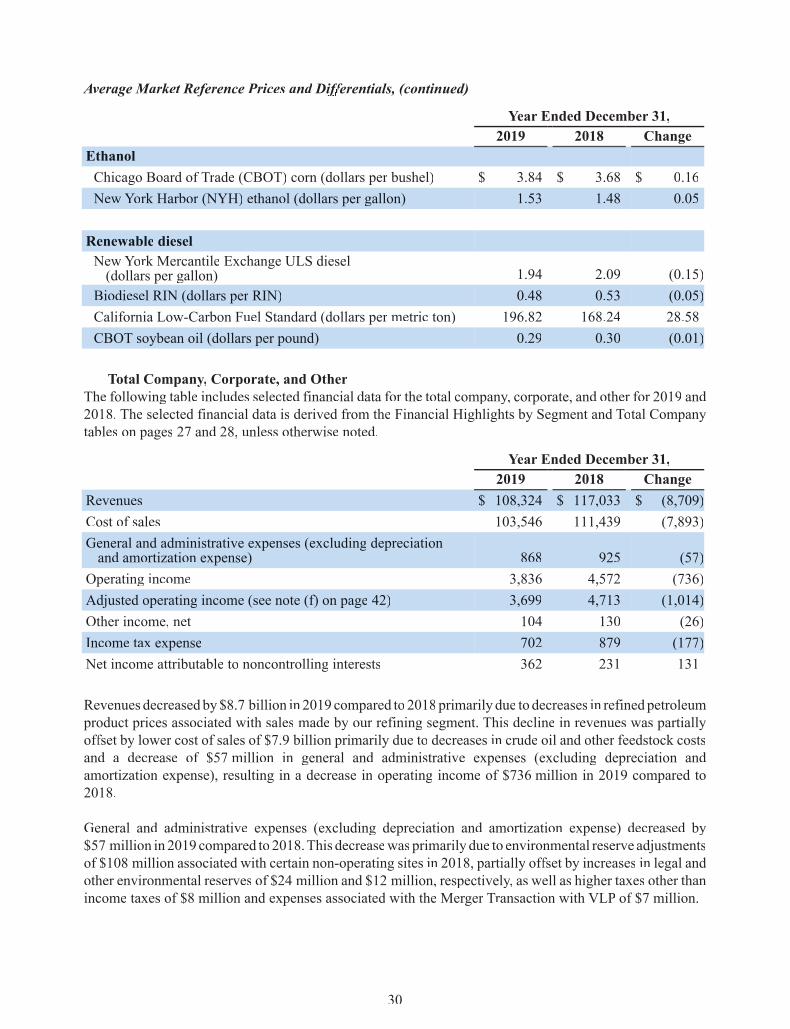
Average Market Reference Prices and Differentials,ff (continued)
Year Ended December 31,2019 2018 Change
EthanolChicago Board of Trade (CBOT) corn (dollars per bushel) $ 3.84 $ 3.68 $ 0.16New York Harbor (NYH) ethanol (dollars per gallon) 1.53 1.48 0.05
Renewable dieselNew York Mercantile Exchange ULS diesel(dollars per gallon) 1.94 2.09 (0.15)
Biodiesel RIN (dollars per RIN) 0.48 0.53 (0.05)California Low-Carbon Fuel Standard (dollars per metric ton) 196.82 168.24 28.58CBOT soybean oil (dollars per pound) 0.29 0.30 (0.01)
Total Company,yy Corporate, and OtherThe following table includes selected financial data for the total company,yy corporate, and other for 2019 and2018. The selected financial data is derived from the Financial Highlights by Segment and Total Companytables on pages 27 and 28, unless otherwise noted.
Year Ended December 31,2019 2018 Change
Revenues $ 108,324 $ 117,033 $ (8,709)Cost of sales 103,546 111,439 (7,893)General and administrative expenses (excluding depreciationand amortization expense) 868 925 (57)
Operating income 3,836 4,572 (736)Adjusted operating income (see note (f) on page 42) 3,699 4,713 (1,014)Other income, net 104 130 (26)Income tax expense 702 879 (177)Net income attributable to noncontrolling interests 362 231 131
Revenues decreased by$8.7 billion in 2019 compared to 2018primarily due to decreases in refined petroleumproduct prices associated with sales made by our refining segment. This decline in revenues was partiallyoffsetff by lower cost of sales of $7.9 billion primarily due to decreases in crude oil and other feedstock costsand a decrease of $57 million in general and administrative expenses (excluding depreciation andamortization expense), resulting in a decrease in operating income of $736 million in 2019 compared to2018.
General and administrative expenses (excluding depreciation and amortization expense) decreased by$57 million in 2019 compared to 2018.This decreasewas primarily due to environmental reserve adjustmentsof $108 million associated with certain non-operating sites in 2018, partially offsetff by increases in legal andother environmental reserves of $24 million and $12 million, respectively,yy as well as higher taxes other thanincome taxes of $8 million and expenses associated with the Merger Transaction with VLP of $7 million.
30

Adjusted operating income was $3.7 billion in 2019 compared to $4.7 billion in 2018. Details regarding the$1.0 billion decrease in adjusted operating income between the years are discussed by segment below.
“Other income, net” decreased by $26 million in 2019 compared to 2018. This decrease was primarily dueto lower interest incomeof$30 million andhigher foreign currency transaction losses of $14 million, partiallyoffsetff by the favorable effectff of a $16 million lower charge for the early redemption of debt between theperiods. As described in note (d) on page 39, we redeemed debt in both 2019 and 2018 and incurred earlyredemption charges of $22 million and $38 million, respectively.
Income tax expense decreased by $177 million in 2019 compared to 2018 primarily as a result of lowerincome before income tax expense. Our effectiveff tax rate was 20 percent for 2019 compared to 21 percentfor 2018.
Net income attributable to noncontrolling interests increased by $131 million in 2019 compared to 2018primarily due to a $279 million increase in blender’s tax credits recognized in 2019 compared to 2018, ofwhich 50 percent is attributable to the holder of the noncontrolling interest, as described in note (a) onpage 38.
Refining Segment ResultsThe following table includes selected financial and operating data of our refining segment for 2019 and2018. The selected financial data is derived from the Financial Highlights by Segment and Total Companytables on pages 27 and 28, respectively,yy unless otherwise noted.
Year Ended December 31,2019 2018 Change
Revenues $ 103,764 $ 113,118 $ (9,354)Cost of sales 99,722 107,930 (8,208)Operating income 4,022 5,143 (1,121)Adjusted operating income (see note (f) on page 41) 4,040 5,180 (1,140)Margin (see note (f) on page 40) 10,391 11,244 (853)Operating expenses (excluding depreciation andamortization expense reflected below) 4,289 4,154 135
Depreciation and amortization expense 2,062 1,910 152
Throughput volumes (thousand BPD) (see note (g) on page 42) 2,952 2,986 (34)
Refining segment revenues decreased by $9.3 billion in 2019 compared to 2018 primarily due to decreasesin refined petroleum product prices. This decline in refining segment revenues was partially offsetff by lowercost of sales of $8.2 billion primarily due to decreases in crude oil and other feedstock costs, resulting in adecrease in refining segment operating income of $1.1 billion in 2019 compared to 2018.
31

Refining segment adjusted operating income also decreased by $1.1 billion in 2019 compared to 2018. Thecomponents of this decrease, alongwith the reasons for the changes in these components, are outlined below.
• Refining segment margin is primarily affectedff by refined petroleum product prices and the cost ofcrude oil and other feedstocks. The market prices for refined petroleum products generally track theprice of benchmark crude oils, such as Brent,WTI, andANS.An increase in the differentialff betweenthemarket price of the refinedpetroleumproducts thatwe sell and the cost of the referencebenchmarkcrude oil has a favorable impact on our refining segment margin, while a decline in this differentialffhas a negative impact on our refining segment margin. Additionally,yy our refining segment marginis affectedff by our ability to purchase and process crude oils and other feedstocks that are priced ata discount to Brent and other benchmark crude oils. While we benefit when we process these typesof crude oils and other feedstocks, that benefit will vary as the discount widens or narrows.Improvement in these discounts has a favorable impact on our refining segment margin as it lowersour cost ofmaterials; whereas lower discounts result in higher cost ofmaterials, which has a negativeimpact on our refining segment margin. The table on page 29 reflects market reference prices anddifferentialsff that we believe had a material impact on the change in our refining segment margin in2019 compared to 2018. Refining segment margin decreased by $853 million in 2019 compared to2018 primarily due to the following:
◦ Lower discounts on crude oils had an unfavorable impact to our refining segment margin ofapproximately $628 million.
◦ Lower discounts on feedstocks other than crude oils, such as natural gas and residuals, had anunfavorable impact to our refining segment margin of approximately $360 million.
◦ A decrease in throughput volumes of 34,000 BPD had an unfavorable impact to our refiningsegment margin of approximately $128 million.
◦ Adecrease in the cost of biofuel credits (primarily RINs in the U.S.) had a favorable impact onour refining segment margin of $218 million. See Note 20 of Notes to Consolidated FinancialStatements for additional information on our government and regulatory compliance programs.
◦ An increase in distillate margins throughout most of our regions had a favorable impact to ourrefining segment margin of approximately $202 million.
• Refining segment operating expenses (excluding depreciation and amortization expense) increasedby $135 million primarily due to higher maintenance costs of $86 million, along with the effectff offavorable property tax settlements of $20 million and sales and use tax refunds of $17 millionreceived in 2018 that did not recur in 2019.
• Refining segment depreciation and amortization expense associated with our cost of sales increasedby $152 million primarily due to higher refinery turnaround and catalyst amortization expense of$82 million and an increase in depreciation expense of $79 million associated with capital projectsthat were completed and finance leases that commenced in the latter part of 2018 and early 2019,partially offsetff by the write-offff of assets that were idled or demolished in 2018 of $15 million.
32

Ethanol Segment ResultsThe following table includes selected financial and operating data of our ethanol segment for 2019 and 2018.The selected financial data is derived from the Financial Highlights by Segment and Total Company tableson pages 27 and 28, respectively,yy unless otherwise noted.
Year Ended December 31,2019 2018 Change
Revenues $ 3,837 $ 3,638 $ 199Cost of sales 3,833 3,556 277Operating income 3 82 (79)Adjusted operating income (see note (f) on page 41) 4 82 (78)Margin (see note (f) on page 40) 598 630 (32)Operating expenses (excluding depreciation andamortization expense reflected below) 504 470 34
Depreciation and amortization expense 90 78 12
Production volumes (thousand gallons per day)(see note (g) on page 42) 4,269 4,109 160
Ethanol segment revenues increased by $199 million in 2019 compared to 2018 primarily due to an increasein ethanol prices. This improvement in ethanol segment revenue was outweighed by higher cost of sales of$277 million, resulting in a decrease in ethanol segment operating income of $79 million in 2019 comparedto 2018.
Ethanol segment adjusted operating income decreased by $78 million. The components of this decrease,along with the reasons for the changes in these components, are outlined below.
• Ethanol segment margin is primarily affectedff by ethanol and corn related co-product prices and thecost of corn. The table on page 30 reflects market reference prices that we believe had a materialimpact on the change in our ethanol segment margin in 2019 compared to 2018. Ethanol segmentmargin decreased by $32 million in 2019 compared to 2018 primarily due to the following:
◦ Higher corn prices had an unfavorable impact to our ethanol segment margin of approximately$166 million.
◦ Higher ethanol prices had a favorable impact to our ethanol segment margin of approximately$123 million.
• Ethanol segment operating expenses (excluding depreciation and amortization expense) increasedby $34 million primarily due to costs to operate the three plants acquired from Green Plains, Inc.(GreenPlains) inNovember 2018of $79 million, partially offsetff by lower energy costs of $29 millionand lower chemicals and catalyst costs of $12 million incurred by our other ethanol plants.
• Ethanol segment depreciation and amortization expense associated with our cost of sales increasedby $12 million primarily due to depreciation expense associated with the three plants acquired fromGreen Plains in November 2018.
33
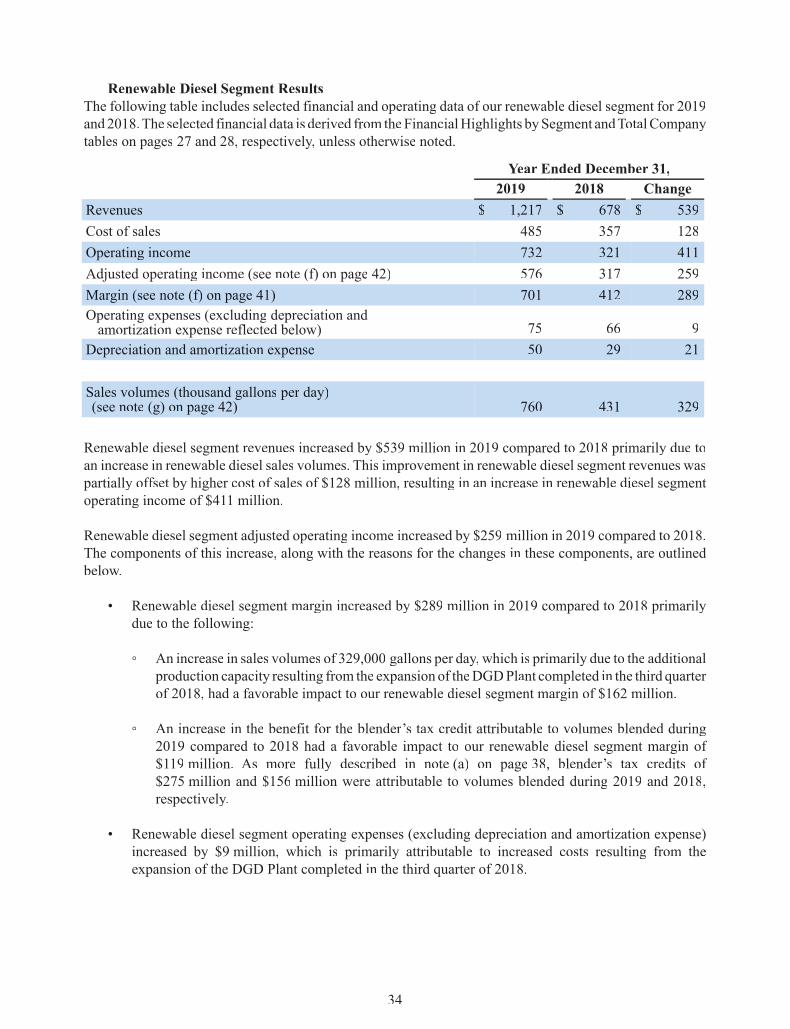
Renewable Diesel Segment ResultsThe following table includes selected financial and operating data of our renewable diesel segment for 2019and2018.The selected financial data is derived from theFinancialHighlights bySegment andTotalCompanytables on pages 27 and 28, respectively,yy unless otherwise noted.
Year Ended December 31,2019 2018 Change
Revenues $ 1,217 $ 678 $ 539Cost of sales 485 357 128Operating income 732 321 411Adjusted operating income (see note (f) on page 42) 576 317 259Margin (see note (f) on page 41) 701 412 289Operating expenses (excluding depreciation andamortization expense reflected below) 75 66 9
Depreciation and amortization expense 50 29 21
Sales volumes (thousand gallons per day)(see note (g) on page 42) 760 431 329
Renewable diesel segment revenues increased by $539 million in 2019 compared to 2018 primarily due toan increase in renewable diesel sales volumes. This improvement in renewable diesel segment revenues waspartially offsetff by higher cost of sales of $128 million, resulting in an increase in renewable diesel segmentoperating income of $411 million.
Renewable diesel segment adjusted operating income increased by $259 million in 2019 compared to 2018.The components of this increase, along with the reasons for the changes in these components, are outlinedbelow.
• Renewable diesel segment margin increased by $289 million in 2019 compared to 2018 primarilydue to the following:
◦ An increase in sales volumes of 329,000 gallons per day,yy which is primarily due to the additionalproduction capacity resulting from the expansion of theDGDPlant completed in the third quarterof 2018, had a favorable impact to our renewable diesel segment margin of $162 million.
◦ An increase in the benefit for the blender’s tax credit attributable to volumes blended during2019 compared to 2018 had a favorable impact to our renewable diesel segment margin of$119 million. As more fully described in note (a) on page 38, blender’s tax credits of$275 million and $156 million were attributable to volumes blended during 2019 and 2018,respectively.
• Renewable diesel segment operating expenses (excluding depreciation and amortization expense)increased by $9 million, which is primarily attributable to increased costs resulting from theexpansion of the DGD Plant completed in the third quarter of 2018.
34

• Renewable diesel segment depreciation and amortization expense associated with our cost of salesincreased by $21 million primarily due to higher turnaround and catalyst amortization expense of$13 million and depreciation expense associated with the expansion of the DGD Plant completedin the third quarter of 2018 of $5 million.
35
2018 Compared to 2017p
Financial Highlights by Segment and Total Company(millions of dollars)
________________
See note references on pages 38 through 42.
Year Ended December 31, 2018
Refining EthanolRenewableDiesel
Corporateand
Eliminations TotalRevenues:Revenues from external customers $ 113,093 $ 3,428 $ 508 $ 4 $ 117,033Intersegment revenues 25 210 170 (405) —Total revenues 113,118 3,638 678 (401) 117,033
Cost of sales:Cost of materials and other (a) 101,866 3,008 262 (404) 104,732Operating expenses (excluding depreciation andamortization expense reflected below) 4,154 470 66 — 4,690
Depreciation and amortization expense 1,910 78 29 — 2,017Total cost of sales 107,930 3,556 357 (404) 111,439
Other operating expenses (b) 45 — — — 45General and administrative expenses (excludingdepreciation and amortization expense reflectedbelow) (c) — — — 925 925
Depreciation and amortization expense — — — 52 52Operating income by segment $ 5,143 $ 82 $ 321 $ (974) 4,572Other income, net (d) 130Interest and debt expense, net of capitalizedinterest (470)
Income before income tax expense 4,232Income tax expense (e) 879Net income 3,353Less: Net income attributable to noncontrollinginterests (a) 231
Net income attributable toValero Energy Corporation stockholders $ 3,122
,

Financial Highlights by Segment and Total Company (continued)(millions of dollars)
________________
See note references on pages 38 through 42.
Year Ended December 31, 2017
Refining EthanolRenewableDiesel
Corporateand
Eliminations TotalRevenues:Revenues from external customers $ 90,258 $ 3,324 $ 393 $ 5 $ 93,980Intersegment revenues 8 176 241 (425) —Total revenues 90,266 3,500 634 (420) 93,980
Cost of sales:Cost of materials and other 80,160 2,804 498 (425) 83,037Operating expenses (excluding depreciation andamortization expense reflected below) 4,014 443 47 — 4,504
Depreciation and amortization expense 1,824 81 29 — 1,934Total cost of sales 85,998 3,328 574 (425) 89,475
Other operating expenses (b) 61 — — — 61General and administrative expenses (excludingdepreciation and amortization expense reflectedbelow) — — — 829 829
Depreciation and amortization expense — — — 52 52Operating income by segment $ 4,207 $ 172 $ 60 $ (876) 3,563Other income, net 112Interest and debt expense, net of capitalizedinterest (468)
Income before income tax expense 3,207Income tax benefit (e) (949)Net income 4,156Less: Net income attributable to noncontrollinginterests 91
Net income attributable toValero Energy Corporation stockholders $ 4,065
,
36

Average Market Reference Prices and Differentialsff
Year Ended December 31,2018 2017 Change
RefiningFeedstocks (dollars per barrel)Brent crude oil $ 71.62 $ 54.82 $ 16.80Brent less WTI crude oil 6.71 3.92 2.79Brent less ANS crude oil 0.31 0.26 0.05Brent less LLS crude oil 1.72 0.69 1.03Brent less ASCI crude oil 5.20 4.18 1.02Brent less Maya crude oil 9.22 7.74 1.48LLS crude oil 69.90 54.13 15.77LLS less ASCI crude oil 3.48 3.49 (0.01)LLS less Maya crude oil 7.50 7.05 0.45WTI crude oil 64.91 50.90 14.01
Natural gas (dollars per MMBtu) 3.23 2.98 0.25
Products (dollars per barrel)U.S. Gulf Coast:CBOB gasoline less Brent 4.81 10.50 (5.69)ULS diesel less Brent 14.02 13.26 0.76Propylene less Brent (2.86) 0.48 (3.34)CBOB gasoline less LLS 6.53 11.19 (4.66)ULS diesel less LLS 15.74 13.95 1.79Propylene less LLS (1.14) 1.17 (2.31)U.S. Mid-Continent:CBOB gasoline less WTI 13.70 15.65 (1.95)ULS diesel less WTI 22.82 18.50 4.32North Atlantic:CBOB gasoline less Brent 7.59 12.57 (4.98)ULS diesel less Brent 16.29 14.75 1.54U.S. West Coast:CARBOB 87 gasoline less ANS 13.05 18.12 (5.07)CARB diesel less ANS 18.13 17.11 1.02CARBOB 87 gasoline less WTI 19.45 21.78 (2.33)CARB diesel less WTI 24.53 20.77 3.76
37

Average Market Reference Prices and Differentials,ff (continued)
Year Ended December 31,2018 2017 Change
EthanolCBOT corn (dollars per bushel) $ 3.68 $ 3.59 $ 0.09NYH ethanol (dollars per gallon) 1.48 1.56 (0.08)
Renewable dieselNew York Mercantile Exchange ULS diesel(dollars per gallon) 2.09 1.66 0.43
Biodiesel RIN (dollars per RIN) 0.53 1.01 (0.48)California Low-Carbon Fuel Standard (dollars per metric ton) 168.24 89.26 78.98CBOT soybean oil (dollars per pound) 0.30 0.33 (0.03)
________________
The following notes relate to references on pages 25 through 36 and pages 43 through 46.
(a) Cost of materials and other for the years ended December 31, 2019 and 2018 includes a benefit of $449 millionand $170 million, respectively,yy for the blender’s tax credit. The benefit recognized in 2019 is attributable to volumesblended during 2019 and 2018 and was recognized in December 2019 because the U.S legislation authorizing thecredit was passed and signed into law in that month. The benefit recognized in 2018 is attributable to volumesblended during 2017 and was recognized in February 2018 because the U.S. legislation authorizing the credit waspassed and signed into law in that month.
The $449 million and $170 million pre-tax benefits are attributable to volumes blended during the three years andare reflected in our reportable segments as follows (in millions):
RefiningRenewableDiesel Total
Periods to which blender’s tax credit is attributable2019 blender’s tax credit $ 16 $ 275 $ 2912018 blender’s tax credit 2 156 158Total recognized in 2019 $ 18 $ 431 $ 449
2017 blender’s tax credit $ 10 $ 160 $ 170Total recognized in 2018 $ 10 $ 160 $ 170
38

Adjustments to reflect the blender’s tax credits in the period during which the volumes were blended are as follows(in millions):
Year Ended December 31,2019 2018 2017
Refining segmentTotal blender’s tax credit recognized in period presented $ 18 $ 10 $ —Less: Amount properly reflected in the period associated withvolumes blended 16 2 10Adjustment to reflect blender’s tax credit in proper periodfor the refining segment (see note (f)) 2 8 (10)
Renewable diesel segmentTotal blender’s tax credit recognized in period presented 431 160 —Less: Amount properly reflected in the period associated withvolumes blended 275 156 160Adjustment to reflect blender’s tax credit in proper periodfor the renewable diesel segment (see note (f)) 156 4 (160)Total adjustment to reflect blender’s tax credit in properperiod (see note (f)) $ 158 $ 12 $ (170)
Of the $449 million pre-tax benefit recognized in 2019, $215 million is attributable to noncontrolling interest and$234 million is attributable to Valero stockholders. Of the $170 million pre-tax benefit recognized in 2018,$80 million is attributable to noncontrolling interest and $90 million is attributable to Valero stockholders.
(b) Other operating expenses reflects expenses that are not associated with our cost of sales and primarily includescosts to repair, remediate, and restore our facilities to normal operations following a non-operating event, such asa natural disaster or a major unplanned outage.
(c) General and administrative expenses (excluding depreciation and amortization expense) for the year endedDecember 31, 2018 includes a chargeof $108 million for environmental reserve adjustments associatedwith certainnon-operating sites.
(d) “Other income, net” for the years ended December 31, 2019 and 2018 includes a $22 million charge from the earlyredemption of $850 million of our 6.125 percent senior notes due February 1, 2020 and a $38 million charge fromthe early redemption of $750 million of our 9.375 percent senior notes due March 15, 2019, respectively.
(e) On December 22, 2017, Tax Reform was enacted, and we recognized an income tax benefit of $1.9 billion inDecember 2017 that represented our initial estimate of the impact of Tax Reform.We finalized our estimates duringthe year ended December 31, 2018 and recorded an income tax benefit of $12 million during the period.
(f) We use certain financial measures (as noted below) that are not defined under U.S. GAAP and are considered tobe non-GAAP financial measures.
We have defined these non-GAAP measures and believe they are useful to the external users of our financialstatements, including industry analysts, investors, lenders, and rating agencies. We believe these measures areuseful to assess our ongoing financial performance because, when reconciled to their most comparable U.S. GAAPmeasures, they provide improved comparability between periods through the exclusion of certain items that webelieve are not indicative of our core operating performance and that may obscure our underlying business resultsand trends. These non-GAAP measures should not be considered as alternatives to their most comparable U.S.GAAP measures nor should they be considered in isolation or as a substitute for an analysis of our results ofoperations as reportedunderU.S.GAAP.PP Inaddition, thesenon-GAAPmeasuresmaynot be comparable to similarlytitled measures used by other companies because we may define them differentlyff ,yy which diminishes their utility.
39

Non-GAAP financial measures are as follows:◦ Refining margin is defined as refining operating income adjusted to reflect the blender’s tax credit in
the proper period, and excluding operating expenses (excluding depreciation and amortization expense),depreciation and amortization expense, and other operating expenses, as reflected in the table below.
Year Ended December 31,2019 2018 2017
Reconciliation of refining operating incometo refining marginRefining operating income $ 4,022 $ 5,143 $ 4,207Exclude:Blender’s tax credit (see note (a)) 2 8 (10)Operating expenses (excluding depreciation andamortization expense) (4,289) (4,154) (4,014)
Depreciation and amortization expense (2,062) (1,910) (1,824)Other operating expenses (see note (b)) (20) (45) (61)Refining margin $ 10,391 $ 11,244 $ 10,116
◦ Ethanol margin is defined as ethanol operating income excluding operating expenses (excludingdepreciation and amortization expense), depreciation and amortization expense, and other operatingexpenses, as reflected in the table below.
Year Ended December 31,2019 2018 2017
Reconciliation of ethanol operating incometo ethanol marginEthanol operating income $ 3 $ 82 $ 172Exclude:Operating expenses (excluding depreciation andamortization expense) (504) (470) (443)
Depreciation and amortization expense (90) (78) (81)Other operating expenses (see note (b)) (1) — —Ethanol margin $ 598 $ 630 $ 696
40
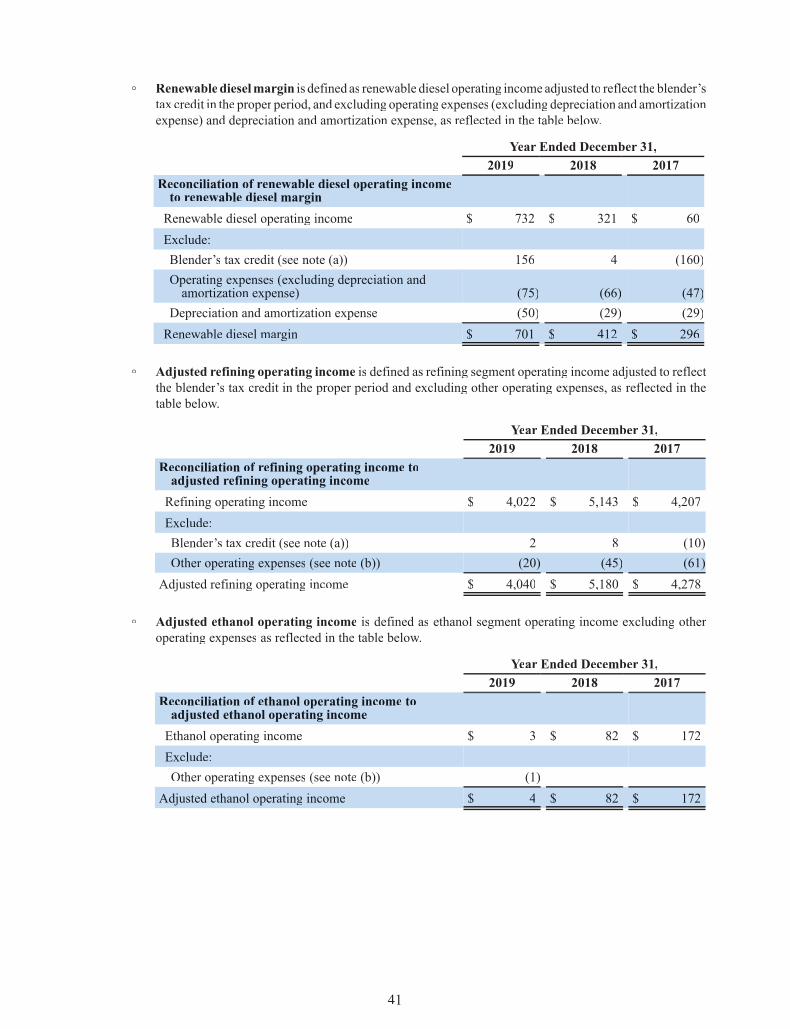
◦ Renewabledieselmargin is defined as renewable diesel operating incomeadjusted to reflect the blender’stax credit in the proper period, and excluding operating expenses (excluding depreciation and amortizationexpense) and depreciation and amortization expense, as reflected in the table below.
Year Ended December 31,2019 2018 2017
Reconciliation of renewable diesel operating incometo renewable diesel marginRenewable diesel operating income $ 732 $ 321 $ 60Exclude:Blender’s tax credit (see note (a)) 156 4 (160)Operating expenses (excluding depreciation andamortization expense) (75) (66) (47)
Depreciation and amortization expense (50) (29) (29)Renewable diesel margin $ 701 $ 412 $ 296
◦ Adjusted refining operating income is defined as refining segment operating income adjusted to reflectthe blender’s tax credit in the proper period and excluding other operating expenses, as reflected in thetable below.
Year Ended December 31,2019 2018 2017
Reconciliation of refining operating income toadjusted refining operating incomeRefining operating income $ 4,022 $ 5,143 $ 4,207Exclude:Blender’s tax credit (see note (a)) 2 8 (10)Other operating expenses (see note (b)) (20) (45) (61)
Adjusted refining operating income $ 4,040 $ 5,180 $ 4,278
◦ Adjusted ethanol operating income is defined as ethanol segment operating income excluding otheroperating expenses as reflected in the table below.
Year Ended December 31,2019 2018 2017
Reconciliation of ethanol operating income toadjusted ethanol operating incomeEthanol operating income $ 3 $ 82 $ 172Exclude:Other operating expenses (see note (b)) (1) — —
Adjusted ethanol operating income $ 4 $ 82 $ 172
41
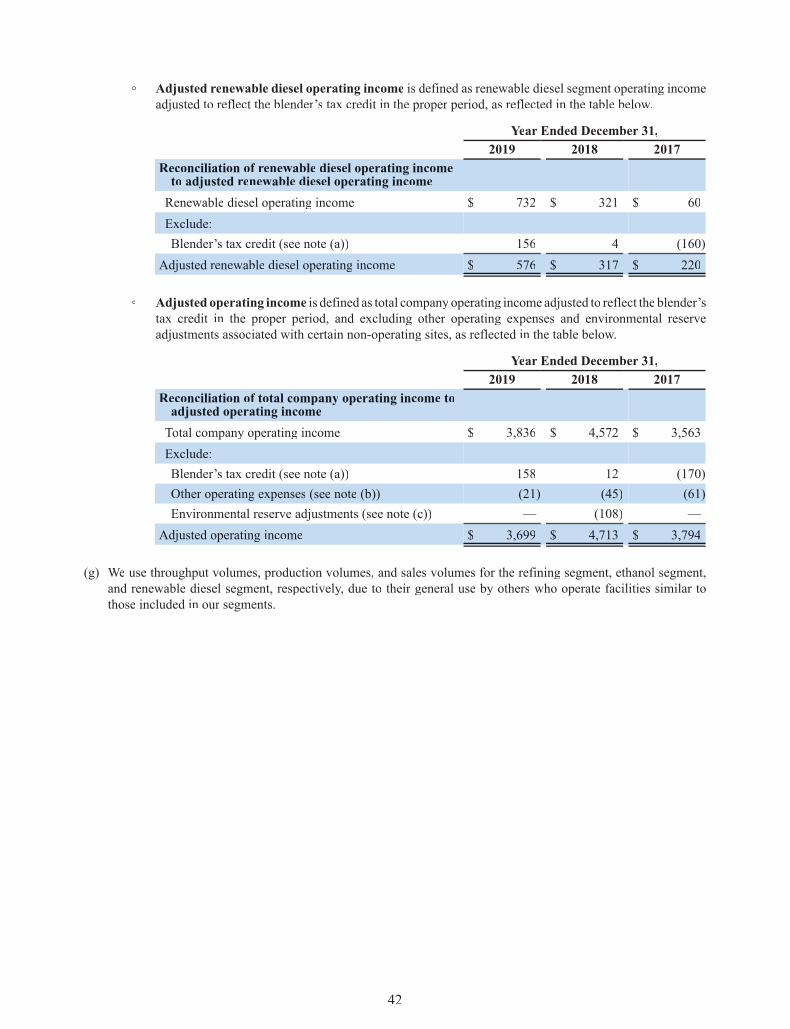
◦ Adjusted renewable diesel operating income is defined as renewable diesel segment operating incomeadjusted to reflect the blender’s tax credit in the proper period, as reflected in the table below.
Year Ended December 31,2019 2018 2017
Reconciliation of renewable diesel operating incometo adjusted renewable diesel operating incomeRenewable diesel operating income $ 732 $ 321 $ 60Exclude:Blender’s tax credit (see note (a)) 156 4 (160)
Adjusted renewable diesel operating income $ 576 $ 317 $ 220
◦ Adjusted operating income is defined as total company operating income adjusted to reflect the blender’stax credit in the proper period, and excluding other operating expenses and environmental reserveadjustments associated with certain non-operating sites, as reflected in the table below.
Year Ended December 31,2019 2018 2017
Reconciliation of total company operating income toadjusted operating incomeTotal company operating income $ 3,836 $ 4,572 $ 3,563Exclude:Blender’s tax credit (see note (a)) 158 12 (170)Other operating expenses (see note (b)) (21) (45) (61)Environmental reserve adjustments (see note (c)) — (108) —
Adjusted operating income $ 3,699 $ 4,713 $ 3,794
(g) We use throughput volumes, production volumes, and sales volumes for the refining segment, ethanol segment,and renewable diesel segment, respectively,yy due to their general use by others who operate facilities similar tothose included in our segments.
42

Total Company,yy Corporate, and OtherThe following table includes selected financial data for the total company,yy corporate, and other for 2018 and2017. The selected financial data is derived from the Financial Highlights by Segment and Total Companytables on pages 35 and 36, unless otherwise noted.
Year Ended December 31,2018 2017 Change
Revenues $ 117,033 $ 93,980 $ 23,053Cost of sales 111,439 89,475 21,964General and administrative expenses (excluding depreciationand amortization expense) 925 829 96
Operating income 4,572 3,563 1,009Adjusted operating income (see note (f) on page 42) 4,713 3,794 919Other income, net 130 112 18Income tax expense (benefit) 879 (949) 1,828Net income attributable to noncontrolling interests 231 91 140
Revenues increasedby$23.1 billion in2018compared to2017primarilydue to increases in refinedpetroleumproduct prices associated with sales made by our refining segment. This improvement in revenues waspartially offsetff by higher cost of sales of $22.0 billion primarily due to increases in crude oil and otherfeedstockcosts, andan increaseof$96 million ingeneral andadministrativeexpenses (excludingdepreciationand amortization expense), resulting in an increase in operating income of $1.0 billion in 2018 compared to2017.
General and administrative expenses (excluding depreciation and amortization expense) increased by$96 million in 2018 compared to 2017.This increasewas primarily due to environmental reserve adjustmentsof $108 million associated with certain non-operating sites in 2018, partially offsetff by expenses incurred in2017 associated with the termination of the acquisition of certain assets from Plains All American Pipeline,L.P.PP of $16 million.
Adjusted operating income was $4.7 billion in 2018 compared to $3.8 billion in 2017. Details regarding the$919 million increase in adjusted operating income between the years are discussed by segment below.
“Other income, net” increased by $18 million in 2018 compared to 2017. This increase was primarily dueto higher equity in earnings associated with our Diamond pipeline joint venture of $39 million and higherinterest income of $29 million, partially offsetff by a $38 million charge for the early redemption of debt asdescribed in note (d) on page 39.
Income tax expense increased by $1.8 billion in 2018 compared to 2017 primarily due to the effectff from a$1.9 billion income tax benefit in 2017 resulting from Tax Reform, as described in note (e) on page 39.Excluding the effectff of Tax Reform from 2017, the effectiveff tax rate for 2017 was 28 percent compared to21 percent for 2018. The decrease in our effectiveff tax rate is primarily due to the reduction in the U.S.statutory income tax rate from 35 percent to 21 percent effectiveff January 1, 2018 as a result of Tax Reform.
Net income attributable to noncontrolling interests increased by $140 million in 2018 compared to 2017primarily due to higher earnings associated with DGD, which includes a benefit for the blender’s tax credit
43

of which $80 million is attributable to the holder of the noncontrolling interest, as described in note (a) onpage 38.
Refining Segment ResultsThe following table includes selected financial and operating data of our refining segment for 2018 and2017. The selected financial data is derived from the Financial Highlights by Segment and Total Companytables on pages 35 and 36, respectively,yy unless otherwise noted.
Year Ended December 31,2018 2017 Change
Revenues $ 113,118 $ 90,266 $ 22,852Cost of sales 107,930 85,998 21,932Operating income 5,143 4,207 936Adjusted operating income (see note (f) on page 41) 5,180 4,278 902Margin (see note (f) on page 40) 11,244 10,116 1,128Operating expenses (excluding depreciation andamortization expense reflected below) 4,154 4,014 140
Depreciation and amortization expense 1,910 1,824 86
Throughput volumes (thousand BPD) (see note (g) on page 42) 2,986 2,940 46
Refining segment revenues increased by $22.9 billion in 2018 compared to 2017 primarily due to increasesin refined petroleum product prices. This improvement in refining segment revenues was partially offsetff byhigher cost of sales of $21.9 billion primarily due to increases in crude oil and other feedstock costs, resultingin an increase in refining segment operating income of $936 million in 2018 compared to 2017.
Refining segment adjusted operating income increased by $902 million in 2018 compared to 2017. Thecomponents of this increase, along with the reasons for the changes in these components, are outlined below.
• Refining segment margin is primarily affectedff by refined petroleum product prices and the cost ofcrude oil and other feedstocks. The market prices for refined petroleum products generally track theprice of benchmark crude oils, such as Brent,WTI, andANS.An increase in the differentialff betweenthemarket price of the refinedpetroleumproducts thatwe sell and the cost of the referencebenchmarkcrude oil has a favorable impact on our refining segment margin, while a decline in this differentialffhas a negative impact on our refining segment margin. Additionally,yy our refining segment marginis affectedff by our ability to purchase and process crude oils and other feedstocks that are priced ata discount to Brent and other benchmark crude oils. While we benefit when we process these typesof crude oils and other feedstocks, that benefit will vary as the discount widens or narrows.Improvement in these discounts has a favorable impact on our refining segment margin as it lowersour cost ofmaterials; whereas lower discounts result in higher cost ofmaterials, which has a negativeimpact on our refining segment margin. The table on page 37 reflects market reference prices anddifferentialsff that we believe had a material impact on the change in our refining segment margin in2018 compared to 2017. Refining segment margin increased by $1.1 billion in 2018 compared to2017, primarily due to the following:
◦ An increase in distillate margins throughout all of our regions had a favorable impact to ourrefining segment margin of approximately $1.3 billion.
44

◦ Higher discounts on crude oils had a favorable impact to our refining segment margin ofapproximately $561 million.
◦ A decrease in the cost of biofuel credits (primarily RINs in the U.S.) had a favorable impact toour refining segment margin of $406 million. See Note 20 of Notes to Consolidated FinancialStatements for additional information on our government and regulatory compliance programs.
◦ Anincrease in throughputvolumesof46,000 BPDhada favorable impact toour refining segmentmargin of approximately $153 million.
◦ A decrease in gasoline margins throughout all of our regions had an unfavorable impact to ourrefining segment margin of approximately $1.3 billion.
• Refining segment operating expenses (excluding depreciation and amortization expense) increasedby $140 million primarily due to higher employee-related expenses of $33 million, an increase inenergy costs of $28 million, the effectff of a favorable insurance settlement of $20 million in 2017for our McKee Refinery,yy higher maintenance expense of $17 million, and higher chemicals andcatalyst costs of $15 million.
• Refining segment depreciation and amortization expense associated with our cost of sales increasedby $86 million primarily due to an increase in depreciation expense of $44 million associated withcapital projects that were completed in the latter part of 2017 and early 2018 and higher refineryturnaround and catalyst amortization expense of $35 million, along with the write-offff of assets thatwere idled or demolished in 2018 of $15 million.
Ethanol Segment ResultsThe following table includes selected financial and operating data of our ethanol segment for 2018 and 2017.The selected financial data is derived from the Financial Highlights by Segment and Total Company tableson pages 35 and 36, respectively,yy unless otherwise noted.
Year Ended December 31,2018 2017 Change
Revenues $ 3,638 $ 3,500 $ 138Cost of sales 3,556 3,328 228Operating income 82 172 (90)Margin (see note (f) on page 40) 630 696 (66)Operating expenses (excluding depreciation andamortization expense reflected below) 470 443 27
Depreciation and amortization expense 78 81 (3)
Production volumes (thousand gallons per day)(see note (g) on page 42) 4,109 3,972 137
Ethanol segment revenues increased by $138 million in 2018 compared to 2017 primarily due to an increasein ethanol sales volumes. This improvement in ethanol segment revenue was outweighed by higher cost ofsales of $228 million, resulting in a decrease in ethanol segment operating income of $90 million in 2018
45

compared to 2017. The components of this decrease, along with the reasons for the changes in thesecomponents, are outlined below.
• Ethanol segment margin is primarily affectedff by ethanol and corn related co-product prices and thecost of corn. The table on page 38 reflects market reference prices that we believe had a materialimpact on the change in our ethanol segment margin in 2018 compared to 2017. Ethanol segmentmargin decreased by $66 million in 2018 compared to 2017 primarily due to the following:
◦ Lower ethanol prices had an unfavorable impact to our ethanol segmentmargin of approximately$159 million.
◦ Higher corn prices had an unfavorable impact to our ethanol segment margin of approximately$36 million.
◦ Higher prices of the corn related co-products that we produced had a favorable impact to ourethanol segment margin of approximately $101 million.
◦ Higher production volumes of 137,000 gallons per day had a favorable impact to our ethanolsegment margin of approximately $26 million.
• Ethanol segment operating expenses (excluding depreciation and amortization expense) increasedby $27 million primarily due to costs to operate the three plants acquired from Green Plains inNovember 2018 of $14 million and higher chemicals and catalysts costs of $8 million incurred byour other ethanol plants.
Renewable Diesel Segment ResultsThe following table includes selected financial and operating data of our renewable diesel segment for 2018and2017.The selected financial data is derived from theFinancialHighlights bySegment andTotalCompanytables on pages 35 and 36, respectively,yy unless otherwise noted.
Year Ended December 31,2018 2017 Change
Revenues $ 678 $ 634 $ 44Cost of sales 357 574 (217)Operating income 321 60 261Adjusted operating income (see note (f) on page 42) 317 220 97Margin (see note (f) on page 41) 412 296 116Operating expenses (excluding depreciation andamortization expense reflected below) 66 47 19
Depreciation and amortization expense 29 29 —
Sales volumes (thousand gallons per day)(see note (g) on page 42) 431 440 (9)
Renewable diesel segment revenues increased by $44 million in 2018 compared to 2017 primarily due tohigher renewable diesel sales prices. This improvement in renewable diesel segment revenues, along with
46

a decrease in total cost of sales of $217 million, resulted in an increase in renewable diesel segment operatingincome of $261 million.
Renewable diesel segment adjusted operating income increased by $97 million in 2018 compared to 2017.The components of this increase, along with the reasons for the changes in these components are outlinedbelow.
• Renewable diesel segment margin increased by $116 million in 2018 compared to 2017 primarilydue to the following:
◦ An increase in renewable diesel prices in 2018 had a favorable impact to our renewable dieselsegment margin of $60 million.
◦ Price riskmanagement activities had a favorable impact to our renewable diesel segmentmarginof $40 million. We recognized a hedge gain of $29 million in 2018 from commodity derivativeinstruments associated with our price risk management activities compared to a loss of$11 million in 2017.
• Renewable diesel segment operating expenses (excluding depreciation and amortization expense)increased by $19 million primarily attributable to higher chemical and catalyst costs of $10 millionand increased costs resulting from the expansion of the DGD Plant completed in the third quarterof 2018 of $3 million.
47
LIQUIDITYAND CAPITALTT RESOURCES
OverviewWe believe that we have sufficientff funds from operations and from borrowings under our credit facilities tofund our ongoing operating requirements and other commitments. We expect that, to the extent necessary,yywe can raise additional funds from time to time through equity or debt financings in the public and privatecapital markets or the arrangement of additional credit facilities. However, there can be no assurancesregarding the availability of any future financings or additional credit facilities or whether such financingsor additional credit facilities can be made available on terms that are acceptable to us.
Our liquidity consisted of the following as of December 31, 2019 (in millions):
Available borrowing capacity from committed facilities:Valero Revolver $ 3,966Canadian Revolver 112Accounts receivable sales facility 1,200Letter of credit facility 50Total available borrowing capacity 5,328
Cash and cash equivalents(a) 2,473Total liquidity $ 7,801
___________________
(a) Excludes $110 million of cash and cash equivalents related to our variable interest entities (VIEs)that is available for use only by our VIEs.
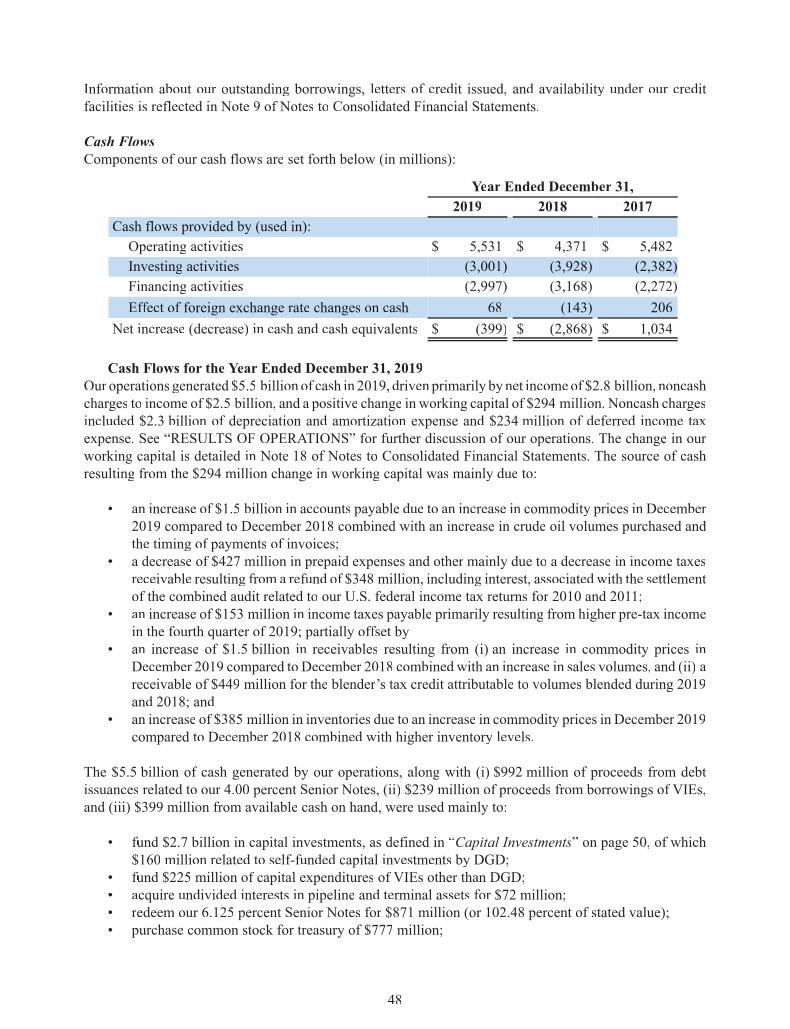
Information about our outstanding borrowings, letters of credit issued, and availability under our creditfacilities is reflected in Note 9 of Notes to Consolidated Financial Statements.
Cash FlowsComponents of our cash flows are set forth below (in millions):
Year Ended December 31,2019 2018 2017
Cash flows provided by (used in):Operating activities $ 5,531 $ 4,371 $ 5,482Investing activities (3,001) (3,928) (2,382)Financing activities (2,997) (3,168) (2,272)Effectff of foreign exchange rate changes on cash 68 (143) 206
Net increase (decrease) in cash and cash equivalents $ (399) $ (2,868) $ 1,034
Cash Flows for the Year Ended December 31, 2019Our operations generated $5.5 billion of cash in 2019, driven primarily by net incomeof $2.8 billion, noncashcharges to income of $2.5 billion, and a positive change in working capital of $294 million. Noncash chargesincluded $2.3 billion of depreciation and amortization expense and $234 million of deferred income taxexpense. See “RESULTSLL OF OPERATIONS”AA for further discussion of our operations. The change in ourworking capital is detailed in Note 18 of Notes to Consolidated Financial Statements. The source of cashresulting from the $294 million change in working capital was mainly due to:
• an increase of $1.5 billion in accounts payable due to an increase in commodity prices in December2019 compared to December 2018 combined with an increase in crude oil volumes purchased andthe timing of payments of invoices;
• a decrease of $427 million in prepaid expenses and other mainly due to a decrease in income taxesreceivable resulting from a refund of $348 million, including interest, associated with the settlementof the combined audit related to our U.S. federal income tax returns for 2010 and 2011;
• an increase of $153 million in income taxes payable primarily resulting from higher pre-tax incomein the fourth quarter of 2019; partially offsetff by
• an increase of $1.5 billion in receivables resulting from (i) an increase in commodity prices inDecember 2019 compared to December 2018 combined with an increase in sales volumes, and (ii) areceivable of $449 million for the blender’s tax credit attributable to volumes blended during 2019and 2018; and
• an increase of $385 million in inventories due to an increase in commodity prices in December 2019compared to December 2018 combined with higher inventory levels.
The $5.5 billion of cash generated by our operations, along with (i) $992 million of proceeds from debtissuances related to our 4.00 percent Senior Notes, (ii) $239 million of proceeds from borrowings of VIEs,and (iii) $399 million from available cash on hand, were used mainly to:
• fundff $2.7 billion in capital investments, as defined in “Capital Investments” on page 50, of which$160 million related to self-funded capital investments by DGD;
• fundff $225 million of capital expenditures of VIEs other than DGD;• acquire undivided interests in pipeline and terminal assets for $72 million;• redeem our 6.125 percent Senior Notes for $871 million (or 102.48 percent of stated value);• purchase common stock for treasury of $777 million;
48

• pay common stock dividends of $1.5 billion;• acquire all of the outstanding publicly held common units of VLP for $950 million; and• pay distributions to noncontrolling interests of $70 million.
In addition, during the year endedDecember 31, 2019,we sold and repaid $900 million of eligible receivablesunder our accounts receivable sales facility.
Cash Flows for the Year Ended December 31, 2018Our operations generated $4.4 billion of cash in 2018, driven primarily by net income of $3.4 billion andnoncash charges to income of $2.3 billion, partially offsetff by a negative change in working capital of$1.3 billion. Noncash charges included $2.1 billion of depreciation and amortization expense and$203 million of deferred income tax expense. See “RESULTSLL OF OPERATIONS”AA for further discussion ofour operations. The change in our working capital is detailed in Note 18 of Notes to Consolidated FinancialStatements. The use of cash resulting from the $1.3 billion change in working capital was mainly due to:
• an increase of $457 million in receivables resulting from an increase in sales volumes, partiallyoffsetff by a decrease in commodity prices;
• an increase of $197 million in inventory primarily due to higher inventory levels;• a decrease of $684 million in income taxes payable primarily resulting from (i) $527 million of
payments in early 2018 related to 2017 tax liabilities and (ii) $181 million of payments in late 2018that will be applied to 2019 tax liabilities;
• a decrease of $113 million in accrued expenses mainly due to the timing of payments on ourenvironmental compliance program obligations; partially offsetff by
• an increase of $304 million in accounts payable due to an increase in crude oil and other feedstockvolumes purchased, partially offsetff by a decrease in commodity prices.
The $4.4 billion of cash generated by our operations, along with (i) $1.3 billion of proceeds from debtissuances and borrowings, (ii) $109 million of proceeds from borrowings ofVIEs, and (iii) $2.9 billion fromavailable cash on hand, were used mainly to:
• fundff $2.7 billion in capital investments, of which $192 million related to self-funded capitalinvestments by DGD;
• fundff $124 million of capital expenditures of VIEs other than DGD;• fundff (i) $468 million for the Peru Acquisition (as defined and discussed in Note 2 of Notes to
Consolidated Financial Statements) in May 2018; (ii) $320 million for the acquisition ofthree ethanol plants in November 2018; and (iii) $88 million for other minor acquisitions;
• acquire undivided interests in pipeline and terminal assets for $212 million;• redeem our 9.375 percent Senior Notes for $787 million (or 104.9 percent of stated value);• make payments on debt and finance lease obligations of $435 million, of which $410 million related
to the repayment of all outstandingborrowings underVLP’s $750 million senior unsecured revolvingcredit facility (the VLP Revolver);
• retire $137 million of debt assumed in connection with the Peru Acquisition;• purchase common stock for treasury of $1.7 billion;• pay common stock dividends of $1.4 billion; and• pay distributions to noncontrolling interests of $116 million.
Cash Flows for the Year Ended December 31, 2017Our operations generated $5.5 billion of cash in 2017. Net income of $4.2 billion, net of the $1.9 billionnoncash benefit fromTaxReform and other noncash charges of $2.1 billion, and a positive change inworking
49

capital of $1.3 billionwere the primary drivers of the cash generated by our operations in 2017.Other noncashcharges included $2.0 billion of depreciation and amortization expense. See “RESULTSLL OFOPERATIONS”AAfor further discussion of our operations. The Tax Reform benefit and the change in our working capital aredetailed in Notes 15 and 18, respectively,yy of Notes to Consolidated Financial Statements. The source of cashresulting from the $1.3 billion change in working capital was mainly due to:
• an increase of $1.8 billion in accounts payable primarily as a result of an increase in commodityprices;
• an increase of $489 million in income taxes payable resulting from deferring the payment of ourfourth quarter 2017 estimated taxes to January 2018, as allowed by tax relief authorization from theIRS; partially offsetff by
• an increase of $870 million in receivables primarily as a result of an increase in commodity prices;and
• an increase of $516 million in inventory due to higher volumes held combined with an increase incommodity prices.
The $5.5 billion of cash generated by our operations, along with borrowings of $380 million under the VLPRevolver, were used mainly to:
• fundff $2.3 billion in capital investments, of which $88 million related to self-funded capitalinvestments by DGD;
• fundff $26 million of capital expenditures of VIEs other than DGD;• acquire an undivided interest in crude system assets for $72 million;• purchase common stock for treasury of $1.4 billion;• pay common stock dividends of $1.2 billion;• pay distributions to noncontrolling interests of $67 million; and• increase available cash on hand by $1.0 billion.
Capital InvestmentsOur operations, especially those of our refining segment, are highly capital intensive. Each of our refineriescomprises a large base of property assets, consisting of a series of interconnected, highly integrated andinterdependent crude oil processing facilities and supporting logistical infrastructure (Units), and these Unitsare improved continuously. The cost of improvements, which consist of the addition of new Units andbetterments of existing Units, can be significant. We have historically acquired our refineries at amountssignificantly below their replacement costs, whereas our improvements are made at full replacement value.As such, the costs for improving our refinery assets increase over time and are significant in relation to theamountswe paid to acquire our refineries.We plan for these improvements by developing amulti-year capitalprogram that is updated and revised based on changing internal and external factors.
We make improvements to our refineries in order to maintain and enhance their operating reliability,yy to meetenvironmental obligations with respect to reducing emissions and removing prohibited elements from theproductswe produce, or to enhance their profitability. Reliability and environmental improvements generallydo not increase the throughput capacities of our refineries. Improvements that enhance refinery profitabilitymay increase throughput capacity,yy but many of these improvements allow our refineries to process differentfftypes of crude oil and to refine crude oil into products with higher market values. Therefore, many of ourimprovements do not increase throughput capacity significantly.
50
We consider capital investments to include the following:
• Capital expenditures for purchases of, additions to, and improvements in our property,yy plant, andequipment, including those made by DGD but excluding other VIEs;
• Deferred turnaround and catalyst cost expenditures, including those made by DGD; and• Investments in unconsolidated joint ventures.
We include DGD’s capital expenditures and deferred turnaround and catalyst cost expenditures in capitalinvestments becausewe, as operator ofDGD,manage its capital projects and expenditures.We do not includethe capital expenditures of our other consolidated VIEs in capital investments because we do not operatethoseVIEs. In addition,wedonot includeexpenditures for acquisitions andacquisitionsofundivided interestsin capital investments.
We expect to make capital investments of approximately $2.5 billion in 2020. Approximately 60 percent ofthose investments are for sustaining the business and 40 percent are for growth strategies. However, wecontinuously evaluate our capital budget and make changes as conditions warrant. This capital investmentestimate excludes potential strategic acquisitions, including acquisitions of undivided interests.
Other Matters Impacting Liquidity and Capital ResourcesStock Purchase Program
On January 23, 2018, our board of directors authorized the 2018 Program for the purchase of our outstandingcommon stock. As of December 31, 2019, we had $1.5 billion remaining available for purchase under the2018 Program with no expiration date. We have no obligation to make purchases under this program.
Pension Plan FundingWe plan to contribute approximately $140 million to our pension plans and $21 million to our otherpostretirement benefit plans during 2020. See Note 13 of Notes to Consolidated Financial Statements for adiscussion of our employee benefit plans.
Environmental MattersOur operations are subject to extensive environmental regulations by governmental authorities relating tothe discharge of materials into the environment, waste management, pollution prevention measures, GHGemissions, and characteristics and composition of gasolines and distillates. Because environmental laws andregulations are becoming more complex and stringent and new environmental laws and regulations arecontinuously being enacted or proposed, the level of future expenditures required for environmental matterscould increase in the future. In addition, any major upgrades in any of our operating facilities could requirematerial additional expenditures to comply with environmental laws and regulations. See Note 8 of Notesto Consolidated Financial Statements for disclosure of our environmental liabilities.
Tax MattersWe take tax positions in our tax returns from time to time that may not be ultimately allowed by the relevanttaxing authority. When we take such positions, we evaluate the likelihood of sustaining those positions anddetermine the amount of tax benefit arising from such positions, if any,yy that should be recognized in ourfinancial statements. Tax benefits not recognized by us are recorded as a liability for unrecognized taxbenefits, which represents our potential future obligation to various taxing authorities if the tax positions arenot sustained.
As ofDecember 31, 2019, our liability for unrecognized tax benefits, excluding related interest and penalties,was $868 million. Of this amount, $525 million is associated with refund claims associated with taxes paid
51

on incentivepayments received fromtheU.S. federal government forblendingbiofuels into refinedpetroleumproducts. We recorded a tax refund receivable of $525 million in connection with our refund claims, but wealso recorded a liability for unrecognized tax benefits of $525 million due to the complexity of this matterand uncertainties with respect to sustaining these refund claims. Therefore, our financial position, results ofoperations, and liquidity will not be negatively impacted if we are unsuccessful in sustaining these refundclaims. The remaining liability for unrecognized tax benefits, excluding related interest and penalties, of$343 million represents our potential future obligations to various taxing authorities if the tax positionsassociated with that liability are not sustained.
Details about our liability for unrecognized tax benefits, alongwith other information about our unrecognizedtax benefits, are included in Note 15 of Notes to Consolidated Financial Statements.
Cash Held by Our International SubsidiariesAs of December 31, 2019, $1.5 billion of our cash and cash equivalents was held by our internationalsubsidiaries. Cash held by our international subsidiaries can be repatriated to us without any U.S. federalincome tax consequences as a result of the deemed repatriation provisions of Tax Reform, but certain othertaxesmayapply,yy including, but not limited to,withholding taxes imposedbycertain international jurisdictionsand U.S. state income taxes. Therefore, there is a cost to repatriate cash held by certain of our internationalsubsidiaries to us, but we believe that such amount is not material to our financial position or liquidity.
Concentration of CustomersOur operations have a concentration of customers in the refining industry and customers who are refinedpetroleum product wholesalers and retailers. These concentrations of customers may impact our overallexposure to credit risk, either positively or negatively,yy in that these customers may be similarly affectedff bychanges in economic or other conditions. However, we believe that our portfolio of accounts receivable issufficientlyff diversified to the extent necessary to minimize potential credit risk. Historically,yy we have nothad any significant problems collecting our accounts receivable.
52
OFF-BALANCE SHEETARRANGEMENTS
We have not entered into any transactions, agreements, or other contractual arrangements that would resultin off-balanceff sheet liabilities.

CONTRACTUALOBLIGATIONSAA
Our contractual obligations as of December 31, 2019 are summarized below (in millions).
Payments Due by Year2020 2021 2022 2023 2024 Thereafter Total
Debt and financelease obligations (a) $ 541 $ 103 $ 93 $ 110 $ 82 $ 9,485 $ 10,414
Debt obligations – interestpayments 464 462 455 449 449 3,947 6,226
Operating lease liabilities (b) 376 250 194 160 125 498 1,603Purchase obligations 14,284 1,906 1,644 1,565 1,519 3,558 24,476Other long-term liabilities (c) — 160 168 200 215 2,185 2,928Total $ 15,665 $ 2,881 $ 2,554 $ 2,484 $ 2,390 $ 19,673 $ 45,647
______________________________
(a) Debt obligations exclude amounts related to unamortized discounts and debt issuance costs. Finance leaseobligations include related interest expense. Debt obligations due in 2020 include $348 million associated withborrowings under the IEnova Revolver (as defined and described in Note 9 of Notes to Consolidated FinancialStatements) for the construction of terminals in Mexico by Central Mexico Terminals (as defined and describedin Note 12 of Notes to Consolidated Financial Statements). The IEnova Revolver is only available to the operationsof Central Mexico Terminals, and its creditors do not have recourse against us.
(b) Operating lease liabilities include related interest expense.(c) Other long-term liabilities exclude amounts related to the long-term portion of operating lease liabilities that are
separately presented above.
Debt and Finance Lease ObligationsOur debt and finance lease obligations are described in Notes 9 and 5, respectively,yy of Notes to ConsolidatedFinancial Statements.
Our debt and financing agreements do not have rating agency triggers that would automatically require usto post additional collateral. However, in the event of certain downgrades of our senior unsecured debt bythe ratings agencies, the cost of borrowings under some of our bank credit facilities and other arrangementsmay increase. As of December 31, 2019, all of our ratings on our senior unsecured debt, including debtguaranteed by us, are at or above investment grade level as follows:
Rating Agency RatingMoody’s Investors Service Baa2 (stable outlook)Standard & Poor’s Ratings Services BBB (stable outlook)Fitch Ratings BBB (stable outlook)
We cannot provide assurance that these ratings will remain in effectff for any given period of time or that oneor more of these ratings will not be lowered or withdrawn entirely by a rating agency. We note that thesecredit ratings are not recommendations to buy,yy sell, or hold our securities. Each rating should be evaluatedindependently of any other rating. Any future reduction below investment grade or withdrawal of one ormore of our credit ratings could have a material adverse impact on our ability to obtain short- and long-termfinancing and the cost of such financings.
Debt Obligations – Interest PaymentsInterest payments for our debt obligations as described in Note 9 of Notes to Consolidated FinancialStatements are the expected payments based on information available as of December 31, 2019.
53
Operating Lease LiabilitiesOuroperating lease liabilities arise from leasing arrangements for the right tousevarious classes of underlyingassets as described in Note 5 of Notes to Consolidated Financial Statements. Operating lease liabilities arerecognized for leasing arrangements with terms greater than one year and are not reduced by minimum leasepayments to be received by us under subleases.
Purchase ObligationsA purchase obligation is an enforceable and legally binding agreement to purchase goods or services thatspecifies significant terms, including (i) fixed or minimum quantities to be purchased, (ii) fixed, minimum,or variable price provisions, and (iii) the approximate timing of the transaction. We have various purchaseobligations under certain crude oil and other feedstock supply arrangements, industrial gas supplyarrangements (such as hydrogen supply arrangements), natural gas supply arrangements, and variousthroughput, transportation and terminaling agreements. We enter into these contracts to ensure an adequatesupply of feedstock and utilities and adequate storage capacity to operate our refineries and ethanol plants.Substantially all of our purchase obligations are based on market prices or adjustments based on marketindices. Certain of these purchase obligations include fixed or minimum volume requirements, while othersare based on our usage requirements. The purchase obligation amounts shown in the preceding table includeboth short- and long-term obligations and are based on (i) fixed or minimum quantities to be purchased and(ii) fixed or estimated prices to be paid based on current market conditions.
Other Long-TermTT LiabilitiesOur other long-term liabilities are described in Note 8 of Notes to Consolidated Financial Statements. Forpurposes of reflecting amounts for other long-term liabilities in the preceding table,wemadeour best estimateof expected payments for each type of liability based on information available as of December 31, 2019.
54
NEWACCOUNTING PRONOUNCEMENTS
As discussed in Note 1 of Notes to Consolidated Financial Statements, certain new financial accountingpronouncements became effectiveff January 1, 2020, or will become effectiveff in the future. The effectff on ourfinancial statements upon adoption of these pronouncements is discussed in the above-referenced note.
CRITICALACCOUNTING POLICIES INVOLVINGLL CRITICALACCOUNTING ESTIMATESAA
The preparation of financial statements in accordance with U.S. GAAP requires us to make estimates andassumptions that affectff the amounts reported in the financial statements and accompanying notes. Actualresults could differff from those estimates. The following summary provides further information about ourcritical accounting policies that involve critical accounting estimates, and should be read in conjunction withNote 1 ofNotes toConsolidatedFinancial Statements,which summarizes our significant accounting policies.The following accounting policies involve estimates that are considered critical due to the level of subjectivityand judgment involved, as well as the impact on our financial position and results of operations. We believethat all of our estimates are reasonable. Unless otherwise noted, estimates of the sensitivity to earnings thatwould result from changes in the assumptions used in determining our estimates is not practicable due tothe number of assumptions and contingencies involved, and the wide range of possible outcomes.
Unrecognized Taxaa BenefitsWe take tax positions in our tax returns from time to time that may not be ultimately allowed by the relevanttaxing authority. When we take such positions, we evaluate the likelihood of sustaining those positions anddetermine the amount of tax benefit arising from such positions, if any,yy that should be recognized in ourfinancial statements. Tax benefits not recognized by us are recorded as a liability for unrecognized tax

benefits, which represents our potential future obligation to various taxing authorities if the tax positions arenot sustained.
The evaluation of tax positions and the determination of the benefit arising from such positions that arerecognized in our financial statements requires us to make significant judgments and estimates based on ananalysis of complex tax laws and regulations and related interpretations. These judgments and estimates aresubject to change due to many factors, including the progress of ongoing tax audits, case law,ww and changesin legislation.
Details of our liability for unrecognized tax benefits, along with other information about our unrecognizedtax benefits, are included in Note 15 of Notes to Consolidated Financial Statements.
Environmental MattersOur operations are subject to extensive environmental regulations by governmental authorities relatingprimarily to the discharge of materials into the environment, waste management, and pollution preventionmeasures. Future legislative action and regulatory initiatives could result in changes to required operatingpermits, additional remedial actions, or increased capital expenditures and operating costs that cannot beassessed with certainty at this time.
Accruals for environmental liabilities are based on best estimates of probable undiscounted future costs overa 20-year time period using currently available technology and applying current regulations, as well as ourown internal environmental policies. However, environmental liabilities are difficultff to assess and estimatedue to uncertainties related to the magnitude of possible remediation, the timing of such remediation, andthe determination of our obligation in proportion to other parties. Such estimates are subject to change dueto many factors, including the identification of new sites requiring remediation, changes in environmentallaws and regulations and their interpretation, additional information related to the extent and nature ofremediation efforts,ff and potential improvements in remediation technologies.
The amount of our accruals for environmental matters are included in Note 8 of Notes to ConsolidatedFinancial Statements.
Pension and Other Postretirement Benefit ObligationsWe have significant pension and other postretirement benefit liabilities and costs that are developed fromactuarial valuations. Inherent in these valuations are key assumptions including discount rates, expectedreturn on plan assets, future compensation increases, and health care cost trend rates. These assumptions aredisclosed and described in Note 13 of Notes to Consolidated Financial Statements. Changes in theseassumptions are primarily influenced by factors outside of our control. For example, the discount rateassumption represents a yield curve comprised of various long-term bonds that have an average rating ofdouble-Awhen averaging all available ratings by the recognized rating agencies, while the expected returnon plan assets is based on a compounded return calculated assuming an asset allocation that is representativeof the asset mix in our pension plans. To determine the expected return on plan assets, we utilized a forward-looking model of asset returns. The historical geometric average return over the 10 years prior toDecember 31, 2019 was 9.41 percent. The actual return on assets for the years ended December 31, 2019,2018, and 2017 was 23.44 percent, (5.53) percent, and 19.31 percent, respectively. These assumptions canhave a significant effectff on the amounts reported in our financial statements.
55

The following sensitivity analysis shows the effectsff on the projected benefit obligation as of December 31,2019 and net periodic benefit cost for the year ending December 31, 2020 (in millions):
PensionBenefits
OtherPostretirementBenefits
Increase in projected benefit obligation resulting from:Discount rate decrease of 0.25% $ 134 $ 10Compensation rate increase of 0.25% 17 n/a
Increase in expense resulting from:Discount rate decrease of 0.25% 12 —Expected return on plan assets decrease of 0.25% 6 n/aCompensation rate increase of 0.25% 4 n/a
Our net periodic benefit cost is determined using the spot-rate approach.Under this approach, our net periodicbenefit cost is impacted by the spot rates of the corporate bond yield curve used to calculate our liabilitydiscount rate. If the yield curve were to flatten entirely and our liability discount rate remained unchanged,our net periodic benefit cost would increase by $16 million for pension benefits and $2 million for otherpostretirement benefits in 2020.
See Note 13 of Notes to Consolidated Financial Statements for a discussion of our pension and otherpostretirement benefit obligations.
Inventory ValuationThe cost of our inventories is principally determined under the last-in, first-out (LIFO) method using thedollar-value LIFO approach. Our LIFO inventories are carried at the lower of cost or market value and ournon-LIFO inventories are carried at the lower of cost or net realizable value. The market value of our LIFOinventories is determined based on the net realizable value of the inventories.
We compare the market value of inventories to their cost on an aggregate basis, excluding materials andsupplies. In determining the market value of our inventories, we assume that feedstocks are converted intorefined products, which requires us tomake estimates regarding the refined products expected to be producedfrom those feedstocks and the conversion costs required to convert those feedstocks into refined products.We also estimate the usual and customary transportation costs required tomove the inventory from our plantsto the appropriate points of sale.We then apply an estimated selling price to our inventories. If the aggregatemarket value is less than cost, we recognize a loss for the differenceff in our statements of income.
56

ITEM 7A. QUANTITATTT IVEAND QUALITATTT IVE DISCLOSURESABOUTMARKET RISK
COMMODITY PRICE RISK
We are exposed to market risks related to the volatility in the price of crude oil, refined petroleum products(primarily gasoline and distillate), renewable diesel, grain (primarily corn), renewable diesel feedstocks, andnatural gas used in our operations. To reduce the impact of price volatility on our results of operations andcash flows, we use commodity derivative instruments, including futures and options to manage the volatilityof:
• inventories and firm commitments to purchase inventories generally for amounts by which ourcurrent year inventory levels (determined on a LIFO basis) differff from our previous year-end LIFOinventory levels; and
• forecastedff feedstock and refined petroleum product purchases, refined petroleum product sales,renewable diesel sales, or natural gas purchases to lock in the price of those forecasted transactionsat existing market prices that we deem favorable.
Our positions in commodity derivative instruments are monitored and managed on a daily basis by our riskcontrol group to ensure compliance with our stated risk management policy that has been approved by ourboard of directors.
The following sensitivity analysis includes all of our derivative instruments entered into for purposes otherthan trading with which we have market risk (in millions):
December 31,2019 2018
Gain (loss) in fair value resulting from:10% increase in underlying commodity prices $ (39) $ 210% decrease in underlying commodity prices 38 (6)
See Note 20 of Notes to Consolidated Financial Statements for notional volumes associated with thesederivative contracts as of December 31, 2019.
COMPLIANCE PROGRAM PRICE RISK
We are exposed to market risk related to the volatility in the price of credits needed to comply with variousgovernmental and regulatory environmental compliance programs. To manage this risk, we enter intocontracts to purchase these credits when prices are deemed favorable. Some of these contracts are derivativeinstruments; however, we elect the normal purchase exception and do not record these contracts at their fairvalues. As of December 31, 2019 and 2018, the amount of gain or loss in the fair value of derivativeinstruments that would have resulted from a 10 percent increase or decrease in the underlying price of thecontracts was notmaterial. SeeNote 20 of Notes to Consolidated Financial Statements for a discussion aboutthese compliance programs.
57

INTEREST RATEAA RISK
The following table provides information about our debt instruments (dollars in millions), the fair values ofwhich are sensitive to changes in interest rates. Principal cash flows and related weighted-average interestrates by expected maturity dates are presented.
December 31, 2019Expected Maturity Dates
2020 (a) 2021 2022 2023 2024There-after Total (b)
FairValue
Fixed rate $ — $ 11 $ — $ — $ — $ 8,474 $ 8,485 $ 10,099Average interest rate —% 5.0% —% —% —% 5.2% 5.2%Floating rate (c) $ 453 $ 6 $ 6 $ 19 $ — $ — $ 484 $ 484Average interest rate 5.0% 4.5% 4.5% 4.5% —% —% 5.0%
December 31, 2018Expected Maturity Dates
2019 (a) 2020 2021 2022 2023There-after Total (b)
FairValue
Fixed rate $ — $ 850 $ 10 $ — $ — $ 7,474 $ 8,334 $ 8,737Average interest rate —% 6.1% 5.0% —% —% 5.4% 5.5%Floating rate (c) $ 214 $ 5 $ 5 $ 5 $ 20 $ — $ 249 $ 249Average interest rate 4.6% 4.7% 4.7% 4.7% 4.7% —% 4.6%
________________________
(a) As of December 31, 2019 and 2018, our floating rate debt due in 2020 and 2019 includes $348 million and$109 million, respectively,yy associatedwith borrowings under the IEnovaRevolver for the construction of terminalsinMexico byCentralMexicoTerminals. The IEnovaRevolver is only available to the operations of CentralMexicoTerminals, and its creditors do not have recourse against us.
(b) Excludes unamortized discounts and debt issuance costs.(c) As of December 31, 2019 and 2018, we had an interest rate swap associated with $36 million and $40 million,
respectively,yy of our floating rate debt resulting in an effectiveff interest rate of 3.85 percent as of each of thosereporting dates. The fair value of the swap was immaterial for all periods presented.
FOREIGN CURRENCYRISK
As of December 31, 2019, we had foreign currency contracts to purchase $739 million of U.S. dollars and$2.3 billion of U.S. dollar equivalent Canadian dollars. Our market risk was minimal on these contracts, asall of them matured on or before February 15, 2020.
58

ITEM 8. FINANCIAL STATTT EMENTSAND SUPPLEMENTARTT YRR DATAAA
59
MANAGEMENT’S REPORTRR ON INTERNALCONTROLOVER FINANCIALREPORTINGRR
Our management is responsible for establishing and maintaining adequate “internal control over financialreporting” (as defined in Rule 13a-15(f) under the Securities Exchange Act of 1934) for Valero EnergyCorporation.Ourmanagement evaluated the effectivenessff ofValero’s internal control over financial reportingas of December 31, 2019. In its evaluation, management used the criteria established in Internal Controlrr –Integrated Framework (2013) issued by the Committee of Sponsoring Organizations of the TreadwayCommission (COSO).Management believes that as ofDecember 31, 2019, our internal control over financialreporting was effectiveff based on those criteria.
Our independent registered public accounting firm has issued an attestation report on the effectivenessff ofour internal control over financial reporting, which begins on page 62 of this report.
REPORTRR OF INDEPENDENT REGISTERED PUBLICACCOUNTING FIRM
The Board of Directors and StockholdersValero Energy Corporation:
Opinion on the Consolidated Financial Statements
We have audited the accompanying consolidated balance sheets of Valero Energy Corporation andsubsidiaries (theCompany) asofDecember 31, 2019and2018, the relatedconsolidated statementsof income,comprehensive income, equity,yy and cash flows for each of the years in the three-year period endedDecember 31, 2019, and the related notes (collectively,yy the consolidated financial statements). In our opinion,the consolidated financial statements present fairly,yy in all material respects, the financial position of theCompany as of December 31, 2019 and 2018, and the results of its operations and its cash flows for each ofthe years in the three-year period ended December 31, 2019, in conformity with U.S. generally acceptedaccounting principles.
We also have audited, in accordance with the standards of the Public CompanyAccounting Oversight Board(United States) (PCAOB), the Company’s internal control over financial reporting as of December 31, 2019,based on criteria established in Internal Controlrr – Integrated Framework (2013) issued by the Committeeof SponsoringOrganizations of theTreadwayCommission, andour report datedFebruary 26, 2020 expressedan unqualified opinion on the effectivenessff of the Company’s internal control over financial reporting.
Basis for Opinion
These consolidated financial statements are the responsibility of the Company’s management. Ourresponsibility is to express an opinion on these consolidated financial statements based on our audits. Weare a public accounting firm registered with the PCAOB and are required to be independent with respect tothe Company in accordance with the U.S. federal securities laws and the applicable rules and regulations ofthe Securities and Exchange Commission and the PCAOB.
We conducted our audits in accordance with the standards of the PCAOB. Those standards require that weplan andperform the audit to obtain reasonable assurance aboutwhether the consolidated financial statementsare free of material misstatement, whether due to error or fraud. Our audits included performing proceduresto assess the risks of material misstatement of the consolidated financial statements, whether due to error orfraud, and performing procedures that respond to those risks. Such procedures included examining, on a testbasis, evidence regarding the amounts and disclosures in the consolidated financial statements. Our auditsalso included evaluating the accounting principles used and significant estimates made by management, aswell as evaluating the overall presentation of the consolidated financial statements.We believe that our auditsprovide a reasonable basis for our opinion.
60

Critical Audit Matter
The critical audit matter communicated below is a matter arising from the current period audit of theconsolidated financial statements that was communicated or required to be communicated to the auditcommittee and that: (1) relates to accounts or disclosures that are material to the consolidated financialstatements and (2) involved our especially challenging, subjective, or complex judgment. Thecommunication of a critical audit matter does not alter in any way our opinion on the consolidated financialstatements, taken as a whole, and we are not, by communicating the critical audit matter below,ww providinga separate opinion on the critical audit matter or on the accounts or disclosures to which it relates.
Assessment of grossrr unrecognizedrr tax benefits
As discussed inNote 15 to the consolidated financial statements, as of December 31, 2019, the Companyhas gross unrecognized tax benefits, excluding related interest and penalties, of $897 million. TheCompany’s tax positions are subject to examination by local taxing authorities and the resolution of suchexaminations may span multiple years. Due to the complexities inherent in the interpretation of incometax laws in domestic and international jurisdictions, it is uncertain whether some of the Company’sincome tax positions will be sustained upon examination.
We identified the assessment of the Company’s gross unrecognized tax benefits as a critical audit matterbecause complex auditor judgment was required in evaluating the Company’s interpretation of incometax laws and assessing the Company’s estimate of the ultimate resolution of its income tax positions.
The primary procedures we performed to address this critical audit matter included the following. Wetested certain internal controls over the Company’s income tax process, including controls to evaluatewhich of the Company’s income tax positions may not be sustained upon examination and estimate thegross unrecognized tax benefits.
We involved domestic and international income tax professionals with specialized skills and knowledge,who assisted in:
• Obtaining an understanding and evaluating the Company’s income tax positions as filed orintended to be filed;
• Evaluating the Company’s interpretation of income tax laws by developing an independentassessment of the Company’s income tax positions and comparing the results to the Company’sassessment;
• Inspecting settlements with applicable taxing authorities; and• Assessing the expiration of applicable statutes of limitations.
In addition, we evaluated the Company’s ability to estimate its gross unrecognized tax benefits bycomparing historical uncertain income tax positions, including the gross unrecognized tax benefits, toactual results upon conclusion of tax examinations.
/s/ KPMG LLP
We have served as the Company’s auditor since 2004.
San Antonio, TexasFebruary 26, 2020
61
REPORTRR OF INDEPENDENT REGISTERED PUBLICACCOUNTING FIRM
The Board of Directors and StockholdersValero Energy Corporation:
Opinion on Internal Controlrr Over Financial Reporting
Wehave auditedValero EnergyCorporation’s and subsidiaries’(theCompany) internal control over financialreporting as of December 31, 2019, based on criteria established in Internal Controlrr – IntegratedFramework (2013) issued by the Committee of Sponsoring Organizations of the Treadway Commission. Inour opinion, the Company maintained, in all material respects, effectiveff internal control over financialreporting as of December 31, 2019, based on criteria established in Internal Controlrr – IntegratedFramework (2013) issued by the Committee of Sponsoring Organizations of the Treadway Commission.
We also have audited, in accordance with the standards of the Public CompanyAccounting Oversight Board(United States) (PCAOB), the consolidated balance sheets of the Company as of December 31, 2019 and2018, the related consolidated statements of income, comprehensive income, equity,yy and cash flows for eachof the years in the three-year period ended December 31, 2019, and the related notes (collectively,yy theconsolidated financial statements), and our report dated February 26, 2020 expressed an unqualified opinionon those consolidated financial statements.
Basis for Opinion
TheCompany’smanagement is responsible formaintaining effectiveff internal control over financial reportingand for its assessment of the effectivenessff of internal control over financial reporting, included in theaccompanying Management’s Report on Internal Control over Financial Reporting. Our responsibility is toexpress an opinion on the Company’s internal control over financial reporting based on our audit. We are apublic accounting firm registered with the PCAOB and are required to be independent with respect to theCompany in accordance with the U.S. federal securities laws and the applicable rules and regulations of theSecurities and Exchange Commission and the PCAOB.
We conducted our audit in accordance with the standards of the PCAOB. Those standards require that weplan and perform the audit to obtain reasonable assurance about whether effectiveff internal control overfinancial reporting was maintained in all material respects. Our audit of internal control over financialreporting included obtaining an understanding of internal control over financial reporting, assessing the riskthat a material weakness exists, and testing and evaluating the design and operating effectivenessff of internalcontrol based on the assessed risk.Our audit also included performing such other procedures aswe considerednecessary in the circumstances. We believe that our audit provides a reasonable basis for our opinion.
Definition and Limitations of Internal Controlrr Over Financial Reporting
Acompany’s internal control over financial reporting is a process designed to provide reasonable assuranceregarding the reliability of financial reporting and thepreparationof financial statements for external purposesin accordance with generally accepted accounting principles. A company’s internal control over financialreporting includes those policies and procedures that (1) pertain to the maintenance of records that, inreasonable detail, accurately and fairly reflect the transactions and dispositions of the assets of the company;(2) provide reasonable assurance that transactions are recorded as necessary to permit preparation of financial
62
statements in accordance with generally accepted accounting principles, and that receipts and expendituresof the company are being made only in accordance with authorizations of management and directors of thecompany; and (3) provide reasonable assurance regarding prevention or timely detection of unauthorizedacquisition, use, or disposition of the company’s assets that could have a material effectff on the financialstatements.
Because of its inherent limitations, internal control over financial reporting may not prevent or detectmisstatements. Also, projections of any evaluation of effectivenessff to future periods are subject to the riskthat controls may become inadequate because of changes in conditions, or that the degree of compliancewith the policies or procedures may deteriorate.
/s/ KPMG LLP
San Antonio, TexasFebruary 26, 2020
63
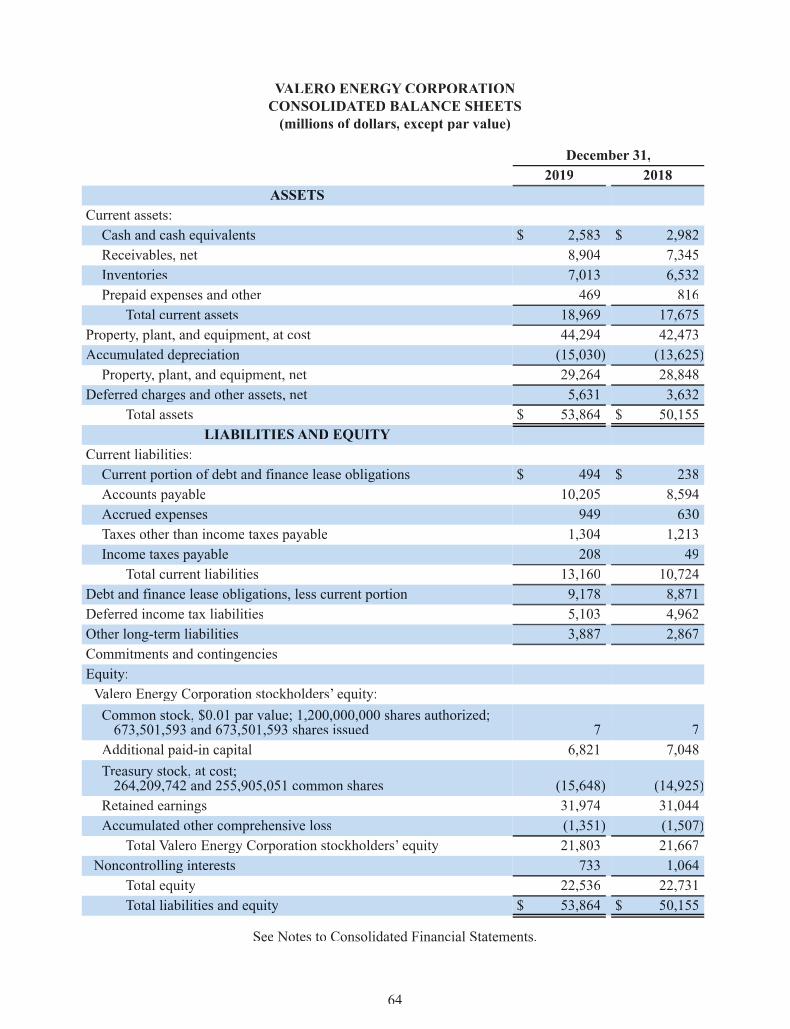
VALERO ENERGYCORPORATIONAACONSOLIDATEDAA BALANCE SHEETS(millions of dollars, except par value)
December 31,2019 2018
ASSETSCurrent assets:Cash and cash equivalents $ 2,583 $ 2,982Receivables, net 8,904 7,345Inventories 7,013 6,532Prepaid expenses and other 469 816
Total current assets 18,969 17,675Property,yy plant, and equipment, at cost 44,294 42,473Accumulated depreciation (15,030) (13,625)Property,yy plant, and equipment, net 29,264 28,848
Deferred charges and other assets, net 5,631 3,632Total assets $ 53,864 $ 50,155
LIABILITIES AND EQUITYCurrent liabilities:Current portion of debt and finance lease obligations $ 494 $ 238Accounts payable 10,205 8,594Accrued expenses 949 630Taxes other than income taxes payable 1,304 1,213Income taxes payable 208 49
Total current liabilities 13,160 10,724Debt and finance lease obligations, less current portion 9,178 8,871Deferred income tax liabilities 5,103 4,962Other long-term liabilities 3,887 2,867Commitments and contingenciesEquity:Valero Energy Corporation stockholders’ equity:Common stock, $0.01 par value; 1,200,000,000 shares authorized;673,501,593 and 673,501,593 shares issued 7 7
Additional paid-in capital 6,821 7,048Treasury stock, at cost;264,209,742 and 255,905,051 common shares (15,648) (14,925)
Retained earnings 31,974 31,044Accumulated other comprehensive loss (1,351) (1,507)
Total Valero Energy Corporation stockholders’ equity 21,803 21,667Noncontrolling interests 733 1,064
Total equity 22,536 22,731Total liabilities and equity $ 53,864 $ 50,155
See Notes to Consolidated Financial Statements.
64

VALERO ENERGYCORPORATIONAACONSOLIDATEDAA STATTT EMENTS OF INCOME(millions of dollars, except per share amounts)
Year Ended December 31,2019 2018 2017
Revenues (a) $108,324 $117,033 $ 93,980Cost of sales:Cost of materials and other 96,476 104,732 83,037Operating expenses (excluding depreciation and amortizationexpense reflected below) 4,868 4,690 4,504
Depreciation and amortization expense 2,202 2,017 1,934Total cost of sales 103,546 111,439 89,475
Other operating expenses 21 45 61General and administrative expenses (excluding depreciation andamortization expense reflected below) 868 925 829
Depreciation and amortization expense 53 52 52Operating income 3,836 4,572 3,563Other income, net 104 130 112Interest and debt expense, net of capitalized interest (454) (470) (468)Income before income tax expense (benefit) 3,486 4,232 3,207Income tax expense (benefit) 702 879 (949)Net income 2,784 3,353 4,156Less: Net income attributable to noncontrolling interests 362 231 91
Net income attributable to Valero Energy Corporation stockholders $ 2,422 $ 3,122 $ 4,065
Earnings per common share $ 5.84 $ 7.30 $ 9.17Weighted-average common shares outstanding (in millions) 413 426 442
Earnings per common share – assuming dilution $ 5.84 $ 7.29 $ 9.16Weighted-average common shares outstanding –assuming dilution (in millions) 414 428 444
_______________________________________________Supplemental information:(a) Includes excise taxes on sales by certain of our international
operations $ 5,595 $ 5,626 $ 5,573
See Notes to Consolidated Financial Statements.
65
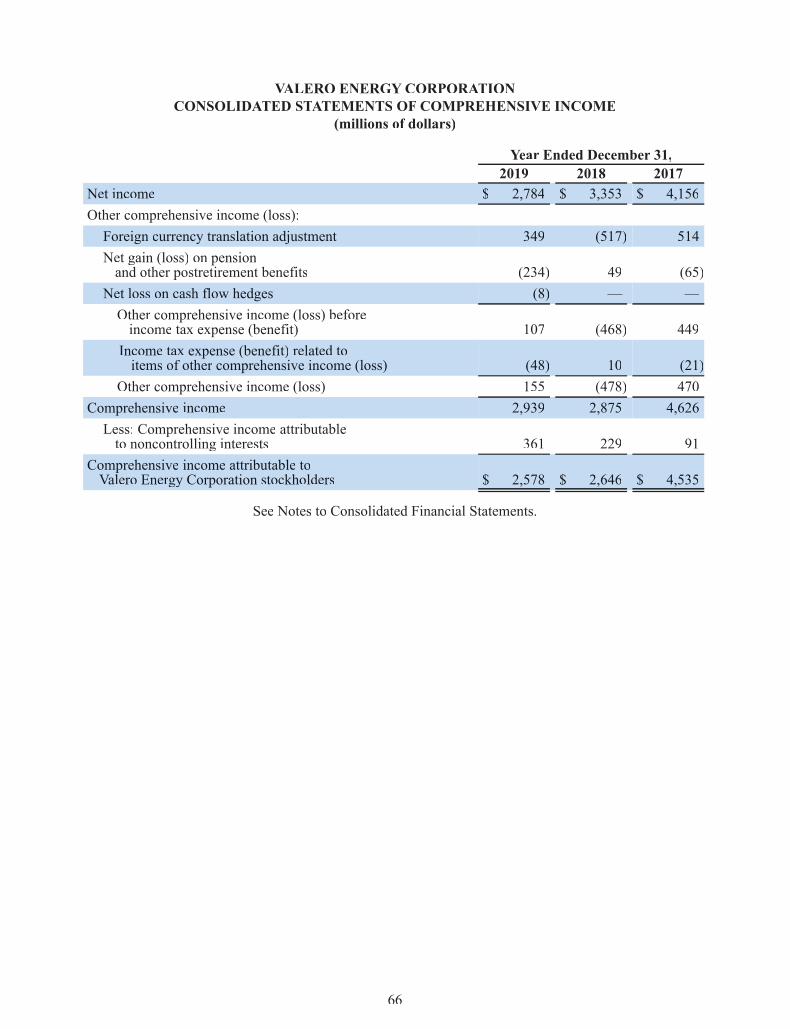
VALERO ENERGYCORPORATIONAACONSOLIDATEDAA STATTT EMENTS OF COMPREHENSIVE INCOME
(millions of dollars)
Year Ended December 31,2019 2018 2017
Net income $ 2,784 $ 3,353 $ 4,156Other comprehensive income (loss):Foreign currency translation adjustment 349 (517) 514Net gain (loss) on pensionand other postretirement benefits (234) 49 (65)
Net loss on cash flow hedges (8) — —Other comprehensive income (loss) beforeincome tax expense (benefit) 107 (468) 449Income tax expense (benefit) related toitems of other comprehensive income (loss) (48) 10 (21)
Other comprehensive income (loss) 155 (478) 470Comprehensive income 2,939 2,875 4,626Less: Comprehensive income attributableto noncontrolling interests 361 229 91
Comprehensive income attributable toValero Energy Corporation stockholders $ 2,578 $ 2,646 $ 4,535
See Notes to Consolidated Financial Statements.
66
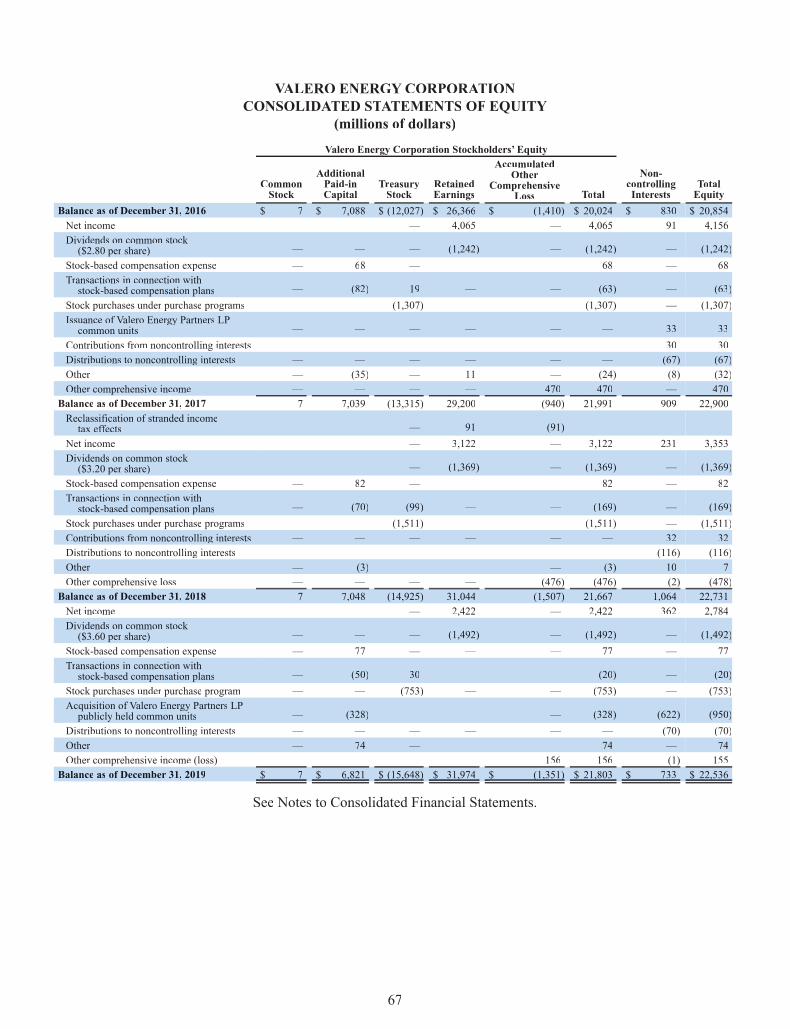
VALERO ENERGYCORPORATIONAACONSOLIDATEDAA STATTT EMENTS OF EQUITY
(millions of dollars)
Valero Energy Corporation Stockholders’ Equity
CommonStock
AdditionalPaid-inCapital
TreasuryStock
RetainedEarnings
AccumulatedOther
ComprehensiveLoss Total
Non-controllingInterests
TotalEquity
Balance as of December 31, 2016 $ 7 $ 7,088 $ (12,027) $ 26,366 $ (1,410) $ 20,024 $ 830 $ 20,854Net income — — — 4,065 — 4,065 91 4,156Dividends on common stock($2.80 per share) — — — (1,242) — (1,242) — (1,242)
Stock-based compensation expense — 68 — — — 68 — 68Transactions in connection withstock-based compensation plans — (82) 19 — — (63) — (63)
Stock purchases under purchase programs — — (1,307) — — (1,307) — (1,307)Issuance of Valero Energy Partners LPcommon units — — — — — — 33 33
Contributions from noncontrolling interests — — — — — — 30 30Distributions to noncontrolling interests — — — — — — (67) (67)Other — (35) — 11 — (24) (8) (32)Other comprehensive income — — — — 470 470 — 470Balance as of December 31, 2017 7 7,039 (13,315) 29,200 (940) 21,991 909 22,900Reclassification of stranded incometax effectsff — — — 91 (91) — — —
Net income — — — 3,122 — 3,122 231 3,353Dividends on common stock($3.20 per share) — — — (1,369) — (1,369) — (1,369)
Stock-based compensation expense — 82 — — — 82 — 82Transactions in connection withstock-based compensation plans — (70) (99) — — (169) — (169)
Stock purchases under purchase programs — — (1,511) — — (1,511) — (1,511)Contributions from noncontrolling interests — — — — — — 32 32Distributions to noncontrolling interests — — — — — — (116) (116)Other — (3) — — — (3) 10 7Other comprehensive loss — — — — (476) (476) (2) (478)Balance as of December 31, 2018 7 7,048 (14,925) 31,044 (1,507) 21,667 1,064 22,731Net income — — — 2,422 — 2,422 362 2,784Dividends on common stock($3.60 per share) — — — (1,492) — (1,492) — (1,492)
Stock-based compensation expense — 77 — — — 77 — 77Transactions in connection withstock-based compensation plans — (50) 30 — — (20) — (20)
Stock purchases under purchase program — — (753) — — (753) — (753)Acquisition of Valero Energy Partners LPpublicly held common units — (328) — — — (328) (622) (950)
Distributions to noncontrolling interests — — — — — — (70) (70)Other — 74 — — — 74 — 74Other comprehensive income (loss) — — — — 156 156 (1) 155Balance as of December 31, 2019 $ 7 $ 6,821 $ (15,648) $ 31,974 $ (1,351) $ 21,803 $ 733 $ 22,536, ( , ) , ( , ) , ,
See Notes to Consolidated Financial Statements.
67
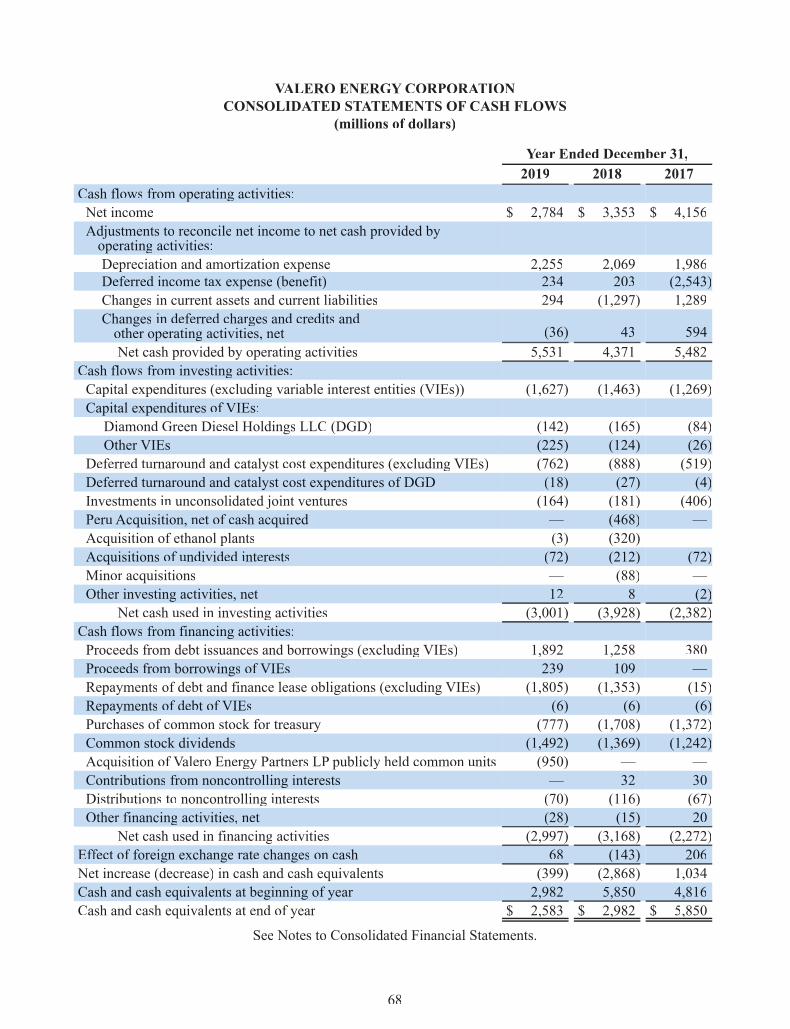
VALERO ENERGYCORPORATIONAACONSOLIDATEDAA STATTT EMENTS OF CASH FLOWS
(millions of dollars)
Year Ended December 31,2019 2018 2017
Cash flows from operating activities:Net income $ 2,784 $ 3,353 $ 4,156Adjustments to reconcile net income to net cash provided byoperating activities:Depreciation and amortization expense 2,255 2,069 1,986Deferred income tax expense (benefit) 234 203 (2,543)Changes in current assets and current liabilities 294 (1,297) 1,289Changes in deferred charges and credits andother operating activities, net (36) 43 594Net cash provided by operating activities 5,531 4,371 5,482
Cash flows from investing activities:Capital expenditures (excluding variable interest entities (VIEs)) (1,627) (1,463) (1,269)Capital expenditures of VIEs:Diamond Green Diesel Holdings LLC (DGD) (142) (165) (84)Other VIEs (225) (124) (26)
Deferred turnaround and catalyst cost expenditures (excluding VIEs) (762) (888) (519)Deferred turnaround and catalyst cost expenditures of DGD (18) (27) (4)Investments in unconsolidated joint ventures (164) (181) (406)Peru Acquisition, net of cash acquired — (468) —Acquisition of ethanol plants (3) (320) —Acquisitions of undivided interests (72) (212) (72)Minor acquisitions — (88) —Other investing activities, net 12 8 (2)
Net cash used in investing activities (3,001) (3,928) (2,382)Cash flows from financing activities:Proceeds from debt issuances and borrowings (excluding VIEs) 1,892 1,258 380Proceeds from borrowings of VIEs 239 109 —Repayments of debt and finance lease obligations (excluding VIEs) (1,805) (1,353) (15)Repayments of debt of VIEs (6) (6) (6)Purchases of common stock for treasury (777) (1,708) (1,372)Common stock dividends (1,492) (1,369) (1,242)Acquisition of Valero Energy Partners LP publicly held common units (950) — —Contributions from noncontrolling interests — 32 30Distributions to noncontrolling interests (70) (116) (67)Other financing activities, net (28) (15) 20
Net cash used in financing activities (2,997) (3,168) (2,272)Effectff of foreign exchange rate changes on cash 68 (143) 206Net increase (decrease) in cash and cash equivalents (399) (2,868) 1,034Cash and cash equivalents at beginning of year 2,982 5,850 4,816Cash and cash equivalents at end of year $ 2,583 $ 2,982 $ 5,850
See Notes to Consolidated Financial Statements.
68

VALERO ENERGYCORPORATIONAANOTES TO CONSOLIDATEDAA FINANCIAL STATTT EMENTS
69
1. DESCRIPTION OF BUSINESS, BASIS OF PRESENTATTT ION, AND SIGNIFICANTACCOUNTING POLICIES
Description of BusinessThe terms “Valero,”VV “we,” “our,” and “us,” as used in this report, may refer to Valero Energy Corporation,one or more of its consolidated subsidiaries, or all of them taken as a whole.
We are an international manufacturer and marketer of transportation fuels and petrochemical products. Weown and operate 15 petroleum refinerieswith a combined throughput capacity of approximately 3.15 millionbarrels per day and 14 ethanol plants with a combined production capacity of approximately 1.73 billiongallons per year as of December 31, 2019. The petroleum refineries are located in the United States (U.S.),Canada, and the United Kingdom (U.K.), and the ethanol plants are located in the Mid-Continent region ofthe U.S. We are also a joint venture partner in DGD, which owns and operates a renewable diesel plant inNorco, Louisiana. We sell our products in the wholesale rack or bulk markets in the U.S., Canada, the U.K.,Ireland, and Latin America. Approximately 7,000 outlets carry our brand names.
Basis of PresentationGeneral
Theseconsolidated financial statementswereprepared inaccordancewithU.S.generallyacceptedaccountingprinciples (GAAP) and with the rules and regulations of the U.S. Securities and Exchange Commission(SEC).
ReclassificationsEffectiveff January 1, 2019, we revised our reportable segments to reflect a new reportable segment —renewable diesel. The renewable diesel segment includes the operations of DGD, our consolidated jointventure as discussed in Note 12, that were transferred from the refining segment. Also effectiveff January 1,2019, we no longer have a VLP segment, and we now include the operations of Valero Energy Partners LPand its consolidated subsidiaries (VLP) in our refining segment. Our prior period segment information hasbeen retrospectively adjusted to reflect our current segment presentation. See Note 2 regarding our mergerwith VLP,PP which occurred on January 10, 2019, and Note 17 for segment information.
Prior year amounts for capital expenditures and deferred turnaround and catalyst cost expenditures in theconsolidated statements of cash flows have been reclassified to conform to the 2019presentation to separatelyprovide these expenditures for us and our consolidated VIEs.
Significant Accounting PoliciesPrinciples of Consolidation
These financial statements include those of Valero, our wholly owned subsidiaries, and VIEs in which wehave a controlling financial interest. Our VIEs are described in Note 12. The ownership interests held byothers in the VIEs are recorded as noncontrolling interests. Intercompany items and transactions have beeneliminated in consolidation. Investments in less than wholly owned entities where we have significantinfluence are accounted for using the equity method.
Use of EstimatesThe preparation of financial statements in conformity with U.S. GAAP requires us to make estimates andassumptions that affectff the amounts reported in the financial statements and accompanying notes. Actual
results could differff from those estimates. On an ongoing basis, we review our estimates based on currentlyavailable information. Changes in facts and circumstances may result in revised estimates.
Cash EquivalentsOur cash equivalents are short-term, highly liquid investments that are readily convertible to known amountsof cash and have a maturity of three months or less when acquired.
ReceivablesTrade receivables are carried at original invoice amount. We maintain an allowance for doubtful accounts,which is adjusted based on management’s assessment of our customers’ historical collection experience,known credit risks, and industry and economic conditions.
InventoriesThe cost of refinery feedstocks and refined petroleum products, grain and ethanol, and renewable dieselfeedstocks (animal fats, used cooking oils, and other vegetable oils) and renewable diesel is determinedunder the last-in, first-out (LIFO)method using the dollar-value LIFO approach, with any increments valuedbased on average purchase prices during the year. Our LIFO inventories are carried at the lower of cost ormarket. The cost of products purchased for resale and the cost of materials and supplies are determinedprincipally under the weighted-average cost method. Our non-LIFO inventories are carried at the lower ofcost or net realizable value. If the aggregate market value of our LIFO inventories or the aggregate netrealizable value of our non-LIFO inventories is less than the related aggregate cost, we recognize a loss forthe differenceff in our statements of income.
Property,yy Plant, and EquipmentThe cost of property,yy plant, and equipment (property assets) purchased or constructed, including bettermentsof property assets, is capitalized. However, the cost of repairs to and normal maintenance of property assetsis expensed as incurred. Betterments of property assets are those that extend the useful life, increase thecapacity or improve the operating efficiencyff of the asset, or improve the safety of our operations. The costof property assets constructed includes interest and certain overhead costs allocable to the constructionactivities.
Our operations, especially those of our refining segment, are highly capital intensive. Each of our refineriescomprises a large base of property assets, consisting of a series of interconnected, highly integrated andinterdependent crude oil processing facilities and supporting logistical infrastructure (Units), and these Unitsare continuously improved. Improvements consist of the addition of new Units and betterments of existingUnits.Weplan for these improvements by developing amulti-year capital program that is updated and revisedbased on changing internal and external factors.
Depreciation of property assets used in our refining and renewable diesel segments is recorded on a straight-line basis over the estimated useful lives of these assets primarily using the compositemethod of depreciation.We maintain a separate composite group of property assets for each of our refineries and our renewablediesel plant.We estimate the useful life of each group based on an evaluation of the property assets comprisingthe group, and such evaluations consist of, but are not limited to, the physical inspection of the assets todetermine their condition, consideration of the manner in which the assets are maintained, assessment of the
VALERO ENERGYCORPORATIONAANOTES TO CONSOLIDATEDAA FINANCIAL STATTT EMENTS (Continued)
70
need to replace assets, and evaluation of the manner in which improvements impact the useful life of thegroup. The estimated useful lives of our composite groups range primarily from 20 to 30 years.
Under the composite method of depreciation, the cost of an improvement is added to the composite groupto which it relates and is depreciated over that group’s estimated useful life. We design improvements to ourrefineries and renewable diesel plant in accordance with engineering specifications, design standards, andpractices accepted in our industry,yy and these improvements have design lives consistent with our estimateduseful lives. Therefore, we believe the use of the group life to depreciate the cost of improvements made tothe group is reasonable because the estimated useful life of each improvement is consistent with that of thegroup.
Also under the composite method of depreciation, the historical cost of a minor property asset (net of salvagevalue) that is retired or replaced is charged to accumulated depreciation and no gain or loss is recognized inincome. However, a gain or loss is recognized in income for a major property asset that is retired, replaced,sold, or for an abnormal disposition of a property asset (primarily involuntary conversions). Gains and lossesare reflected in depreciation and amortization expense, unless such amounts are reported separately due tomateriality.
Depreciation of property assets used in our ethanol segment is recorded on a straight-line basis over theestimated useful lives of the related assets. The estimated useful life of our grain processing equipment is20 years.
Leasehold improvements are amortized on a straight-line basis over the shorter of the lease term or theestimated useful life of the related asset. Finance leaseROU(defined below) assets are amortized as discussedin “Leases” below.
Deferred Charges and OtherAssets“Deferred charges and other assets, net” primarily include the following:
• turnaroundt costs, which are incurred in connection with planned major maintenance activities at ourrefineries, ethanol plants, and renewable diesel plant, are deferred when incurred and amortized ona straight-line basis over the period of time estimated to lapse until the next turnaround occurs;
• fixed-bedff catalyst costs, representing the cost of catalyst that is changed out at periodic intervalswhen the quality of the catalyst has deteriorated beyond its prescribed function, are deferred whenincurred and amortized on a straight-line basis over the estimated useful life of the specific catalyst;
• operating lease ROU (defined below) assets, which are amortized as discussed in “Leases” below;
• investments in unconsolidated joint ventures;
• income taxes receivable;
• intangible assets, which are amortized over their estimated useful lives; and
• goodwill.
VALERO ENERGYCORPORATIONAANOTES TO CONSOLIDATEDAA FINANCIAL STATTT EMENTS (Continued)
71

LeasesWe evaluate if a contract is or contains a lease at inception of the contract. If we determine that a contractis or contains a lease, we recognize a right-of-use (ROU) asset and lease liability at the commencement dateof the lease based on the present value of lease payments over the lease term. The present value of the leasepayments isdeterminedbyusing the implicit ratewhen readilydeterminable. If notdeterminable, our centrallymanaged treasury group provides an incremental borrowing rate based on quoted interest rates obtained fromfinancial institutions. The rate used is for a term similar to the duration of the lease based on informationavailable at the commencement date. Lease terms include options to extend or terminate the lease when itis reasonably certain that we will exercise those options.
We recognize ROU assets and lease liabilities for leasing arrangements with terms greater than one year.Except for the marine transportation asset class, we account for lease and non-lease components in a contractas a single lease component for all classes of underlying assets. Our marine transportation contracts includenon-lease components, such as maintenance and crew costs.We allocate the consideration in these contractsbased on pricing information provided by the third-party broker.
Expense for an operating lease is recognized as a single lease cost on a straight-line basis over the lease termand is reflected in the appropriate income statement line item based on the leased asset’s function.Amortization expense of a finance lease ROU asset is recognized on a straight-line basis over the lesser ofthe useful life of the leased asset or the lease term. However, if the lease transfers ownership of the financelease ROU asset to us at the end of the lease term, the finance lease ROU asset is amortized over the usefullife of the leased asset.Amortization expense is reflected in “depreciation and amortization expense.” Interestexpense is incurred based on the carrying value of the lease liability and is reflected in “interest and debtexpense, net of capitalized interest.”
Impairment of AssetsLong-lived assets are tested for recoverability whenever events or changes in circumstances indicate thatthe carrying amount of the asset may not be recoverable. A long-lived asset is not recoverable if its carryingamount exceeds the sum of the undiscounted cash flows expected to result from its use and eventualdisposition. If a long-lived asset is not recoverable, an impairment loss is recognized for the amount bywhichthe carrying amount of the long-lived asset exceeds its fair value, with fair value determined based ondiscounted estimated net cash flows or other appropriate methods.
We evaluate our equity method investments for impairment when there is evidence that we may not be ableto recover the carrying amount of our investments or the investee is unable to sustain an earnings capacitythat justifies the carrying amount. A loss in the value of an investment that is other than a temporary declineis recognized currently in income based on the differenceff between the estimated current fair value of theinvestment and its carrying amount.
Asset Retirement ObligationsWe record a liability,yy which is referred to as an asset retirement obligation, at fair value for the estimatedcost to retire a tangible long-lived asset at the time we incur that liability,yy which is generally when the assetis purchased, constructed, or leased. We record the liability when we have a legal obligation to incur coststo retire the asset and when a reasonable estimate of the fair value of the liability can be made. If a reasonable
VALERO ENERGYCORPORATIONAANOTES TO CONSOLIDATEDAA FINANCIAL STATTT EMENTS (Continued)
72

estimate cannot bemade at the time the liability is incurred,we record the liabilitywhen sufficientff informationis available to estimate the liability’s fair value.
We have obligations with respect to certain of our assets related to our refining and ethanol segments to cleanand/or dispose of various component parts of the assets at the time they are retired.However, these componentparts can be used for extended and indeterminate periods of time as long as they are properly maintainedand/or upgraded. It is our practice and current intent to maintain all our assets and continue makingimprovements to those assets based on technological advances.As a result, we believe that our assets relatedto our refining and ethanol segments have indeterminate lives for purposes of estimating asset retirementobligations because dates or ranges of dates upon which we would retire such assets cannot reasonably beestimated at this time.Wewill recognize a liability at such timewhen sufficientff information exists to estimatea date or range of potential settlement dates that is needed to employ a present value technique to estimatefair value.
Environmental MattersLiabilities for future remediation costs are recordedwhen environmental assessments and/or remedial effortsffare probable and the costs can be reasonably estimated. Other than for assessments, the timing andmagnitudeof these accruals generally are based on the completion of investigations or other studies or a commitmentto a formal plan of action.Amounts recorded for environmental liabilities have not been reduced by possiblerecoveries from third parties and have not been measured on a discounted basis.
Legal ContingenciesWe are subject to legal proceedings, claims, and liabilities that arise in the ordinary course of business. Weaccrue losses associated with legal claims when such losses are probable and reasonably estimable. If wedetermine that a loss is probable and cannot estimate a specific amount for that loss but can estimate a rangeof loss, the best estimate within the range is accrued. If no amount within the range is a better estimate thanany other, the minimum amount of the range is accrued. Estimates are adjusted as additional informationbecomes available or circumstances change. Legal defense costs associated with loss contingencies areexpensed in the period incurred.
Foreign Currency TranslationGenerally,yy our international subsidiaries use their local currency as their functional currency. Balance sheetamounts are translated into U.S. dollars using exchange rates in effectff as of the balance sheet date. Incomestatement amounts are translated intoU.S. dollars using the exchange rates in effectff at the time the underlyingtransactions occur. Foreign currency translation adjustments are recorded as a component of accumulatedother comprehensive loss.
Revenue RecognitionOur revenues are primarily generated from contracts with customers. We generate revenue from contractswith customers from the sale of products by our refining, ethanol, and renewable diesel segments. Revenuesare recognized when we satisfy our performance obligation to transfer products to our customers, whichtypically occurs at a point in time upon shipment or delivery of the products, and for an amount that reflectsthe transaction price that is allocated to the performance obligation.
The customer is able to direct the use of, and obtain substantially all of the benefits from, the products at thepoint of shipment or delivery.As a result, we consider control to have transferred upon shipment or delivery
VALERO ENERGYCORPORATIONAANOTES TO CONSOLIDATEDAA FINANCIAL STATTT EMENTS (Continued)
73

because we have a present right to payment at that time, the customer has legal title to the asset, we havetransferred physical possession of the asset, and the customer has significant risks and rewards of ownershipof the asset.
Our contracts with customers state the final terms of the sale, including the description, quantity,yy and pricefor goods sold. Payment is typically due in full within two to ten days of delivery. In the normal course ofbusiness, we generally do not accept product returns.
The transaction price is the consideration that we expect to be entitled to in exchange for our products. Thetransaction price for substantially all of our contracts is generally based on commodity market pricing (i.e.,variable consideration).As such, this market pricing may be constrained (i.e., not estimable) at the inceptionof the contract but will be recognized based on the applicable market pricing, which will be known upontransfer of the goods to the customer. Some of our contracts also contain variable consideration in the formof sales incentives to our customers, such as discounts and rebates. For contracts that include variableconsideration, we estimate the factors that determine the variable consideration in order to establish thetransaction price.
We have elected to exclude from themeasurement of the transaction price all taxes assessed by governmentalauthorities that are both imposed on and concurrent with a specific revenue-producing transaction andcollected by us from a customer (e.g., sales tax, use tax, value-added tax, etc.). We continue to include inthe transaction price excise taxes that are imposed on certain inventories in our international operations. Theamount of such taxes is provided in supplemental information in a footnote on the statements of income.
There are instanceswhereweprovide shipping services in relation to the goods sold to our customer. Shippingand handling costs that occur before the customer obtains control of the goods are deemed to be fulfillmentactivities and are included in cost ofmaterials and other.Wehave elected to account for shipping and handlingactivities that occur after the customer has obtained control of a good as fulfillment activities rather than asa promised service and we have included these activities in cost of materials and other.
We enter into certain purchase and sale arrangements with the same counterparty that are deemed to be madein contemplation of one another.We combine these transactions and present the net effectff in cost of materialsand other. We also enter into refined petroleum product exchange transactions to fulfill sales contracts withour customersbyaccessing refinedpetroleumproducts inmarketswherewedonot operateourown refineries.These refined petroleum product exchanges are accounted for as exchanges of nonmonetary assets, and norevenues are recorded on these transactions.
Cost Classifications“Cost of materials and other” primarily includes the cost of materials that are a component of our productssold. These costs include (i) the direct cost of materials (such as crude oil and other refinery feedstocks,refined petroleum products and blendstocks, and ethanol feedstocks and products) that are a component ofour products sold; (ii) costs related to the delivery (such as shipping and handling costs) of products sold;(iii) costs related to our environmental credit obligations to complywith various governmental and regulatoryprograms (such as the cost of Renewable Identification Numbers (RINs) as required by the U.S.Environmental Protection Agency’s (EPA)PP Renewable Fuel Standard, emission credits under various cap-and-trade systems, as defined in Note 19); (iv) the blender’s tax credit recognized on qualified biodieselmixtures; (v) gains and losses on our commodity derivative instruments; and (vi) certain excise taxes.
VALERO ENERGYCORPORATIONAANOTES TO CONSOLIDATEDAA FINANCIAL STATTT EMENTS (Continued)
74

“Operating expenses (excluding depreciation and amortization expense)” include costs to operate ourrefineries, ethanol plants, and logistics assets, except for depreciation and amortization expense. These costsprimarily include employee-related expenses, energy and utility costs, catalysts and chemical costs, andrepair and maintenance expenses.
“Depreciation and amortization expense” associated with our operations is separately presented in ourstatement of income as a component of cost of sales and general and administrative expenses and is disclosedby reportable segment in Note 17.
“Other operating expenses” include costs, if any,yy incurred by our reportable segments that are not associatedwith our cost of sales.
Environmental Compliance Program CostsWe purchase credits in the open market to meet our obligations under various environmental complianceprograms. We purchase biofuel credits (primarily RINs in the U.S.) to comply with government regulationsthat require us to blend a certain percentage of biofuels into the products we produce. To the degree that weare unable to blend biofuels at the required percentage, we must purchase biofuel credits to meet ourobligation. We purchase greenhouse gas (GHG) emission credits to comply with government regulationsconcerningvariousGHGemissionprograms, including cap-and-trade systems.Theseprogramsaredescribedin Note 20 under “Environmental Compliance Program Price Risk.”
The costs of purchased biofuel credits and GHG emission credits are charged to cost of materials and otheras such credits are needed to satisfy our obligation. To the extent we have not purchased enough credits tosatisfy our obligation as of the balance sheet date, we charge cost of materials and other for such deficiencybased on themarket price of the credits as of the balance sheet date, andwe record a liability for our obligationto purchase those credits. See Note 19 for disclosure of our fair value liability.
Stock-Based CompensationCompensation expense for our share-based compensation plans is based on the fair value of the awardsgranted and is recognized in income on a straight-line basis over the shorter of (i) the requisite service periodof each award or (ii) the period from the grant date to the date retirement eligibility is achieved if that dateis expected to occur during the vesting period established in the award.
Income TaxesIncome taxes are accounted for under the asset and liability method. Under this method, deferred tax assetsand liabilities are recognized for the future tax consequences attributable to differencesff between the financialstatement carrying amounts of existing assets and liabilities and their respective tax bases. Deferred amountsare measured using enacted tax rates expected to apply to taxable income in the year those temporarydifferencesff are expected to be recovered or settled. Deferred tax assets are reduced by unrecognized taxbenefits, if such items may be available to offsetff the unrecognized tax benefit. Stranded income tax effectsffare released from accumulated other comprehensive loss to retained earnings on an individual item basis asthose items are reclassified into income.
We have elected to classify any interest expense and penalties related to the underpayment of income taxesin income tax expense.
VALERO ENERGYCORPORATIONAANOTES TO CONSOLIDATEDAA FINANCIAL STATTT EMENTS (Continued)
75

We have elected to treat the global intangible low-taxed income (GILTI)LL tax as a period expense.
Earnings per Common ShareEarnings per common share is computed by dividing net income attributable to Valero stockholders by theweighted-average number of common shares outstanding for the year. Participating securities are includedin the computation of basic earnings per share using the two-class method. Earnings per common share –assuming dilution is computed by dividing net income attributable to Valero stockholders by the weighted-average number of common shares outstanding for the year increased by the effectff of dilutive securities.Potentially dilutive securities are excluded from the computation of earnings per common share – assumingdilution when the effectff of including such shares would be antidilutive.
Financial InstrumentsOur financial instruments include cash and cash equivalents, receivables, payables, debt, operating andfinance lease obligations, commodity derivative contracts, and foreign currency derivative contracts. Theestimated fair values of these financial instruments approximate their carrying amounts, except for certaindebt as discussed in Note 19.
Derivatives and HedgingAll derivative instruments, not designated as normal purchases or sales, are recorded in the balance sheet aseither assets or liabilities measured at their fair values with changes in fair value recognized currently inincome. To manage commodity price risk, we primarily use cash flow hedges and economic hedges, and wealso use fair value hedges from time to time. The cash flow effectsff of all of our derivative instruments arereflected in operating activities in the consolidated statements of cash flows.
Accounting Pronouncements Adopted During 2019Topic 842
We adopted the provisions of Financial Accounting Standards Board (FASB)FF Accounting StandardsCodification (ASC) Topic 842, “Leases,” (TopicTT 842) on January 1, 2019. Topic 842 increases thetransparency and comparability among organizations by recognizing lease assets and lease liabilities on thebalance sheet and disclosing key information about leasing arrangements. Topic 842 supersedes previouslease accounting requirements under FASB ASC Topic 840, “Leases,” (TopicTT 840). We adopted Topic 842using the optional transition method that permits us to record a cumulative-effectff adjustment and apply thenew disclosure requirements beginning in 2019 and continue to present comparative period information asrequired under Topic 840; however, we did not have a cumulative-effectff adjustment to the opening balanceof retained earnings at the date of adoption.
In addition, we elected the transition practical expedient package that permits us to not reassess our priorconclusions about lease identification, lease classification, and initial direct costs under the new standard,aswell as the practical expedient that permits us to not assess existing land easements under the new standard.See “Leases” above for a discussion of our revised accounting policy and also see Note 5 for informationon our leases.
In preparation for the adoption of Topic 842, we enhanced our contracting and lease evaluation systems andrelated processes, and we developed a new lease accounting system to capture our leases and support the
VALERO ENERGYCORPORATIONAANOTES TO CONSOLIDATEDAA FINANCIAL STATTT EMENTS (Continued)
76

required disclosures. We integrated our lease accounting system with our general ledger and modified ourrelated procurement and payment processes.
Adoption of this standard resulted in (i) the recognition of ROU assets and lease liabilities for our operatingleases of $1.3 billion, (ii) the derecognition of existing assets under construction of $539 million related toa build-to-suit lease arrangement with respect to theMVPTerminal (see Note 10 under “Contractual CapitalCommitments—MVP Terminal”), and (iii) the presentation of new disclosures about our leasing activitiesbeginning in the first quarter of 2019. Adoption of this standard did not impact our results of operations orliquidity,yy and our accounting for finance leases is substantially unchanged.
OtherIn addition to the adoption of Topic 842 discussed above, we adopted the following Accounting StandardsUpdate (ASU) on January 1, 2019. Our adoption of thisASU did not affectff our financial statements or relateddisclosures.
ASUBasis ofAdoption
2017-12 Derivatives and Hedging (TopicTT 815): TargetedImprovements to Accounting for Hedging Activities
Cumulativeeffectff
Accounting Pronouncements Adopted on January 1, 2020The following ASUs were adopted on January 1, 2020, and our adoption did not have a material impact onour financial statements or related disclosures.
ASUBasis ofAdoption
2016-13 Financial Instruments—Credit Losses (TopicTT 326):Measurement of Credit Losses on FinancialInstruments (including codification improvements inASUs 2018-19 and 2019-11 and ASU 2020-02—Financial Instruments—Credit Losses (TopicTT 326):Amendments to SEC Paragraphs Pursuant to SEC StaffffAccounting Bulletin No. 119)
Cumulativeeffectff
2018-15 Intangibles—Goodwill and Other—Internal-UseSoftware (Subtopic 350-40): Customer’s Accountingfor Implementation Costs Incurred in a CloudComputing Arrangement That Is a Service Contract
Prospectively
2019-12 Income Taxes (TopicTT 740): Simplifying the Accountingfor Income Taxes
Prospectively
VALERO ENERGYCORPORATIONAANOTES TO CONSOLIDATEDAA FINANCIAL STATTT EMENTS (Continued)
77
2. MERGERANDACQUISITIONS
Merger with VLPOn January 10, 2019, we completed our acquisition of all of the outstanding publicly held common units ofVLP pursuant to a definitive Agreement and Plan of Merger (Merger Agreement, and together with thetransactions contemplated thereby,yy the Merger Transaction) with VLP.PP Upon completion of the MergerTransaction, each outstanding publicly held common unit was converted into the right to receive $42.25 percommon unit in cash without any interest thereon, and all such publicly traded common units wereautomatically canceled and ceased to exist. Upon completion of the Merger Transaction, we paid aggregatemerger consideration of $950 million, which was funded with available cash on hand.
Prior to the completion of the Merger Transaction, we consolidated the financial statements of VLP (seeNote 12) and reflected noncontrolling interests on our balance sheet for the portion ofVLP’s partners’capitalheld by VLP’s public common unitholders. Upon completion of the Merger Transaction, VLP became ourindirect wholly owned subsidiary and, as a result, we no longer reflect noncontrolling interests on our balancesheet with respect toVLP.PP In addition, we no longer attribute a portion ofVLP’s net income to noncontrollinginterests. Because we had a controlling financial interest in VLP before the Merger Transaction and retainedour controlling financial interest in VLP after the Merger Transaction, the change in our ownership interestinVLPas a result of themergerwas accounted for as an equity transaction.Accordingly,yy we did not recognizea gain or loss on the Merger Transaction.
Acquisition of Ethanol PlantsOnNovember 15, 2018, we acquired three ethanol plants from two subsidiaries of Green Plains Inc. for totalcash consideration of $320 million including working capital of $20 million. The ethanol plants are locatedin Bluffton,ff Indiana; Lakota, Iowa; and Riga, Michigan with a combined ethanol production capacity of280 million gallons per year. This acquisition was accounted for as an asset acquisition.
Peru AcquisitionOn May 14, 2018, we acquired 100 percent of the issued and outstanding equity interests in Pure Biofuelsdel Peru S.A.C. (now known as Valero Peru S.A.C.) (ValeroVV Peru) from Pegasus Capital Advisors L.P.PP andvarious minority equity holders. Valero Peru markets refined petroleum products through its logistics assetsin Peru. Valero Peru owns a terminal at the Port of Callao, near Lima, with approximately 1 million barrelsof storage capacity for refined petroleum and renewable products. Through one of its subsidiaries, ValeroPeru also owns a 180,000-barrel storage terminal in Paita, in northern Peru, which is scheduled to commenceoperations in the second quarter of 2020, pending regulatory approvals. This acquisition, which is referredto as the Peru Acquisition, was consistent with our general business strategy and broadens the geographicdiversity of our refining segment. This acquisition was accounted for as a business combination.
VALERO ENERGYCORPORATIONAANOTES TO CONSOLIDATEDAA FINANCIAL STATTT EMENTS (Continued)
78

The following table summarizes the fair values of the assets acquired and liabilities assumed at the acquisitiondate, based on an independent appraisal that was completed in the fourth quarter of 2018 (in millions). Wepaid $468 million from available cash on hand, of which $132 million was for working capital. During thethird and fourth quarters of 2018,we recognized immaterial adjustments to the preliminary amounts recordedfor thePeruAcquisitionwith a correspondingadjustment togoodwill due to the completionof the independentappraisal. These adjustments did not have a material effectff on our results of operations for the year endedDecember 31, 2018.
Current assets, net of cash acquired $ 158Property,yy plant, and equipment 102Deferred charges and other assets 466Current liabilities, excluding current portion of debt (26)Debt assumed, including current portion (137)Deferred income tax liabilities (62)Other long-term liabilities (27)Noncontrolling interest (6)Total consideration, net of cash acquired $ 468
Deferred charges and other assets primarily include identifiable intangible assets of $200 million andgoodwill of $260 million. Identifiable intangible assets, which consist of customer contracts andrelationships, are amortized on a straight-line basis over ten years. Goodwill is calculated as the excess ofthe consideration transferred over the estimated fair values of the underlying tangible and identifiableintangible assets acquired and liabilities assumed.Goodwill represents the future economic benefits expectedto be recognized from our expansion into the Latin American refined petroleum products markets arisingfrom other assets acquired that were not individually identified and separately recognized. We determinedthat the entire balance of goodwill is related to the refining segment. None of the goodwill is deductible fortax purposes.
Our statements of income include the results of operations of Valero Peru since the date of acquisition, andsuch results are reflected in the refining segment. Results of operations since the date of acquisition,supplemental pro forma financial information, and acquisition-related costs have not been presented for thePeru Acquisition as such information is not material to our results of operations.
VALERO ENERGYCORPORATIONAANOTES TO CONSOLIDATEDAA FINANCIAL STATTT EMENTS (Continued)
79
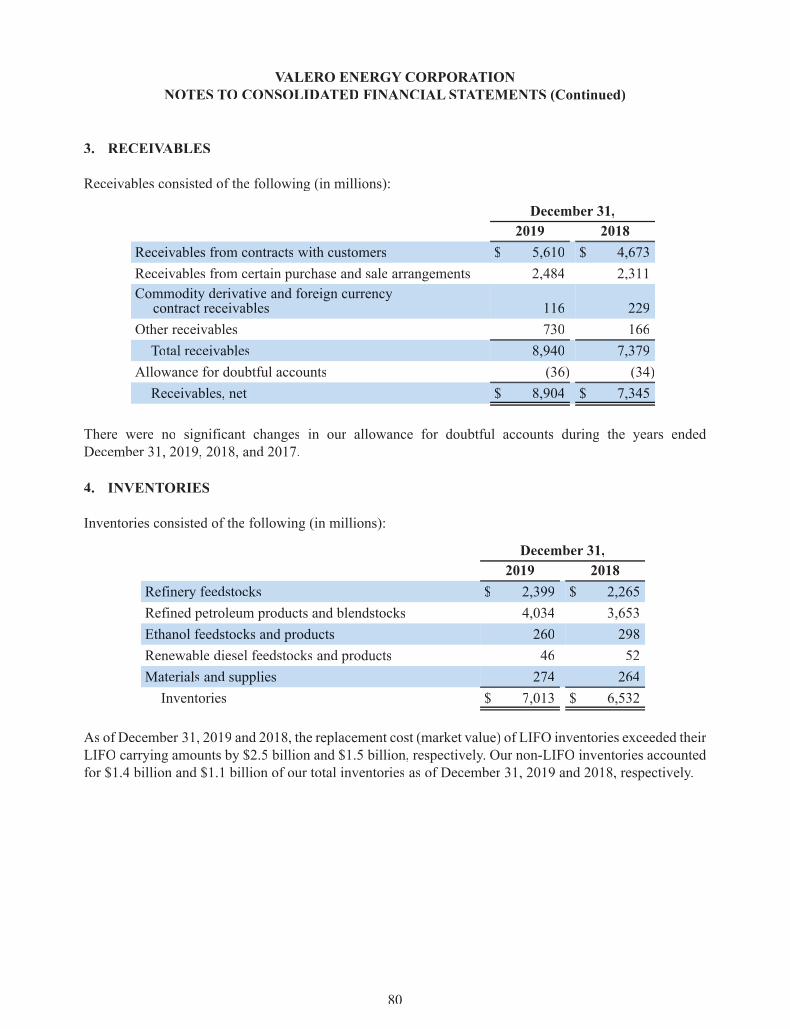
3. RECEIVABLESVV
Receivables consisted of the following (in millions):
December 31,2019 2018
Receivables from contracts with customers $ 5,610 $ 4,673Receivables from certain purchase and sale arrangements 2,484 2,311Commodity derivative and foreign currencycontract receivables 116 229
Other receivables 730 166Total receivables 8,940 7,379
Allowance for doubtful accounts (36) (34)Receivables, net $ 8,904 $ 7,345
There were no significant changes in our allowance for doubtful accounts during the years endedDecember 31, 2019, 2018, and 2017.
VALERO ENERGYCORPORATIONAANOTES TO CONSOLIDATEDAA FINANCIAL STATTT EMENTS (Continued)
80
4. INVENTORIES
Inventories consisted of the following (in millions):
December 31,2019 2018
Refinery feedstocks $ 2,399 $ 2,265Refined petroleum products and blendstocks 4,034 3,653Ethanol feedstocks and products 260 298Renewable diesel feedstocks and products 46 52Materials and supplies 274 264Inventories $ 7,013 $ 6,532
As of December 31, 2019 and 2018, the replacement cost (market value) of LIFO inventories exceeded theirLIFO carrying amounts by $2.5 billion and $1.5 billion, respectively. Our non-LIFO inventories accountedfor $1.4 billion and $1.1 billion of our total inventories as of December 31, 2019 and 2018, respectively.

5. LEASES
GeneralWe have entered into long-term leasing arrangements for the right to use various classes of underlying assetsas follows:
• Pipelines, Terminals, and Tanks includes facilities and equipment used in the storage, transportation,production, and sale of refinery feedstock, refined petroleum product, and corn inventories;
• Marine Transportation includes time charters for ocean-going tankers and coastal vessels;
• Rail Transportation includes railcars and related storage facilities;
• Feedstock Processingrr Equipment includes machinery,yy equipment, and various facilities used in ourrefining, ethanol, and renewable diesel operations;
• Energyr and Gases includes facilities and equipment related to industrial gases and power used inour operations;
• Real Estate includes land and rights-of-way associated with our refineries and pipelines, as well asofficeff facilities; and
• Other includes equipment primarily used at our corporate offices,ff such as printers and copiers.
In addition to fixed lease payments, some arrangements contain provisions for variable lease payments.Certain leases for pipelines, terminals, and tanks provide for variable lease payments based on, among otherthings, throughput volumes in excess of a base amount. Certain marine transportation leases containprovisions for payments that are contingent on usage. Additionally,yy if the rental increases are not scheduledin the lease, such as an increase based on subsequent changes in the index or rate, those rents are consideredvariable lease payments. In all instances, variable lease payments are recognized in the period in which theobligation for those payments is incurred.
VALERO ENERGYCORPORATIONAANOTES TO CONSOLIDATEDAA FINANCIAL STATTT EMENTS (Continued)
81

Lease Costs and Other Supplemental InformationIn accordance with Topic 842, our total lease cost comprises costs that are included in our income statement,as well as costs capitalized as part of an item of property,yy plant, and equipment or inventory. Total lease costby class of underlying asset was as follows (in millions):
Year Ended December 31, 2019
Pipelines,Terminals,and Tanks
Transportation FeedstockProcessingEquipment
EnergyandGases
RealEstate Other TotalMarine Rail
Finance lease cost:Amortization of ROU assets $ 44 $ — $ — $ 7 $ 3 $ — $ — $ 54Interest on lease liabilities 47 — — 1 2 — — 50
Operating lease cost 182 145 52 20 9 27 4 439Variable lease cost 66 35 — 1 — 1 — 103Short-term lease cost 9 53 — 29 — — — 91Sublease income — (27) — — — (3) — (30)Total lease cost $ 348 $ 206 $ 52 $ 58 $ 14 $ 25 $ 4 $ 707
In accordance with Topic 840, “rental expense, net of sublease rental income” was as follows (in millions):
Year Ended December 31,2018 2017
Minimum rental expense $ 515 $ 691Contingent rental expense 19 21Total rental expense 534 712
Less: Sublease rental income 31 54Rental expense, net of sublease rental income $ 503 $ 658
VALERO ENERGYCORPORATIONAANOTES TO CONSOLIDATEDAA FINANCIAL STATTT EMENTS (Continued)
82
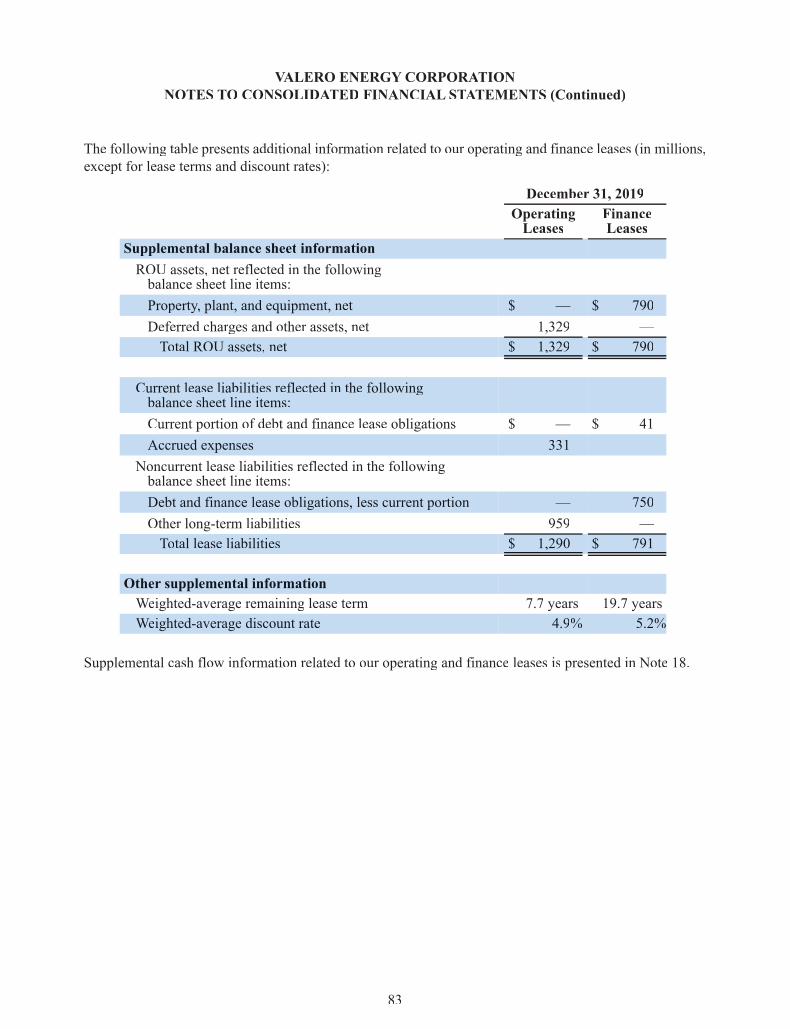
The following table presents additional information related to our operating and finance leases (in millions,except for lease terms and discount rates):
December 31, 2019OperatingLeases
FinanceLeases
Supplemental balance sheet informationROU assets, net reflected in the followingbalance sheet line items:Property,yy plant, and equipment, net $ — $ 790Deferred charges and other assets, net 1,329 —Total ROU assets, net $ 1,329 $ 790
Current lease liabilities reflected in the followingbalance sheet line items:Current portion of debt and finance lease obligations $ — $ 41Accrued expenses 331 —
Noncurrent lease liabilities reflected in the followingbalance sheet line items:Debt and finance lease obligations, less current portion — 750Other long-term liabilities 959 —Total lease liabilities $ 1,290 $ 791
Other supplemental informationWeighted-average remaining lease term 7.7 years 19.7 yearsWeighted-average discount rate 4.9% 5.2%
Supplemental cash flow information related to our operating and finance leases is presented in Note 18.
VALERO ENERGYCORPORATIONAANOTES TO CONSOLIDATEDAA FINANCIAL STATTT EMENTS (Continued)
83
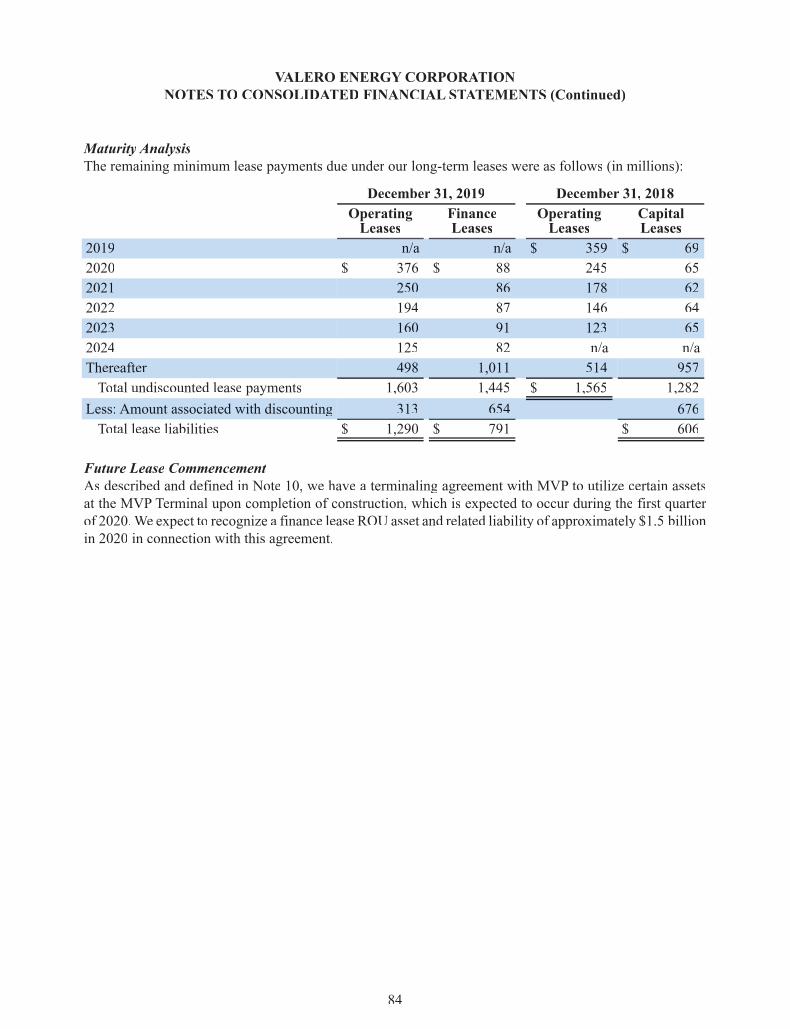
Maturity AnalysisThe remaining minimum lease payments due under our long-term leases were as follows (in millions):
December 31, 2019 December 31, 2018OperatingLeases
FinanceLeases
OperatingLeases
CapitalLeases
2019 n/a n/a $ 359 $ 692020 $ 376 $ 88 245 652021 250 86 178 622022 194 87 146 642023 160 91 123 652024 125 82 n/a n/aThereafter 498 1,011 514 957Total undiscounted lease payments 1,603 1,445 $ 1,565 1,282
Less: Amount associated with discounting 313 654 676Total lease liabilities $ 1,290 $ 791 $ 606
Future Lease CommencementAs described and defined in Note 10, we have a terminaling agreement with MVP to utilize certain assetsat the MVP Terminal upon completion of construction, which is expected to occur during the first quarterof 2020.We expect to recognize a finance lease ROU asset and related liability of approximately $1.5 billionin 2020 in connection with this agreement.
VALERO ENERGYCORPORATIONAANOTES TO CONSOLIDATEDAA FINANCIAL STATTT EMENTS (Continued)
84
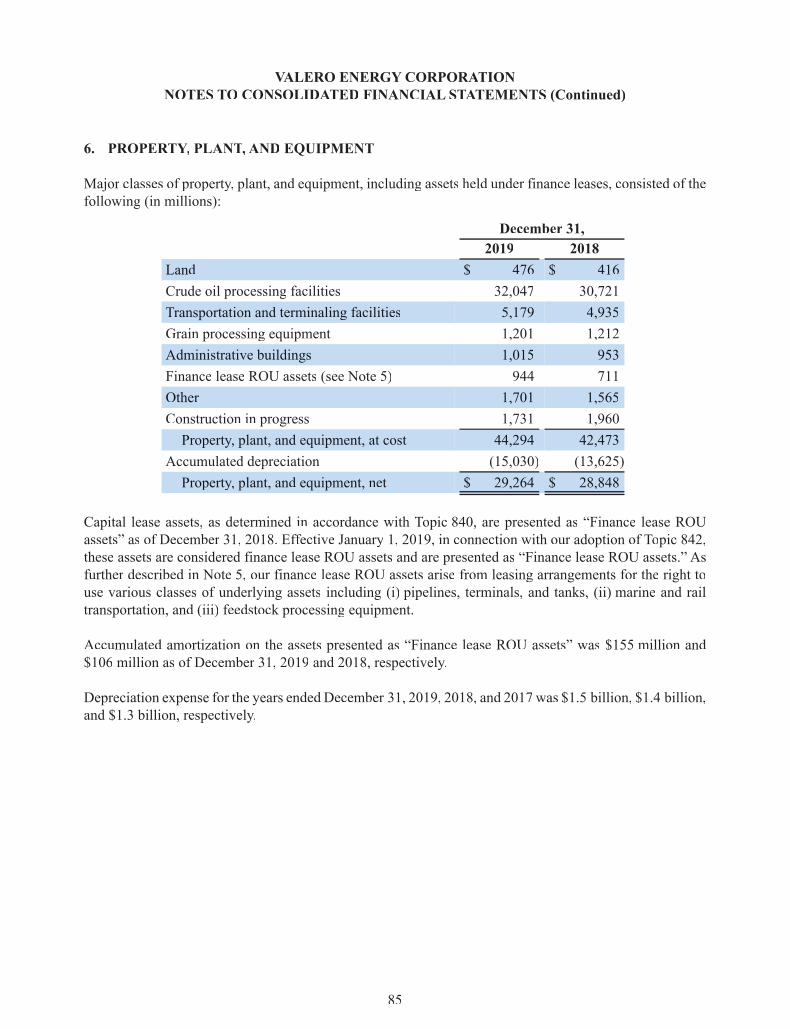
6. PROPERTYRR ,YY PLANT,TT AND EQUIPMENT
Major classes of property,yy plant, and equipment, including assets held under finance leases, consisted of thefollowing (in millions):
December 31,2019 2018
Land $ 476 $ 416Crude oil processing facilities 32,047 30,721Transportation and terminaling facilities 5,179 4,935Grain processing equipment 1,201 1,212Administrative buildings 1,015 953Finance lease ROU assets (see Note 5) 944 711Other 1,701 1,565Construction in progress 1,731 1,960Property,yy plant, and equipment, at cost 44,294 42,473
Accumulated depreciation (15,030) (13,625)Property,yy plant, and equipment, net $ 29,264 $ 28,848
Capital lease assets, as determined in accordance with Topic 840, are presented as “Finance lease ROUassets” as of December 31, 2018. Effectiveff January 1, 2019, in connection with our adoption of Topic 842,these assets are considered finance lease ROU assets and are presented as “Finance lease ROU assets.” Asfurther described in Note 5, our finance lease ROU assets arise from leasing arrangements for the right touse various classes of underlying assets including (i) pipelines, terminals, and tanks, (ii) marine and railtransportation, and (iii) feedstock processing equipment.
Accumulated amortization on the assets presented as “Finance lease ROU assets” was $155 million and$106 million as of December 31, 2019 and 2018, respectively.
Depreciation expense for the years ended December 31, 2019, 2018, and 2017 was $1.5 billion, $1.4 billion,and $1.3 billion, respectively.
VALERO ENERGYCORPORATIONAANOTES TO CONSOLIDATEDAA FINANCIAL STATTT EMENTS (Continued)
85

7. DEFERRED CHARGESAND OTHERASSETS
“Deferred charges and other assets, net” consisted of the following (in millions):
December 31,2019 2018
Deferred turnaround and catalyst costs, net $ 1,778 $ 1,749Operating lease ROU assets, net (see Note 5) 1,329 —Investments in unconsolidated joint ventures 942 542Income taxes receivable 525 343Intangible assets, net 283 307Goodwill 260 260Other 514 431Deferred charges and other assets, net $ 5,631 $ 3,632
Amortization expense for deferred turnaround and catalyst costs and intangible assets was $759 million,$668 million, and $650 million for the years ended December 31, 2019, 2018, and 2017, respectively.
VALERO ENERGYCORPORATIONAANOTES TO CONSOLIDATEDAA FINANCIAL STATTT EMENTS (Continued)
86
8. ACCRUED EXPENSESAND OTHER LONG-TERM LIABILITIES
Accrued expenses and other long-term liabilities consisted of the following (in millions):
AccruedExpenses
Other Long-TermTTLiabilities
December 31, December 31,2019 2018 2019 2018
Operating lease liabilities (see Note 5) $ 331 $ — $ 959 $ —Liability for unrecognized tax benefits (see Note 15) — — 954 721Defined benefit plan liabilities (see Note 13) 37 43 834 654Repatriation tax liability (see Note 15) (a) — — 508 603Environmental liabilities 27 29 319 327Wage and other employee-related liabilities 292 302 121 109Accrued interest expense 83 93 — —Contract liabilities from contracts with customers(see Note 17) 55 31 — —
Environmental credit obligations (see Note 19) 31 34 — —Other accrued liabilities 93 98 192 453Accrued expenses and other long-term liabilities $ 949 $ 630 $ 3,887 $ 2,867
____________________________
(a) The current portion of repatriation tax liability is included in income taxes payable. As of December 31, 2019, thecurrent portion of repatriation tax liability was $54 million. Therewas no current portion of repatriation tax liabilityas of December 31, 2018.
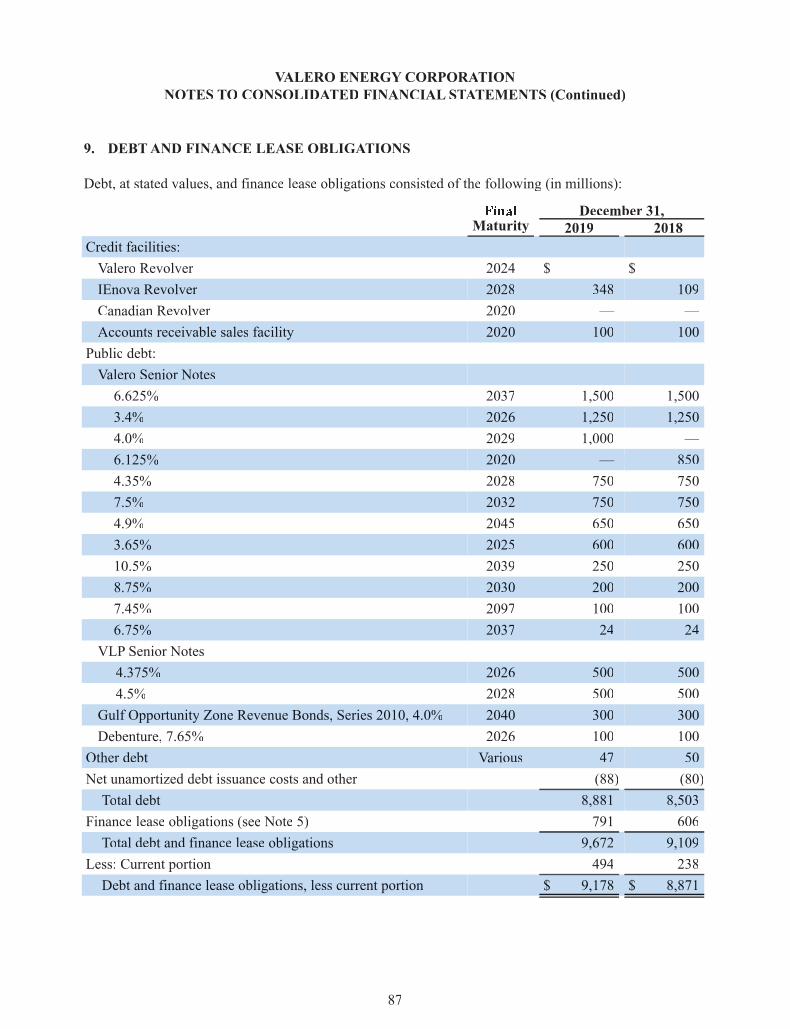
9. DEBTAND FINANCE LEASE OBLIGATIONSAA
Debt, at stated values, and finance lease obligations consisted of the following (in millions):
MaturityDecember 31,
2019 2018Credit facilities:Valero Revolver 2024 $ — $ —IEnova Revolver 2028 348 109Canadian Revolver 2020 — —Accounts receivable sales facility 2020 100 100
Public debt:Valero Senior Notes6.625% 2037 1,500 1,5003.4% 2026 1,250 1,2504.0% 2029 1,000 —6.125% 2020 — 8504.35% 2028 750 7507.5% 2032 750 7504.9% 2045 650 6503.65% 2025 600 60010.5% 2039 250 2508.75% 2030 200 2007.45% 2097 100 1006.75% 2037 24 24
VLP Senior Notes4.375% 2026 500 5004.5% 2028 500 500
Gulf Opportunity Zone Revenue Bonds, Series 2010, 4.0% 2040 300 300Debenture, 7.65% 2026 100 100
Other debt Various 47 50Net unamortized debt issuance costs and other (88) (80)Total debt 8,881 8,503
Finance lease obligations (see Note 5) 791 606Total debt and finance lease obligations 9,672 9,109
Less: Current portion 494 238Debt and finance lease obligations, less current portion $ 9,178 $ 8,871
VALERO ENERGYCORPORATIONAANOTES TO CONSOLIDATEDAA FINANCIAL STATTT EMENTS (Continued)
87
Credit FacilitiesValero Revolver
In March 2019, we amended our revolving credit facility (the Valero Revolver) to increase the borrowingcapacity from $3 billion to $4 billion and to extend the maturity date from November 2020 to March 2024.The Valero Revolver also provides for the issuance of letters of credit of up to $2.4 billion.
Outstanding borrowings under theValeroRevolver bear interest, at our option, at either (i) the adjusted LIBOrate (as defined in the Valero Revolver) for the applicable interest period in effectff from time to time plus theapplicablemargin or (ii) the alternate base rate (as defined in theValeroRevolver) plus the applicablemargin.The Valero Revolver also requires payments for customary fees, including facility fees, letter of creditparticipation fees, and administrative agent fees. The interest rate and facility fees under theValero Revolverare subject to adjustment based upon the credit ratings assigned to our senior unsecured debt.
We had no borrowings or repayments under theValero Revolver during the years ended December 31, 2019,2018, and 2017.
VLPRevolverAs of December 31, 2018, VLP had a $750 million senior unsecured revolving credit facility (the VLPRevolver) with a group of lenders that was scheduled to mature in November 2020. However, on January 10,2019, in connection with the completion of theMerger Transaction as described in Note 2, theVLPRevolverwas terminated.
During the year ended December 31, 2018, VLP repaid the outstanding balance of $410 million on the VLPRevolver using proceeds from its public offeringff of $500 million 4.5 percent Senior Notes as described in“Public Debt” below. During the year ended December 31, 2017, VLP borrowed $380 million under therevolver and made no repayments.
IEnova RevolverIn February 2018, CentralMexico Terminals (as described in Note 12) entered into a combined $340 millionunsecured revolving credit facility (IEnova Revolver) with IEnova (defined in Note 12) that matures inFebruary 2028. In November 2019, the IEnova Revolver was increased to $491 million. IEnova mayterminate this revolver at any time and demand repayment of all outstanding amounts; therefore, alloutstanding borrowings are reflected in current portion of debt. The IEnova Revolver is available only tothe operations of Central Mexico Terminals, and the creditors of Central Mexico Terminals do not haverecourse against us.
Outstanding borrowings under this revolver bear interest at the three-month LIBO rate for the applicableinterest period in effectff from time to time plus the applicable margin. The interest rate under this revolveris subject to adjustment, with agreement by both parties, based upon changes in market conditions. As ofDecember 31, 2019 and 2018, the variable rate was 5.749 percent and 6.046 percent, respectively.
During the year ended December 31, 2019 and 2018, Central Mexico Terminals borrowed $239 million and$109 million, respectively,yy and had no repayments under this revolver.
VALERO ENERGYCORPORATIONAANOTES TO CONSOLIDATEDAA FINANCIAL STATTT EMENTS (Continued)
88
Canadian RevolverIn November 2019, one of our Canadian subsidiaries amended its committed revolving credit facility (theCanadian Revolver) of C$150 million, under which it may borrow and obtain letters of credit, to extend thematurity date from November 2019 to November 2020.
We had no borrowings or repayments under this revolver during the years ended December 31, 2019, 2018,and 2017.
Accounts Receivable Sales FacilityWe have an accounts receivable sales facility with a group of third-party entities and financial institutionsto sell up to $1.3 billion of eligible trade receivables on a revolving basis. In July 2019, we amended ouragreement to extend the maturity date to July 2020. Under this program, one of our marketing subsidiaries(ValeroVV Marketing) sells eligible receivables,without recourse, to another of our subsidiaries (ValeroVV Capital),whereupon the receivables are no longer owned by Valero Marketing. Valero Capital, in turn, sells anundivided percentage ownership interest in the eligible receivables, without recourse, to the third-partyentities and financial institutions. To the extent that Valero Capital retains an ownership interest in thereceivables it has purchased from Valero Marketing, such interest is included in our financial statementssolely as a result of the consolidation of the financial statements ofValeroCapital with those ofValero EnergyCorporation; the receivables are not available to satisfy the claims of the creditors of Valero Marketing orValero Energy Corporation.
As of December 31, 2019 and 2018, $2.2 billion and $1.8 billion, respectively,yy of our accounts receivablecomposed the designated pool of accounts receivable included in the program. All amounts outstandingunder the accounts receivable sales facility are reflected as debt on our balance sheets and proceeds andrepayments are reflected as cash flows from financing activities on the statements of cash flows. As ofDecember 31, 2019 and 2018, the variable interest rate on the accounts receivable sales facility was2.3866 percent and 3.0618 percent, respectively. During the year ended December 31, 2019, we sold andrepaid $900 million of eligible receivables under the accounts receivable sales facility. During the yearsended December 31, 2018 and 2017, we had no proceeds from or repayments under the accounts receivablesales facility.
VALERO ENERGYCORPORATIONAANOTES TO CONSOLIDATEDAA FINANCIAL STATTT EMENTS (Continued)
89
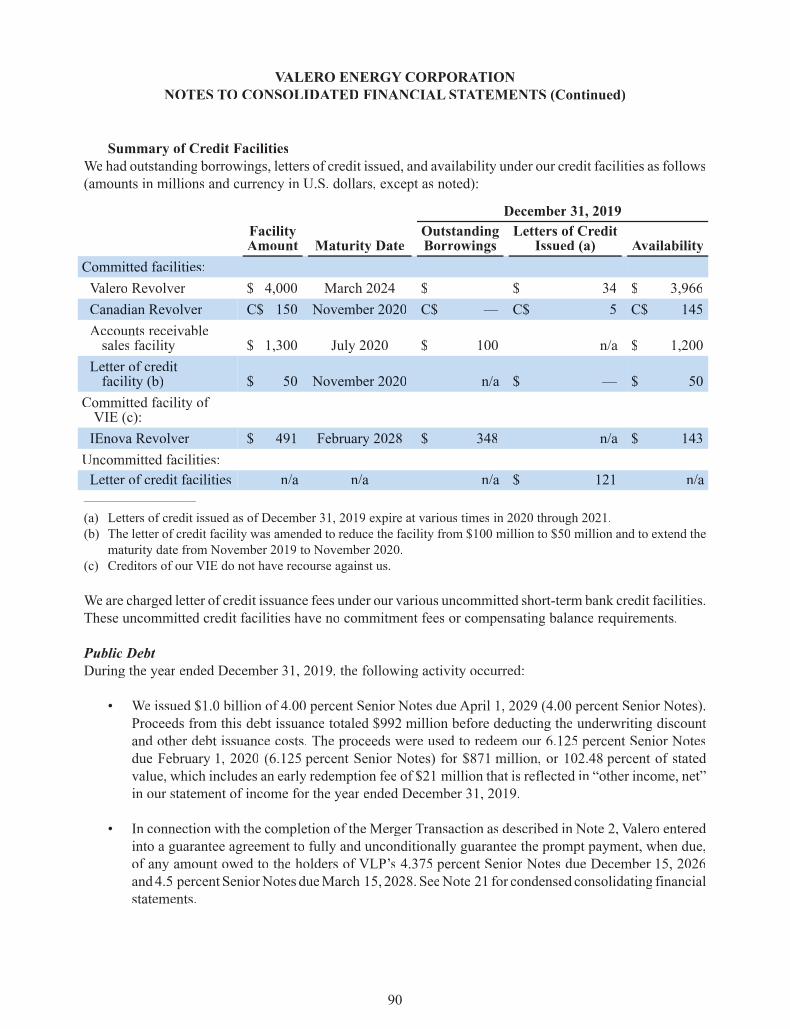
Summary of Credit FacilitiesWe had outstanding borrowings, letters of credit issued, and availability under our credit facilities as follows(amounts in millions and currency in U.S. dollars, except as noted):
December 31, 2019FacilityAmount Maturity Date
OutstandingBorrowings
Letters of CreditIssued (a) Availability
Committed facilities:Valero Revolver $ 4,000 March 2024 $ — $ 34 $ 3,966Canadian Revolver C$ 150 November 2020 C$ — C$ 5 C$ 145Accounts receivablesales facility $ 1,300 July 2020 $ 100 n/a $ 1,200
Letter of creditfacility (b) $ 50 November 2020 n/a $ — $ 50
Committed facility ofVIE (c):IEnova Revolver $ 491 February 2028 $ 348 n/a $ 143Uncommitted facilities:Letter of credit facilities n/a n/a n/a $ 121 n/a____________________________
(a) Letters of credit issued as of December 31, 2019 expire at various times in 2020 through 2021.(b) The letter of credit facility was amended to reduce the facility from $100 million to $50 million and to extend the
maturity date from November 2019 to November 2020.(c) Creditors of our VIE do not have recourse against us.
We are charged letter of credit issuance fees under our various uncommitted short-term bank credit facilities.These uncommitted credit facilities have no commitment fees or compensating balance requirements.
Public DebtDuring the year ended December 31, 2019, the following activity occurred:
• WeWW issued $1.0 billion of 4.00 percent Senior Notes due April 1, 2029 (4.00 percent Senior Notes).Proceeds from this debt issuance totaled $992 million before deducting the underwriting discountand other debt issuance costs. The proceeds were used to redeem our 6.125 percent Senior Notesdue February 1, 2020 (6.125 percent Senior Notes) for $871 million, or 102.48 percent of statedvalue, which includes an early redemption fee of $21 million that is reflected in “other income, net”in our statement of income for the year ended December 31, 2019.
• In connection with the completion of the Merger Transaction as described in Note 2, Valero enteredinto a guarantee agreement to fully and unconditionally guarantee the prompt payment, when due,of any amount owed to the holders of VLP’s 4.375 percent Senior Notes due December 15, 2026and4.5 percent SeniorNotes dueMarch 15, 2028. SeeNote 21 for condensed consolidating financialstatements.
VALERO ENERGYCORPORATIONAANOTES TO CONSOLIDATEDAA FINANCIAL STATTT EMENTS (Continued)
90

During the year ended December 31, 2018, the following activity occurred:
• WeWW issued $750 million of 4.35 percent Senior Notes due June 1, 2028. Proceeds from this debtissuance totaled $749 million before deducting the underwriting discount and other debt issuancecosts. The proceeds were used to redeem our 9.375 percent Senior Notes due March 15, 2019 for$787 million, or 104.9 percent of stated value,which includes an early redemption fee of $37 millionthat is reflected in “other income, net” in our statement of income for the year ended December 31,2018.
• VLP issued $500 million of 4.5 percent Senior Notes due March 15, 2028. Proceeds from this debtissuance totaled $498 million before deducting the underwriting discount and other debt issuancecosts. The proceeds were available only to the operations of VLP and were used to repay theoutstanding balance of $410 million on the VLP Revolver and $85 million on its notes payable tous, which is eliminated in consolidation.
During the year endedDecember 31, 2017, there was no issuance or redemption activity related to our publicdebt.
Other DebtDuring the year ended December 31, 2018, we retired $137 million of debt assumed in connection with thePeru Acquisition with available cash on hand.
Other Disclosures“Interest and debt expense, net of capitalized interest” is comprised as follows (in millions):
Year Ended December 31,2019 2018 2017
Interest and debt expense $ 544 $ 557 $ 539Less: Capitalized interest 90 87 71Interest and debt expense, net ofcapitalized interest $ 454 $ 470 $ 468
Our credit facilities and other debt arrangements contain various customary restrictive covenants, includingcross-default and cross-acceleration clauses.
VALERO ENERGYCORPORATIONAANOTES TO CONSOLIDATEDAA FINANCIAL STATTT EMENTS (Continued)
91

Principal maturities for our debt obligations as of December 31, 2019 were as follows (in millions):
2020 (a) $ 4532021 172022 62023 192024 —Thereafter 8,474Net unamortized debt issuance costs and other (88)Total debt $ 8,881
____________________________
(a) As of December 31, 2019, our debt obligations due in 2020 include$348 million associated with borrowings under the IEnova Revolver.
VALERO ENERGYCORPORATIONAANOTES TO CONSOLIDATEDAA FINANCIAL STATTT EMENTS (Continued)
92
10. COMMITMENTSAND CONTINGENCIES
Purchase ObligationsWe have various purchase obligations under certain crude oil and other feedstock supply arrangements,industrial gas supplyarrangements (suchashydrogensupplyarrangements), natural gas supplyarrangements,and various throughput, transportation and terminaling agreements. We enter into these contracts to ensurean adequate supply of feedstock and utilities and adequate storage capacity to operate our refineries andethanol plants. Substantially all of our purchase obligations are based on market prices or adjustments basedon market indices. Certain of these purchase obligations include fixed or minimum volume requirements,while others are based on our usage requirements. None of these obligations is associated with suppliers’financing arrangements. These purchase obligations are not reflected as liabilities.
Contractual Capital CommitmentsMVPTerminal
We have a 50 percent membership interest in MVPTerminalling, LLC (MVP), a Delaware limited liabilitycompany formed in September 2017 with a subsidiary of Magellan Midstream Partners LP (Magellan), toconstruct, own, and operate theMagellanValero Pasadenamarine terminal (MVP Terminal) located adjacentto the Houston Ship Channel in Pasadena, Texas. The MVP Terminal contains (i) approximately 5 millionbarrels of storage capacity,yy (ii) a dock with two ship berths, and (iii) a three-bay truck rack facility. Inconnection with our terminaling agreement with MVP,PP described below,ww we will have dedicated use of(i) approximately 4 million barrels of storage, (ii) one ship berth, and (iii) the three-bay truck rack facility.Construction of phases one and two of the project began in 2017 with a total cost of $840 million, of whichwe have committed to contribute 50 percent ($420 million). The project could expand up to four phases witha total project cost of approximately $1.4 billion ifwarranted by additional demand and agreed to byMagellanand us. Since inception, we have contributed $404 million to MVP,PP of which $157 million was contributedduring the year ended December 31, 2019.
Concurrent with the formation of MVP,PP we entered into a terminaling agreement with MVP to utilize theMVP Terminal upon completion of the majority of phase two, which is expected to occur in the first quarter

of 2020. The terminaling agreement has an initial term of 12 years with two five-year automatic renewals,and year-to-year renewals thereafter.
Prior to our adoption of Topic 842 as described in Note 1, we were considered the accounting owner of theMVP Terminal during the construction period due to our membership interest in MVP and because wedetermined that the terminaling agreement was a capital lease. Accordingly,yy as of December 31, 2018, wehad recorded an asset of $539 million in property,yy plant, and equipment representing 100 percent of theconstruction costs incurred by MVP,PP as well as capitalized interest incurred by us, and a long-term liabilityof $292 million payable to Magellan. The amounts recorded for the portion of the construction costsassociated with the payable to Magellan were noncash investing and financing items, respectively.
On yJanuary 1, 2019, as a lresult of our d iadoption of To ipic 842, we derecognizedderecognized hthe asset dand liabilityliability relatedrelatedto MVP di ddiscussed babove dand d drecorded our equityequity iinvestment iin MVP of $247 million, hi hwhich iis i l d dincluded iind d“deferred hchargges dand hother assets, net.” hThe amounts derecognizedderecognized are hnoncash investinginvesting dand financingfinancingiitems, respectivelyrespectively. As of December 31, 2019, hthe carryingcarrying lvalue of our equityequity iinvestment iin MVP was$401 million.
Central Texas PipelineWe committed to a 40 percent undivided interest in a project with a subsidiary of Magellan to jointly builda 135-mile, 20-inch refined petroleum products pipeline with a capacity of up to 150,000 barrels per dayfrom Houston to Hearne, Texas. The pipeline was placed in service in the third quarter of 2019. The cost ofour 40 percent undivided interest in the pipeline was $160 million, of which $80 million was spent duringthe year ended December 31, 2019.
Self-InsuranceWe are self-insured for certain medical and dental, workers’ compensation, automobile liability,yy generalliability,yy and property liability claims up to applicable retention limits. Liabilities are accrued for self-insuredclaims, or when estimated losses exceed coverage limits, and when sufficientff information is available toreasonably estimate the amount of the loss. These liabilities are included in accrued expenses and other long-term liabilities.
VALERO ENERGYCORPORATIONAANOTES TO CONSOLIDATEDAA FINANCIAL STATTT EMENTS (Continued)
93
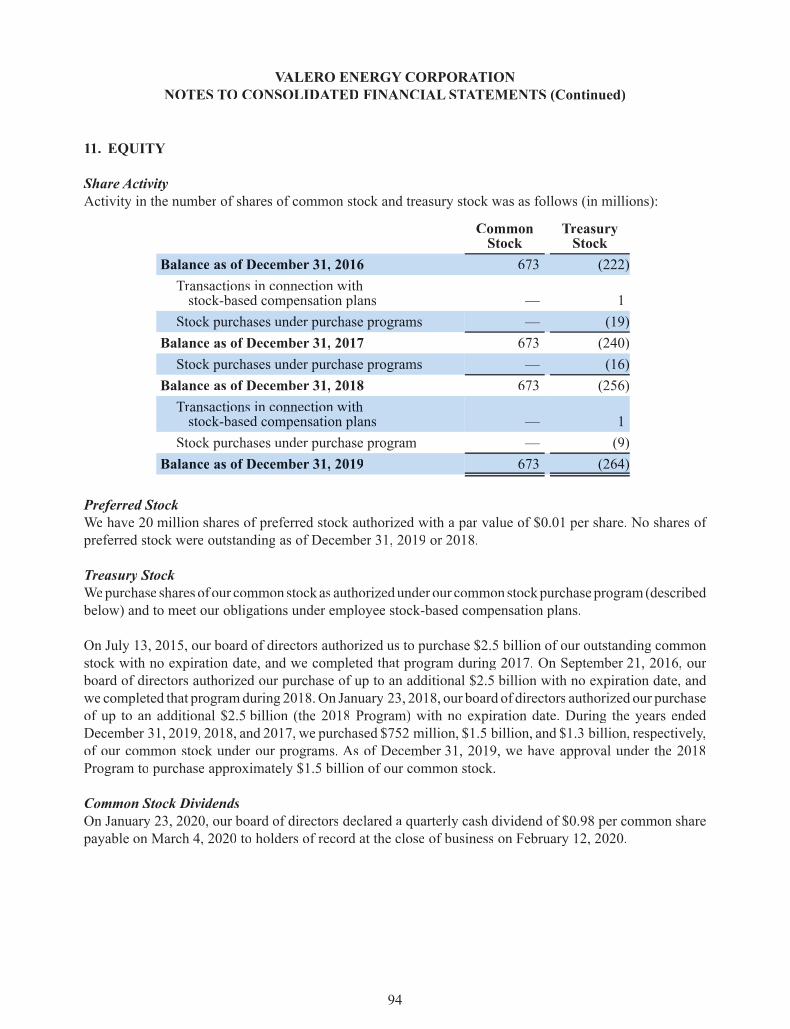
11. EQUITY
Share ActivityActivity in the number of shares of common stock and treasury stock was as follows (in millions):
CommonStock
TreasuryStock
Balance as of December 31, 2016 673 (222)Transactions in connection withstock-based compensation plans — 1
Stock purchases under purchase programs — (19)Balance as of December 31, 2017 673 (240)Stock purchases under purchase programs — (16)
Balance as of December 31, 2018 673 (256)Transactions in connection withstock-based compensation plans — 1
Stock purchases under purchase program — (9)Balance as of December 31, 2019 673 (264)
Preferred StockWe have 20 million shares of preferred stock authorized with a par value of $0.01 per share. No shares ofpreferred stock were outstanding as of December 31, 2019 or 2018.
Treasury StockWepurchase sharesof our commonstockas authorizedunderour commonstockpurchaseprogram(describedbelow) and to meet our obligations under employee stock-based compensation plans.
On July 13, 2015, our board of directors authorized us to purchase $2.5 billion of our outstanding commonstock with no expiration date, and we completed that program during 2017. On September 21, 2016, ourboard of directors authorized our purchase of up to an additional $2.5 billion with no expiration date, andwe completed that programduring 2018.On January 23, 2018, our board of directors authorized our purchaseof up to an additional $2.5 billion (the 2018 Program) with no expiration date. During the years endedDecember 31, 2019, 2018, and 2017, we purchased $752 million, $1.5 billion, and $1.3 billion, respectively,yyof our common stock under our programs. As of December 31, 2019, we have approval under the 2018Program to purchase approximately $1.5 billion of our common stock.
Common Stock DividendsOn January 23, 2020, our board of directors declared a quarterly cash dividend of $0.98 per common sharepayable on March 4, 2020 to holders of record at the close of business on February 12, 2020.
VALERO ENERGYCORPORATIONAANOTES TO CONSOLIDATEDAA FINANCIAL STATTT EMENTS (Continued)
94
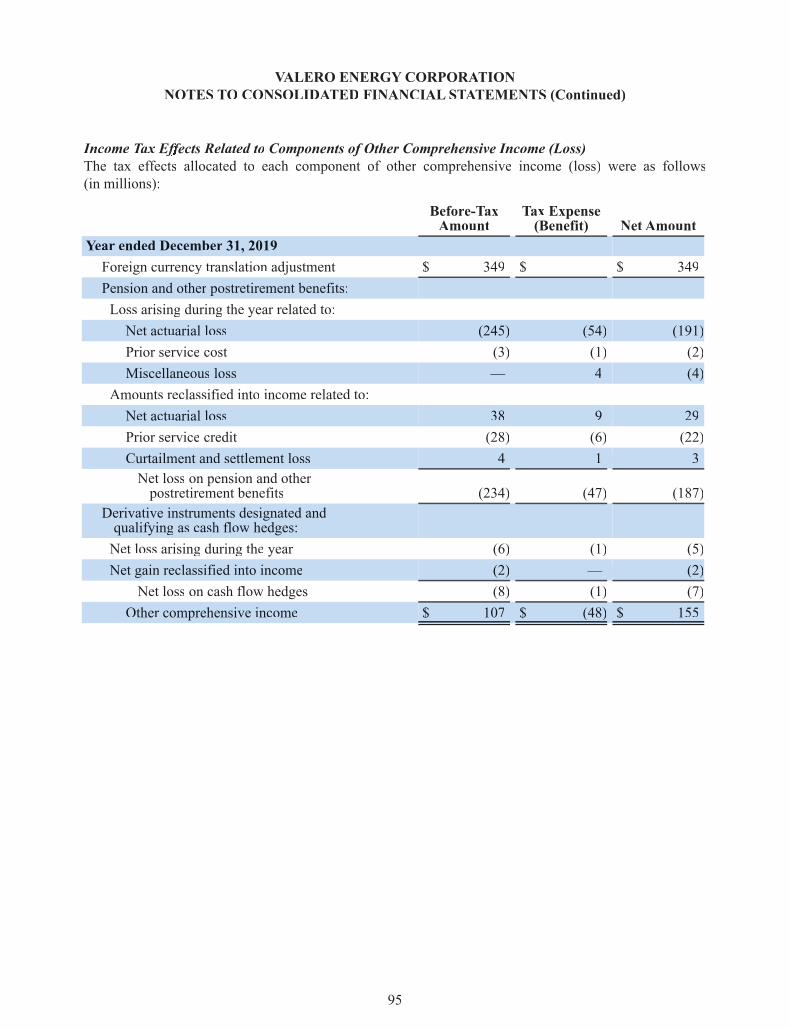
Income Taxaa Effectsff Related to Components of Other Comprehensive Income (Loss)The tax effectsff allocated to each component of other comprehensive income (loss) were as follows(in millions):
Before-TaxTTAmount
Tax Expense(Benefit) Net Amount
Year ended December 31, 2019Foreign currency translation adjustment $ 349 $ — $ 349Pension and other postretirement benefits:Loss arising during the year related to:Net actuarial loss (245) (54) (191)Prior service cost (3) (1) (2)Miscellaneous loss — 4 (4)
Amounts reclassified into income related to:Net actuarial loss 38 9 29Prior service credit (28) (6) (22)Curtailment and settlement loss 4 1 3Net loss on pension and otherpostretirement benefits (234) (47) (187)
Derivative instruments designated andqualifying as cash flow hedges:Net loss arising during the year (6) (1) (5)Net gain reclassified into income (2) — (2)
Net loss on cash flow hedges (8) (1) (7)Other comprehensive income $ 107 $ (48) $ 155
VALERO ENERGYCORPORATIONAANOTES TO CONSOLIDATEDAA FINANCIAL STATTT EMENTS (Continued)
95

Before-TaxTTAmount
Tax Expense(Benefit) Net Amount
Year ended December 31, 2018Foreign currency translation adjustment $ (517) $ — $ (517)Pension and other postretirement benefits:Gain arising during the year related to:Net actuarial gain 1 — 1Prior service credit 7 1 6
Amounts reclassified into income related to:Net actuarial loss 63 14 49Prior service credit (29) (7) (22)Curtailment and settlement loss 7 2 5Net gain on pension and otherpostretirement benefits 49 10 39
Other comprehensive loss $ (468) $ 10 $ (478)
Year ended December 31, 2017Foreign currency translation adjustment $ 514 $ — $ 514Pension and other postretirement benefits:Loss arising during the year related to:Net actuarial loss (79) (29) (50)Prior service cost (4) (1) (3)Miscellaneous loss — 3 (3)
Amounts reclassified into income related to:Net actuarial loss 50 18 32Prior service credit (36) (13) (23)Curtailment and settlement loss 4 1 3Net loss on pension and otherpostretirement benefits (65) (21) (44)
Other comprehensive income $ 449 $ (21) $ 470
VALERO ENERGYCORPORATIONAANOTES TO CONSOLIDATEDAA FINANCIAL STATTT EMENTS (Continued)
96
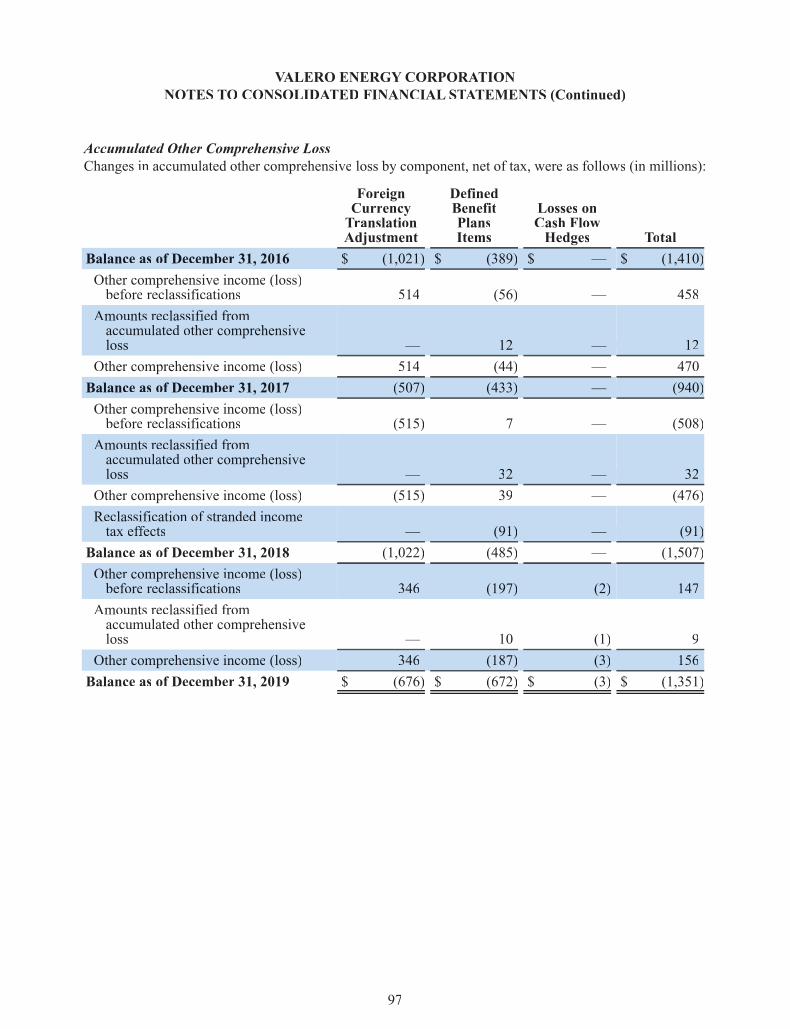
Accumulated Other Comprehensive LossChanges in accumulated other comprehensive loss by component, net of tax, were as follows (in millions):
ForeignCurrencyTranslationAdjustment
DefinedBenefitPlansItems
Losses onCash FlowHedges Total
Balance as of December 31, 2016 $ (1,021) $ (389) $ — $ (1,410)Other comprehensive income (loss)before reclassifications 514 (56) — 458
Amounts reclassified fromaccumulated other comprehensiveloss — 12 — 12
Other comprehensive income (loss) 514 (44) — 470Balance as of December 31, 2017 (507) (433) — (940)Other comprehensive income (loss)before reclassifications (515) 7 — (508)
Amounts reclassified fromaccumulated other comprehensiveloss — 32 — 32
Other comprehensive income (loss) (515) 39 — (476)Reclassification of stranded incometax effectsff — (91) — (91)
Balance as of December 31, 2018 (1,022) (485) — (1,507)Other comprehensive income (loss)before reclassifications 346 (197) (2) 147
Amounts reclassified fromaccumulated other comprehensiveloss — 10 (1) 9
Other comprehensive income (loss) 346 (187) (3) 156Balance as of December 31, 2019 $ (676) $ (672) $ (3) $ (1,351)
VALERO ENERGYCORPORATIONAANOTES TO CONSOLIDATEDAA FINANCIAL STATTT EMENTS (Continued)
97

Gains (losses) reclassified out of accumulated other comprehensive loss and into net income were as follows(in millions):
Details aboutAccumulated OtherComprehensive Loss
Components
Affected LineItem in theStatement ofIncome
Year Ended December 31,2019 2018 2017
Amortization of items related todefined benefit pension plans:Net actuarial loss $ (38) $ (63) $ (50) (a) Other income, netPrior service credit 28 29 36 (a) Other income, net
Curtailment and settlement (4) (7) (4) (a) Other income, net(14) (41) (18) Total before tax4 9 6 Tax benefit
$ (10) $ (32) $ (12) Net of tax
Gains on cash flow hedges:Commodity contracts $ 2 $ — $ — Revenues
$ 2 $ — $ — Net of tax
Total reclassifications for the year $ (8) $ (32) $ (12) Net of tax
p
_________________________(a) These accumulated other comprehensive loss components are included in the computation of net periodic
benefit cost (credit), as discussed in Note 13.
VALERO ENERGYCORPORATIONAANOTES TO CONSOLIDATEDAA FINANCIAL STATTT EMENTS (Continued)
98
12. VARIABLE INTEREST ENTITIES
Consolidated VIEsIn the normal course of business, we have financial interests in certain entities that have been determined tobe VIEs. We consolidate a VIE when we have a variable interest in an entity for which we are the primarybeneficiary such that we have (i) the power to direct the activities of the VIE that most significantly impactthe VIE’s economic performance and (ii) the obligation to absorb losses of or the right to receive benefitsfrom theVIE that could potentially be significant to theVIE. In order tomake this determination,we evaluatedour contractual arrangements with the VIEs, including arrangements for the use of assets, purchases ofproducts and services, debt, equity,yy or management of operating activities.
The following discussion summarizes our involvement with our VIEs:
• DGD is a joint venture with a subsidiary of Darling Ingredients Inc. that owns and operates a plantthat processes animal fats, used cooking oils, and other vegetable oils into renewable diesel. Theplant is located in Norco, Louisiana next to our St. Charles Refinery. Our significant agreementswith DGD include an operations agreement that outlines our responsibilities as operator of the plantand a marketing agreement.

As operator, we operate the plant and perform certain day-to-day operating and managementfunctions for DGD as an independent contractor. The operations agreement provides us (as operator)with certain power to direct the activities that most significantly impact DGD’s economicperformance. Because this agreement conveys such power to us and is separate from our ownershiprights, we determined that DGD was a VIE. For this reason and because we hold a 50 percentownership interest that provides us with significant economic rights and obligations, we determinedthat we are the primary beneficiary of DGD. DGD has risk associated with its operations becauseit generates revenues from third-party customers.
• Central Mexico Terminals is a collective group of three subsidiaries of Infraestructura EnergeticaNova, S.A.B. de C.V.VV (IEnova), aMexican company and subsidiary of Sempra Energy,yy a U.S. publiccompany. We have terminaling agreements with Central Mexico Terminals that represent variableinterests because we have determined them to be finance leases due to our exclusive use of theterminals. Although we do not have an ownership interest in the entities that own each of the threeterminals, the finance leases convey to us (i) the power to direct the activities that most significantlyimpact the economic performance of all three terminals and (ii) the ability to influence the benefitsreceived or the losses incurred by the terminals because of our use of the terminals. As a result, wedetermined each of the entities was a VIE and that we are the primary beneficiary of each.Substantially all of Central Mexico Terminals’ revenues will be derived from us; therefore, there islimited risk to us associated with Central Mexico Terminals’ operations.
• WeWW also have financial interests in other entities that have been determined to be VIEs because theentities’ contractual arrangements transfer the power to us to direct the activities that mostsignificantly impact their economic performance or reduce the exposure to operational variabilityand risk of loss created by the entity that otherwise would be held exclusively by the equity owners.Furthermore, we determined that we are the primary beneficiary of these VIEs because (i) certaincontractual arrangements (exclusive of our ownership rights) provide us with the power to directthe activities thatmost significantly impact the economic performance of these entities and/or (ii) our50 percent ownership interests provide us with significant economic rights and obligations.
The VIEs’ assets can only be used to settle their own obligations and the VIEs’ creditors have no recourseto our assets.We do not provide financial guarantees to ourVIEs.Althoughwe have provided credit facilitiesto some of ourVIEs in support of their construction or acquisition activities, these transactions are eliminatedin consolidation.Our financial position, results of operations, andcash flowsare impactedbyour consolidatedVIEs’ performance, net of intercompany eliminations, to the extent of our ownership interest in each VIE.
VALERO ENERGYCORPORATIONAANOTES TO CONSOLIDATEDAA FINANCIAL STATTT EMENTS (Continued)
99
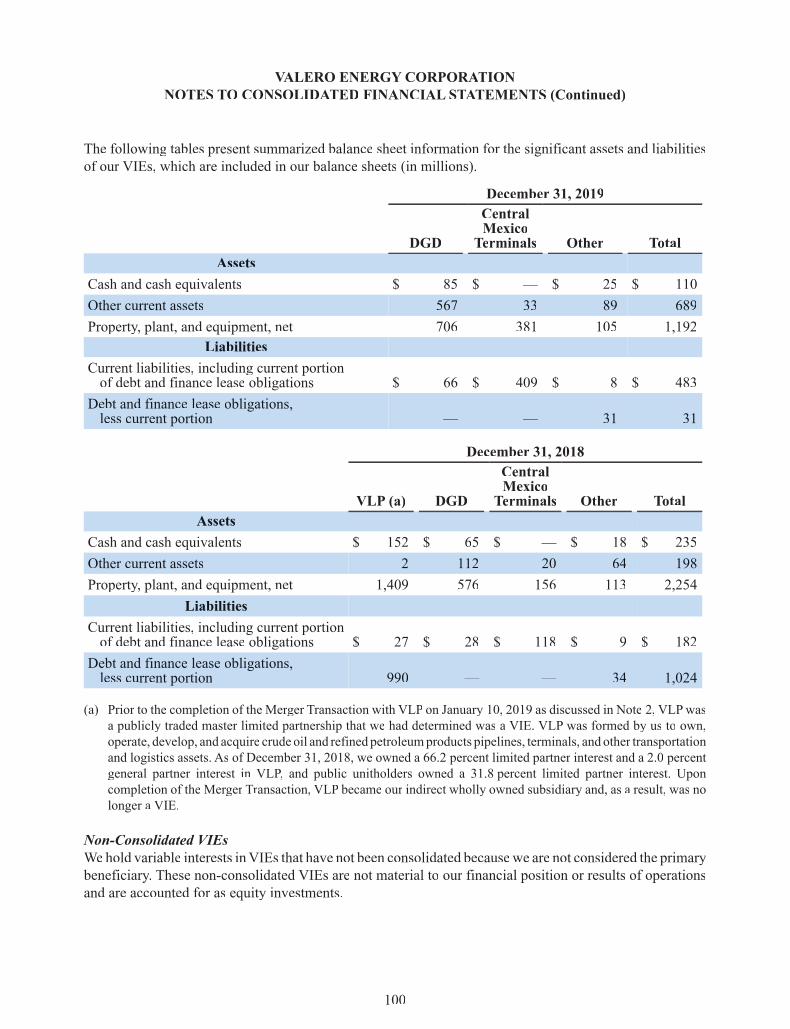
The following tables present summarized balance sheet information for the significant assets and liabilitiesof our VIEs, which are included in our balance sheets (in millions).
December 31, 2019
DGD
CentralMexicoTerminals Other Total
AssetsCash and cash equivalents $ 85 $ — $ 25 $ 110Other current assets 567 33 89 689Property,yy plant, and equipment, net 706 381 105 1,192
LiabilitiesCurrent liabilities, including current portionof debt and finance lease obligations $ 66 $ 409 $ 8 $ 483
Debt and finance lease obligations,less current portion — — 31 31
December 31, 2018
VLP (a) DGD
CentralMexicoTerminals Other Total
AssetsCash and cash equivalents $ 152 $ 65 $ — $ 18 $ 235Other current assets 2 112 20 64 198Property,yy plant, and equipment, net 1,409 576 156 113 2,254
LiabilitiesCurrent liabilities, including current portionof debt and finance lease obligations $ 27 $ 28 $ 118 $ 9 $ 182
Debt and finance lease obligations,less current portion 990 — — 34 1,024
____________________
(a) Prior to the completion of the Merger Transaction with VLP on January 10, 2019 as discussed in Note 2, VLPwasa publicly traded master limited partnership that we had determined was a VIE. VLP was formed by us to own,operate, develop, and acquire crude oil and refined petroleumproducts pipelines, terminals, and other transportationand logistics assets. As of December 31, 2018, we owned a 66.2 percent limited partner interest and a 2.0 percentgeneral partner interest in VLP,PP and public unitholders owned a 31.8 percent limited partner interest. Uponcompletion of the Merger Transaction, VLP became our indirect wholly owned subsidiary and, as a result, was nolonger a VIE.
Non-Consolidated VIEsWehold variable interests inVIEs that have not been consolidated becausewe are not considered the primarybeneficiary. These non-consolidated VIEs are not material to our financial position or results of operationsand are accounted for as equity investments.
VALERO ENERGYCORPORATIONAANOTES TO CONSOLIDATEDAA FINANCIAL STATTT EMENTS (Continued)
100

13. EMPLOYEE BENEFIT PLANS
Defined Benefit PlansWe have defined benefit pension plans, some of which are subject to collective bargaining agreements, thatcovermost of our employees.These plans provide eligible employeeswith retirement incomebased primarilyon years of service and compensation during specific periods under final average pay and cash balanceformulas.We fund our pension plans as required by local regulations. In the U.S., all qualified pension plansare subject to the Employee Retirement Income Security Act’s minimum funding standard. We typically donot fund or fully fundU.S. nonqualified and certain international pension plans that are not subject to fundingrequirements because contributions to these pension plans may be less economic and investment returnsmay be less attractive than our other investment alternatives.
We also provide health care and life insurance benefits for certain retired employees through ourpostretirement benefit plans.Most of our employees become eligible for these benefits if, while still workingfor us, they reach normal retirement age or take early retirement. These plans are unfunded, and retiredemployees share the cost with us. Individuals who became our employees as a result of an acquisition becameeligible for postretirement benefits under our plans as determined by the terms of the relevant acquisitionagreement.
VALERO ENERGYCORPORATIONAANOTES TO CONSOLIDATEDAA FINANCIAL STATTT EMENTS (Continued)
101
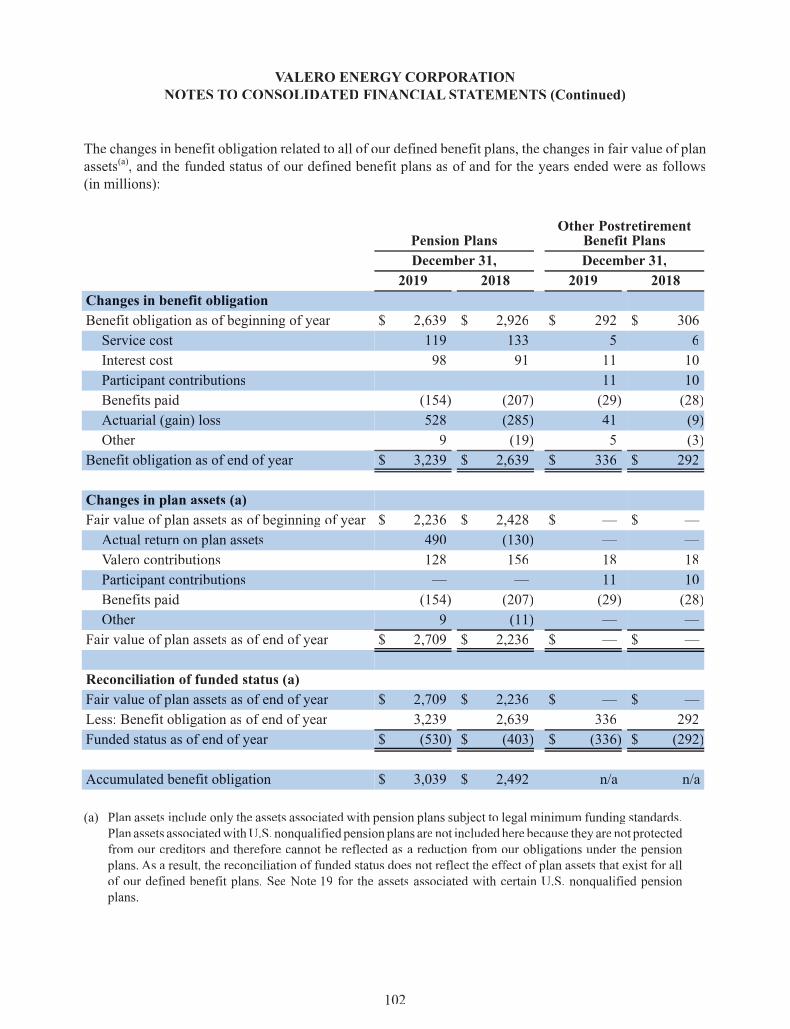
The changes in benefit obligation related to all of our defined benefit plans, the changes in fair value of planassets(a), and the funded status of our defined benefit plans as of and for the years ended were as follows(in millions):
Pension PlansOther Postretirement
Benefit PlansDecember 31, December 31,
2019 2018 2019 2018Changes in benefit obligationBenefit obligation as of beginning of year $ 2,639 $ 2,926 $ 292 $ 306Service cost 119 133 5 6Interest cost 98 91 11 10Participant contributions — — 11 10Benefits paid (154) (207) (29) (28)Actuarial (gain) loss 528 (285) 41 (9)Other 9 (19) 5 (3)
Benefit obligation as of end of year $ 3,239 $ 2,639 $ 336 $ 292
Changes in plan assets (a)Fair value of plan assets as of beginning of year $ 2,236 $ 2,428 $ — $ —Actual return on plan assets 490 (130) — —Valero contributions 128 156 18 18Participant contributions — — 11 10Benefits paid (154) (207) (29) (28)Other 9 (11) — —
Fair value of plan assets as of end of year $ 2,709 $ 2,236 $ — $ —
Reconciliation of funded status (a)Fair value of plan assets as of end of year $ 2,709 $ 2,236 $ — $ —Less: Benefit obligation as of end of year 3,239 2,639 336 292Funded status as of end of year $ (530) $ (403) $ (336) $ (292)
Accumulated benefit obligation $ 3,039 $ 2,492 n/a n/a____________________________
(a) Plan assets include only the assets associated with pension plans subject to legal minimum funding standards.Plan assets associatedwithU.S. nonqualified pension plans are not included here because they are not protectedfrom our creditors and therefore cannot be reflected as a reduction from our obligations under the pensionplans. As a result, the reconciliation of funded status does not reflect the effectff of plan assets that exist for allof our defined benefit plans. See Note 19 for the assets associated with certain U.S. nonqualified pensionplans.
VALERO ENERGYCORPORATIONAANOTES TO CONSOLIDATEDAA FINANCIAL STATTT EMENTS (Continued)
102

The actuarial loss for the year ended December 31, 2019 primarily resulted from a decrease in the discountrates used to determine our benefit obligations for our pension plans from4.25 percent in 2018 to 3.14 percentin 2019. The actuarial gain for the year ended December 31, 2018 primarily resulted from an increase in thediscount rates used to determine our benefit obligations for our pension plans from 3.58 percent in 2017 to4.25 percent in 2018.
The fair value of our plan assets as of December 31, 2019 was favorably impacted by the return on planassets resulting primarily from an improvement in equity market prices for the year. The fair value of ourplan assets as ofDecember 31, 2018was unfavorably impacted by the negative return on plan assets resultingprimarily from a significant decline in equity market prices for the year.
Amounts recognized in our balance sheet for our pension and other postretirement benefits plans include(in millions):
Pension PlansOther Postretirement
Benefit PlansDecember 31, December 31,
2019 2018 2019 2018Deferred charges and other assets, net $ 5 $ 2 $ — $ —Accrued expenses (17) (22) (20) (21)Other long-term liabilities (518) (383) (316) (271)
$ (530) $ (403) $ (336) $ (292)
The following table presents information for our pension plans with projected benefit obligations in excessof plan assets (in millions).
December 31,2019 2018
Projected benefit obligation $ 3,182 $ 2,564Fair value of plan assets 2,647 2,160
The following table presents information for our pension plans with accumulated benefit obligations inexcess of plan assets (in millions).
December 31,2019 2018
Accumulated benefit obligation $ 2,760 $ 2,253Fair value of plan assets 2,402 1,974
VALERO ENERGYCORPORATIONAANOTES TO CONSOLIDATEDAA FINANCIAL STATTT EMENTS (Continued)
103
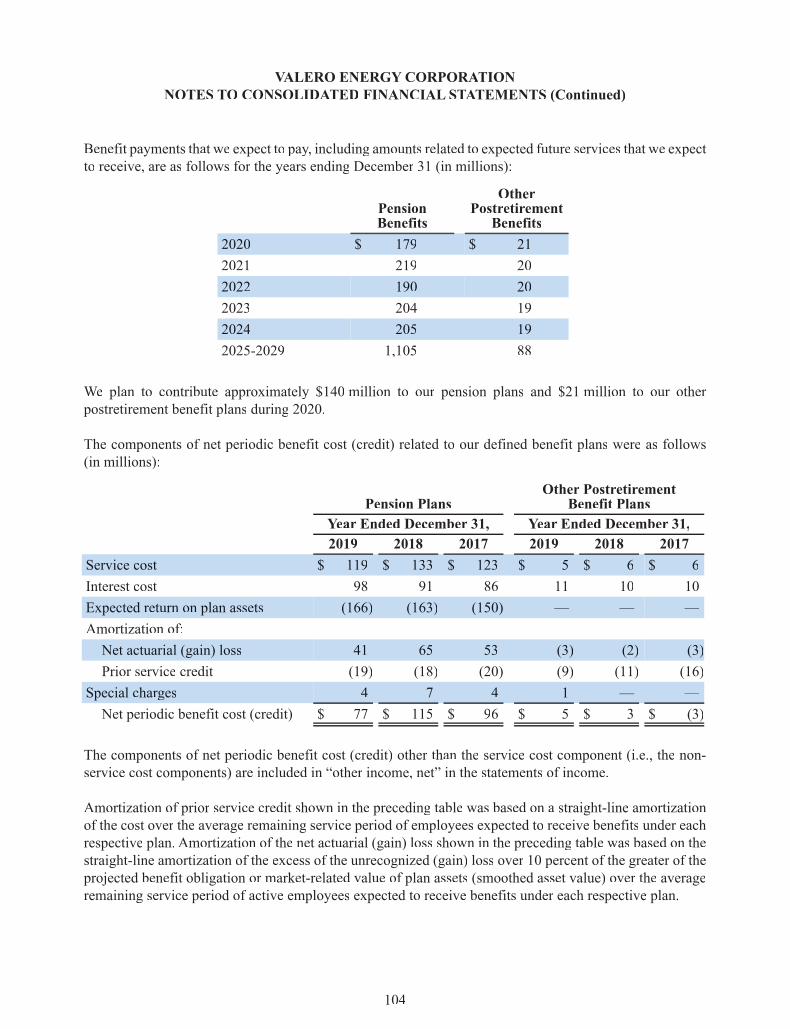
Benefit payments that we expect to pay,yy including amounts related to expected future services that we expectto receive, are as follows for the years ending December 31 (in millions):
PensionBenefits
OtherPostretirementBenefits
2020 $ 179 $ 212021 219 202022 190 202023 204 192024 205 192025-2029 1,105 88
We plan to contribute approximately $140 million to our pension plans and $21 million to our otherpostretirement benefit plans during 2020.
The components of net periodic benefit cost (credit) related to our defined benefit plans were as follows(in millions):
Pension PlansOther Postretirement
Benefit PlansYear Ended December 31, Year Ended December 31,2019 2018 2017 2019 2018 2017
Service cost $ 119 $ 133 $ 123 $ 5 $ 6 $ 6Interest cost 98 91 86 11 10 10Expected return on plan assets (166) (163) (150) — — —Amortization of:Net actuarial (gain) loss 41 65 53 (3) (2) (3)Prior service credit (19) (18) (20) (9) (11) (16)
Special charges 4 7 4 1 — —Net periodic benefit cost (credit) $ 77 $ 115 $ 96 $ 5 $ 3 $ (3)
The components of net periodic benefit cost (credit) other than the service cost component (i.e., the non-service cost components) are included in “other income, net” in the statements of income.
Amortization of prior service credit shown in the preceding table was based on a straight-line amortizationof the cost over the average remaining service period of employees expected to receive benefits under eachrespective plan. Amortization of the net actuarial (gain) loss shown in the preceding table was based on thestraight-line amortization of the excess of the unrecognized (gain) loss over 10 percent of the greater of theprojected benefit obligation or market-related value of plan assets (smoothed asset value) over the averageremaining service period of active employees expected to receive benefits under each respective plan.
VALERO ENERGYCORPORATIONAANOTES TO CONSOLIDATEDAA FINANCIAL STATTT EMENTS (Continued)
104
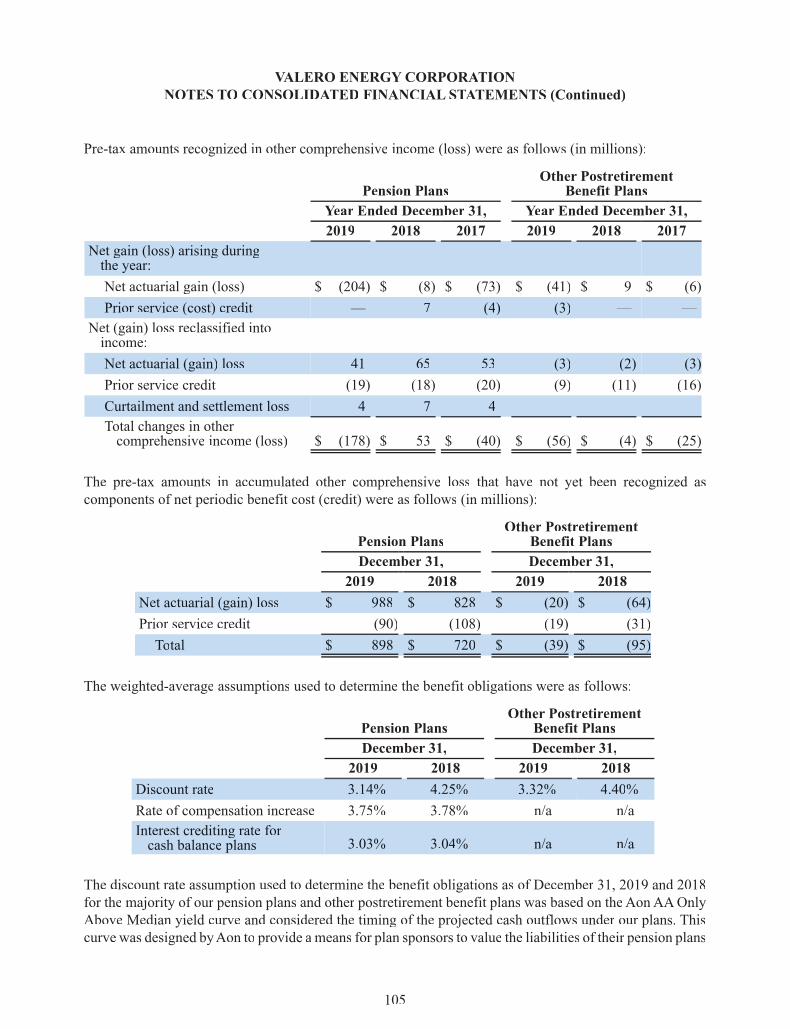
Pre-tax amounts recognized in other comprehensive income (loss) were as follows (in millions):
Pension PlansOther Postretirement
Benefit PlansYear Ended December 31, Year Ended December 31,2019 2018 2017 2019 2018 2017
Net gain (loss) arising duringthe year:Net actuarial gain (loss) $ (204) $ (8) $ (73) $ (41) $ 9 $ (6)Prior service (cost) credit — 7 (4) (3) — —
Net (gain) loss reclassified intoincome:Net actuarial (gain) loss 41 65 53 (3) (2) (3)Prior service credit (19) (18) (20) (9) (11) (16)Curtailment and settlement loss 4 7 4 — — —Total changes in othercomprehensive income (loss) $ (178) $ 53 $ (40) $ (56) $ (4) $ (25)
The pre-tax amounts in accumulated other comprehensive loss that have not yet been recognized ascomponents of net periodic benefit cost (credit) were as follows (in millions):
Pension PlansOther Postretirement
Benefit PlansDecember 31, December 31,
2019 2018 2019 2018Net actuarial (gain) loss $ 988 $ 828 $ (20) $ (64)Prior service credit (90) (108) (19) (31)Total $ 898 $ 720 $ (39) $ (95)
The weighted-average assumptions used to determine the benefit obligations were as follows:
Pension PlansOther Postretirement
Benefit PlansDecember 31, December 31,
2019 2018 2019 2018Discount rate 3.14% 4.25% 3.32% 4.40%Rate of compensation increase 3.75% 3.78% n/a n/aInterest crediting rate forcash balance plans 3.03% 3.04% n/a n/a
The discount rate assumption used to determine the benefit obligations as of December 31, 2019 and 2018for the majority of our pension plans and other postretirement benefit plans was based on the AonAAOnlyAbove Median yield curve and considered the timing of the projected cash outflows under our plans. Thiscurve was designed byAon to provide a means for plan sponsors to value the liabilities of their pension plans
VALERO ENERGYCORPORATIONAANOTES TO CONSOLIDATEDAA FINANCIAL STATTT EMENTS (Continued)
105
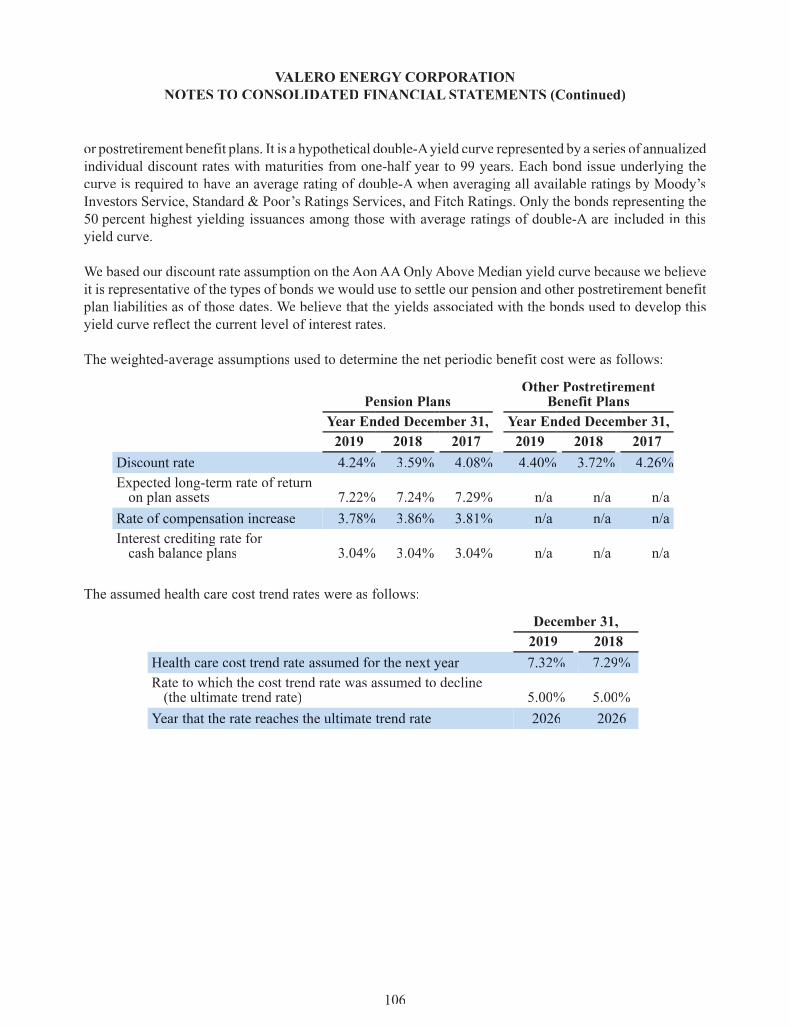
or postretirement benefit plans. It is a hypothetical double-Ayield curve represented by a series of annualizedindividual discount rates with maturities from one-half year to 99 years. Each bond issue underlying thecurve is required to have an average rating of double-A when averaging all available ratings by Moody’sInvestors Service, Standard & Poor’s Ratings Services, and Fitch Ratings. Only the bonds representing the50 percent highest yielding issuances among those with average ratings of double-A are included in thisyield curve.
We based our discount rate assumption on theAonAAOnlyAbove Median yield curve because we believeit is representative of the types of bonds we would use to settle our pension and other postretirement benefitplan liabilities as of those dates. We believe that the yields associated with the bonds used to develop thisyield curve reflect the current level of interest rates.
The weighted-average assumptions used to determine the net periodic benefit cost were as follows:
Pension PlansOther Postretirement
Benefit PlansYear Ended December 31, Year Ended December 31,2019 2018 2017 2019 2018 2017
Discount rate 4.24% 3.59% 4.08% 4.40% 3.72% 4.26%Expected long-term rate of returnon plan assets 7.22% 7.24% 7.29% n/a n/a n/a
Rate of compensation increase 3.78% 3.86% 3.81% n/a n/a n/aInterest crediting rate forcash balance plans 3.04% 3.04% 3.04% n/a n/a n/a
The assumed health care cost trend rates were as follows:
December 31,2019 2018
Health care cost trend rate assumed for the next year 7.32% 7.29%Rate to which the cost trend rate was assumed to decline(the ultimate trend rate) 5.00% 5.00%
Year that the rate reaches the ultimate trend rate 2026 2026
VALERO ENERGYCORPORATIONAANOTES TO CONSOLIDATEDAA FINANCIAL STATTT EMENTS (Continued)
106

The following tables present the fair values of the assets of our pension plans (in millions) as ofDecember 31,2019 and 2018 by level of the fair value hierarchy.Assets categorized inLevel 1 of the hierarchy aremeasuredat fair value using a market approach based on unadjusted quoted prices from national securities exchanges.Assets categorized in Level 2 of the hierarchy are measured at net asset value in a market that is not active.As previously noted, we do not fund or fully fund U.S. nonqualified and certain international pension plansthat are not subject to funding requirements, and we do not fund our other postretirement benefit plans.
Fair Value Hierarchy Total as ofDecember 31,
2019Level 1 Level 2 Level 3Equity securities:U.S. companies (a) $ 622 $ — $ — $ 622International companies 205 1 — 206Preferred stock 4 — — 4
Mutual funds:International growth 123 — — 123Index funds 90 — — 90
Corporate debt instruments (a) — 293 — 293Government securities:U.S. Treasury securities 53 — — 53Other government securities — 148 — 148
Common collective trusts (b) — 751 — 751Pooled separate accounts — 250 — 250Private funds — 104 — 104Insurance contract — 17 — 17Interest and dividends receivable 5 — — 5Cash and cash equivalents 59 — — 59Securities transactions payable, net (16) — — (16)Total pension plan assets $ 1,145 $ 1,564 $ — $ 2,709
_____________________________
See notes on page 108.
VALERO ENERGYCORPORATIONAANOTES TO CONSOLIDATEDAA FINANCIAL STATTT EMENTS (Continued)
107

Fair Value Hierarchy Total as ofDecember 31,
2018Level 1 Level 2 Level 3Equity securities:U.S. companies (a) $ 497 $ — $ — $ 497International companies 159 1 — 160Preferred stock 4 — — 4
Mutual funds:International growth 97 — — 97Index funds 76 — — 76
Corporate debt instruments (a) — 284 — 284Government securities:U.S. Treasury securities 45 — — 45Other government securities — 138 — 138
Common collective trusts (b) — 609 — 609Pooled separate accounts — 190 — 190Private funds — 87 — 87Insurance contract — 18 — 18Interest and dividends receivable 5 — — 5Cash and cash equivalents 40 — — 40Securities transactions payable, net (14) — — (14)Total pension plan assets $ 909 $ 1,327 $ — $ 2,236
____________________________________
(a) This class of securities is held in a wide range of industrial sectors.(b) This class includes primarily investments in approximately 75 percent equities and 25 percent bonds as of
December 31, 2019. As of December 31, 2018, this class included primarily investments in approximately70 percent equities and 30 percent bonds.
The investment policies and strategies for the assets of our pension plans incorporate a well-diversifiedapproach that is expected to earn long-term returns from capital appreciation and a growing stream of currentincome. This approach recognizes that assets are exposed to risk and the market value of the pension plans’assetsmay fluctuate fromyear to year. Risk tolerance is determined based on our financial ability towithstandrisk within the investment program and the willingness to accept return volatility. In line with the investmentreturn objective and risk parameters, the pension plans’mix of assets includes a diversified portfolio of equityand fixed-income investments. Equity securities include international stocks and a blend of U.S. growth andvalue stocks of various sizes of capitalization. Fixed income securities include bonds and notes issued bythe U.S. government and its agencies, corporate bonds, and mortgage-backed securities. The aggregate assetallocation is reviewed on an annual basis. As of December 31, 2019, the target allocations for plan assetsunder our primary pension plan are 70 percent equity securities and 30 percent fixed income investments.
The expected long-term rate of return on plan assets is based on a forward-looking expected asset returnmodel. This model derives an expected rate of return based on the target asset allocation of a plan’s assets.
VALERO ENERGYCORPORATIONAANOTES TO CONSOLIDATEDAA FINANCIAL STATTT EMENTS (Continued)
108

The underlying assumptions regarding expected rates of return for each asset class reflect Aon’s bestexpectations for these asset classes. The model reflects the positive effectff of periodic rebalancing amongdiversified asset classes. We select an expected asset return that is supported by this model.
Defined Contribution PlansWe have defined contribution plans that cover most of our employees. Our contributions to these plans arebased on employees’ compensation and/or a partial match of employee contributions to the plans. Ourcontributions to these defined contribution planswere $77 million, $74 million, and $70 million for the yearsended December 31, 2019, 2018, and 2017, respectively.
VALERO ENERGYCORPORATIONAANOTES TO CONSOLIDATEDAA FINANCIAL STATTT EMENTS (Continued)
109
14. STOCK-BASED COMPENSATIONAA
OverviewUnder our 2011 Omnibus Stock Incentive Plan (the OSIP), various stock and stock-based awards may begranted to employees and non-employee directors. Awards available under the OSIP include, but are notlimited to, (i) restricted stock that vests over a period determined by our compensation committee,(ii) performance awards that vest upon the achievement of an objective performance goal, (iii) options topurchase shares of common stock, (iv) dividend equivalent rights, and (v) stock unit awards. The OSIPwasapproved by our stockholders on April 28, 2011 and re-approved by our stockholders on May 12, 2016. Asof December 31, 2019, 7,740,665 shares of our common stock remained available to be awarded under theOSIP.PP
We also maintain another stock-based compensation plan under which previously granted equity awardsremain outstanding. No additional grants may be awarded under this plan.
The following table reflects activity related to our stock-based compensation arrangements (in millions):
Year Ended December 31,2019 2018 2017
Stock-based compensation expense:Restricted stock $ 64 $ 63 $ 58Performance awards 23 22 19Stock options and other awards 2 1 —Total stock-based compensation expense $ 89 $ 86 $ 77Tax benefit recognized on stock-based compensation expense $ 19 $ 18 $ 27Tax benefit realized for tax deductions resulting fromexercises and vestings 17 32 44
Effectff of tax deductions in excess of recognizedstock-based compensation expense 7 20 24
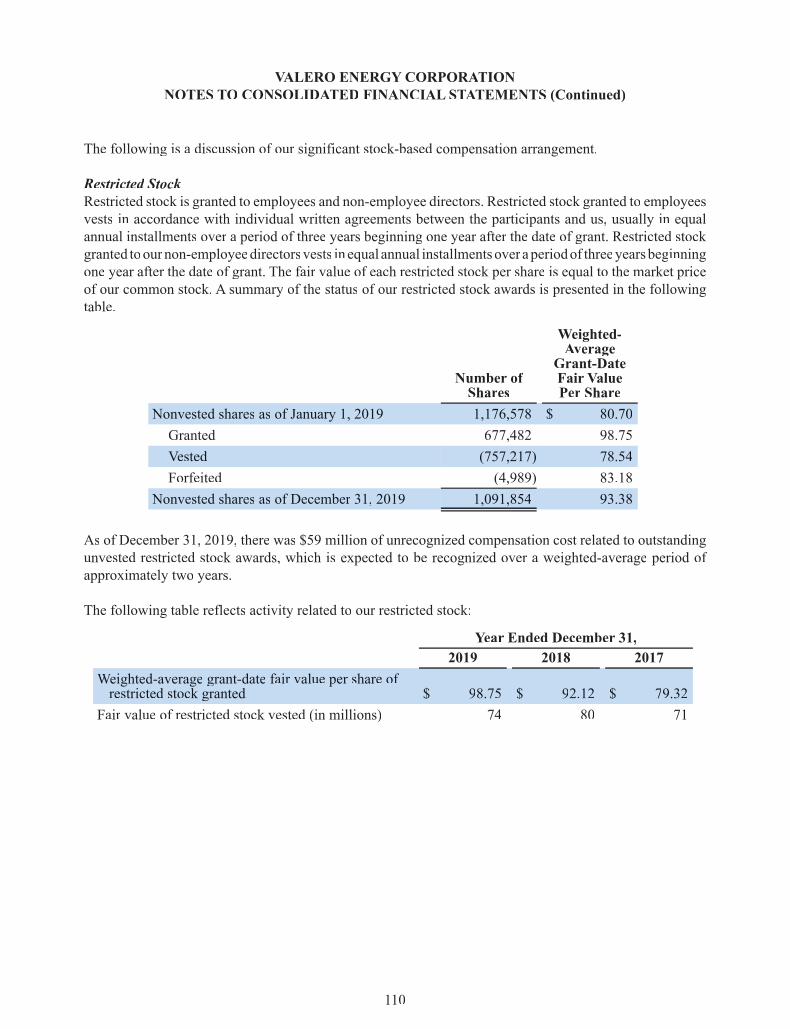
The following is a discussion of our significant stock-based compensation arrangement.
Restricted StockRestricted stock is granted to employees and non-employee directors. Restricted stock granted to employeesvests in accordance with individual written agreements between the participants and us, usually in equalannual installments over a period of three years beginning one year after the date of grant. Restricted stockgranted toournon-employeedirectorsvests in equal annual installmentsover aperiodof threeyearsbeginningone year after the date of grant. The fair value of each restricted stock per share is equal to the market priceof our common stock. A summary of the status of our restricted stock awards is presented in the followingtable.
Number ofShares
Weighted-AverageGrant-DateFair ValuePer Share
Nonvested shares as of January 1, 2019 1,176,578 $ 80.70Granted 677,482 98.75Vested (757,217) 78.54Forfeited (4,989) 83.18
Nonvested shares as of December 31, 2019 1,091,854 93.38
As of December 31, 2019, there was $59 million of unrecognized compensation cost related to outstandingunvested restricted stock awards, which is expected to be recognized over a weighted-average period ofapproximately two years.
The following table reflects activity related to our restricted stock:
Year Ended December 31,2019 2018 2017
Weighted-average grant-date fair value per share ofrestricted stock granted $ 98.75 $ 92.12 $ 79.32
Fair value of restricted stock vested (in millions) 74 80 71
VALERO ENERGYCORPORATIONAANOTES TO CONSOLIDATEDAA FINANCIAL STATTT EMENTS (Continued)
110

15. INCOME TAXES
Income Statement ComponentsIncome before income tax expense (benefit) was as follows (in millions):
Year Ended December 31,2019 2018 2017
U.S. operations $ 2,496 $ 3,168 $ 2,283International operations 990 1,064 924
Income before income tax expense (benefit) $ 3,486 $ 4,232 $ 3,207
Statutory income tax rates applicable to the countries in which we operate were as follows:
Year Ended December 31,2019 2018 2017
U.S. 21% 21% 35%Canada 15% 15% 15%U.K. 19% 19% 19%Ireland 13% 13% 13%Peru 30% 30% n/aMexico 30% 30% n/a
The following is a reconciliation of income tax expense (benefit) computed by applying statutory incometax rates as reflected in the preceding table to actual income tax expense (benefit) (in millions):
U.S. International TotalAmount Percent Amount Percent Amount Percent
Year ended December 31, 2019Income tax expense at statutory rates $ 524 21.0 % $ 147 14.8 % $ 671 19.2 %U.S. state and Canadian provincialtax expense, net of federalincome tax effectff 16 0.7 % 88 8.9 % 104 3.0 %
Permanent differencesff (36) (1.5)% 10 1.0 % (26) (0.7)%GILTILL tax (a) 115 4.6 % — — 115 3.3 %Foreign tax credits (95) (3.8)% — — (95) (2.7)%Repatriation withholding tax 45 1.8 % — — 45 1.3 %Tax effectsff of income associatedwith noncontrolling interests (77) (3.1)% 2 0.2 % (75) (2.2)%
Other, net (36) (1.4)% (1) (0.1)% (37) (1.1)%Income tax expense $ 456 18.3 % $ 246 24.8 % $ 702 20.1 %
____________________________
(a) See note on page 112.
VALERO ENERGYCORPORATIONAANOTES TO CONSOLIDATEDAA FINANCIAL STATTT EMENTS (Continued)
111

International TotalAmount Percent Amount Percent Amount Percent
Year ended December 31, 2018Income tax expense at statutory rates $ 665 21.0 % $ 163 15.3% $ 828 19.6 %U.S. state and Canadian provincialtax expense, net of federalincome tax effectff 44 1.4 % 80 7.5% 124 2.9 %
Permanent differencesff (9) (0.3)% — — (9) (0.2)%GILTILL tax (a) 67 2.1 % — — 67 1.6 %Foreign tax credits (50) (1.6)% — — (50) (1.2)%Effectsff of Tax Reform (a) (12) (0.4)% — — (12) (0.3)%Tax effectsff of income associatedwith noncontrolling interests (49) (1.5)% — — (49) (1.2)%
Other, net (23) (0.7)% 3 0.3% (20) (0.5)%Income tax expense $ 633 20.0 % $ 246 23.1% $ 879 20.7 %
Year ended December 31, 2017Income tax expense at statutory rates $ 799 35.0 % $ 158 17.1% $ 957 29.8 %U.S. state and Canadian provincialtax expense, net of federalincome tax effectff 37 1.6 % 46 5.0% 83 2.6 %
Permanent differences:ffManufacturing deduction (42) (1.8)% — — (42) (1.3)%Other (9) (0.4)% — — (9) (0.3)%Change in tax law (a) (1,862) (81.6)% — — (1,862) (58.1)%Tax effectsff of income associatedwith noncontrolling interests (31) (1.4)% — — (31) (1.0)%
Other, net (52) (2.3)% 7 0.8% (45) (1.4)%Income tax expense (benefit) $ (1,160) (50.9)% $ 211 22.9% $ (949) (29.7)%
____________________________
(a) See “TaxTT Reform” below for a discussion of the changes in tax law in the U.S. that were enacted in December2017.
VALERO ENERGYCORPORATIONAANOTES TO CONSOLIDATEDAA FINANCIAL STATTT EMENTS (Continued)
112
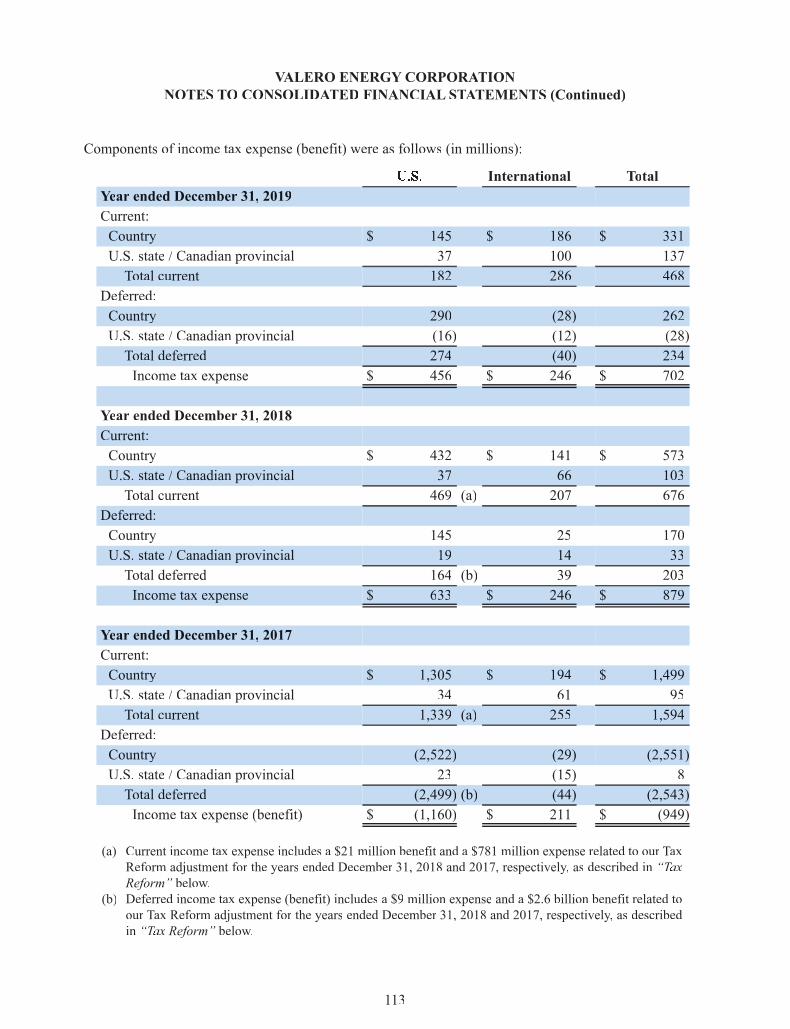
Components of income tax expense (benefit) were as follows (in millions):
International TotalYear ended December 31, 2019Current:Country $ 145 $ 186 $ 331U.S. state / Canadian provincial 37 100 137Total current 182 286 468
Deferred:Country 290 (28) 262U.S. state / Canadian provincial (16) (12) (28)Total deferred 274 (40) 234Income tax expense $ 456 $ 246 $ 702
Year ended December 31, 2018Current:Country $ 432 $ 141 $ 573U.S. state / Canadian provincial 37 66 103Total current 469 (a) 207 676
Deferred:Country 145 25 170U.S. state / Canadian provincial 19 14 33Total deferred 164 (b) 39 203Income tax expense $ 633 $ 246 $ 879
Year ended December 31, 2017Current:Country $ 1,305 $ 194 $ 1,499U.S. state / Canadian provincial 34 61 95Total current 1,339 (a) 255 1,594
Deferred:Country (2,522) (29) (2,551)U.S. state / Canadian provincial 23 (15) 8Total deferred (2,499) (b) (44) (2,543)Income tax expense (benefit) $ (1,160) $ 211 $ (949)
_____________________________
(a) Current income tax expense includes a $21 million benefit and a $781 million expense related to our TaxReform adjustment for the years ended December 31, 2018 and 2017, respectively,yy as described in “TaxTTReform” below.
(b) Deferred income tax expense (benefit) includes a $9 million expense and a $2.6 billion benefit related toour Tax Reform adjustment for the years ended December 31, 2018 and 2017, respectively,yy as describedin “TaxTT Reform” below.
VALERO ENERGYCORPORATIONAANOTES TO CONSOLIDATEDAA FINANCIAL STATTT EMENTS (Continued)
113

Income Taxesaa Paid (Refunded)Income taxes paid to (received from) U.S. and international taxing authorities were as follows (in millions):
Year Ended December 31,2019 2018 2017
U.S. $ (298) (a) $ 1,016 $ 239International 182 345 171
Income taxes paid (refunded), net $ (116) $ 1,361 $ 410____________________________
(a) This amount includes a refund of $348 million, including interest, that we received relatedto the settlement of the combined audit of our U.S. federal income tax returns for 2010 and2011. See “Taxaa Returns Under Audit – U.S. Federal” below.
Deferred Income Taxaa Assets and LiabilitiesThe tax effectsff of significant temporary differencesff representing deferred income tax assets and liabilitieswere as follows (in millions):
December 31,2019 2018
Deferred income tax assets:Tax credit carryforwards $ 683 $ 644Net operating losses (NOLs) 582 523Inventories 141 101Compensation and employee benefit liabilities 213 175Environmental liabilities 69 71Other 156 141Total deferred income tax assets 1,844 1,655
Valuation allowance (1,200) (1,111)Net deferred income tax assets 644 544
Deferred income tax liabilities:Property,yy plant, and equipment 4,924 4,589Deferred turnaround costs 331 316Inventories 217 287Investments 122 142Other 153 172Total deferred income tax liabilities 5,747 5,506
Net deferred income tax liabilities $ 5,103 $ 4,962
VALERO ENERGYCORPORATIONAANOTES TO CONSOLIDATEDAA FINANCIAL STATTT EMENTS (Continued)
114
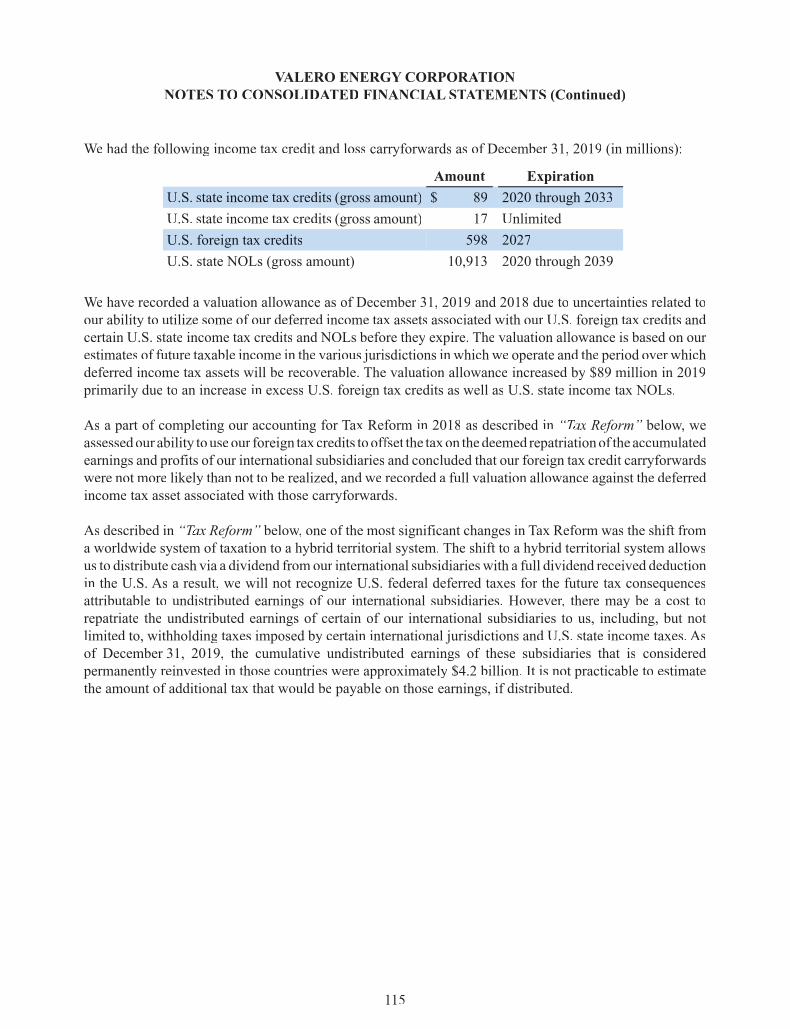
We had the following income tax credit and loss carryforwards as of December 31, 2019 (in millions):
Amount ExpirationU.S. state income tax credits (gross amount) $ 89 2020 h hthrough 2033U.S. state income tax credits (gross amount) 17 UnlimitedU.S. foreign tax credits 598 2027U.S. state NOLs (gross amount) 10,913 2020 through 2039
We have recorded a valuation allowance as of December 31, 2019 and 2018 due to uncertainties related toour ability to utilize some of our deferred income tax assets associated with our U.S. foreign tax credits andcertain U.S. state income tax credits and NOLs before they expire. The valuation allowance is based on ourestimates of future taxable income in the various jurisdictions in which we operate and the period over whichdeferred income tax assets will be recoverable. The valuation allowance increased by $89 million in 2019primarily due to an increase in excess U.S. foreign tax credits as well as U.S. state income tax NOLs.
As a part of completing our accounting for Tax Reform in 2018 as described in “TaxTT Reform” below,ww weassessedour ability touseour foreign taxcredits tooffsetff the taxon thedeemed repatriationof the accumulatedearnings and profits of our international subsidiaries and concluded that our foreign tax credit carryforwardswere not more likely than not to be realized, and we recorded a full valuation allowance against the deferredincome tax asset associated with those carryforwards.
As described in “TaxTT Reform” below,ww one of the most significant changes in Tax Reform was the shift froma worldwide system of taxation to a hybrid territorial system. The shift to a hybrid territorial system allowsus to distribute cash via a dividend from our international subsidiaries with a full dividend received deductionin the U.S. As a result, we will not recognize U.S. federal deferred taxes for the future tax consequencesattributable to undistributed earnings of our international subsidiaries. However, there may be a cost torepatriate the undistributed earnings of certain of our international subsidiaries to us, including, but notlimited to, withholding taxes imposed by certain international jurisdictions and U.S. state income taxes. Asof December 31, 2019, the cumulative undistributed earnings of these subsidiaries that is consideredpermanently reinvested in those countries were approximately $4.2 billion. It is not practicable to estimatethe amount of additional tax that would be payable on those earnings, if distributed.
VALERO ENERGYCORPORATIONAANOTES TO CONSOLIDATEDAA FINANCIAL STATTT EMENTS (Continued)
115
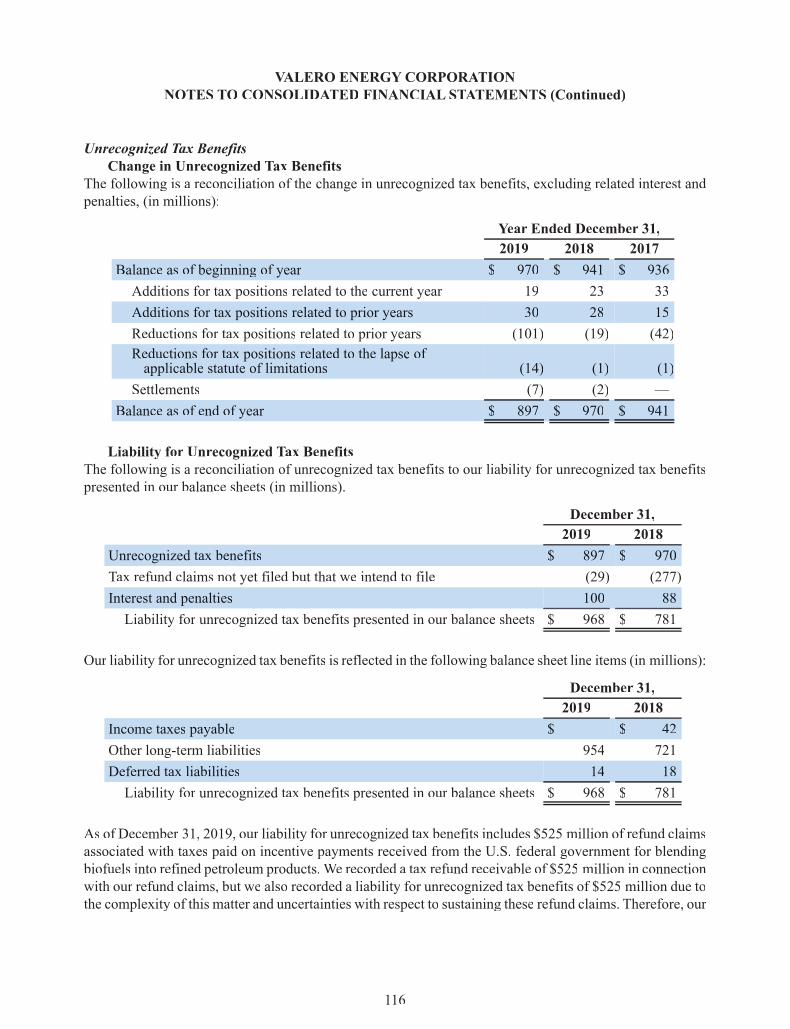
Unrecognized Taxaa BenefitsChange in Unrecognized Tax Benefits
The following is a reconciliation of the change in unrecognized tax benefits, excluding related interest andpenalties, (in millions):
Year Ended December 31,2019 2018 2017
Balance as of beginning of year $ 970 $ 941 $ 936Additions for tax positions related to the current year 19 23 33Additions for tax positions related to prior years 30 28 15Reductions for tax positions related to prior years (101) (19) (42)Reductions for tax positions related to the lapse ofapplicable statute of limitations (14) (1) (1)
Settlements (7) (2) —Balance as of end of year $ 897 $ 970 $ 941
Liability for Unrecognized Tax BenefitsThe following is a reconciliation of unrecognized tax benefits to our liability for unrecognized tax benefitspresented in our balance sheets (in millions).
December 31,2019 2018
Unrecognized tax benefits $ 897 $ 970Tax refund claims not yet filed but that we intend to file (29) (277)Interest and penalties 100 88Liability for unrecognized tax benefits presented in our balance sheets $ 968 $ 781
Our liability for unrecognized tax benefits is reflected in the following balance sheet line items (in millions):
December 31,2019 2018
Income taxes payable $ — $ 42Other long-term liabilities 954 721Deferred tax liabilities 14 18Liability for unrecognized tax benefits presented in our balance sheets $ 968 $ 781
As of December 31, 2019, our liability for unrecognized tax benefits includes $525 million of refund claimsassociated with taxes paid on incentive payments received from the U.S. federal government for blendingbiofuels into refined petroleum products.We recorded a tax refund receivable of $525 million in connectionwith our refund claims, but we also recorded a liability for unrecognized tax benefits of $525 million due tothe complexity of this matter and uncertainties with respect to sustaining these refund claims. Therefore, our
VALERO ENERGYCORPORATIONAANOTES TO CONSOLIDATEDAA FINANCIAL STATTT EMENTS (Continued)
116

financial position, results of operations, and liquidity will not be negatively impacted if we are unsuccessfulin sustaining these refund claims.
Other DisclosuresAs of December 31, 2019 and 2018, there was $762 million and $807 million, respectively,yy of unrecognizedtax benefits that if recognized would reduce our annual effectiveff tax rate.
Interest and penalties incurred during the years ended December 31, 2019, 2018, and 2017 was immaterial.
Although reasonably possible, we do not anticipate that any of our tax audits will be resolved in 2020 thatwould result in a reduction in our liability for unrecognized tax benefits due to the tax positions beingsustained or due to our agreement of their disallowance. Should any reductions occur, we do not expect theywould have a significant impact on our financial statements because such reductions would not significantlyaffectff our annual effectiveff tax rate.
Taxaa Returns Under AuditU.S. Federal
In 2019, we settled the combined audit related to our U.S. federal income tax returns for 2010 and 2011 andreceived a refund of $348 million, including interest. We did not have a significant change to our liabilityfor unrecognized tax benefits upon settlement of the audit.As ofDecember 31, 2019, ourU.S. federal incometax returns for 2012 through 2015 were under audit by the IRS. The IRS has proposed adjustments and weare working with the IRS to resolve these matters.We believe that these matters will be resolved for amountsconsistent with our liability for unrecognized tax benefits associated with these matters.
We have amended our U.S federal income tax returns for 2005 through 2011 to exclude from taxable incomeincentive payments received from the U.S. federal government for blending biofuels into refined petroleumproducts, and we have claimed $525 million in refunds. The 2005 through 2009 amended return refundclaims have been disallowed by the IRS and we are currently evaluating our options to contest thedisallowance of these adjustments. As noted above in the discussion of our liability for unrecognized taxbenefits, an ultimate disallowance of these refund claims would not negatively impact our financial position,results of operations, and liquidity.
U.S. StateAs of December 31, 2019, our California tax returns for 2004 through 2008 and 2011 through 2016 wereunder audit by the state of California. We do not expect the ultimate disposition of these audits will resultin a material change to our financial position, results of operations, or liquidity. We believe these audits willbe resolved for amounts consistent with the liability for unrecognized tax benefits associated with theseaudits.
InternationalAs of December 31, 2019, our Canadian subsidiary’s federal tax returns for 2013 through 2016 were underaudit by the Canada Revenue Agency (CRA) and our Quebec provincial tax returns for 2013 through 2016were under audit by Revenue Quebec.We are currently protesting the proposed adjustments by the CRA for2013 and 2014 and we do not expect the ultimate disposition of these adjustments will result in a materialchange to our financial position, results of operations, or liquidity.
VALERO ENERGYCORPORATIONAANOTES TO CONSOLIDATEDAA FINANCIAL STATTT EMENTS (Continued)
117
Taxaa ReformOn December 22, 2017, the Tax Cuts and Jobs Act of 2017 (TaxTT Reform) was enacted, which resulted insignificant changes to theCode andwas effectiveff beginning on January 1, 2018.Themost significant changesaffectingff us are as follows:
• reduction in the statutory income tax rate from 35 percent to 21 percent;
• assessment of a one-time transition tax on deemed repatriated earnings and profits from ourinternational subsidiaries;
• shift from a worldwide system of taxation to a hybrid territorial system of taxation, resulting in aminimum tax on the income of international subsidiaries (the GILTILL tax) rather than a tax deferralon such earnings in certain circumstances;
• deduction for all of the costs to acquire or construct certain business assets in the year they are placedin service through 2022; and
• repeal of the manufacturing deduction;
The following narrative describes the activity that occurred with respect to Tax Reform for the years endedDecember 31, 2017 and 2018.
We reflected an overall income tax benefit of $1.9 billion for the year ended December 31, 2017 with respectto Tax Reform as a result of the following:
• WeWW remeasured our U.S. deferred tax assets and liabilities using the 21 percent rate, which resultedin a tax benefit and a reduction to our net deferred tax liabilities of $2.6 billion.
• WeWW recognized a one-time transition tax of $734 million on the deemed repatriation of previouslyundistributed accumulated earnings and profits of our international subsidiaries based onapproximately $4.7 billion of the combined earnings and profits of our international subsidiariesthat had not been distributed to us. This transition taxwill be remitted to the Internal Revenue Service(IRS) over the eight-year period provided in the Code, with the first annual remittance paid in 2018.
• WeWW accrued withholding tax of $47 million on a portion of the earnings of one of our internationalsubsidiaries that we have deemed to not be permanently reinvested in our operations in that country.
Because of the significant and complex changes to the Code from Tax Reform, including the need forregulatory guidance from the IRS to properly account for many of the provisions, the SEC issued StaffffAccounting Bulletin No. 118, “Income Tax Accounting Implications of the Tax Cuts and Jobs Act,” whichrequired that the effectsff of Tax Reform be recorded for items where the accounting was complete, as wellas for itemswhere a reasonable estimate could bemade (referred to as provisional amounts). For itemswherereasonable estimates could not be made, provisional amounts were not recorded and those items continuedto be accounted for under the Code prior to changes from Tax Reform until a reasonable estimate could bemade.
VALERO ENERGYCORPORATIONAANOTES TO CONSOLIDATEDAA FINANCIAL STATTT EMENTS (Continued)
118

The following table summarizes the components of our adjustment (in millions) to reflect the effectsff of TaxReform for the years ended December 31, 2018 and 2017, including whether such amounts were complete,provisional, or incomplete. The amounts presented for 2018 were completed during the fourth quarter of2018.
Year Ended December 31,
CumulativeTax ReformAdjustment
2017 2018AccountingStatus Amount
AccountingStatus Amount
Income tax benefit from the remeasurement ofU.S. deferred income tax assets and liabilities Complete $ (2,643) Complete $ — $ (2,643)
Tax on the deemed repatriation of theaccumulated earnings and profits of ourinternational subsidiaries Provisional 734 Complete 6 740
Recognition of foreign withholding tax, net ofU.S. federal tax benefit Complete 47 Complete — 47
Deductibility of certain executive compensationexpense Incomplete — Complete 5 5
Income tax expense associated with the statutoryincome tax rate differentialff on accrual toreturn adjustments that were identified uponcompletion of our U.S. federal incometax return in 2018 Incomplete — Complete 9 9
Foreign tax credit available to offsetff the tax ondeemed repatriation of the accumulatedearnings and profits of our internationalsubsidiaries Incomplete — Complete (32) (32)
Tax Reform benefit $ (1,862) $ (12) $ (1,874)
VALERO ENERGYCORPORATIONAANOTES TO CONSOLIDATEDAA FINANCIAL STATTT EMENTS (Continued)
119

16. EARNINGS PER COMMON SHARE
Earnings per common share were computed as follows (dollars and shares in millions, except per shareamounts):
Year Ended December 31,2019 2018 2017
Earnings per common shareNet income attributable to Valero stockholders $ 2,422 $ 3,122 $ 4,065Less: Income allocated to participating securities 7 9 14Net income available to common shareholders $ 2,415 $ 3,113 $ 4,051
Weighted-average common shares outstanding 413 426 442
Earnings per common share $ 5.84 $ 7.30 $ 9.17
Earnings per common share – assuming dilutionNet income attributable to Valero stockholders $ 2,422 $ 3,122 $ 4,065
Weighted-average common shares outstanding 413 426 442Effectff of dilutive securities 1 2 2Weighted-average common shares outstanding –assuming dilution 414 428 444
Earnings per common share – assuming dilution $ 5.84 $ 7.29 $ 9.16
Participating securities include restricted stock and performance awards granted under our 2011 OmnibusStock Incentive Plan. Dilutive securities include participating securities as well as outstanding stock optionsgranted under our 2011 Omnibus Stock Incentive Plan.
VALERO ENERGYCORPORATIONAANOTES TO CONSOLIDATEDAA FINANCIAL STATTT EMENTS (Continued)
120
17. REVENUESAND SEGMENT INFORMATIONAA
Revenue from Contracts with CustomersDisaggregation of Revenue
Revenue is presented in the table below under “Segment Information” disaggregated by product becausethis is the level of disaggregation that management has determined to be beneficial to users of our financialstatements.
Receivables from Contracts with CustomersOur receivables from contracts with customers are included in “receivables, net” as presented in Note 3.
Contract Liabilities from Contracts with CustomersOur contract liabilities fromcontractswith customers are included in accrued expenses as presented inNote 8.Substantially all of the contract liabilities as of December 31, 2018 were recognized into revenue during theyear ended December 31, 2019.
Remaining Performance ObligationsWe have spot and term contracts with customers, the majority of which are spot contracts with no remainingperformance obligations.We do not disclose remaining performance obligations for contracts that have termsof one year or less. The transaction price for our remaining term contracts includes a fixed component andvariable consideration (i.e., a commodity price), both of which are allocated entirely to a wholly unsatisfiedpromise to transfer a distinct good that forms part of a single performance obligation. The fixed componentis not material and the variable consideration is highly uncertain. Therefore, as of December 31, 2019, wehave not disclosed the aggregate amount of the transaction price allocated to our remaining performanceobligations.
Segment InformationEffectiveff January 1, 2019, we revised our reportable segments to align with certain changes in how our chiefoperating decision maker manages and allocates resources to our business. Accordingly,yy we created a newreportable segment — renewable diesel — because of the growing importance of renewable fuels in themarket and the growth of our investments in renewable fuels production. The renewable diesel segmentincludes the operations of DGD, which were transferred from the refining segment on January 1, 2019.Alsoeffectiveff January 1, 2019, we no longer have a VLP segment, and we include the operations of VLP in ourrefining segment.This changewasmade because of theMergerTransactionwithVLP,PP as described inNote 2,and the resulting change in how we manage VLP’s operations. We no longer manage VLP as a business butas logistics assets that support the operations of our refining segment. Our prior period segment informationhas been retrospectively adjusted to reflect our current segment presentation.
We have three reportable segments — refining, ethanol, and renewable diesel. Each segment is a strategicbusiness unit that offersff differentff products and services by employing unique technologies and marketingstrategies andwhose operations and operating performance aremanaged and evaluated separately. Operatingperformance is measured based on the operating income generated by the segment, which includes revenuesand expenses that are directly attributable to the management of the respective segment. Intersegment salesare generally derived from transactions made at prevailing market rates. The following is a description ofeach segment’s business operations.
• The refininge segment includes the operations of our 15 petroleum refineries, the associatedmarketingactivities, and logistics assets that support our refining operations. The principal productsmanufactured by our refineries and sold by this segment include gasolines and blendstocks,distillates, and other products.
• The ethanol segment includes the operations of our 14 ethanol plants, the associated marketingactivities, and logistics assets that support our ethanol operations. The principal productsmanufactured by our ethanol plants are ethanol and distillers grains. This segment sells some ethanolto the refining segment for blending into gasoline, which is sold to that segment’s customers as afinished gasoline product.
VALERO ENERGYCORPORATIONAANOTES TO CONSOLIDATEDAA FINANCIAL STATTT EMENTS (Continued)
121

• The renewable diesel segment includes the operations of DGD, our consolidated joint venture asdiscussed in Note 12. The principal product manufactured by DGD and sold by this segment isrenewable diesel. This segment sells some renewable diesel to the refining segment, which is thensold to that segment’s customers.
Operations that are not included in any of the reportable segments are included in the corporate category.
The following tables reflect information about our operating income and total expenditures for long-livedassets by reportable segment (in millions):
Refining EthanolRenewableDiesel
Corporateand
Eliminations TotalYear ended December 31, 2019Revenues:Revenues from external customers $ 103,746 $ 3,606 $ 970 $ 2 $ 108,324Intersegment revenues 18 231 247 (496) —Total revenues 103,764 3,837 1,217 (494) 108,324
Cost of sales:Cost of materials and other 93,371 3,239 360 (494) 96,476Operating expenses (excluding depreciationand amortization expense reflected below) 4,289 504 75 — 4,868
Depreciation and amortization expense 2,062 90 50 — 2,202Total cost of sales 99,722 3,833 485 (494) 103,546
Other operating expenses 20 1 — — 21General and administrative expenses (excludingdepreciation and amortization expensereflected below) — — — 868 868
Depreciation and amortization expense — — — 53 53Operating income by segment $ 4,022 $ 3 $ 732 $ (921) $ 3,836Total expenditures for long-lived assets (a) $ 2,581 $ 47 $ 160 $ 58 $ 2,846____________________________
(a) See note on page 123.
VALERO ENERGYCORPORATIONAANOTES TO CONSOLIDATEDAA FINANCIAL STATTT EMENTS (Continued)
122

Refining EthanolRenewableDiesel
Corporateand
Eliminations TotalYear ended December 31, 2018Revenues:Revenues from external customers $ 113,093 $ 3,428 $ 508 $ 4 $ 117,033Intersegment revenues 25 210 170 (405) —Total revenues 113,118 3,638 678 (401) 117,033
Cost of sales:Cost of materials and other 101,866 3,008 262 (404) 104,732Operating expenses (excluding depreciationand amortization expense reflected below) 4,154 470 66 — 4,690
Depreciation and amortization expense 1,910 78 29 — 2,017Total cost of sales 107,930 3,556 357 (404) 111,439
Other operating expenses 45 — — — 45General and administrative expenses (excludingdepreciation and amortization expensereflected below) — — — 925 925
Depreciation and amortization expense — — — 52 52Operating income by segment $ 5,143 $ 82 $ 321 $ (974) $ 4,572Total expenditures for long-lived assets (a) $ 2,767 $ 373 $ 192 $ 44 $ 3,376
Year ended December 31, 2017Revenues:Revenues from external customers $ 90,258 $ 3,324 $ 393 $ 5 $ 93,980Intersegment revenues 8 176 241 (425) —Total revenues 90,266 3,500 634 (420) 93,980
Cost of sales:Cost of materials and other 80,160 2,804 498 (425) 83,037Operating expenses (excluding depreciationand amortization expense reflected below) 4,014 443 47 — 4,504
Depreciation and amortization expense 1,824 81 29 — 1,934Total cost of sales 85,998 3,328 574 (425) 89,475
Other operating expenses 61 — — — 61General and administrative expenses (excludingdepreciation and amortization expensereflected below) — — — 829 829
Depreciation and amortization expense — — — 52 52Operating income by segment $ 4,207 $ 172 $ 60 $ (876) $ 3,563Total expenditures for long-lived assets (a) $ 1,732 $ 84 $ 88 $ 44 $ 1,948____________________________
(a) Total expenditures for long-lived assets includes amounts related to capital expenditures; deferred turnaroundand catalyst costs; and property,yy plant, and equipment for acquisitions.
VALERO ENERGYCORPORATIONAANOTES TO CONSOLIDATEDAA FINANCIAL STATTT EMENTS (Continued)
123
The following table provides a disaggregation of revenues from external customers for our principal productsby reportable segment (in millions).
Year Ended December 31,2019 2018 2017
Refining:Gasolines and blendstocks $ 42,798 $ 46,596 $ 40,347Distillates 51,942 55,037 41,680Other product revenues 9,006 11,460 8,231Total refining revenues 103,746 113,093 90,258
Ethanol:Ethanol 2,889 2,713 2,764Distillers grains 717 715 560Total ethanol revenues 3,606 3,428 3,324
Renewable diesel:Renewable diesel 970 508 393
Corporate – other revenues 2 4 5Revenues $ 108,324 $ 117,033 $ 93,980
Revenues by geographic area are shown in the following table (in millions). The geographic area is basedon location of customer and no customer accounted for 10 percent or more of our revenues.
Year Ended December 31,2019 2018 2017
U.S. $ 77,173 $ 82,992 $ 66,614Canada 7,915 9,211 7,039U.K. and Ireland 13,584 15,208 11,556Other countries 9,652 9,622 8,771Revenues $ 108,324 $ 117,033 $ 93,980
Long-lived assets include property,yy plant, and equipment and certain long-lived assets included in “deferredcharges and other assets, net.” Long-lived assets by geographic area consisted of the following (in millions):
December 31,2019 2018
U.S. $ 27,485 $ 27,475Canada 1,886 1,798U.K. and Ireland 1,232 1,113Other countries 497 266Total long-lived assets $ 31,100 $ 30,652
VALERO ENERGYCORPORATIONAANOTES TO CONSOLIDATEDAA FINANCIAL STATTT EMENTS (Continued)
124
Total assets by reportable segment were as follows (in millions):
December 31,2019 2018
Refining $ 47,067 $ 43,488Ethanol 1,615 1,691Renewable diesel 1,412 787Corporate and eliminations 3,770 4,189Total assets $ 53,864 $ 50,155
As of December 31, 2019 and 2018, our investments in unconsolidated joint ventures accounted for underthe equity method were $942 million and $542 million, respectively,yy all of which related to the refiningsegment and are reflected in “deferred charges and other assets, net” as presented in Note 7.
VALERO ENERGYCORPORATIONAANOTES TO CONSOLIDATEDAA FINANCIAL STATTT EMENTS (Continued)
125
18. SUPPLEMENTALTT CASH FLOW INFORMATIONAA
In order to determine net cash provided by operating activities, net income is adjusted by,yy among other things,changes in current assets and current liabilities as follows (in millions):
Year Ended December 31,2019 2018 2017
Decrease (increase) in current assets:Receivables, net $ (1,468) $ (457) $ (870)Inventories (385) (197) (516)Prepaid expenses and other 427 (77) 151
Increase (decrease) in current liabilities:Accounts payable 1,534 304 1,842Accrued expenses (27) (113) 21Taxes other than income taxes payable 60 (73) 172Income taxes payable 153 (684) 489
Changes in current assets and current liabilities $ 294 $ (1,297) $ 1,289
Cash flows related to interest and income taxes were as follows (in millions):
Year Ended December 31,2019 2018 2017
Interest paid in excess of amount capitalized,including interest on finance leases $ 452 $ 463 $ 457
Income taxes paid (refunded), net (see Note 15) (116) 1,361 410

Supplemental cash flow information related to our operating and finance leases was as follows (in millions):
Year EndedDecember 31, 2019
OperatingLeases
FinanceLeases
Cash paid for amounts included in themeasurement of lease liabilities:Operating cash flows $ 441 $ 50Investing cash flows 1 —Financing cash flows — 34
Changes in lease balances resulting from newand modified leases (a) 1,756 239
___________________
(a) Includes noncash activity of $1.3 billion for operating lease ROU assets recorded onJanuary 1, 2019 upon adoption of Topic 842.
Noncash investing and financing activities for the year ended December 31, 2019 also included thederecognition of the property,yy plant, and equipment and the related long-term liability associated with abuild-to-suit lease arrangement with respect to the MVP Terminal, and the subsequent recognition of ourinvestment in MVP,PP which is the unconsolidated joint venture that owns the MVPTerminal, as described inNote 10.
Noncash investing and financing activities for the years ended December 31, 2018 and 2017 included therecognition of (i) finance lease assets and related obligations primarily for the lease of storage tanks and(ii) terminal assets and related obligations under owner accounting as described in Note 10.
VALERO ENERGYCORPORATIONAANOTES TO CONSOLIDATEDAA FINANCIAL STATTT EMENTS (Continued)
126

19. FAIR VALUE MEASUREMENTS
GeneralU.S. GAAP requires or permits certain assets and liabilities to be measured at fair value on a recurring ornonrecurringbasis in our balance sheets, and those assets and liabilities are presentedbelowunder“RecurringFair Value Measurements”rr and “Nonrecurringrr Fair Value Measurements.”rr Assets and liabilities measuredat fair value on a recurring basis, such as derivative financial instruments, are measured at fair value at theend of each reporting period. Assets and liabilities measured at fair value on a nonrecurring basis, such asthe impairment of property,yy plant and equipment, are measured at fair value in particular circumstances.
U.S. GAAP also requires the disclosure of the fair values of financial instruments when an option to electfair value accounting has been provided, but such election has not beenmade.Adebt obligation is an exampleof such a financial instrument. The disclosure of the fair values of financial instruments not recognized atfair value in our balance sheet is presented below under “Other Financial Instruments.”
U.S. GAAP provides a framework for measuring fair value and establishes a three-level fair value hierarchythat prioritizes inputs to valuation techniques based on the degree to which objective prices in external activemarkets are available to measure fair value. Following is a description of each of the levels of the fair valuehierarchy.
• Level 1 - Observable inputs, such as unadjusted quoted prices in active markets for identical assetsor liabilities.
• Level 2 - Inputs other than quoted prices included within Level 1 that are observable for the assetor liability,yy either directly or indirectly. These include quoted prices for similar assets or liabilitiesin active markets and quoted prices for identical or similar assets or liabilities in markets that arenot active.
• Level 3 - Unobservable inputs for the asset or liability. Unobservable inputs reflect our ownassumptions about what market participants would use to price the asset or liability. The inputs aredeveloped based on the best information available in the circumstances, which might includeoccasional market quotes or sales of similar instruments or our own financial data such as internallydeveloped pricing models, discounted cash flow methodologies, as well as instruments for whichthe fair value determination requires significant judgment.
VALERO ENERGYCORPORATIONAANOTES TO CONSOLIDATEDAA FINANCIAL STATTT EMENTS (Continued)
127

Recurring Fair Value MeasurementsThe following tables present information (in millions) about our assets and liabilities recognized at their fairvalues in our balance sheets categorized according to the fair value hierarchy of the inputs utilized by us todetermine the fair values as of December 31, 2019 and 2018.
We have elected to offsetff the fair value amounts recognized formultiple similar derivative contracts executedwith the same counterparty,yy including any related cash collateral assets or obligations as shown below;however, fair value amounts by hierarchy level are presented in the following tables on a gross basis. Wehave no derivative contracts that are subject to master netting arrangements that are reflected gross on thebalance sheet.
December 31, 2019
TotalGrossFairValue
Effect ofCounter-partyNetting
Effect ofCash
CollateralNetting
NetCarryingValue onBalanceSheet
CashCollateralPaid orReceivedNot Offset
Fair Value HierarchyLevel 1 Level 2 Level 3
AssetsCommodity derivativecontracts $ 617 $ — $ — $ 617 $ (612) $ — $ 5 $ —
Foreign currencycontracts 27 — — 27 n/a n/a 27 n/a
Investments of certainbenefit plans 65 — 9 74 n/a n/a 74 n/aTotal $ 709 $ — $ 9 $ 718 $ (612) $ — $ 106
LiabilitiesCommodity derivativecontracts $ 668 $ — $ — $ 668 $ (612) $ (56) $ — $ (84)
Environmental creditobligations — 2 — 2 n/a n/a 2 n/a
Physical purchasecontracts — 3 — 3 n/a n/a 3 n/a
Foreign currencycontracts 10 — — 10 n/a n/a 10 n/aTotal $ 678 $ 5 $ — $ 683 $ (612) $ (56) $ 15
VALERO ENERGYCORPORATIONAANOTES TO CONSOLIDATEDAA FINANCIAL STATTT EMENTS (Continued)
128
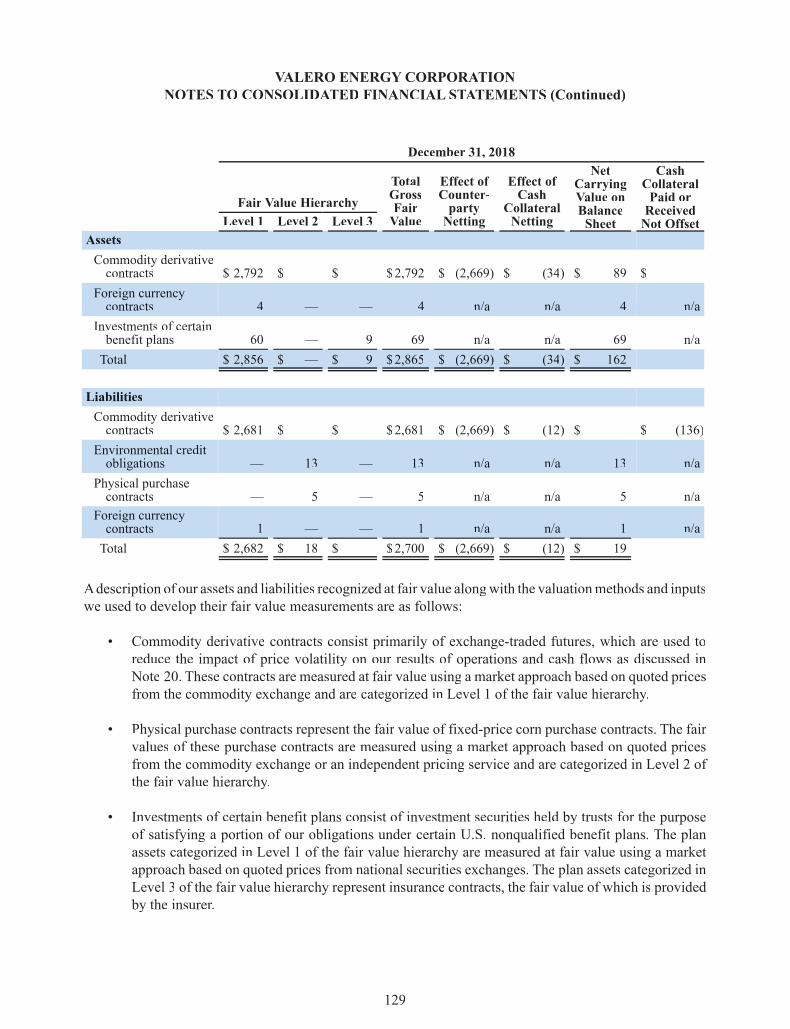
December 31, 2018
TotalGrossFairValue
Effect ofCounter-partyNetting
Effect ofCash
CollateralNetting
NetCarryingValue onBalanceSheet
CashCollateralPaid orReceivedNot Offset
Fair Value HierarchyLevel 1 Level 2 Level 3
AssetsCommodity derivativecontracts $ 2,792 $ — $ — $2,792 $ (2,669) $ (34) $ 89 $ —
Foreign currencycontracts 4 — — 4 n/a n/a 4 n/a
Investments of certainbenefit plans 60 — 9 69 n/a n/a 69 n/aTotal $ 2,856 $ — $ 9 $2,865 $ (2,669) $ (34) $ 162
LiabilitiesCommodity derivativecontracts $ 2,681 $ — $ — $2,681 $ (2,669) $ (12) $ — $ (136)
Environmental creditobligations — 13 — 13 n/a n/a 13 n/a
Physical purchasecontracts — 5 — 5 n/a n/a 5 n/a
Foreign currencycontracts 1 — — 1 n/a n/a 1 n/aTotal $ 2,682 $ 18 $ — $2,700 $ (2,669) $ (12) $ 19
Adescription of our assets and liabilities recognized at fair value alongwith the valuationmethods and inputswe used to develop their fair value measurements are as follows:
• Commodity derivative contracts consist primarily of exchange-traded futures, which are used toreduce the impact of price volatility on our results of operations and cash flows as discussed inNote 20. These contracts are measured at fair value using a market approach based on quoted pricesfrom the commodity exchange and are categorized in Level 1 of the fair value hierarchy.
• Physical purchase contracts represent the fair value of fixed-price corn purchase contracts. The fairvalues of these purchase contracts are measured using a market approach based on quoted pricesfrom the commodity exchange or an independent pricing service and are categorized in Level 2 ofthe fair value hierarchy.
• Investments of certain benefit plans consist of investment securities held by trusts for the purposeof satisfying a portion of our obligations under certain U.S. nonqualified benefit plans. The planassets categorized in Level 1 of the fair value hierarchy are measured at fair value using a marketapproach based on quoted prices from national securities exchanges. The plan assets categorized inLevel 3 of the fair value hierarchy represent insurance contracts, the fair value of which is providedby the insurer.
VALERO ENERGYCORPORATIONAANOTES TO CONSOLIDATEDAA FINANCIAL STATTT EMENTS (Continued)
129

• Foreign currency contracts consist of foreign currency exchange and purchase contracts and foreigncurrency swapagreements related toour international operations tomanageour exposure to exchangerate fluctuations on transactions denominated in currencies other than the local (functional)currencies of our operations. These contracts are valued based on quoted foreign currency exchangerates and are categorized in Level 1 of the fair value hierarchy.
• Environmental credit obligations represent our liability for the purchase of (i) biofuel credits(primarily RINs in the U.S.) needed to satisfy our obligation to blend biofuels into the products weproduce and (ii) emission credits under theCalifornia Global Warming Solutions Act (the Californiacap-and-trade system, also known asAB 32) and similar programs, (collectively,yy the cap-and-tradesystems). To the degreewe are unable to blend biofuels (such as ethanol and biodiesel) at percentagesrequiredunder thebiofuelprograms,wemustpurchasebiofuel credits tocomplywith theseprograms.Under the cap-and-trade systems, we must purchase emission credits to comply with these systems.These programs are described in Note 20 under “Environmental Compliance Program Price Risk.”The liability for environmental credits is based on our deficit for such credits as of the balance sheetdate, if any,yy after considering any credits acquired or under contract, and is equal to the product ofthe credits deficit and themarket price of these credits as of the balance sheet date.The environmentalcredit obligations are categorized in Level 2 of the fair value hierarchy and aremeasured at fair valueusing the market approach based on quoted prices from an independent pricing service.
There were no transfers into or out of Level 3 for assets and liabilities held as of December 31, 2019 and2018 that were measured at fair value on a recurring basis.
There was no significant activity during the years ended December 31, 2019, 2018, and 2017 related to thefair value amounts categorized in Level 3 as of December 31, 2019 and 2018.
Nonrecurring Fair Value MeasurementsTherewere no assets or liabilities that weremeasured at fair value on a nonrecurring basis as ofDecember 31,2019 and 2018.
Other Financial InstrumentsFinancial instruments that we recognize in our balance sheets at their carrying amounts are shown in thefollowing table along with their associated fair values (in millions):
December 31, 2019 December 31, 2018Fair ValueHierarchy
CarryingAmount
FairValue
CarryingAmount
FairValue
Financial assetsCash and cash equivalents Level 1 $ 2,583 $ 2,583 $ 2,982 $ 2,982Financial liabilitiesDebt (excluding finance leases) Level 2 8,881 10,583 8,503 8,986
VALERO ENERGYCORPORATIONAANOTES TO CONSOLIDATEDAA FINANCIAL STATTT EMENTS (Continued)
130

20. PRICE RISK MANAGEMENTACTIVITIES
Weare exposed tomarket risks primarily related to the volatility in the price of commodities, foreign currencyexchange rates, and the price of credits needed to comply with various government and regulatory programs.We enter into derivative instruments to manage some of these risks, including derivative instruments relatedto the various commodities we purchase or produce, and foreign currency exchange and purchase contracts,as described below under “Risk Management Activities by Typeyy of Risk.” These derivative instruments arerecorded as either assets or liabilities measured at their fair values (see Note 19), as summarized below under“Fair Values of Derivative Instruments.” The effectff of these derivative instruments on our income issummarized below under “Effect of Derivative Instruments on Income.”
Risk Management Activities by Typeyy of RiskCommodity Price Risk
We are exposed to market risks related to the volatility in the price of crude oil, refined petroleum products(primarily gasoline and distillate), renewable diesel, grain (primarily corn), renewable diesel feedstocks, andnatural gas used in our operations. To reduce the impact of price volatility on our results of operations andcash flows, we use commodity derivative instruments, such as futures and options. Our positions incommodity derivative instruments are monitored and managed on a daily basis by our risk control group toensure compliance with our stated risk management policy that has been approved by our board of directors.
Weprimarilyusecommodityderivative instruments as cash flowhedgesandeconomichedges.Ourobjectivesfor entering into each type of hedge is described below.
• CashCC flow hedges – The objective of our cash flow hedges is to lock in the price offorecasted (i) feedstock, refined petroleum product, or natural gas purchases, or (ii) refinedpetroleum product or renewable diesel sales at existing market prices that we deem favorable.
• Economic hedges – Our objectives for holding economic hedges are to (i) manage price volatilityin certain feedstock and refined petroleum product inventories and fixed-price purchase contracts,and (ii) lock in the price of forecasted feedstock, refined petroleum product, or natural gas purchasesor refined petroleum product or renewable diesel sales at existing market prices that we deemfavorable.
VALERO ENERGYCORPORATIONAANOTES TO CONSOLIDATEDAA FINANCIAL STATTT EMENTS (Continued)
131
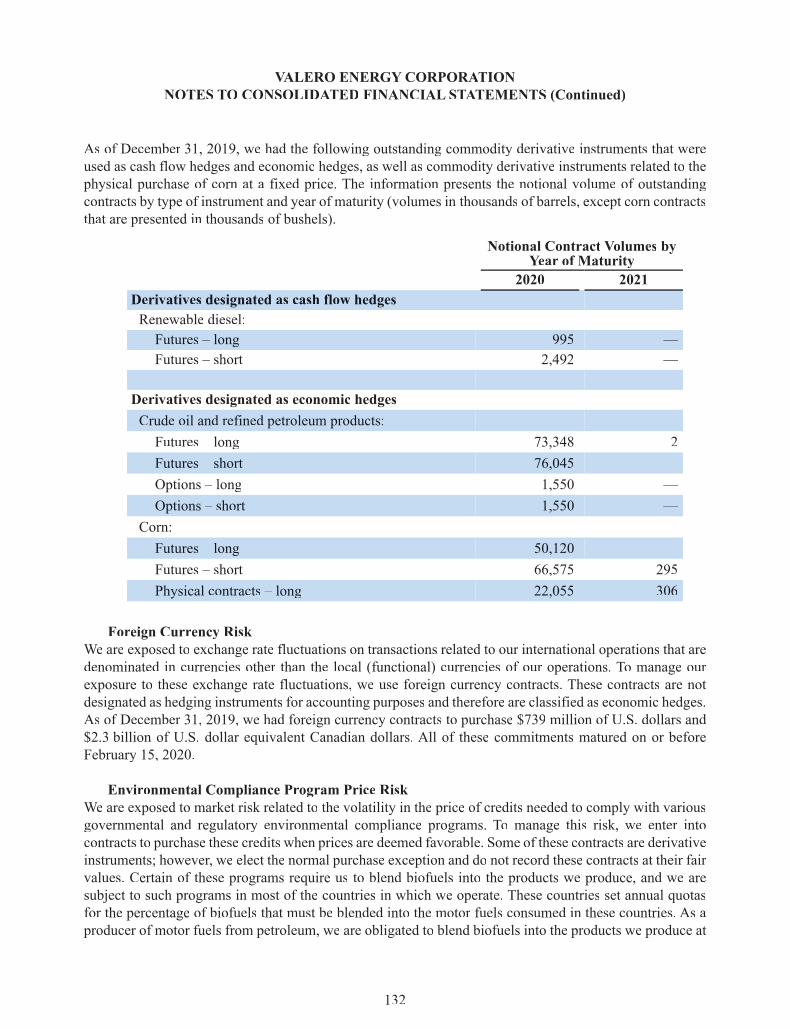
As of December 31, 2019, we had the following outstanding commodity derivative instruments that wereused as cash flow hedges and economic hedges, as well as commodity derivative instruments related to thephysical purchase of corn at a fixed price. The information presents the notional volume of outstandingcontracts by type of instrument and year of maturity (volumes in thousands of barrels, except corn contractsthat are presented in thousands of bushels).
Notional Contract Volumes byYear of Maturity
2020 2021Derivatives designated as cash flow hedgesRenewable diesel:Futures – long 995 —Futures – short 2,492 —
Derivatives designated as economic hedgesCrude oil and refined petroleum products:Futures – long 73,348 2Futures – short 76,045 —Options – long 1,550 —Options – short 1,550 —
Corn:Futures – long 50,120 —Futures – short 66,575 295Physical contracts – long 22,055 306
Foreign Currency RiskWe are exposed to exchange rate fluctuations on transactions related to our international operations that aredenominated in currencies other than the local (functional) currencies of our operations. To manage ourexposure to these exchange rate fluctuations, we use foreign currency contracts. These contracts are notdesignated as hedging instruments for accounting purposes and therefore are classified as economic hedges.As of December 31, 2019, we had foreign currency contracts to purchase $739 million of U.S. dollars and$2.3 billion of U.S. dollar equivalent Canadian dollars. All of these commitments matured on or beforeFebruary 15, 2020.
Environmental Compliance Program Price RiskWe are exposed to market risk related to the volatility in the price of credits needed to comply with variousgovernmental and regulatory environmental compliance programs. To manage this risk, we enter intocontracts to purchase these credits when prices are deemed favorable. Some of these contracts are derivativeinstruments; however, we elect the normal purchase exception and do not record these contracts at their fairvalues. Certain of these programs require us to blend biofuels into the products we produce, and we aresubject to such programs in most of the countries in which we operate. These countries set annual quotasfor the percentage of biofuels that must be blended into the motor fuels consumed in these countries. As aproducer of motor fuels from petroleum, we are obligated to blend biofuels into the products we produce at
VALERO ENERGYCORPORATIONAANOTES TO CONSOLIDATEDAA FINANCIAL STATTT EMENTS (Continued)
132

a rate that is at least equal to the applicable quota. To the degree we are unable to blend at the applicablerate, we must purchase biofuel credits (primarily RINs in the U.S.). We are exposed to the volatility in themarket price of these credits, and we manage that risk by purchasing biofuel credits when prices are deemedfavorable. For the years ended December 31, 2019, 2018, and 2017, the cost of meeting our obligationsunder these compliance programs was $318 million, $536 million, and $942 million, respectively. Theseamounts are reflected in cost of materials and other.
We are subject to additional requirements under GHG emission programs, including the cap-and-tradesystems, as discussed in Note 19. Under these cap-and-trade systems, we purchase various GHG emissioncredits available on the open market. Therefore, we are exposed to the volatility in the market price of thesecredits. The cost to implement certain provisions of the cap-and-trade systems are significant; however, werecovered the majority of these costs from our customers for the years ended December 31, 2019, 2018, and2017 and expect to continue to recover the majority of these costs in the future. For the years endedDecember 31, 2019, 2018, and2017, the net cost ofmeetingour obligations under these compliance programswas immaterial.
Fair Values of Derivative InstrumentsThe following tables provide information about the fair values of our derivative instruments as ofDecember 31, 2019 and 2018 (in millions) and the line items in the balance sheets in which the fair valuesare reflected. See Note 19 for additional information related to the fair values of our derivative instruments.
As indicated in Note 19, we net fair value amounts recognized for multiple similar derivative contractsexecuted with the same counterparty under master netting arrangements, including cash collateral assets andobligations. The following tables, however, are presented on a gross asset and gross liability basis, whichresults in the reflection of certain assets in liability accounts and certain liabilities in asset accounts.
Balance SheetLocation
December 31, 2019 December 31, 2018Asset
DerivativesLiabilityDerivatives
AssetDerivatives
LiabilityDerivatives
Derivatives designatedas hedging instrumentsCommodity contracts Receivables, net $ 9 $ 20 $ — $ —
Derivatives not designatedas hedging instrumentsCommodity contracts Receivables, net $ 608 $ 648 $ 2,792 $ 2,681Physical purchase contracts Inventories — 3 — 5Foreign currency contracts Receivables, net 27 — 4 —Foreign currency contracts Accrued expenses — 10 — 1Total $ 635 $ 661 $ 2,796 $ 2,687
Market RiskOur price risk management activities involve the receipt or payment of fixed price commitments into thefuture. These transactions give rise to market risk, which is the risk that future changes in market conditions
VALERO ENERGYCORPORATIONAANOTES TO CONSOLIDATEDAA FINANCIAL STATTT EMENTS (Continued)
133

may make an instrument less valuable. We closely monitor and manage our exposure to market risk on adaily basis in accordance with policies approved by our board of directors. Market risks are monitored byour risk control group to ensure compliance with our stated risk management policy. We do not require anycollateral or other security to support derivative instruments into which we enter. We also do not have anyderivative instruments that require us to maintain a minimum investment-grade credit rating.
Effectff of Derivative Instruments on IncomeThe following table provides information about the gain (loss) recognized in income on our derivativeinstruments and the line items in the statements of income in which such gains (losses) are reflected(in millions).
Derivatives Not Designatedas Hedging Instruments
Location of Gain (Loss)Recognized in Income
on DerivativesYear Ended December 31,2019 2018 2017
Commodity contracts Revenues $ 5 $ — $ —Commodity contracts Cost of materials and other (68) (165) (278)
Commodity contracts
Operating expenses(excluding depreciation andamortization expense) — 7 —
Foreign currency contracts Cost of materials and other (21) 56 (40)Foreign currency contracts Other income, net 75 (43) —
VALERO ENERGYCORPORATIONAANOTES TO CONSOLIDATEDAA FINANCIAL STATTT EMENTS (Continued)
134
21. CONDENSED CONSOLIDATINGAA FINANCIAL STATTT EMENTS
In connection with the completion of the Merger Transaction as described in Note 2, Valero EnergyCorporation, the parent company,yy entered into a guarantee agreement to fully and unconditionally guaranteethe prompt payment, when due, of the following debt issued byValero Energy Partners LP,PP an indirect whollyowned subsidiary of Valero Energy Corporation, that was outstanding as of December 31, 2019:
• 4.375 percent Senior Notes due December 15, 2026, and
• 4.5 percent Senior Notes due March 15, 2028.
The following condensed consolidating financial information is provided as an alternative to providingseparate financial statements for Valero Energy Partners LP,PP which has no independent assets or operations.The financial position, results of operations, and cash flows of Valero Energy Partners LP’s wholly ownedsubsidiaries are included in “Other Non-Guarantor Subsidiaries.” The accounts for all companies reflectedherein are presented using the equity method of accounting for investments in subsidiaries.
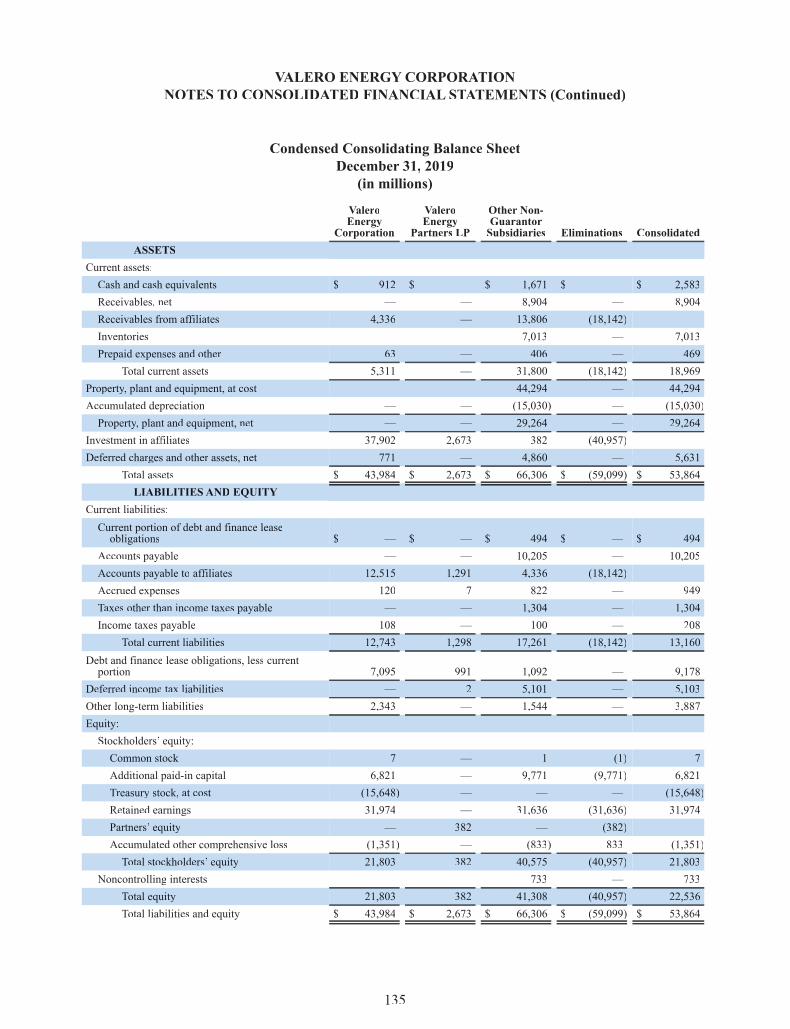
Condensed Consolidating Balance SheetDecember 31, 2019(in millions)
ValeroEnergy
Corporation
ValeroEnergy
Partners LP
Other Non-GuarantorSubsidiaries Eliminations Consolidated
ASSETSCurrent assets:Cash and cash equivalents $ 912 $ — $ 1,671 $ — $ 2,583Receivables, net — — 8,904 — 8,904Receivables from affiliatesff 4,336 — 13,806 (18,142) —Inventories — — 7,013 — 7,013Prepaid expenses and other 63 — 406 — 469
Total current assets 5,311 — 31,800 (18,142) 18,969Property,yy plant and equipment, at cost — — 44,294 — 44,294Accumulated depreciation — — (15,030) — (15,030)Property,yy plant and equipment, net — — 29,264 — 29,264
Investment in affiliatesff 37,902 2,673 382 (40,957) —Deferred charges and other assets, net 771 — 4,860 — 5,631
Total assets $ 43,984 $ 2,673 $ 66,306 $ (59,099) $ 53,864LIABILITIES AND EQUITY
Current liabilities:Current portion of debt and finance leaseobligations $ — $ — $ 494 $ — $ 494
Accounts payable — — 10,205 — 10,205Accounts payable to affiliatesff 12,515 1,291 4,336 (18,142) —Accrued expenses 120 7 822 — 949Taxes other than income taxes payable — — 1,304 — 1,304Income taxes payable 108 — 100 — 208
Total current liabilities 12,743 1,298 17,261 (18,142) 13,160Debt and finance lease obligations, less currentportion 7,095 991 1,092 — 9,178
Deferred income tax liabilities — 2 5,101 — 5,103Other long-term liabilities 2,343 — 1,544 — 3,887Equity:Stockholders’ equity:Common stock 7 — 1 (1) 7Additional paid-in capital 6,821 — 9,771 (9,771) 6,821Treasury stock, at cost (15,648) — — — (15,648)Retained earnings 31,974 — 31,636 (31,636) 31,974Partners’ equity — 382 — (382) —Accumulated other comprehensive loss (1,351) — (833) 833 (1,351)Total stockholders’ equity 21,803 382 40,575 (40,957) 21,803
Noncontrolling interests — — 733 — 733Total equity 21,803 382 41,308 (40,957) 22,536Total liabilities and equity $ 43,984 $ 2,673 $ 66,306 $ (59,099) $ 53,864
VALERO ENERGYCORPORATIONAANOTES TO CONSOLIDATEDAA FINANCIAL STATTT EMENTS (Continued)
135

Condensed Consolidating Balance SheetDecember 31, 2018(in millions)
ValeroEnergy
Corporation
ValeroEnergy
Partners LP
Other Non-GuarantorSubsidiaries Eliminations Consolidated
ASSETSCurrent assets:Cash and cash equivalents $ 291 $ 152 $ 2,539 $ — $ 2,982Receivables, net — — 7,345 — 7,345Receivables from affiliatesff 4,369 2 10,684 (15,055) —Inventories — — 6,532 — 6,532Prepaid expenses and other 466 — 355 (5) 816
Total current assets 5,126 154 27,455 (15,060) 17,675Property,yy plant and equipment, at cost — — 42,473 — 42,473Accumulated depreciation — — (13,625) — (13,625)Property,yy plant and equipment, net — — 28,848 — 28,848
Investment in affiliatesff 34,696 2,267 (321) (36,642) —Long-term notes receivable from affiliatesff 285 — — (285) —Deferred charges and other assets, net 572 1 3,059 — 3,632
Total assets $ 40,679 $ 2,422 $ 59,041 $ (51,987) $ 50,155LIABILITIES AND EQUITY
Current liabilities:Current portion of debt and finance lease obligations $ — $ — $ 238 $ — $ 238Accounts payable 14 — 8,580 — 8,594Accounts payable to affiliatesff 9,847 837 4,370 (15,054) —Accrued expenses 155 7 468 — 630Accrued expenses to affiliatesff — 1 — (1) —Taxes other than income taxes payable — — 1,213 — 1,213Income taxes payable 53 1 — (5) 49
Total current liabilities 10,069 846 14,869 (15,060) 10,724Debt and finance lease obligations, less current portion 6,955 990 926 — 8,871Long-term notes payable to affiliatesff — 285 — (285) —Deferred income tax liabilities — 2 4,960 — 4,962Other long-term liabilities 1,988 — 879 — 2,867Equity:Stockholders’ equity:Common stock 7 — 1 (1) 7Additional paid-in capital 7,048 — 9,754 (9,754) 7,048Treasury stock, at cost (14,925) — — — (14,925)Retained earnings 31,044 — 28,305 (28,305) 31,044Partners’ equity — 299 — (299) —Accumulated other comprehensive loss (1,507) — (1,097) 1,097 (1,507)Total stockholders’ equity 21,667 299 36,963 (37,262) 21,667
Noncontrolling interests — — 444 620 1,064Total equity 21,667 299 37,407 (36,642) 22,731Total liabilities and equity $ 40,679 $ 2,422 $ 59,041 $ (51,987) $ 50,155
VALERO ENERGYCORPORATIONAANOTES TO CONSOLIDATEDAA FINANCIAL STATTT EMENTS (Continued)
136
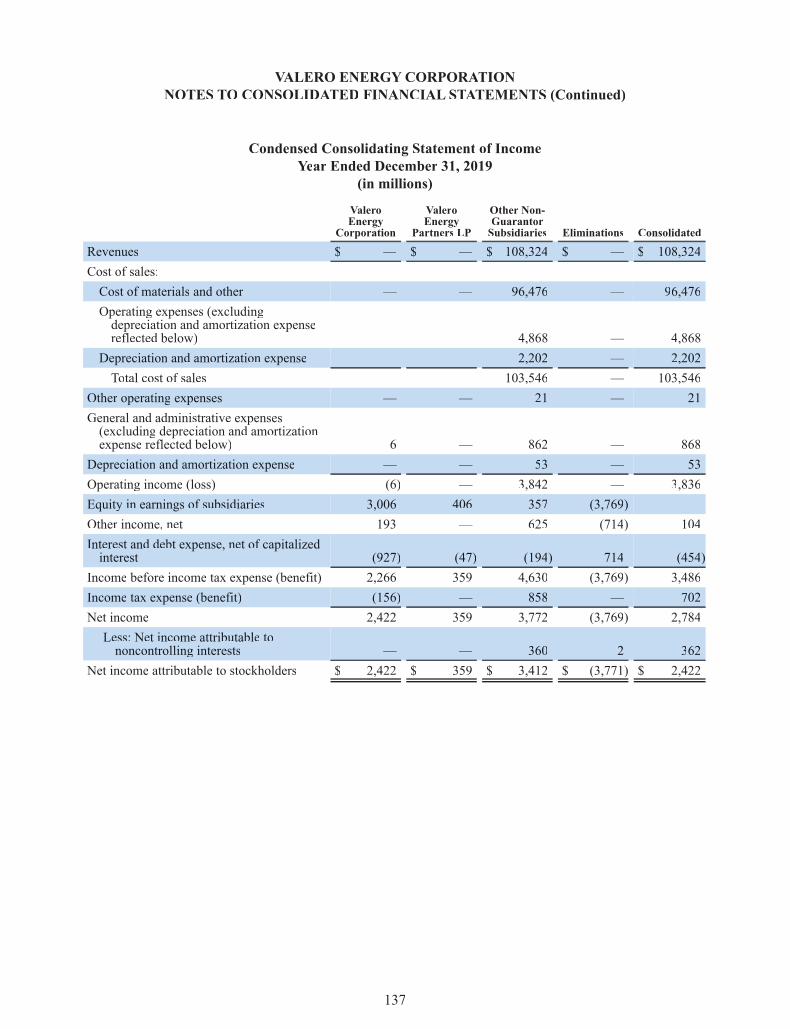
Condensed Consolidating Statement of IncomeYear Ended December 31, 2019
(in millions)
ValeroEnergy
Corporation
ValeroEnergy
Partners LP
Other Non-GuarantorSubsidiaries Eliminations Consolidated
Revenues $ — $ — $ 108,324 $ — $ 108,324Cost of sales:Cost of materials and other — — 96,476 — 96,476Operating expenses (excludingdepreciation and amortization expensereflected below) — — 4,868 — 4,868
Depreciation and amortization expense — — 2,202 — 2,202Total cost of sales — — 103,546 — 103,546
Other operating expenses — — 21 — 21General and administrative expenses(excluding depreciation and amortizationexpense reflected below) 6 — 862 — 868
Depreciation and amortization expense — — 53 — 53Operating income (loss) (6) — 3,842 — 3,836Equity in earnings of subsidiaries 3,006 406 357 (3,769) —Other income, net 193 — 625 (714) 104Interest and debt expense, net of capitalizedinterest (927) (47) (194) 714 (454)
Income before income tax expense (benefit) 2,266 359 4,630 (3,769) 3,486Income tax expense (benefit) (156) — 858 — 702Net income 2,422 359 3,772 (3,769) 2,784Less: Net income attributable tononcontrolling interests — — 360 2 362
Net income attributable to stockholders $ 2,422 $ 359 $ 3,412 $ (3,771) $ 2,422
VALERO ENERGYCORPORATIONAANOTES TO CONSOLIDATEDAA FINANCIAL STATTT EMENTS (Continued)
137
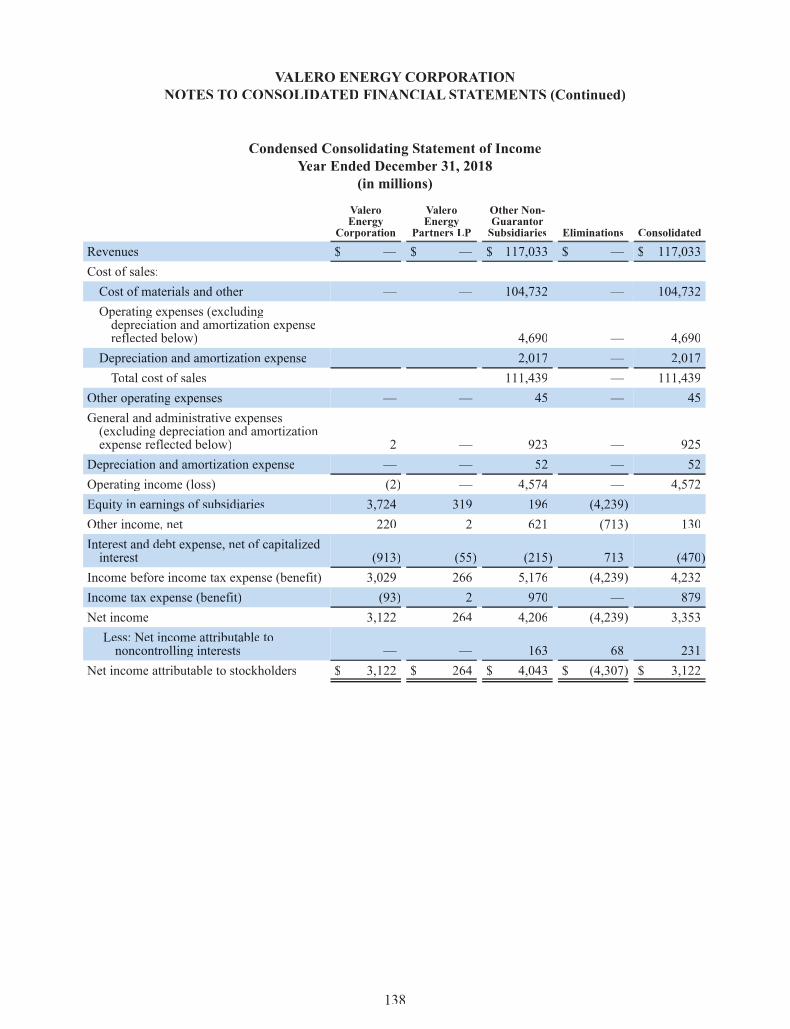
Condensed Consolidating Statement of IncomeYear Ended December 31, 2018
(in millions)
ValeroEnergy
Corporation
ValeroEnergy
Partners LP
Other Non-GuarantorSubsidiaries Eliminations Consolidated
Revenues $ — $ — $ 117,033 $ — $ 117,033Cost of sales:Cost of materials and other — — 104,732 — 104,732Operating expenses (excludingdepreciation and amortization expensereflected below) — — 4,690 — 4,690
Depreciation and amortization expense — — 2,017 — 2,017Total cost of sales — — 111,439 — 111,439
Other operating expenses — — 45 — 45General and administrative expenses(excluding depreciation and amortizationexpense reflected below) 2 — 923 — 925
Depreciation and amortization expense — — 52 — 52Operating income (loss) (2) — 4,574 — 4,572Equity in earnings of subsidiaries 3,724 319 196 (4,239) —Other income, net 220 2 621 (713) 130Interest and debt expense, net of capitalizedinterest (913) (55) (215) 713 (470)
Income before income tax expense (benefit) 3,029 266 5,176 (4,239) 4,232Income tax expense (benefit) (93) 2 970 — 879Net income 3,122 264 4,206 (4,239) 3,353Less: Net income attributable tononcontrolling interests — — 163 68 231
Net income attributable to stockholders $ 3,122 $ 264 $ 4,043 $ (4,307) $ 3,122
VALERO ENERGYCORPORATIONAANOTES TO CONSOLIDATEDAA FINANCIAL STATTT EMENTS (Continued)
138

Condensed Consolidating Statement of IncomeYear Ended December 31, 2017
(in millions)
ValeroEnergy
Corporation
ValeroEnergy
Partners LP
Other Non-GuarantorSubsidiaries Eliminations Consolidated
Revenues $ — $ — $ 93,980 $ — $ 93,980Cost of sales:Cost of materials and other — — 83,037 — 83,037Operating expenses (excludingdepreciation and amortization expensereflected below) — — 4,504 — 4,504
Depreciation and amortization expense — — 1,934 — 1,934Total cost of sales — — 89,475 — 89,475
Other operating expenses — — 61 — 61General and administrative expenses(excluding depreciation and amortizationexpense reflected below) 6 — 823 — 829
Depreciation and amortization expense — — 52 — 52Operating income (loss) (6) — 3,569 — 3,563Equity in earnings of subsidiaries 5,236 275 176 (5,687) —Other income, net 290 1 415 (594) 112Interest and debt expense, net of capitalizedinterest (780) (36) (246) 594 (468)
Income before income tax expense (benefit) 4,740 240 3,914 (5,687) 3,207Income tax expense (benefit) 675 2 (1,626) — (949)Net income 4,065 238 5,540 (5,687) 4,156Less: Net income attributable tononcontrolling interests — — 29 62 91
Net income attributable to stockholders $ 4,065 $ 238 $ 5,511 $ (5,749) $ 4,065
VALERO ENERGYCORPORATIONAANOTES TO CONSOLIDATEDAA FINANCIAL STATTT EMENTS (Continued)
139
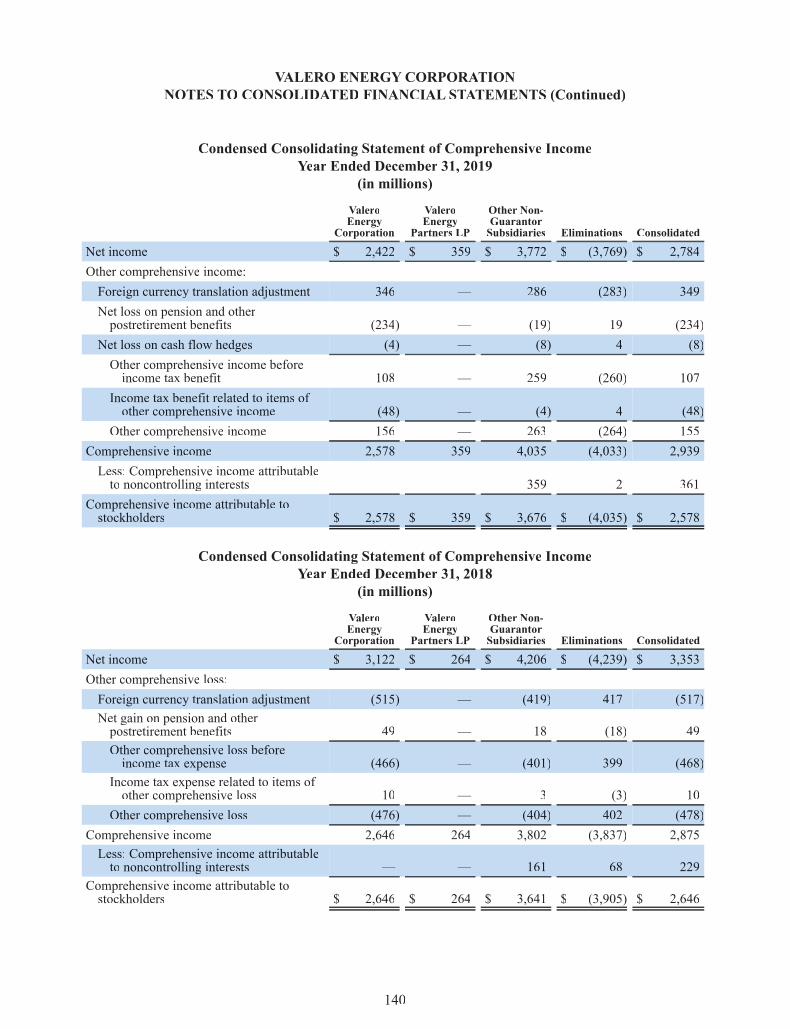
Condensed Consolidating Statement of Comprehensive IncomeYear Ended December 31, 2019
(in millions)
ValeroEnergy
Corporation
ValeroEnergy
Partners LP
Other Non-GuarantorSubsidiaries Eliminations Consolidated
Net income $ 2,422 $ 359 $ 3,772 $ (3,769) $ 2,784Other comprehensive income:Foreign currency translation adjustment 346 — 286 (283) 349Net loss on pension and otherpostretirement benefits (234) — (19) 19 (234)
Net loss on cash flow hedges (4) — (8) 4 (8)Other comprehensive income beforeincome tax benefit 108 — 259 (260) 107
Income tax benefit related to items ofother comprehensive income (48) — (4) 4 (48)
Other comprehensive income 156 — 263 (264) 155Comprehensive income 2,578 359 4,035 (4,033) 2,939Less: Comprehensive income attributableto noncontrolling interests — — 359 2 361
Comprehensive income attributable tostockholders $ 2,578 $ 359 $ 3,676 $ (4,035) $ 2,578
VALERO ENERGYCORPORATIONAANOTES TO CONSOLIDATEDAA FINANCIAL STATTT EMENTS (Continued)
140
Condensed Consolidating Statement of Comprehensive IncomeYear Ended December 31, 2018
(in millions)
ValeroEnergy
Corporation
ValeroEnergy
Partners LP
Other Non-GuarantorSubsidiaries Eliminations Consolidated
Net income $ 3,122 $ 264 $ 4,206 $ (4,239) $ 3,353Other comprehensive loss:Foreign currency translation adjustment (515) — (419) 417 (517)Net gain on pension and otherpostretirement benefits 49 — 18 (18) 49Other comprehensive loss beforeincome tax expense (466) — (401) 399 (468)
Income tax expense related to items ofother comprehensive loss 10 — 3 (3) 10
Other comprehensive loss (476) — (404) 402 (478)Comprehensive income 2,646 264 3,802 (3,837) 2,875Less: Comprehensive income attributableto noncontrolling interests — — 161 68 229
Comprehensive income attributable tostockholders $ 2,646 $ 264 $ 3,641 $ (3,905) $ 2,646
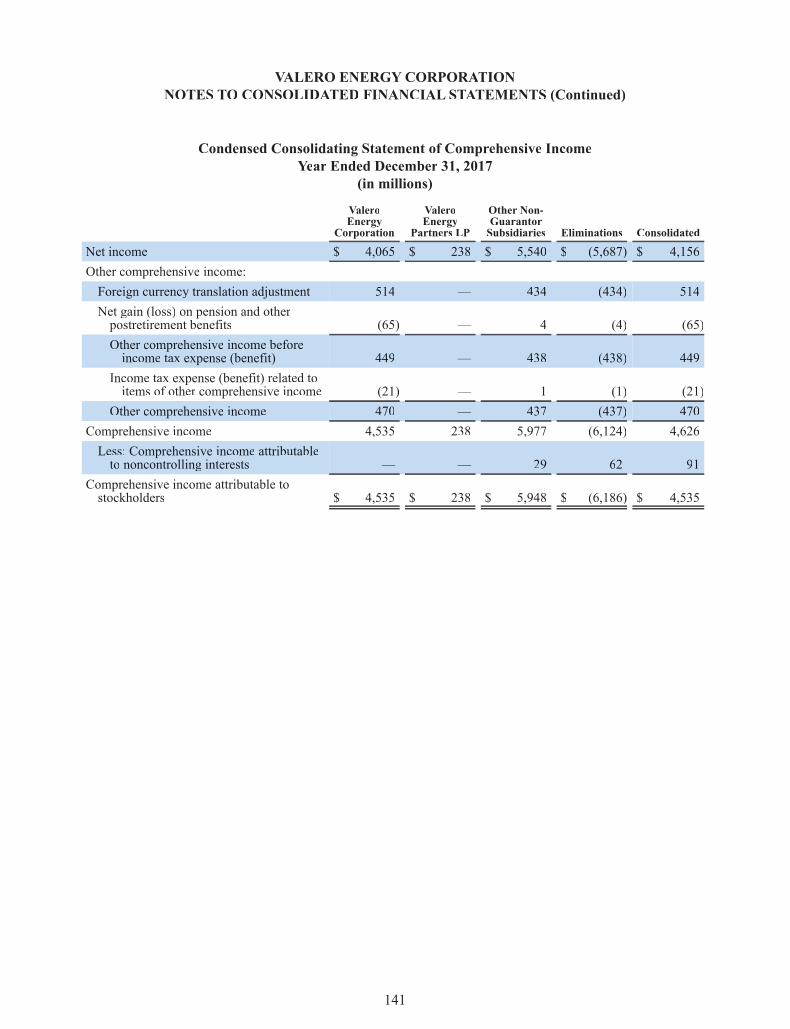
Condensed Consolidating Statement of Comprehensive IncomeYear Ended December 31, 2017
(in millions)
ValeroEnergy
Corporation
ValeroEnergy
Partners LP
Other Non-GuarantorSubsidiaries Eliminations Consolidated
Net income $ 4,065 $ 238 $ 5,540 $ (5,687) $ 4,156Other comprehensive income:Foreign currency translation adjustment 514 — 434 (434) 514Net gain (loss) on pension and otherpostretirement benefits (65) — 4 (4) (65)Other comprehensive income beforeincome tax expense (benefit) 449 — 438 (438) 449
Income tax expense (benefit) related toitems of other comprehensive income (21) — 1 (1) (21)
Other comprehensive income 470 — 437 (437) 470Comprehensive income 4,535 238 5,977 (6,124) 4,626Less: Comprehensive income attributableto noncontrolling interests — — 29 62 91
Comprehensive income attributable tostockholders $ 4,535 $ 238 $ 5,948 $ (6,186) $ 4,535
VALERO ENERGYCORPORATIONAANOTES TO CONSOLIDATEDAA FINANCIAL STATTT EMENTS (Continued)
141
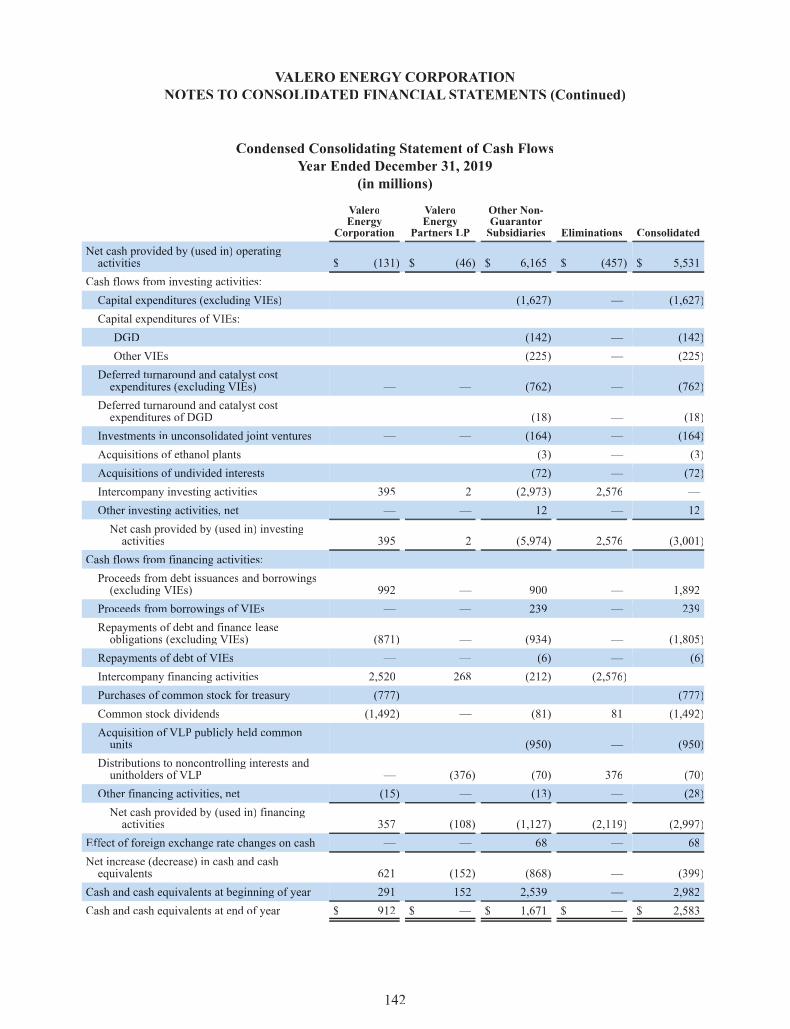
Condensed Consolidating Statement of Cash FlowsYear Ended December 31, 2019
(in millions)
ValeroEnergy
Corporation
ValeroEnergy
Partners LP
Other Non-GuarantorSubsidiaries Eliminations Consolidated
Net cash provided by (used in) operatingactivities $ (131) $ (46) $ 6,165 $ (457) $ 5,531
Cash flows from investing activities:Capital expenditures (excluding VIEs) — — (1,627) — (1,627)Capital expenditures of VIEs:DGD — — (142) — (142)Other VIEs — — (225) — (225)
Deferred turnaround and catalyst costexpenditures (excluding VIEs) — — (762) — (762)
Deferred turnaround and catalyst costexpenditures of DGD — — (18) — (18)
Investments in unconsolidated joint ventures — — (164) — (164)Acquisitions of ethanol plants — — (3) — (3)Acquisitions of undivided interests — — (72) — (72)Intercompany investing activities 395 2 (2,973) 2,576 —Other investing activities, net — — 12 — 12Net cash provided by (used in) investingactivities 395 2 (5,974) 2,576 (3,001)
Cash flows from financing activities:Proceeds from debt issuances and borrowings(excluding VIEs) 992 — 900 — 1,892
Proceeds from borrowings of VIEs — — 239 — 239Repayments of debt and finance leaseobligations (excluding VIEs) (871) — (934) — (1,805)
Repayments of debt of VIEs — — (6) — (6)Intercompany financing activities 2,520 268 (212) (2,576) —Purchases of common stock for treasury (777) — — — (777)Common stock dividends (1,492) — (81) 81 (1,492)Acquisition of VLP publicly held commonunits — — (950) — (950)
Distributions to noncontrolling interests andunitholders of VLP — (376) (70) 376 (70)
Other financing activities, net (15) — (13) — (28)Net cash provided by (used in) financingactivities 357 (108) (1,127) (2,119) (2,997)
Effectff of foreign exchange rate changes on cash — — 68 — 68Net increase (decrease) in cash and cashequivalents 621 (152) (868) — (399)
Cash and cash equivalents at beginning of year 291 152 2,539 — 2,982Cash and cash equivalents at end of year $ 912 $ — $ 1,671 $ — $ 2,583
VALERO ENERGYCORPORATIONAANOTES TO CONSOLIDATEDAA FINANCIAL STATTT EMENTS (Continued)
142

Condensed Consolidating Statement of Cash FlowsYear Ended December 31, 2018
(in millions)
ValeroEnergy
Corporation
ValeroEnergy
Partners LP
Other Non-GuarantorSubsidiaries Eliminations Consolidated
Net cash provided by (used in) operatingactivities $ (1,207) $ (51) $ 5,828 $ (199) $ 4,371
Cash flows from investing activities:Capital expenditures (excluding VIEs) — — (1,463) — (1,463)Capital expenditures of VIEs:DGD — — (165) — (165)Other VIEs — — (124) — (124)
Deferred turnaround and catalyst costexpenditures (excluding VIEs) — — (888) — (888)
Deferred turnaround and catalyst costexpenditures of DGD — — (27) — (27)
Investments in unconsolidated joint ventures — — (181) — (181)Peru Acquisition, net of cash acquired — — (468) — (468)Acquisitions of ethanol plants — — (320) — (320)Acquisitions of undivided interests — — (212) — (212)Minor acquisitions — — (88) — (88)Intercompany investing activities 758 102 (2,381) 1,521 —Other investing activities, net — — 8 — 8Net cash provided by (used in) investingactivities 758 102 (6,309) 1,521 (3,928)
Cash flows from financing activities:Proceeds from debt issuances and borrowings(excluding VIEs) 750 498 10 — 1,258
Proceeds from borrowings of VIEs — — 109 — 109Repayments of debt and finance leaseobligations (excluding VIEs) (787) (410) (156) — (1,353)
Repayments of debt of VIEs — — (6) — (6)Intercompany financing activities 2,106 190 (775) (1,521) —Purchases of common stock for treasury (1,708) — — — (1,708)Common stock dividends (1,369) — (32) 32 (1,369)Contributions to noncontrolling interests — — 32 — 32Distributions to noncontrolling interests andunitholders of VLP — (215) (68) 167 (116)
Other financing activities, net 2 (4) (13) — (15)Net cash provided by (used in) financingactivities (1,006) 59 (899) (1,322) (3,168)
Effectff of foreign exchange rate changes on cash — — (143) — (143)Net increase (decrease) in cash and cashequivalents (1,455) 110 (1,523) — (2,868)
Cash and cash equivalents at beginning of year 1,746 42 4,062 — 5,850Cash and cash equivalents at end of year $ 291 $ 152 $ 2,539 $ — $ 2,982
VALERO ENERGYCORPORATIONAANOTES TO CONSOLIDATEDAA FINANCIAL STATTT EMENTS (Continued)
143
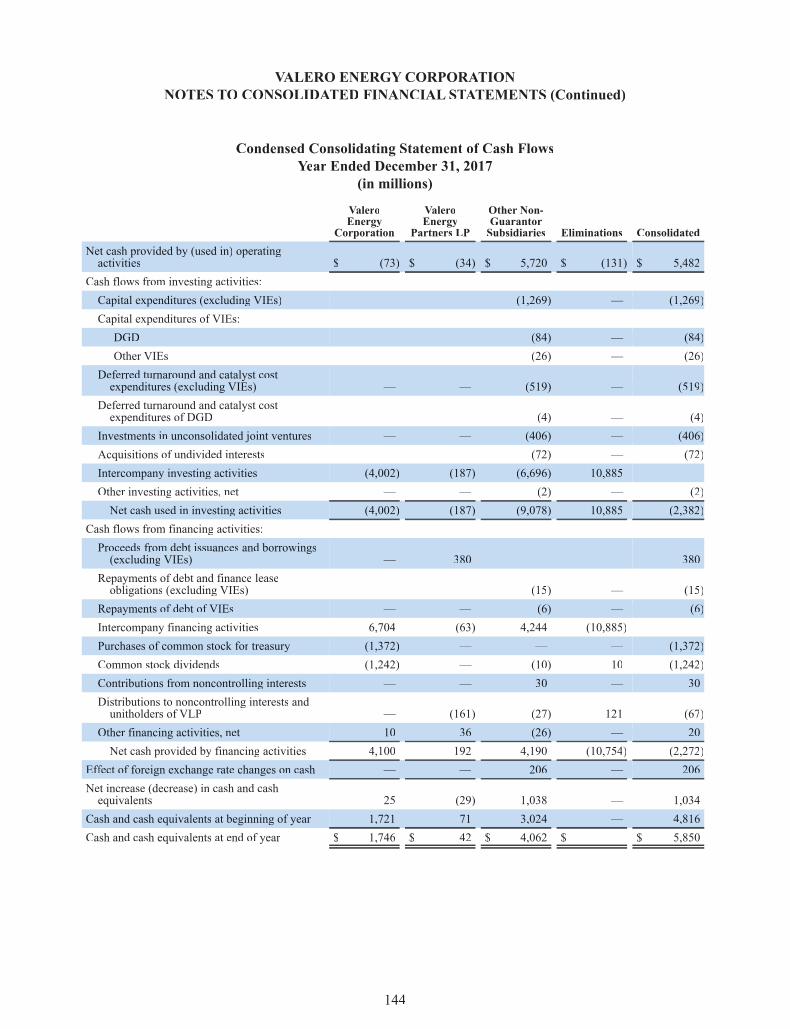
Condensed Consolidating Statement of Cash FlowsYear Ended December 31, 2017
(in millions)
ValeroEnergy
Corporation
ValeroEnergy
Partners LP
Other Non-GuarantorSubsidiaries Eliminations Consolidated
Net cash provided by (used in) operatingactivities $ (73) $ (34) $ 5,720 $ (131) $ 5,482
Cash flows from investing activities:Capital expenditures (excluding VIEs) — — (1,269) — (1,269)Capital expenditures of VIEs:DGD — — (84) — (84)Other VIEs — — (26) — (26)
Deferred turnaround and catalyst costexpenditures (excluding VIEs) — — (519) — (519)
Deferred turnaround and catalyst costexpenditures of DGD — — (4) — (4)
Investments in unconsolidated joint ventures — — (406) — (406)Acquisitions of undivided interests — — (72) — (72)Intercompany investing activities (4,002) (187) (6,696) 10,885 —Other investing activities, net — — (2) — (2)Net cash used in investing activities (4,002) (187) (9,078) 10,885 (2,382)
Cash flows from financing activities:Proceeds from debt issuances and borrowings(excluding VIEs) — 380 — — 380
Repayments of debt and finance leaseobligations (excluding VIEs) — — (15) — (15)
Repayments of debt of VIEs — — (6) — (6)Intercompany financing activities 6,704 (63) 4,244 (10,885) —Purchases of common stock for treasury (1,372) — — — (1,372)Common stock dividends (1,242) — (10) 10 (1,242)Contributions from noncontrolling interests — — 30 — 30Distributions to noncontrolling interests andunitholders of VLP — (161) (27) 121 (67)
Other financing activities, net 10 36 (26) — 20Net cash provided by financing activities 4,100 192 4,190 (10,754) (2,272)
Effectff of foreign exchange rate changes on cash — — 206 — 206Net increase (decrease) in cash and cashequivalents 25 (29) 1,038 — 1,034
Cash and cash equivalents at beginning of year 1,721 71 3,024 — 4,816Cash and cash equivalents at end of year $ 1,746 $ 42 $ 4,062 $ — $ 5,850
VALERO ENERGYCORPORATIONAANOTES TO CONSOLIDATEDAA FINANCIAL STATTT EMENTS (Continued)
144

22. QUARTERLRR YLL FINANCIALDATAAA (Unaudited)
The following tables summarize quarterly financial data for the years ended December 31, 2019 and 2018(in millions, except per share amounts).
2019 Quarter EndedMarch 31 June 30 September 30 December 31
Revenues $ 24,263 $ 28,933 $ 27,249 $ 27,879Gross profit (a) 533 1,123 1,119 2,003Operating income 308 908 881 1,739Net income 167 648 639 1,330Net income attributable toValero Energy Corporationstockholders 141 612 609 1,060
Earnings per common share 0.34 1.47 1.48 2.58Earnings per common share –assuming dilution 0.34 1.47 1.48 2.58
2018 Quarter EndedMarch 31 June 30 September 30 December 31
Revenues $ 26,439 $ 31,015 $ 30,849 $ 28,730Gross profit (a) 1,062 1,535 1,451 1,546Operating income 801 1,253 1,219 1,299Net income 582 875 874 1,022Net income attributable toValero Energy Corporationstockholders 469 845 856 952
Earnings per common share 1.09 1.96 2.01 2.26Earnings per common share –assuming dilution 1.09 1.96 2.01 2.24
_____________________________
(a) Gross profit is calculated as revenues less total cost of sales.
VALERO ENERGYCORPORATIONAANOTES TO CONSOLIDATEDAA FINANCIAL STATTT EMENTS (Continued)
145

ITEM 9. CHANGES IN AND DISAGREEMENTS WITH ACCOUNTANTSTT ON ACCOUNTINGAND FINANCIALDISCLOSURE
None.
146
ITEM 9A. CONTROLSAND PROCEDURES
Disclosure Controls and Procedures. Ourmanagement has evaluated, with the participation of our principalexecutive officerff and principal financial officerff , the effectivenessff of our disclosure controls and procedures(as defined in Rule 13a-15(e) under the Securities ExchangeAct of 1934) as of the end of the period coveredby this report, and has concluded that our disclosure controls and procedures were effectiveff as ofDecember 31, 2019.
Internal Control over Financial Reporting.
(a) Management’s Report on Internal Controlrr over Financial Reporting.
The management report on Valero’s internal control over financial reporting required by Item 9Aappears inItem 8 on page 59 of this report, and is incorporated herein by reference.
(b) Attestation Report of the Independent Registeredrr Public Accounting Firm.
KPMG LLP’s report on Valero’s internal control over financial reporting appears in Item 8 beginning onpage 62 of this report, and is incorporated herein by reference.
(c) Changes in Internal Controlrr over Financial Reporting.
There has been no change in our internal control over financial reporting that occurred during our last fiscalquarter that has materially affected,ff or is reasonably likely to materially affect,ff our internal control overfinancial reporting.
ITEM 9B. OTHER INFORMATIONAA
None.
PART III
ITEMS 10-14.
The information required by Items 10 through 14 of Form 10-K is incorporated herein by reference to thedefinitive proxy statement for our 2020 annualmeeting of stockholders.We expect to file the proxy statementwith the SEC on or before March 31, 2020.

PART IV
147
ITEM 15. EXHIBITS AND FINANCIAL STATTT EMENT SCHEDULES
(a) 1. Financial Statements. The following consolidated financial statements of Valero EnergyCorporation and its subsidiaries are included in Part II, Item 8 of this Form 10-K:
PagegManagement’s report on internal control over financial reporting 59Reports of independent registered public accounting firm 60Consolidated balance sheets as of December 31, 2019 and 2018 64Consolidated statements of income for the years ended December 31, 2019, 2018, and 2017 65Consolidated statements of comprehensive income for the years ended December 31, 2019, 2018,and 2017
66
Consolidated statements of equity for the years ended December 31, 2019, 2018, and 2017 67Consolidated statements of cash flows for the years ended December 31, 2019, 2018, and 2017 68Notes to consolidated financial statements 69
2. Financial Statement Schedules and Other Financial Information. No financial statementschedules are submitted because either they are inapplicable or because the required information is includedin the consolidated financial statements or notes thereto.
3. Exhibits. Filed as part of this Form 10-K are the following exhibits:
++2.01 — Agreement and Plan of Merger, dated as of October 18, 2018, by and among Valero EnergyCorporation; Forest Merger Sub, LLC; Valero Energy Partners LP; and Valero Energy Partners GPLLC–incorporated by reference to Exhibit 2.1 to Valero’s Current Report on Form 8-K dated andfiled October 18, 2018 (SEC File No. 1-13175).
3.01 — Amended and Restated Certificate of Incorporation of Valero Energy Corporation, formerly knownas Valero Refining and Marketing Company–incorporated by reference to Exhibit 3.1 to Valero’sRegistration Statement on Form S-1 (SEC File No. 333-27013) filed May 13, 1997.
3.02 — Certificate ofAmendment (July 31, 1997) to Restated Certificate of Incorporation of Valero EnergyCorporation–incorporated by reference to Exhibit 3.02 to Valero’sAnnual Report on Form 10-K forthe year ended December 31, 2003 (SEC File No. 1-13175).
3.03 — Certificate of Merger of Ultramar Diamond Shamrock Corporation with and into Valero EnergyCorporation dated December 31, 2001–incorporated by reference to Exhibit 3.03 toValero’sAnnualReport on Form 10-K for the year ended December 31, 2003 (SEC File No. 1-13175).
3.04 — Amendment (effectiveff December 31, 2001) toRestatedCertificate of Incorporation ofValeroEnergyCorporation–incorporated by reference to Exhibit 3.1 toValero’s Current Report on Form 8-K datedDecember 31, 2001, and filed January 11, 2002 (SEC File No. 1-13175).
3.05 — Second Certificate of Amendment (effectiveff September 17, 2004) to Restated Certificate ofIncorporation of Valero Energy Corporation–incorporated by reference to Exhibit 3.04 to Valero’sQuarterly Report on Form 10-Q for the quarter ended September 30, 2004 (SEC File No. 1-13175).
3.06 — Certificate ofMergerofPremcor Inc.with and intoValeroEnergyCorporationeffectiveff September 1,2005–incorporated by reference to Exhibit 2.01 to Valero’s Quarterly Report on Form 10-Q for thequarter ended September 30, 2005 (SEC File No. 1-13175).
3.07 — Third Certificate of Amendment (effectiveff December 2, 2005) to Restated Certificate ofIncorporation of Valero Energy Corporation–incorporated by reference to Exhibit 3.07 to Valero’sAnnual Report on Form 10-K for the year ended December 31, 2005 (SEC File No. 1-13175).
3.08 — Fourth Certificate of Amendment (effectiveff May 24, 2011) to Restated Certificate of Incorporationof Valero Energy Corporation–incorporated by reference to Exhibit 4.8 to Valero’s Current Reporton Form 8-K dated and filed May 24, 2011 (SEC File No. 1-13175).
3.09 — Fifth Certificate of Amendment (effectiveff May 13, 2016) to Restated Certificate of Incorporationof Valero Energy Corporation–incorporated by reference to Exhibit 3.02 to Valero’s Current Reporton Form 8-K dated May 12, 2016, and filed May 18, 2016 (SEC File No. 1-13175).
3.10 — Amended and Restated Bylaws of Valero Energy Corporation–incorporated by reference toExhibit 3.01 to Valero’s Current Report on Form 8-K dated September 20, 2017 and filedSeptember 21, 2017 (SEC File No. 1-13175).
4.01 — Indenture dated as of December 12, 1997 betweenValero Energy Corporation and The Bank of NewYork–incorporated by reference to Exhibit 3.4 toValero’s Registration Statement on Form S-3 (SECFile No. 333-56599) filed June 11, 1998.
4.02 — First Supplemental Indenture dated as of June 28, 2000 betweenValero Energy Corporation andTheBank of New York (including Form of 7 3/4% Senior Deferrable Note due 2005)–incorporated byreference to Exhibit 4.6 to Valero’s Current Report on Form 8-K dated June 28, 2000, and filedJune 30, 2000 (SEC File No. 1-13175).
4.03 — Indenture (Senior Indenture) dated as of June 18, 2004 between Valero Energy Corporation andBank of New York–incorporated by reference to Exhibit 4.7 to Valero’s Registration Statement onForm S-3 (SEC File No. 333-116668) filed June 21, 2004.
4.04 — Form of Indenture related to subordinated debt securities–incorporated by reference to Exhibit 4.8to Valero’s Registration Statement on Form S-3 (SEC File No. 333-116668) filed June 21, 2004.
4.05 — Indenture dated as of March 10, 2015 between Valero Energy Corporation and U.S. Bank NationalAssociation, as trustee-incorporated by reference to Exhibit 4.1 to Valero’s Registration Statementon Form S-3 (SEC File No. 333-202635) filed March 10, 2015.
4.06 — Indenture, dated as of November 30, 2016, between Valero Energy Partners LP,PP as issuer, and U.S.Bank National Association, as trustee–incorporated by reference to Exhibit 4.1 to Valero EnergyPartners LP’s Post-Effectiveff Amendment No. 1 to Registration Statement on Form S-3 (RegistrationFile No. 333-208052) filed November 30, 2016.
4.07 — First Supplemental Indenture (with Parent Guarantee), dated as of January 10, 2019, among ValeroEnergy Partners LP,PP as issuer; Valero Energy Corporation, as parent guarantor; and U.S. BankNationalAssociation, as trustee–incorporated by reference to Exhibit 4.2 to Valero’s Current Reporton Form 8-K dated and filed January 10, 2019 (SEC File No. 1-13175).
4.08 — Specimen Certificate of Common Stock–incorporated by reference to Exhibit 4.1 to Valero’sRegistration Statement on Form S-3 (SEC File No. 333-116668) filed June 21, 2004.
*4.09 — Description of Valero Energy Corporation common stock, $0.01 par value.
+10.01 — ValeroVV Energy Corporation Annual Bonus Plan, amended and restated as of February 28, 2018–incorporated by reference to Exhibit 10.01 to Valero’s Annual Report on Form 10-K for the yearended December 31, 2017 (SEC File No. 1-13175).
+10.02 — ValeroVV Energy Corporation 2005 Omnibus Stock Incentive Plan, amended and restated as ofOctober 1, 2005–incorporated by reference to Exhibit 10.02 to Valero’sAnnual Report on Form 10-K for the year ended December 31, 2009 (SEC File No. 1-13175).
+10.03 — ValeroVV Energy Corporation 2011 Omnibus Stock Incentive Plan, amended and restated February 25,2016–incorporated by reference to Exhibit 10.04 to Valero’s Annual Report on Form 10-K for theyear ended December 31, 2015 (SEC File No. 1-13175).
+10.04 — ValeroVV Energy Corporation Deferred Compensation Plan, amended and restated as of January 1,2008–incorporated by reference to Exhibit 10.04 to Valero’s Annual Report on Form 10-K for theyear ended December 31, 2008 (SEC File No. 1-13175).
+10.05 — ValeroVV Energy Corporation Amended and Restated Supplemental Executive Retirement Plan,amended and restated as of November 10, 2008–incorporated by reference to Exhibit 10.08 toValero’s Annual Report on Form 10-K for the year ended December 31, 2008 (SEC FileNo. 1-13175).
148

+10.06 — ValeroVV Energy Corporation Excess Pension Plan, as amended and restated effectiveff December 31,2011–incorporated by reference to Exhibit 10.10 to Valero’s Annual Report on Form 10-K for theyear ended December 31, 2011 (SEC File No. 1-13175).
+10.07 — Form of Change of Control Severance Agreement (Tier I) between Valero Energy Corporation andexecutive officer–incorporatedff by reference to Exhibit 10.15 toValero’sAnnual Report on Form 10-K for the year ended December 31, 2011 (SEC File No. 1-13175).
+10.08 — Form of Change of Control SeveranceAgreement (Tier II) between Valero Energy Corporation andexecutive officer–incorporatedff by reference to Exhibit 10.16 toValero’sAnnual Report on Form 10-K for the year ended December 31, 2013 (SEC File No. 1-13175).
+10.09 — Form of Amendment (dated January 7, 2013) to Change of Control Severance Agreements (toeliminate excise tax gross-up benefit)–incorporated by reference to Exhibit 10.17 toValero’sAnnualReport on Form 10-K for the year ended December 31, 2012 (SEC File No. 1-13175).
+10.10 — Form of Change of Control Severance Agreement (Tier II-A) between Valero Energy Corporationand executive officer–incorporatedff by reference to Exhibit 10.02 to Valero’s Current Report onForm 8-K dated November 2, 2016, and filed November 7, 2016 (SEC File No. 1-13175).
+10.11 — Schedule of Tier II-AChange of ControlAgreements–incorporated by reference to Exhibit 10.11 toValero’s Annual Report on Form 10-K for the year ended December 31, 2018 (SEC FileNo. 1-13175).
+10.12 — Form of Amendment (dated January 17, 2017) to Change of Control Severance Agreements,amending Section 9 thereof–incorporated by reference to Exhibit 10.01 to Valero’s Current Reporton Form 8-K dated and filed January 17, 2017 (SEC File No. 1-13175).
*+10.13 — Form of Performance Share Award Agreement pursuant to the Valero Energy Corporation 2011Omnibus Stock Incentive Plan.
+10.14 — Form of Stock Option Agreement pursuant to the Valero Energy Corporation 2011 Omnibus StockIncentive Plan–incorporated by reference to Exhibit 10.21 to Valero’s Annual Report on Form 10-K for the year ended December 31, 2011 (SEC File No. 1-13175).
+10.15 — Form of Performance Stock Option Agreement pursuant to the Valero Energy Corporation 2011Omnibus Stock Incentive Plan–incorporated by reference toExhibit 10.21 toValero’sAnnualReporton Form 10-K for the year ended December 31, 2012 (SEC File No. 1-13175).
+10.16 — FormofRestrictedStockAgreement pursuant to theValeroEnergyCorporation 2011Omnibus StockIncentive Plan–incorporated by reference to Exhibit 10.25 to Valero’s Annual Report on Form 10-K for the year ended December 31, 2012 (SEC File No. 1-13175).
*+10.17 — Long-TermTT Incentive Agreement dated as of December 18, 2019, between Valero EnergyCorporation and R. Lane Riggs.
+10.18 — Form of Stock Unit Award Agreement for Non-Employee Directors (standard)-incorporated byreference to Exhibit 10.01 to Valero’s Current Report on Form 8-K dated April 30, 2019, and filedMay 1, 2019 (SEC File No. 1-13175).
+10.19 — Form of Stock UnitAwardAgreement for Non-Employee Directors (with one-year hold provision)-incorporated by reference to Exhibit 10.02 to Valero’s Current Report on Form 8-K dated April 30,2019, and filed May 1, 2019 (SEC File No. 1-13175).
10.20 — Fourth Amended and Restated Revolving Credit Agreement, dated as of March 19, 2019, amongValero Energy Corporation, as Borrower; JPMorgan Chase Bank, N.A., as Administrative Agent;and the lenders named therein–incorporated by reference to Exhibit 10.1 to Valero’s Current Reporton Form 8-K dated March 19, 2019, and filed March 19, 2019 (SEC File No. 1-13175).
14.01 — Code of Ethics for Senior Financial Officers–incorporatedff by reference to Exhibit 14.01 to Valero’sAnnual Report on Form 10-K for the year ended December 31, 2003 (SEC File No. 1-13175).
*21.01 — ValeroVV Energy Corporation subsidiaries.
*23.01 — Consent of KPMG LLP dated February 26, 2020.
149
______________* Filed herewith.
** Furnished herewith.
*** Submitted electronically herewith.
+ Identifies management contracts or compensatory plans or arrangements required to be filed as an exhibit hereto.
++ Certain schedules have been omitted pursuant to Item 601(b)(2) of Regulation S-K.The registrant agrees to furnishsupplementally a copy of any such omitted schedule to the SEC upon request.
Pursuant to paragraph 601(b)(4)(iii)(A) of Regulation S-K, the registrant has omitted from the foregoing listing ofexhibits, and hereby agrees to furnish to the SEC upon its request, copies of certain instruments, each relating to debtnot exceeding 10 percent of the total assets of the registrant and its subsidiaries on a consolidated basis.
*24.01 — Power of Attorney dated February 26, 2020 (on the signature page of this Form 10-K).
*31.01 — RuleRR 13a-14(a) Certification (under Section 302 of the Sarbanes-Oxley Act of 2002) of principalexecutive officerff .
*31.02 — RuleRR 13a-14(a) Certification (under Section 302 of the Sarbanes-Oxley Act of 2002) of principalfinancial officerff .
**32.01 — Section 1350 Certifications (under Section 906 of the Sarbanes-Oxley Act of 2002).
99.01 — Audit Committee Pre-Approval Policy–incorporated by reference to Exhibit 99.01 to Valero’sAnnual Report on Form 10-K for the year ended December 31, 2017 (SEC File No. 1-13175).
***101.INS — Inline XBRL Instance Document–the instance document does not appear in the Interactive Data Filebecause its XBRL tags are embedded within the Inline XBRL document.
***101.SCH — Inline XBRL Taxonomy Extension Schema Document.
***101.CAL — Inline XBRL Taxonomy Extension Calculation Linkbase Document.
***101.DEF — Inline XBRL Taxonomy Extension Definition Linkbase Document.
***101.LAB — Inline XBRL Taxonomy Extension Label Linkbase Document.
***101.PRE — Inline XBRL Taxonomy Extension Presentation Linkbase Document.
***104 — Cover Page Interactive Data File (formatted as Inline XBRL and contained in Exhibit 101).
150

SIGNATUREAA
Pursuant to the requirements of Section 13 or 15(d) of the Securities Exchange Act of 1934, the registranthas duly caused this report to be signed on its behalf by the undersigned, thereunto duly authorized.
VALERO ENERGYCORPORATIONAA(Registrant)
By: /s/ Joseph W. Gorder(Joseph W. Gorder)rrChairman of the Boardrr
and Chief Executive Officer
Date: February 26, 2020
151

POWER OFATTORNEY
KNOWALL PERSONS BY THESE PRESENTS, that each person whose signature appears below hereby constitutes andappoints Joseph W. Gorder,rr Donna M. Titzman, and Jason W. Fraser,rr or any of them, each with power to act without theother,rr his true and lawful attorney-in-fact and agent, with full power of substitution and resubstitution, for him and in hisname, place and stead, in any and all capacities, to sign any or all subsequent amendments and supplements to this AnnualReport on Form 10-K, and to file the same, or cause to be filed the same, with all exhibits thereto, and other documents inconnection therewith, with the Securities and Exchange Commission, granting unto each said attorney-in-fact and agent fullpower to do and perform each and every act and thing requisite and necessary to be done in and about the premises, as fullyto all intents and purposes as he might or could do in person, hereby qualifying and confirming all that said attorney-in-factand agent or his substitute or substitutes may lawfully do or cause to be done by virtue hereof.
Pursuant to the requirements of the Securities Exchange Act of 1934, this report has been signed below by the followingpersons on behalf of the registrant and in the capacities and on the dates indicated.
Signatureg Title Date
/s/ Joseph W. Gorder Chairman of the Boardand Chief Executive Officerff(Principal Executive Officer)ff
February 26, 2020(Joseph W. Gorder)
/s/ Donna M. Titzman Executive Vice Presidentand Chief Financial Officerff
(Principal Financial and Accounting Officer)ffFebruary 26, 2020
(Donna M. Titzman)
/s/ H. Paulett EberhartDirector February 26, 2020
(H. Paulett Eberhart)
/s/ Kimberly S. GreeneDirector February 26, 2020
(Kimberly S. Greene)
/s/ Deborah P. MajorasDirector February 26, 2020
(Deborah P. Majoras)
/s/ Donald L. NicklesDirector February 26, 2020
(Donald L. Nickles)
/s/ Philip J. PfeifferffDirector February 26, 2020
(Philip J. Pfeiffer)ff
/s/ Robert A. ProfusekDirector February 26, 2020
(Robert A. Profusek)
/s/ Stephen M. WatersDirector February 26, 2020
(Stephen M. Waters)
/s/ Randall J. WeisenburgerDirector February 26, 2020
(Randall J. Weisenburger)
/s/ Rayford Wilkins, Jr.Director February 26, 2020
(Rayford Wilkins, Jr.)
152