Embed Size (px)
Citation preview
DOCUMENT RESUME
ED 419 321 EC 306 406
AUTHOR Baker, Bruce D.TITLE The Economic Health of Gifted Education in Three
Northeastern States: An Analysis of Public SchoolOpportunities and Private Programs in New York, New Jersey,and Connecticut.
PUB DATE 1995-09-15NOTE 82p.
PUB TYPE Information Analyses (070) Reports Research (143)EDRS PRICE MF01/PC04 Plus Postage.DESCRIPTORS Educational Finance; *Educational Opportunities; Educational
Trends; Elementary Secondary Education; *Gifted; PolicyFormation; *Public Schools; Public Support; School Funds;State Aid; *State Programs; *Talent; *Trend Analysis
IDENTIFIERS Connecticut; New Jersey; New York
ABSTRACTThis report analyzes policy trends in gifted education in
New York, New Jersey, and Connecticut from 1984 through 1994. The decrease instate funding of gifted education during this period is investigated, alongwith the rise of private and university gifted programs. Findings from theanalysis indicated that gifted students possess few of the legal rights orprivileges of other special populations and thus, gifted education fundingcontinues to be disposable at the state or municipal level. Although theblame for cuts to gifted education has been placed on the "fiscal crisis",both Connecticut and New Jersey implemented their first major cuts tostate-level funding against increases in general education expenditures thatwere six percent above inflation. In each case, these cuts resulted insignificantly fewer pupils being served over time. School districts thatsuffered most from these cuts were lower economic-level districts or thosedistricts more dependent on state support to keep their programs intact. Theneed for the development of state or federal level policies ensuring rightsfor gifted students is urged. Attached charts include information on perpupil expenditures to gifted pupils, the number of children identified, andthe number of children receiving gifted education services. (Contains 35references.) (CR)
********************************************************************************
Reproductions supplied by EDRS are the best that can be madefrom the original document.
********************************************************************************
The Economic Health of Gifted Education in Three Northeastern States:An Analysis of Public School Opportunities and Private Programs in New York,
New Jersey and Connecticut
Bruce D. BakerDepartment of Educational AdministrationTeachers College of Columbia University
1
2
PERMISSION TO REPRODUCE AND
DISSEMINATE THIS MATERIAL HAS
BEEN GRANTED BY
TO THE EDUCATIONAL RESOURCESINFORMATION CENTER (ERIC)
U.S. DEPARTMENT OF EDUCATIONOffice of Educational Research and Improvement
EDUCATIONAL RESOURCES INFORMATIONEvCENTER (ERIC)edocumentent has been reproduced as
received from the person or organizationoriginating it.Minor changes have been made toimprove reproduction quality.
Points of view or opinions stated in thisdocument do not necessarily representofficial OERI position or policy.
The Economic Health of Gifted Education in Three Northeastern States:An Analysis of Public School Opportunities and Private Programs in New York,
New Jersey and Connecticut
Bruce D. BakerDepartment of Educational AdministrationTeachers College of Columbia University
3
Bruce D. BakerThe Economic Health of Gifted Education Draft as of: September 15, 1995
1.0 Introduction
The early 1990s saw a rally of battle cries around the apparent "quiet crisis"
occurring in gifted education. During this period, the door to the major political issues in
the field was opened by Joseph Renzulli and Sally Reis (1991) of The University of
Connecticut in a piece entitled "The Reform Movement and the Quiet Crisis in Gifted
Education". Upon coining the term "quiet crisis" Renzulli and Reis pointed to the key
features of the ongoing reform movement that appeared to be driving the decline of gifted
education. They focused in particular on the conflict between what they perceived to be
the "noble goals" of the reform movement:
Noble Goal #1: To provide the best possible education to our mostpromising students so that we can reassert America's prominence in theintellectual artistic, and moral leadership of the world.
Noble Goal #2: To improve the education of at-risk students [andespecially those students in inner city schools and rural poor areas] who,if they don't drop out, often graduate from high school without the abilityto read, write, or do basic arithmetic. I
Renzulli and Reis suggested that both theorists and practitioners, in response to these
noble goals, began to blindly adopt such "politically correct" trends as full-time
heterogeneous "cooperative" grouping as promoted by Robert Slavin of Johns Hopkins
University. As a result, programs that promoted any "segregation" of students by
intellectual ability became perceived as "elitist". A second result of the conflict between
the noble goals was referred to by Renzulli and Reis as "The Dumbing Down of the
Curriculum."2 They stated: "By dragging the nation's entire school achievement level
down so low that group differences are minimized, it will appear as if at-risk students are
closing the gap with their higher scoring peers." They attributed this "cruel trick of the
game" to our inability to explain our failures in improving education for at-risk students.
Such an approach to achieving "academic equity" is strangely similar to tactics currently
being used to promote "financial equity" in states facing legal scrutiny. In New Jersey,
for example, expenditures for wealthy districts are "capped" by the state's legislature in
order to narrow the margin of inequity between these districts and their poorer
counterparts. The findings and proposals presented in Renzulli's article in 1991 sparked
IRenzulli, J.S. , Reis, S. (1991) The Reform Movement and the Queit Crisis in Gifted Education. GiftedChild Quarterly 35 (1) p. 26
Renzulli, J.S. , Reis, S. (1991) p. 30
1
4
Bruce D. BakerThe Economic Health of Gifted Education Draft as of: September 15, 1995
an ongoing national policy debate regarding the structure and availability of program
opportunities for gifted and talented children.
In 1993, the U.S. Department of Education under secretary Riley released
National Excellence: A Case for Developing America's Talent. In the June 1994 issue of
Roeper Review Charles Desmond, vice-chancellor of the University of Massachusetts at
Boston, re-titled the department of education report "A National Tragedy: The Retreat
from Excellence in America". Desmond focused on the report's findings regarding the
status of gifted education, stating "According to data compiled by the US Department of
Education's Office of Educational Research and Improvement (OERI), which issued the
National Excellence report, America's most talented students are performing so far below
their expected potential that the report warns of grave consequences for the nation." 3
Desmond goes on to suggest that the current status of gifted education is a result of the
"indifference of the American people to the needs of children with special talents" and
that the failure of our best and brightest students has been "buffeted by a failure of our
schools to meet, much less, exceed international academic standards."4
Others, including Harry Passow and Rose Rudnitski expressed their concernregarding the recommendations of the report. Passow and Rudnitski state: "We believe
that what the Department of Education report does is to effectively shift the education of
the gifted from separate, isolated programs and provisions to a context of developing
every student's potential including those with outstanding talent potential."5 This ideal is
an outgrowth of much of the work of Joseph Renzulli who for many years has promoted
"School-wide Enrichment" and more recently "Schools for Talent Development."6 While
Passow and Rudnitski do not criticize this particular ideal as inappropriate, the suggest
that the emphasis on "nurturing the talent potential of all students" has provided critics
with a basis for eliminating specific provisions for gifted and talented students. John
Feldhusen of Purdue University, like Passow expresses his concern that the report does
not address the "basic day-by-day curricular and instructional needs of the gifted and
talented."7 Renzulli, as well, has never indicated that nurturing talents on a school-wide
basis precludes the need for "differentiated opportunities" or program specialists tocoordinate such opportunities.
3Desmond, Charles.(1994) A National Tragedy: The Retreat from Excellence in America. Roeper Review.16 (4) p. 224
4 Desmond, Charles. (1994)
5Passow, H. , Rudnitski, R. (1994) Transforming Policy to Enhance Educational Services for the Gifted.Roeper Review, June, p.2716 Renzulli, J. S. (1994) Schools for Talent Development: A practical plan for total school improvement.Mansfield Center. CT , Creative Learning Press
7Feldhusen, John.(1994) A Case for Developing America's Talent: How we went wrong and where we gonow. Roeper Review 16 (4) p. 232
25
Bruce D. BakerThe Economic Health of Gifted Education Draft as of: September 15, 1995
In contrast, Passow and Rudnitski refer to the 1972 Mar land Report as
stimulating growth of programs at the state level by placing emphasis on the gifted and
talented as a special population.
"The report stimulated state and local activities on an unprecedented levelwith policy formulations that resulted in statutory descriptions ordefinitions of the gifted; regulations regarding identification of suchchildren; appointment of personnel to state education departments withbriefs to initiate, coordinate, and support educational programs andservices for the gifted; appropriation of state generated funds for suchprograms and services; and provisions for both pre- and in-serviceeducation of teachers for the gifted." 8
Among other things, the Marland Report provided policy makers with the first federal
definition of "Giftedness". Though the separatist nature of the report was later perceived
by critics as elitist, the specificity of the Marland Report seems to have induced theproliferation of activity on the state and local level that continued through the mid-1980s.
In focusing on the effects of "Reform Movement" on gifted education, Renzulli,
Reis and others have squarely placed the blame for the decline of gifted education on
political, rather than economic factors. Although more recent articles tend to make
frequent reference to the role of the economic recession of the early 1990s (Purcell, 1992,
1993)9, the evidence for the role of economic factors remains unclear. Among the more
logical assertions is that economic constraints may be responsible for increasing the
competition for resources among educational programs and agencies. Yet, as evidenced
by the aftermath of National Excellence it has been the continuing political climate, that
has removed the competitive edge that gifted education once had in the late 1970s and
early 1980s. These trends are most apparent when performing regional analyses. This is
due primarily to the varied impact of the recession across the nation and differing
political ideologies. Perhaps hardest hit by both the economic recession and political
trends in the field of gifted education has been the Northeastern U.S. , from New England
to the Mid-Atlantic states.
1.1 A Regional Perspective: The Northeast
In September of 1991 a Boston Globe front page headline read "Gifted students
face test of indifference." The article focused on the relative weakness of gifted
8Passow, H. , Rudnitski, R. (1994) p. 2729 Purcell, Jeanne (1993) The Effects of the Elimination of Gifted and Talented Programs On ParticipatingStudents and Their Parents.
3
Bruce D. BakerThe Economic Health of Gifted Education Draft as of: September 15, 1995
education in the Northeast, pointing out that "Other regions are accelerating investment in
programs for the gifted, threatening New England with loss of a longtime economic
advantage its ability to claim a better-educated work force than other areas." to Radin
pointed out that although "Maine and Connecticut offer stronger support for these
programs than other states in the region" they too were suffering from a shaky
commitment to their brightest students. Radin stated that "Connecticut, once a national
leader with programs for the gifted and talented in 150 of its 169 school districts, has seen
60 percent of its programs cut back or eliminated."" An article released in the on-line
version of The New Republic in February, 1994, by Gillian Weiss points out that "Over
the past six years, New York state's budget for gifted education has stagnated at about
$13.4 million out of a budget of approximately $9.1 billion."*
The research of Jeanne Purcell of The University of Connecticut has focused on
the decline of programs for the gifted in the state of Connecticut. In a two year study
between 1989 and 1991, Purcell surveyed districts throughout the state of Connecticut to
assess the status of gifted programs. Purcell noted that " The 1991 results indicate that
increasing numbers of Connecticut programs for the gifted are experiencing jeopardy due
to the state's continuing fiscal crisis." 12 Purcell's survey of Connecticut school districts,
which yielded a 57% response rate (74% among districts with gifted programs) indicated
that 61% of Connecticut gifted programs fell into either of three categories: 1) eliminated
2) reduced or 3) threatened. 13 In a subsequent study Purcell pointed to the adverse effects
of program elimination on gifted students and their parents. Among other things Purcell
noted that "Interviewed parents also reported that the process of program elimination
resulted in so much divisiveness that more than half of them had considered alternative
avenues for their children's remaining years in school." 14
Only recently has the perspective of the media in the Northeast begun to change.
In the Connecticut Weekly section of the New York Times (June 26, 1994) Susan
Pearsall noted that the needs of the "Best Students" were "Regaining Attention." Though
the extent to which her assessment is a reality may be questioned, the tone of the article
and anticipation that many districts would restore programs in the near future showed
promise for gifted education in the Northeast. Pearsall indicated that as many as nine
districts in Connecticut were considering bringing back gifted and talented programs for
10Radin, Charles. (1991) Gifted Students Face Test of Indifference. Boston Globe, September 3011 Radin, Charles. (1991)* figures confirmed by State of the States Reports on Education of the Gifted. 1987,199412Purcell, Jeanne. (1992) Programs for the gifted in a State Without a Mandate: An "EndangeredSpecies?" Roeper Review 15 (2) 1992 p. 9313 Purcell, Jeanne. (1992) p. 9314 Purcell, Jeanne. (1993) p. 177
4
Bruce D. BakerThe Economic Health of Gifted Education Draft as of: September 15, 1995
school year 1994-1995. This potential for positive growth was a significant turn-around
from 1991, when 18 gifted programs were eliminated in a single year.
1.2 Legal Rights of the Gifted
Few legal attempts have been made in recent years to acquire "free and
appropriate" educational programming for gifted students. Most have centered on the
definition of "exceptional" as originally expressed in P.L. 94-142 (Education for All
Handicapped Children Act, 1975). Because P.L. 94-142 itself does not include the
recognition of, or provisions for gifted students, individual case decisions have been
made according to state defined student rights. In Pennsylvania (Ellis v. Chester Upland
School District, 1994) where state guidelines have been highly specified it has been
determined that "Gifted students are exceptional students within meaning of statutes
providing for special education and related services to exceptional students. (22 Pa. Code
14.1, 14.25k)."15 However, in this particular case it was also determined that "exceptional
students, including gifted students, do not fall under statutory definition of 'eligible
student' for purposes of authorized placement in private schools (22 Pa. Coded 14.43)."
and that "To meet statutory requirements, instruction offered to exceptional students need
not 'maximize' students ability to benefit from individualized program but rather must
provide 'appropriate program' for student. 22 Pa. Code 14.1, 14.25 k."16
In Connecticut (Broadley v. Board of Education, Meriden, 1994), however, where
state guidelines are somewhat less clear, the state supreme court under Justice Palmer
recently held that:
a gifted child's right to free public education did not include a right tospecial education
the legislature's failure to mandate a program of special education didnot violate the equal rights or equal protection provisions of the StateConstitution.
Although Connecticut has for many years included funding for gifted education within its
state program for special education the state supreme court clearly concluded that a
"gifted child did not have constitutional right to free public special education under
statutes which established program of special education for certain school children" and
that "although special education statutes include gifted children among those 'exceptional'
15 Ellis v. Chester Upland School District. West's Educational Law Reporter, v. 96 (Mar. '95) p. 61716 Ellis v. Chester Upland School District. p. 617
5 8
Bruce D. BakerThe Economic Health of Gifted Education Draft as of: September 15, 1995
children who do not progress effectively without special education, special education was
mandatory only for children with disabilities."17
Each of these recent decisions, although varying widely on their perspectives of
the needs and the rights of gifted children have serious implications regarding the rights
of gifted students in the context of special education where the unquestionable majority
of similar appeals have been awarded to the plaintiffs. In addition, although the judicial
bodies of each state function with relative freedom from their respective state legislatures,
in the absence of clear federal protection for gifted students, their decisions continue to be
bound by the relative strength of state policies.
1.3 Research Questions and Possibilities for the Future
Beyond the research of Purcell, and selective presentations of data by the general
media, little substantial evidence has been presented to clearly define the economic health
of gifted education in the Northeast following the uprising of the turn of the decade.
Though comprehensive in her analyses, Purcell's latest report "The Status of Programs for
High Ability Students" again presents a snapshot of gifted education in an isolated
context. In this study, Purcell (1995) attempts to assess the status of gifted and talented
programs in nineteen states from 1991-1992 in relation to both the "economic health" of
the states, and their respective state policies regarding gifted education. Economic health,
however, was determined only in relation to one year of data (1990) and included three
general economic indicators: unemployment rate, per capita income, and state debt per
$1,000 personal income. 18 Although the results of this study indicate that state's in poor
"economic health" lacking a mandate for gifted education tend to maintain the least
comprehensive services for the gifted (according to a 54% overall survey response rate),
there is no indication of trends in programming over time, or trends in the economic
climate directly or indirectly surrounding gifted education. 19 In addition, by the time of
the release of the data (Spring, 1995) many of the economic specifications made by
Purcell had shifted dramatically. What continues to be lacking in the current literature is
the recognition of the potential effects of change in either political or economic climate
on either a micro or macro level.
If, as Purcell notes, as many as 50% of parents in districts where programs have
been eliminated may be considering alternatives for their children in the future, it may be
hypothesized that the decline of programs in the public sector may ultimately be related
17 Broadley v. Board of Education, Meriden. West's Education Law Reporter, v. 90 (June 16, 1994) p. 26518 Purcell, Jeanne,(1995) Gifted Education at a Crossroads: The Program Status Study. Gifted ChildQuarterly Vol. 39 (2) Spring , p. 5819 Purcell, Jeanne (1995) p. 63
6 9
Bruce D. BakerThe Economic Health of Gifted Education Draft as of: September 15, 1995
to a rise in demand for private supplementary programs, as well as numerous other
opportunities. Chapter 4.0 of this report will focus on the economic health of three of the
larger private supplementary programs in the Northeast. For those who would argue that
the decline of gifted education in the public schools is a victory for egalitarian education,
the potential flight of the financially gifted to private sector programs presents even more
serious implications regarding the future of socio-economic stratification of the gifted.
Education in general cannot adequately be assessed as either static or isolated,
and gifted education, like any other field in education must be assessed as component of
a dynamic ecological system. Among the classic errors of recent reports that have viewed
gifted education in isolation is Susan Pearsall's (1994) recent claim in the New York
Times that the growth in total number of pupils served in Connecticut programs indicated
an upturn in the field, when in fact, as a percentage of the state's average daily
attendance, the decline, had in reality only begun to level off as of 1992-1993. By
analyzing the policy period from 1984-1994, in the context of other events and trends,
this study will attempt to identify Pathmarks2° as well as Benchmarks for determining
the economic health of gifted education.
The policy options presented here-in, are not intended to shift the burden entirely
back to the public sector or entirely over to the private sector, but to search for
opportunities that will allow students to benefit from the best of both worlds. In some
cases, integrated models already exist. Dr. Richard Taubald of the Gifted and Talented
Youth Programs Center at Montclair State University indicates that increasing numbers
of local school districts in Northern New Jersey are contacting the program in order to
send their students to the MSU Saturday program and in the case of the Secaucus, NJ
schools, bring the MSU program and its professors into the schools. For the past three
years, the Johns Hopkins Center for Talented Youth has also made efforts to increase
their outreach to the public schools. The educational and economic benefits of such joint
ventures will be addressed in Chapter 5.0 of this report.
2.0 A Policy Perspective: Gifted Education in the Public Schools
2.1 Policy Trends in the Northeast: Mandates and Guidelines
In a study presented by Coleman and Gallagher in 1992, approximately 66% of
states were reported to have mandated services for gifted and talented students which
included state level funding. Fourteen states had no mandates, two states had no mention
20 Richards, C. E. & Hughes, J. T. (1995) The New Ecology of School Management. Theory, Tools andCases. Draft Copy,
7 1 0
Bruce D. BakerThe Economic Health of Gifted Education Draft as of: September 15, 1995
of the gifted and talented and one had a mandate with no state funding. 21 The report also
indicated that one-fifth of the states (17) included services for the gifted under P.L. 94-
142 (Education for All Handicapped Students Act). 22 With regard to teacher preparation,
The Council of State Directors (1991) report indicated that only five states required
teachers to have in service hours in order to work with gifted and talented students. 23
None of the states presented in this study (New York, New Jersey and Connecticut) have
comprehensive mandates regarding the education of gifted children.
2.11 Connecticut
Connecticut is among the states that include provisions for gifted children among
its guidelines for special education. "Connecticut's Regulations concerning Children
Requiring Special Education includes as an 'Exceptional Child' one who
'has extraordinary learning ability or outstanding talent in the creative artsthe development of which requires programs or services beyond the levelof those ordinarily provided in the regular school programs but which maybe provided through special education as part of the public schoolprogram.' 24
Although the Connecticut State Department of Education mandates that the local
school districts provide exceptional children with a full range of special education
services, in the case of gifted and talented, many services are optional:
Each board of education shall be required only to provide identification,referral and evaluation services for gifted and talented children. Theprovision of all other special education and related services to gifted andtalented children shall be at the option of each board of education. 25
In short, Connecticut's regulations for gifted education ensure that districts will identify,
but not serve their gifted populations.
21Passow, H. & Rudnitski (1993) p. x22Passow, H. & Rudnitski (1993) p. xi23 Passow, H. & Rudnitski (1993) p. xiv
24 Passow, H. & Rudnitski (1993) p. xiv25 Passow, H. & Rudnitski (1993) p. xiv
8 Li
Bruce D. BakerThe Economic Health of Gifted Education Draft as of: September 15, 1995
2.12 New York
New York state has traditionally provided funding to local school districts for
gifted education, and although the state requires that districts identify gifted students
there has never been a mandate that districts provide programming for those students.
Under section 3602 of the state's Education Law: if a school district does not wish to
conduct a program for educating the gifted as prescribed, that district will not receive the
formula allotment. 26 The state, however, does provide several recommendations for local
districts. According to Passow and Rudnitski (1993) "New York recommends that each
district establish a broadly representative committee to write a plan for educating the
gifted which, ideally, would include the following sections:"
1. District's philosophy and definition of gifted2. Program goals and objectives3. Identification procedures4. Programming (curriculum and instruction)5. Program evaluation procedures6. Teacher selection and education7. Program management-roles and responsibilities;communication and
awareness; budget, facilities and supplies8. Timeline for activities 27
Also according to Passow and Rudnitski (1993) New York state's board of regents have
historically played an active role in supporting the education of gifted children. "First
issued in 1976 and restated since, the New York state Regents' philosophy has been
expressed as follows:
Because these pupils have the ability to make rich contributions to ourculture and society, developing their individual abilities and building ontheir unique strengths becomes a matter of great importance.
As a group, they constitute an unidentified minority that cuts across alleconomic, social, racial, and cultural segments of society. They can befound at all ages, in all occupations and in both sexes.
Additionally, it is the position of the Regents that the quality of"giftedness" can occur in varied ways, may emerge at differentdevelopmental states, and must be assessed by trained staff on a periodicbasis, K-12.
26 pas- -w,so H. & Rudnitski (1993) p. 727 Passow, H. & Rudnitski (1993) p. 7
9 12
Bruce D. BakerThe Economic Health of Gifted Education Draft as of: September 15, 1995
Although the state of New York has never mandated either the identification of, or
educational programming for gifted children, the department of education has historically
shown their support through funding and philosophical guidelines for educational
programming.
2.13 New Jersey
Like Connecticut and New York, New Jersey has never taken a decisive step
toward mandating special programs for gifted and talented students. The state does,
however, require that opportunities be made available to gifted students. New Jersey has,
in general, adopted a pro-active approach to the development and dissemination of model
programs for the gifted and talented. The dissemination strategy began with the
appointment of a state director and four regional coordinators in the late 1970s. Each of
these positions were subsequently eliminated in the 1980s. During the middle portion of
the policy period to be analyzed (1985-86 to 1989-90) the New Jersey department of
education played an active role in monitoring programs for special populations, including
programs for the gifted. Integral to the success of New Jersey's dissemination program is
the role of program evaluation. The New Jersey Department of Education provides
specific guidelines with regard to evaluation of gifted programs. According to Passow
and Rudnitski (1993) "New Jersey's state plan recommends that both formative and
summative evaluation are needed:
Formative evaluation should take place during each step in thedevelopment of a program, i.e., needs assessment, goal development,identification, curriculum differentiation, planning for facilities andsupplies, staff training, evaluation procedures, and scheduling of timelines.Based upon continuing formative evaluation, necessary changes may bemade to improve and/or expand the program during the school year.
Summative evaluation should take place after each phase ofimplementation to insure that the established goals and objectives arebeing met. An important aspect of the summative evaluation should beassessment of pupil progress. Based upon this evaluation, necessarychanges or adaptations to the program may be planned and implementedduring the following school year." 28
Since the 1989-1990 school year, with the discontinuation of program monitoring,
evaluation of programs has been placed back in the hands of local districts. Prior to 1992,
28 Passow, H. & Rudnitski (1993) p. 59
10 13
Bruce D. BakerThe Economic Health of Gifted Education Draft as of: September 15, 1995
program evaluation had been a key component of a district's ability to receive competitive
grant funding as described in the next section of this report. With the removal of the
competitive grants program, although it affected only a few districts, the incentive to
conduct thorough program evaluation has effectively been eliminated.
2.2 Models for Funding Gifted Education
As previously stated, Coleman and Gallagher (1992) reported that two-thirds of
the states "have some type of mandate regarding attention to gifted students, which is
supported to some degree, with state funding."29 The council of state directors (1991)
estimated that a total of nearly $395 million of state dollars were allocated to either local
education or intermediate agencies for gifted education. 30 Passow and Rudnitski (1993)
note that levels of total state funding ranged from $88 million to $100,000 at the time of
their study.31
Both New York State and Connecticut have provided per pupil allocations to local
districts for gifted education for part or all of the policy period 1984 to 1994. During this
policy period, New York state allocations for gifted education have ranged from
approximately $4 million in 1983-1984 (excluding the 5 largest districts)32 to $13.3
million (all districts and agencies), and Connecticut expenditures have ranged from $0
(current) to approximately $9 million (1990). Although New Jersey has not provided per
pupil allocations, for several years, competitive grants were available for the development
and dissemination of model programs. New Jersey's total spending on gifted education
has ranged from $0 (current) to $200,000 at its peak in the mid 1980s.
2.21 Connecticut
Prior to school-year 1989-1990, both handicapped and gifted and talented
expenditures were reimbursed on a 30% to 70% sliding scale based on town wealth. For
school year 1989-1990 the range for reimbursement was expanded to 25% to 70%. In
1990-1991 and 1991-1992 grants for handicapped were reduced to a 10% to 70% scale
and grants for gifted and talented to a 5% to 35% scale. Finally in 1992-1993 the scale for
handicapped students was reduced to a 0% to 70% scale (with a 2% floor) and funding
for gifted and talented was eliminated. 33 Reimbursements to local districts were paid in
29 Passow, H. & Rudnitski (1993) p. xiv30 Passow, H. & Rudnitski (1993) p. xiv31 Passow, H. & Rudnitski (1993) p. xiv32 Curley, John (1991) Financing Programs for Education of the Gifted in New York State. Journal ofEducation Finance. 16 (Winter)33Mahoney, Brian. (1995) CT Department of Education. Bureau of Grants Services. PersonalCommunication
11 14
Bruce D. BakerThe Economic Health of Gifted Education Draft as of: September 15, 1995
the year subsequent to the expenditures. The removal of funds from the 1992-1993
budget had severe implications for districts who had received funding in the previous
years and had spent substantial funds in school year 1991-1992 expecting reimbursement
in school year 1992-1993.
Connecticut's current ECS (Education Cost Sharing) formula still does contain
some incentive, however minimal, for districts to maintain gifted and talented programs.
Within the formula, local districts are required to meet minimum levels of spending
(MER: Minimum Expenditure Requirement). Previously, reimbursable expenditures
were not allowable as MER expenditures. With reimbursement no-longer a factor, local
dollars spent on gifted and talented education may be counted toward the district's MER.
34
2.22 New York
In New York State, both per pupil allocations and special legislative grants exist
for local districts offering programs for gifted and talented pupils. In 1980-81 the state
began distributing funds at a per pupil level of $8 for diagnostic testing and screening of
pupils in all school districts. Since 1981-1982 funds for education of the gifted and
talented have been allocated to local districts by a categorical aid formula. 35 Initial Flat
Grant funding was set at $40 in 1981-1982. Subsequent increases brought the funding
level to $192 by 1987-1988 and finally $196 by 1988-1989 where it has remained since.
Funds are distributed on a flat grant basis according to the following formula:
Flat Grant Level X .03 X Average Daily Attendance
Special legislative grants are allocated to local districts in New York for a variety of
educational projects including those related to gifted education. Legislative grants are
paid by reimbursement to local districts upon approval of project expenditures. 36
Between 1988 and 1994, funds for gifted education related grants decreased from $2.8
million to $545,000. 37
2.23 New Jersey
The history of funding for gifted education in New Jersey is somewhat different
than that of either of the other two states. New Jersey first allocated funds for gifted
34Mahoney, Brian (1995)35Curley, John. (1991) 332-34736Curley, John (1991)37Brown, Delbert (1995) New York Department of Education. Personal Communication
Bruce D. BakerThe Economic Health of Gifted Education Draft as of: September 15, 1995
education in 1976. $100,000 was allocated to appoint a state director (Ted Gourley) and
four regional coordinators. The role of the director and regional coordinators was to
design and implement model activities for gifted children in districts throughout the state.
Among the early products of the state supported team was the Olympics of the Mind
(now Cognetics). The philosophy underlying the New Jersey model was, and has
continued to be based on development and dissemination of model programs. In 1980-
1981 additional funds were provided to begin a competitive grant program. Through this
program, local districts were allocated funds in order to develop model programs.
Districts applied for funding on an annual basis according to the following guidelines:
"Local district proposals must include a rationale for the proposed
program, a statement to support its effectiveness, a work plan, and a
statement to support its portability or replicability."38
Although the state eliminated the regional coordinator positions in 1982-1983, the state
continued to allocate competitive grants totaling approximately $200,000 until school
year 1986-1987 when the amount was decreased to $150,000. Funding was subsequently
removed for the competitive grants program in 1992. Currently, activities and programs
for gifted and talented students are overseen by the state's Education Information
Resource Centers. 39
2.3 Beyond the Framework of this Study
This particular study focuses its attention on the economic health of gifted
education as seen in "typical" public schools with heterogeneous populations and school-
year gifted programs. Emphasis is placed on programs that are specifically identified as
meeting the needs of gifted and talented students. Upon closer look, one will find many
other opportunities available to gifted public school students throughout the selected
states. The New York metropolitan area in particular, provides many examples. Within
New York city itself are several magnet and alternative schools, to which students may
apply to attend. Among these are, The Bronx High School of Science and Stuyvesant
High School. In addition Brooklyn's district 18 provides an extensive gifted and talented
program and is identified as a district of choice which students from throughout the city
may attend.* New York State's board of Regents also mandates that local districts must
provide vertical acceleration in the following manner:
38 Passow, H. & Rudnitski (1993) p. 5939 Gourley, T. & Dorhout (1995) A. Personal Communication May, 1995' transportation is not provided for out of district pupils
Bruce D. BakerThe Economic Health of Gifted Education Draft as of: September 15, 1995
...eighth grade students who have demonstrated readiness "shall have theopportunity to take high school courses in Regents mathematics and in atleast one of the following areas: English, social studies, second language,art, music, occupational education subjects, Regents science courses" andbe awarded high school credit for such courses. In high school, the studentmay receive up to 6 1/2 units of credit by taking a state-approved or state-developed examination and achieving a score of 85 percent."40
For many years, the NY state legislature has also promoted the formation of "Excelsior
Schools", originally to be a boarding program for gifted students from throughout the
state.41 Recent modifications of the proposal had limited the program to commuters from
the Albany area, and current budget constraints have threatened the removal of the
program altogether. New York does continue however to offer Summer opportunities for
gifted and talented students.
New Jersey also continues to offer its governors school programs to high school
students having just completed their junior year. In addition, the state continues to
coordinate many of the activities developed in the 1980s, such as Cognetics, through its
EIRC. Some districts have also begun to establish partnerships with university sponsored
programs that include either providing tuition vouchers, or in the case of Secaucus, bring
the program to the school. These and other "non-traditional" options will be discussed in
detail at a later point in this report.
3.0 An Economic Perspective: Gifted Education in the Public Schools
As suggested earlier, a new approach is necessary in order to adequately
determine the economic health of gifted education. Integral to the following analyses are
the ideas that:
Gifted education cannot be analyzed as an isolated component of asystem. It must be analyzed in the context of education in general andin the sub-context of special education. (furthermore that anycomponent of education cannot be analyzed in the absence ofconsideration for general economic and demographic trends.)
The dynamics of gifted education must be analyzed in addition to thestatics that have comprised the bulk of the current literature. Efforts
40 Passow, H. & Rudnitski, R.41 Dao, James (1994) Cuomo Urges Schools for Gifted Students. New York Times, April 15
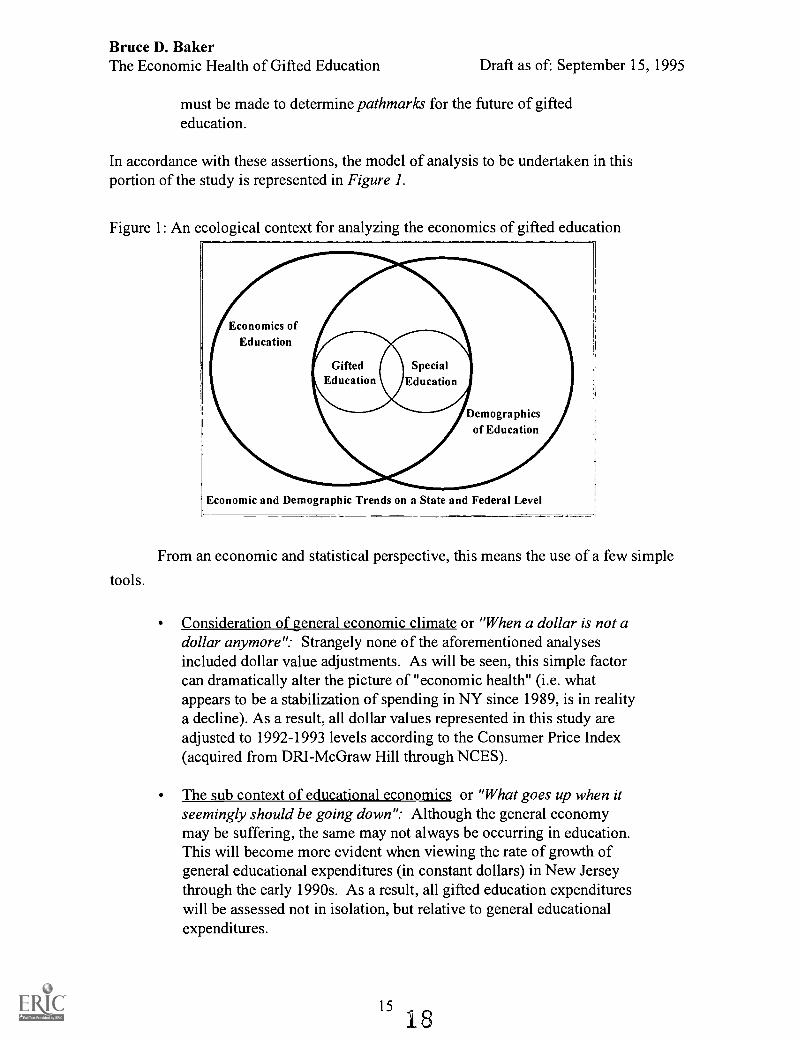
Bruce D. BakerThe Economic Health of Gifted Education Draft as of: September 15, 1995
must be made to determine pathmarks for the future of giftededucation.
In accordance with these assertions, the model of analysis to be undertaken in thisportion of the study is represented in Figure 1.
Figure 1: An ecological context for analyzing the economics of gifted education
tools.
Economic and Demographic Trends on a State and Federal Level
From an economic and statistical perspective, this means the use of a few simple
Consideration of general economic climate or "When a dollar is not adollar anymore": Strangely none of the aforementioned analysesincluded dollar value adjustments. As will be seen, this simple factorcan dramatically alter the picture of "economic health" (i.e. whatappears to be a stabilization of spending in NY since 1989, is in realitya decline). As a result, all dollar values represented in this study areadjusted to 1992-1993 levels according to the Consumer Price Index(acquired from DRI-McGraw Hill through NCES).
The sub context of educational economics or "What goes up when itseemingly should be going down": Although the general economymay be suffering, the same may not always be occurring in education.This will become more evident when viewing the rate of growth ofgeneral educational expenditures (in constant dollars) in New Jerseythrough the early 1990s. As a result, all gifted education expenditureswill be assessed not in isolation, but relative to general educationalexpenditures.
15
Bruce D. BakerThe Economic Health of Gifted Education Draft as of: September 15, 1995
The role of demographics: One cannot simply be concerned with thenumber of students either identified or served in gifted programswithout considering the numbers NOT being served or identified. As aresult, all gifted population assessments presented in this study will bepresented as a percent of Average Daily Attendance of the specifiedstate (data acquired from NCES).
3.1 State-level spending: Longitudinal Trends 1984-1994
For each of the states, Connecticut, New York and New Jersey, state departments
of education were contacted and the following data requested:
State dollars allocated to gifted education (1984-1994)
Per pupil allocations to gifted education (1984-1994)
Numbers of pupils Identified and Served (1984-1994)
Numbers of districts with gifted and talented programs (1984-1994)
In addition, the following contextual data was acquired through Vance Grant of the
National Center for Education Statistics or appeared in a report entitled Historical
Trends: State Education Facts 1969-1989 (NCES):
Total current educational expenditures for each state (state & local)
(1984-1993)
Average daily attendance for each state (1984-1994)
Numbers of pupils served by IDEA/Chapter 1 (1984-1994)
3.11 Connecticut Spending
Chart 1 shows Connecticut's state spending levels to gifted education in constant
1992-1993 dollars. Spending levels for 1987-1989 are based on an estimated $9 million
(current dollars) in allocations while gifted education was still a component of special
education. Spending levels between 1989-90 and 1990-91 are based on actual allocated
reimbursements to local districts. As previously mentioned, reimbursements were
removed from the state budget for the 1992-1993 year, negatively impacting schools in
their 1991-1992 spending years.
Assumptions based on the sliding scale of reimbursement were that slightly over
50% of gifted program expenditures were reimbursed by the state prior to 1989. When
the scale was effectively halved in 1989, the assumption was that approximately 25% of
local gifted program spending would be reimbursed by the state. Local level data
provided by Connecticut's state department of education for school years 1989-'90 and
16 19
Bruce D. BakerThe Economic Health of Gifted Education Draft as of: September 15, 1995
1990-'91 suggest rather that 19.2% and 19.8% of local level spending was reimbursedrespectively. 42
Chart 2 displays per pupil expenditures to gifted pupils as a percent of total per
pupil expenditures. Gifted pupil expenditures were determined using New York state's
formula for allocation. The estimated and actual total state budgets for gifted education
used in Chart 1 were divided by an assumed gifted population of approximately 3% of the
statewide average daily attendance. These allocation levels were compared against total
per pupil expenditure data acquired from the National Center for Education Statistics.
The trend displayed in Chart 2 represents the same major turning points as Chart 1,
however, the percentages in Chart 2 indicate that the level of support, at its peak was a
relatively small slice of total educational expenditures (approximately 10% of
expenditures for 3% of the average daily attendance).
Chart 3 is perhaps most indicative of the relative changes that have occurred in
gifted education spending in the past decade. As might be expected, general education
funding was still experiencing positive growth (adjusted for inflation) through school
year 1989-'90. In contrast, gifted education spending was just beginning its rapid decline.
While general educational expenditures experienced rates of decline of only between -
1.1% and -3.6% (again adjusted for inflation), gifted education expenditures were cut
entirely from the state budget.
3.12 Connecticut Programs
Chart 4 indicates the number of districts maintaining programs specified for gifted
and talented children in Connecticut between 1989-90 and 1994-95. Data was acquired
from Dr. Alan White of the Connecticut State Department of Education and is the same
as that used by Susan Pearsall of the NY Times in June of 1994. One additional year
(1994-1995) of data is included, and seemingly contradicts Pearsall's expectations of an
upswing. It is clear, however, that the rate of decline has level over the past two school
years.
3.13 Connecticut Pupils
Chart 5 displays the numbers of students identified and/or served in gifted and
talented programs as a percentage of statewide average daily attendance. In contrast with
the New York Times report of significant gains (an additional 275 pupils) between school
years 1991-1992 and 1992-1993, Chart 5 displays a gain of only .01% (from 2.26% to
42Mahoney, Brian. (1995)
Bruce D. BakerThe Economic Health of Gifted Education Draft as of: September 15, 1995
2.27%). Clearly the number of pupils identified has continued to grow as a percent of
average daily attendance.
Chart 6 presents an analysis of gifted students receiving special services in a the
context of special education during the mid to late 1980s. Chart 6 indicates that the
number of special education pupils served in Connecticut reached a five year high 5.8:1
ratio with respect to the gifted population served. Strangely, this appears to have occurred
as a result of a one year decline in the number of gifted pupils served rather than a rapid
growth in the special education population. In fact, in the same year the number of
special education students served declined slightly (-0.5%) and continued to decline
through 1988-1989.
According to Thomas Parrish of the Center for Special Education Finance, Special
education expenditures (and related services) in Connecticut for the same year totaled
over $414 million, approximately 15% of the state's total educational spending. 43 The
majority of this funding was allocated at the state (38.89%) and local (56.37%) levels. It
might be expected then, that since pupil ratios were on the order of 5 to 1 (IDEA &
Chapter 1 to Gifted and Talented) that expenditures for gifted and talented, since they
were reimbursed on the same scale as special education expenditures might equal
approximately 20% of the state allocations to special education. This would have
provided gifted education with approximately $32 million dollars at the time, when in
reality, estimates suggest that expenditures to gifted education were approximately $9
million.
3.21 New York Funding
New York state continues to be among the region's strongest financial supporters
of gifted education. Yet even New York has not been immune to the decline of the field
in recent years. New York's losses in gifted education have been somewhat masked by
the fact that per pupil allocations have been provided as a flat grant rather than as a
percent of expenditures over time. Although total spending and per pupil spending grew
rapidly in the 1980s, that stagnation of spending levels since 1988 has resulted in a
gradual decline in the economic health of gifted education in New York since that time.
Chart 7 displays both the rapid increase in total budget in the 1980s and the subsequent
gradual decline throughout the first half of this decade (all dollars represent constant
1992-1993 dollars).
43 Determined according to total state expenditures reported by NCES in "Historical Trends: StateEducation Facts 1969-1989" and reported expenditures of $414,328,000 for special education according toParrish, Thomas. (1994) The current federal role in special education funding. Center For SpecialEducation Finance
Bruce D. BakerThe Economic Health of Gifted Education Draft as of: September 15, 1995
Chart 8 displays the similar trends that have occurred in per pupil spending levels
as a percent of total per pupil expenditures, yet indicates even more rapid and consistent
growth throughout the early 1980s. Here the rate of decline appears to be increased by
the relative growth in total per pupil expenditures. Gifted and talented per pupil
expenditures decreased from nearly 3% of total expenditures to 2.2%, or a relative loss of
nearly 27% over the six year period from 1986-87 to 1992-93. The decline extends back
to the period when the flat grant was only increased from $192 to $196.
New York is the only state presented in these analyses for which there appear not
to be major discrepancies between total education spending practices and gifted education
spending practices. While education in the state was experiencing overall growth in
spending in the early 1980s, perhaps a result of the 1980s reform movement, allocations
to gifted education experienced significant growth, primarily a result of program start-up.
Unlike New Jersey and Connecticut, however, as total spending began to level off in the
late 1980s and early 1990s, spending for gifted and talented programming experienced
losses equal only to the deflation rate of the dollar. Chart 9 displays the comparison
between change in total educational expenditures with change in state allocations to
gifted education from school year 1984-'85 through school year 1992-'93.
3.22 New York Pupils
Tracking numbers of pupils participating in New York's gifted and talented
programs has been somewhat more of a difficult task. Chart 10 displays numbers of
pupils identified and served in gifted programs as generated by two separate sources.
John Curley's data, which is used for the period between 1983-'84 and 1987-'88 shows
significantly smaller total numbers because the states largest five districts were not
included in his study. Curley's technique approximately halved the state's total student
population. It is impossible, however, to make assumptions about the level of
participation in this districts based on the others in the sample due to the extent of
characteristic differences of these districts (New York City, Yonkers, Buffalo, Syracuse
and Rochester). Data for school years 1988-'89 and 1992-'93 was obtained from the
"State of the States" reports (1987, 1994) on education of the gifted and talented and
reflect the total number of students served state-wide." Though it is questionable what
occurred between the years 1988-'89 and 1992-93, there is a marked net loss over the
period relative to total average daily attendance.
Like the previous two disjoint analyses of New York state, what is most
interesting about Chart 11 is what is not included. Comparing gifted and talented pupils
served in only half of the state's population with IDEA/Chapter 1 pupils for the entire
44 Council of State Directors of Programs for the Gifted.(1987, 1994) State of the States Report.
19 22
Bruce D. BakerThe Economic Health of Gifted Education Draft as of: September 15, 1995
ADA, yields not only a low ratio of less than 4:1, but a ratio that declines to nearly 3:1
over the period from 1983-'84 to 1987-'88. When numbers are employed that account for
the entire state's gifted population, a ratio of only 2:1 exists. Although a ratio of only 3:1*
existed among special education to gifted education students in 1987-1988, state
spending on special education exceeded $1.5 billion dollars compared to 13.3 million for
gifted education for a ratio of 118:1.
3.31 New Jersey Funding
Although New Jersey's state level of spending on gifted education is perhaps
negligible throughout the policy period being analyzed, it does perhaps reflect the
philosophy of the state department of education toward its own dissemination model for
programs for the gifted. Like New York, gifted expenditures were never provided the
benefit of being allocated according to dollar value. Static competitive grants remained
available through school year 1991-1992, when they were cut entirely, as the legislature
attempted again to reshape a budget to meet the constraints of ongoing equity litigation.
Chart 12 shows the gradual, then rapid decline of New Jersey state spending on gifted
education throughout the policy period.
Interestingly in New Jersey, each of the major cuts in gifted and talented funding
came against significant growth in total educational spending (adjusted for inflation).
The losses to gifted education in New Jersey are clearly disproportionate in the years of
each of the cuts. Although it can be argued that competitive grants to gifted education and
regional coordinators were relatively small to begin with, and their elimination should not
have a significant impact, it can also be argued that such small cuts to the total budget
provide only minimal savings. Chart 13 displays changes in total educational spending in
New Jersey compared with changes in state allocations to gifted education.
3.32 New Jersey Pupils
Available data for New Jersey pupils participating in gifted and talented programs
was sparse at best. Between 1986-'87 and 1988-'89 the New Jersey State Department of
Education reported a gain from 9.9% to 11.3% of the total school population participating
in gifted and talented programs. Employing average daily attendance as reported by
NCES, in place of total school population the percent of gifted pupils served exceeds
12%. In a recent conversation with Ted Gourley, former state director of gifted
education, currently with the Education Information Resource Center, Dr. Gourley
estimated that approximately 80,000 students are currently served in gifted and talented
* note that this ratio is artificially elevated by the non-counted Gifted and Talented pupils in the five largestdistricts
Bruce D. BakerThe Economic Health of Gifted Education Draft as of: September 15, 1995
programs, which would equal approximately 7.6% of the 1992-1993 average daily
attendance. Chart 14 displays the sparse comparisons available for New Jersey
throughout the policy period.
At its peak, gifted education in New Jersey in the late 1980s closely rivaled
special education in numbers of pupils served. Chart 15 displays that the ratio of IDEA
and Chapter 1 pupils to gifted and talented pupils served had dropped below 1.5:1 by
1988-'89. This ratio is significantly lower than either of New Jersey's tri-state
counterparts. While New Jersey has been weak on state support for gifted education,
more than 78% of special education dollars in 1987-'88 came from the state. Total
expenditures (federal, state and local) to special education exceeded $500 million dollars
in 1987-'88, yielding a state share of $394.8 million.
4.0 An Economic Perspective: The Rise of Private and University Programs for the
Gifted
Around the time of the surge in growth of gifted and talented programs in the
public schools, came the birth of numerous private and university sponsored programs for
gifted and talented students. Perhaps linked to the national interest raised by the 1972
Marland Report Universities such as Johns Hopkins University in Baltimore Maryland
began conducting extensive research on gifted and/or precocious youth. Ultimately, these
studies, including Dr. Julian Stanley's longitudinal study of Mathematically Precocious
Youth led to the development of weekend, after school, and eventually Summer
residential programs for gifted and talented students. The following analyses will focus
on three such programs in the Northeast: Johns Hopkins Center for Talented Youth;
College Gifted Programs Summer Institute for the Gifted; and Montclair State
University's Academically Gifted and Talented Youth Program Center.
Each of these programs were founded in the late 1970s or early 1980s, when
gifted education in the public schools in the Northeast was apparently achieving its
greatest growth. Each of these programs require tuition to attend, ranging from $400 for
a semester at Montclair State to $2,150 for three weeks in residence at The Summer
Institute for the Gifted. Financial aid offered by the programs is minimal. Overall, the
growth in these programs has been phenomenal. It might be assumed that the growth in
interest in gifted education spurred this growth in the 1980s, but it might also be assumed
that due to the relative strength of public school programs at the time, there was less of a
need for supplementary programs.
Considering both economic and political circumstances, the early 1990s should
have clearly been the most difficult time for these programs. One might assume that
since homogeneous groups within classrooms, and homogeneous classes within schools
21 2 4
Bruce D. BakerThe Economic Health of Gifted Education Draft as of: September 15, 1995
had been tagged "politically incorrect", there would be little interest in supporting an
entirely homogeneous summer program or weekend school. In addition, it could be
expected that the rising tuition levels of these programs would have had a negative impact
on enrollments during the economic recession of the early 1990s. In the analyses that
follow, however, none of these factors seem to have had a negative effect on the
programs observed. Quite to the contrary, the reform movement of the early 1990s seems
to have stimulated the rapid growth of gifted education in the private sector.
College Gifted Programs
Chart 16 displays the growth of College Gifted Programs: Summer Institute for
the Gifted in both student enrollment and tuition levels (in constant 1992-'93 dollars)
from 1984 through 1994. Originally affiliated with Montclair State University, College
Gifted Programs, under the direction of Dr. Carl Gottschall and Dr. Phil Zipse, opened
its first three week Summer boarding session in 1984 at Blair Academy in New Jersey.
Dr. Albert Dorhout, one of New Jersey's then former regional coordinators for gifted
education assisted in the development of the program. Since the opening of the first
campus in 1984, three additional sessions (Newtown, PA 1986, Bryn Mawr, PA 1990 and
Poughkeepsie, NY 1991) have been established, now housing an average of over 250
pupils each per Summer. In 1994, the Blair Academy session was moved to Drew
University in Madison, NJ. The majority of students attending the program over the
years have been public school students from New Jersey, Pennsylvania and New York
respectively. Enrollment of Connecticut students has increased since the opening of the
Vassar College session in 1991.
Perhaps what is most interesting, is that the program experienced its greatest
growth during both the reform movement and the economic recession of the early 1990s.
In fact, the program was able to establish two entirely new sessions (the largest two)
during that time despite tuition levels, which were already the highest of any program of
its kind, and continued to increase at a rate greater than inflation.
Johns Hopkins University: Center for Talented Youth
In 1980, Johns Hopkins University offered its first Summer academic program
for highly able middle school students. Just over one hundred students participated in the
first year of the program which was run under the auspices of the Office of Talent
Identification and Development (OTID) and the Program for Verbally Gifted Youth
2225
Bruce D. BakerThe Economic Health of Gifted Education Draft as of: September 15, 1995
(PVGY). 45 Advanced courses in mathematics were already being offered by the
university through its Study of Mathematically Precocious Youth (SMPY) which was
founded in 1971 by Dr. Julian Stanley.46 In 1981, 221 students participated in the second
CTY Summer session held at St. Mary's College in Maryland. By this time, the annual
OTID/PVGY talent search had grown to 15,000 students. Among OTID's early
experiments (1981) was an arrangement with the Delaware State Board of Education to
provide advanced math and science courses. In 1982, the program was expanded and
relocated to two campuses in Pennsylvania (Dickinson College, Carlisle and Franklin &
Marshall College, Lancaster) and the commuter program was continued at Johns Hopkins
University. In 1983, OTID officially became CTY, again offering two residential
programs and expanding commuter services into New Jersey (Newark Academy,
Livingston) and California (Windward School, Los Angeles). 47
Since the early 1980s CTY Summer programs have experienced remarkable
growth. Chart 17 displays both enrollment growth and tuition increases for CTY's "older
students" (grades 7+) residential programs from 1982 to 1992. In more recent years CTY
has opened "Young Students" (grades 4-6) residential programs, the first of which was
held at Goucher College (MD) in 1992. An additional "Young Students" site was added
in 1994 at Connecticut College (New London). Since the opening of the "Young
Students" programs, enrollments in these sessions alone have grown to 1,700.48 Like
College Gifted Programs this rate of growth seems to contradict both the political
sentiment of the times and the economic climate. Given the picture painted of the
Connecticut economic climate of the early 1990s, few in business would have considered
Connecticut as a likely location for expansion, yet this proved to be a highly successful
venture for CTY.
Chart 18 displays the number of students participating in the annual CTY Talent
Search from 1982 to 1992. The talent search process is generally considered to be the
selection process for CTY's Summer residential programs, but many students participate
in the process for other reasons, including personal status, or admission into other similar
programs. Due to these peculiarities, Talent Search participation does not always reflect
trends in actual program enrollment. Here, there appears to be some decline concurrent
with the height of public school programming for the gifted. The decline, however, makes
45 Corazza, Luciano. 1992 Academic Programs Report: A Brief History of CTY's Academic Programs.Center for Talented Youth. Johns Hopkins University46 Renzulli, Joseph. (1986) Systems and Models for Developing Programs for the Gifted and Talented.Creative Learning Press. p. 347Corazza, Luciano. (1992)48Kramer, Art. (1995) Director of CTY Academic Programs. Personal Communication.
Bruce D. BakerThe Economic Health of Gifted Education Draft as of: September 15, 1995
a rapid turn around between 1988 and 1990 and continues through the close of the data in
1992.
Chart 19 and Chart 20 are perhaps the most revealing for the context of this study.
Each of the charts displays significant increases in students being sent to CTY Summer
programs from the Northeast as a region, and Connecticut, New Jersey and New York in
particular. In fact, Connecticut, New Jersey and New York all rank in the top ten as
sending states (1987-1992) not only to CTY's programs in Pennsylvania, New York and
Massachusetts, but also to CTY's program in Geneva, Switzerland. 49 New York and New
Jersey place in the top ten as sending states for CTY's Redlands, California program.
Chart 20 displays the outstanding rate of growth in regional participation for the Mid-
Atlantic states and relative significant increases in participation in New England States.
Specific data for Connecticut, New York and New Jersey are presented in Table 1. Each
state ranks in the top eight in increased participation from 1987-1992.
Table 1: Top eight states for increases in enrollment to CTY Summer programs (grades7+) 1987-1992
State Percent Increase
Massachusetts 92%
California 55%
Pennsylvania 45%
Connecticut 43%
New York 42%
New Jersey 38%
Maryland 30%
Virginia 23%
Montclair State University: Academically Talented and Gifted Youth Programs Center
Montclair State University, formerly Montclair State College, began their
programs for academically talented youth in the early 1980s under the direction of Dr.
Carl Gottschall and Dr. Phil Zipse (founders of College Gifted Programs). Until the early
1990s, the program remained affiliated with College Gifted Programs, and continued to
offer both weekend semester programs and Summer commuter programs. Since the
separation of College Gifted Programs from Montclair State University, competition for
Summer enrollments has increased. This may in part explain the relatively soft, and
49Corazza, Luciano (1995)
Bruce D. BakerThe Economic Health of Gifted Education Draft as of: September 15, 1995
widely fluctuating enrollment figures seen in Chart 22. In fact, in the Summer of 1994,
no session was offered at Montclair State University for the first time in twelve years.
In recent years, Dr. Richard Taubald of the department of Continuing Education at
Montclair State University has assumed responsibility for the Academically
Gifted/Talented Youth Programs and has begun to make attempts to revitalize both the
Summer session and the weekend semester program, which by comparison with their
residential counterparts at College Gifted Programs, have not experienced the expected
rate of growth. Chart 21 displays the enrollment and tuition levels for the Weekend
Semester program at Montclair State University. Although a steep decline is apparent
from 1991 through 1994, enrollment figures for the 1994-1995 school year rebounded to
1,056 from the previous year's 915 and the Summer session was reinstated with an
enrollment of 56 pupils.
The Montclair State University programs are without question the most affordable
option for many parents, but they have not reaped the benefits of the decline of public
school gifted and talented programming to the same extent as the Summer residential
programs. Many factors may be responsible for the lagging growth of the MSU
programs. As a commuter program, MSU relies primarily on New Jersey enrollment,
although limited numbers of students do travel to the program from New York State. By
the previous analyses, New Jersey seems to have been affected significantly less than
Connecticut, and perhaps even New York by the decline of state-level gifted education
funding to the public schools." New Jersey has also lagged behind its tri-state
counterparts in sending rate growth to residential gifted programs.5i In addition, the
reorganization of the Montclair State Academically Gifted/Talented Youth Programs over
the past few years has played a significant role in the program's ability to attract new
students. What becomes apparent by comparison of MSU, CTY and SIG, is that tuition
levels seem to play an insignificant role in enrollment growth. It can therefore be
assumed that the clientele currently being served by private and university programs is
one for whom substantial disposable income is readily available.
50New Jersey is the only state of the three which never provided per pupil allocations for gifted in the firstplace, therefore its losses in the early 1990s were insignificant.5IRefer to Table 1, CTY's top eight states for increase in sending rate (1987-1992)
Bruce D. BakerThe Economic Health of Gifted Education Draft as of: September 15, 1995
5.0 Policy Options
Public School /University Partnership Models: The Montclair State Experiment
Bringing the Program to the Schools
In 1994, Pat Cocucci of the Secaucus (NJ) Public School requested a proposal
from the Academically Gifted and Talented Youth Programs Center (AG/TYP) at
Montclair State College to "provide academically gifted students in grades 4-6 from the
town of Secaucus with a supplementary mathematics/science and humanities
experience."52 In response, Dr. Richard Taubald of AG/TYP arranged two four day
sessions in which professors from Montclair State University, involved with the AG/TYP
summer and weekend programs traveled to the Secaucus school district to implement
differentiated curricula designed within the AG/TYP programs. The professors from the
program worked with students from 9-12 noon on "Experimental Chemistry" and from 1-
4pm on a minicourse entitled "Legendary Figures of the Middle Ages."
Although limited in scope the first time around, the arrangement between
Secaucus and AG/TYP emphasized the ability of a local school district to make use of
existing "market tested" opportunities for gifted and talented pupils. Within their 1995
brochure, AG/TYP lists 45 such enrichment or accelerative opportunities for gifted
children in grades 4 through 10. The ability of a school district to pick and choose from
available opportunities and pre-trained faculty significantly reduces the difficulties
associated the development and implementation of an in-house gifted program, and
selection of a program coordinator.
Unfortunately, the expansion of such a program would require that fees and
expenses be attached to support the program's staff and materials costs. For districts
unable to fully support in-house programs, the required investment may, however, be
accessible. For example, if AG/TYP were to provide stipends per course of as much as
$1000 and consider the inclusion of a materials fee of up to $200, a local school district
could run up to 30 such mini-courses (a total of 360 instructional hours/2 hours per
school day) in one school-year for less than the cost of an additional staff member.
Ideally, schools should initiate such a program in addition to rather than in place of other
opportunities. Although the fee for service indicated here is high, districts who could not
afford the additional staff in the first place, would most likely opt for far fewer than 30
52 Taubald, Richard. (1994) Program Proposal to the Secaucus Public Schools. Montclair StateUniversity, AG/TYP
26
Bruce D. BakerThe Economic Health of Gifted Education Draft as of: September 15, 1995
mini-courses. In addition, it is unlikely that costs would need to be as high as expressed
here, and package deals of 10, 15 or 20 courses may be arranged at decreased cost.
In order to provide an incentive for state colleges and universities to implement
such programs, it could be suggested that the state re-introduce even its previous level of
spending ($200,000) in support to these programs in order to decrease the cost to local
districts. Under ideal circumstances, this aid should be applied to supplement program
costs for area districts with the greatest need. The general framework for this model may
be applied throughout the region where university run programs already exist, or where
interest is significant.
Tuition/Transportation Vouchers for students in nearby districts
Perhaps one reason that the plaintiffs request in Ellis v. Chester Upland School
District was not covered by Pennsylvania's mandate for special education was the
potential for exorbitant costs to be incurred by local school districts in making numerous
out of district placements for gifted children for full year programs. Under ideal
circumstances, funds would be available to support these full-year placements for all
gifted children. It is more feasible, however to consider the possibility of providing much
smaller "vouchers" for identified students to participate in accessible weekend or after
school programs. Dr. Richard Taubald of AG/TYP indicates that several students in
recent years have been sent to the AG/TYP weekend program on tuition credit offered by
area school districts. The following policy option uses the troubled Paterson (NJ) school
district to display an example of how a tuition voucher model may be used to provide
cost effective opportunities for gifted, yet predominantly disadvantaged children.
In 1992, the Paterson, NJ school district housed just over 24 thousand pupils. In
1991, the Paterson School district was taken over by the State of New Jersey for, among
other things mismanagement. The student population is predominantly African American
(36.1%) and Hispanic (40.5%) and generally of low socioeconomic status. Despite an
apparent community apathy toward education in general in Paterson, a recent parent
survey identified gifted education as one of the primary concerns of parents in the
district.53 The current fiscal circumstances in Paterson have made it difficult, at best, to
provide students with opportunities outside of the basic curriculum. Due to the
socioeconomic status of the majority of Paterson's residents, few would be capable of
paying for supplementary programs for their children on their own.
53 Wilson, Lavall. (1992) Paterson Public Schools: Questionaire Items Related to district CurriculumIssues Or Concerns.
273
Bruce D. BakerThe Economic Health of Gifted Education Draft as of: September 15, 1995
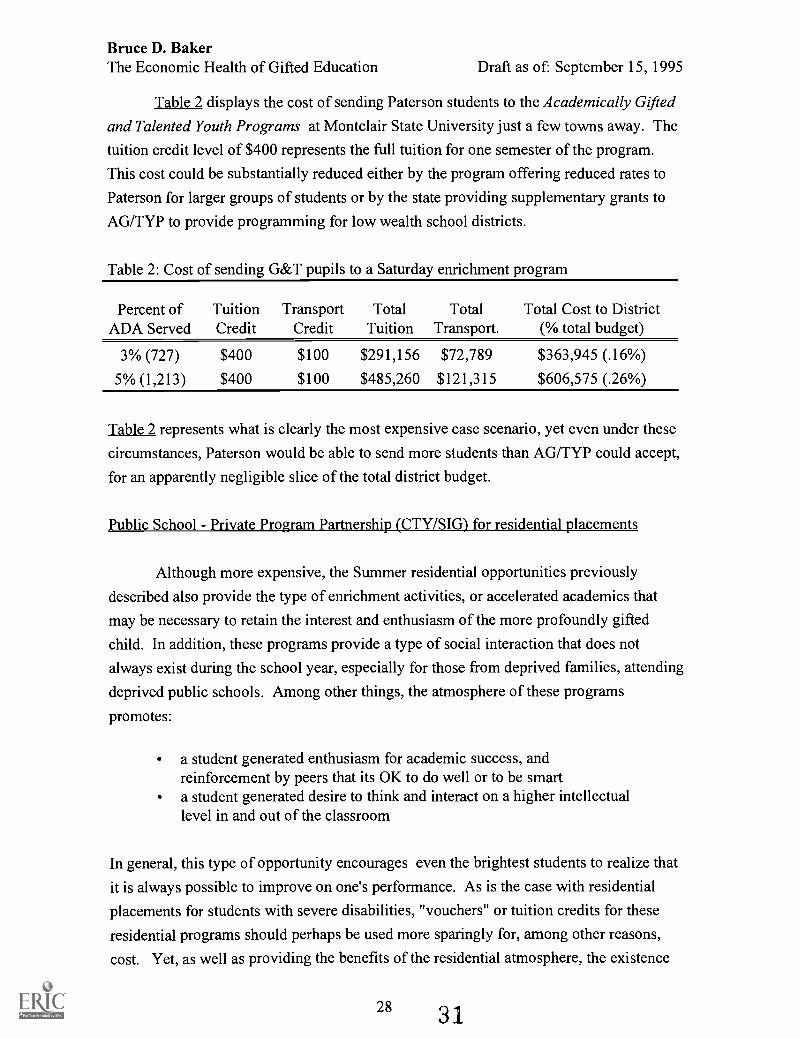
Table 2 displays the cost of sending Paterson students to the Academically Gifted
and Talented Youth Programs at Montclair State University just a few towns away. The
tuition credit level of $400 represents the full tuition for one semester of the program.
This cost could be substantially reduced either by the program offering reduced rates to
Paterson for larger groups of students or by the state providing supplementary grants to
AG/TYP to provide programming for low wealth school districts.
Table 2: Cost of sending G&T pupils to a Saturday enrichment program
Percent ofADA Served
Tuition Transport Total Total Total Cost to DistrictCredit Credit Tuition Transport. (% total budget)
3% (727) $400 $100 $291,156 $72,789 $363,945 (.16%)
5% (1,213) $400 $100 $485,260 $121,315 $606,575 (.26%)
Table 2 represents what is clearly the most expensive case scenario, yet even under these
circumstances, Paterson would be able to send more students than AG/TYP could accept,
for an apparently negligible slice of the total district budget.
Public School - Private Program Partnership (CTY/SIG) for residential placements
Although more expensive, the Summer residential opportunities previously
described also provide the type of enrichment activities, or accelerated academics that
may be necessary to retain the interest and enthusiasm of the more profoundly gifted
child. In addition, these programs provide a type of social interaction that does not
always exist during the school year, especially for those from deprived families, attending
deprived public schools. Among other things, the atmosphere of these programs
promotes:
a student generated enthusiasm for academic success, andreinforcement by peers that its OK to do well or to be smarta student generated desire to think and interact on a higher intellectuallevel in and out of the classroom
In general, this type of opportunity encourages even the brightest students to realize that
it is always possible to improve on one's performance. As is the case with residential
placements for students with severe disabilities, "vouchers" or tuition credits for these
residential programs should perhaps be used more sparingly for, among other reasons,
cost. Yet, as well as providing the benefits of the residential atmosphere, the existence
28 31
Bruce D. BakerThe Economic Health of Gifted Education Draft as of: September 15, 1995
of these programs opens the door to students in school districts without local access to a
program similar to the AG/TYP.
An Overarching Principal: Achieving Equity through Funding
As is evident in John Curley's research on Financing Programs for Education of
the Gifted in New York State flat grant allocations do little to help those school districts
that cannot afford to make up the difference. Curley's research displayed that, in New
York State, local funds made up 80% of total funds for Gifted Education in 1987-'88 and
that high-wealth districts were able to spend twice the amount of local funds as low
wealth districts, a disparity which has only increased since. Among the three states
analyzed, only Connecticut appropriated funds according to town wealth. This policy,
even when funds were reduced to a 5-35% scale, provided for substantial assistance to
some of the state's poorer communities.
Hartford, for example would have received 60% fewer funds in 1991-'92 had
Connecticut allocated funds according to New York's flat grant formula. (See Table 1 ).
Greenwich, with a property wealth per pupil of over $2 million received just over 5%
support from the state and was still able to spend nearly $2 million dollars on gifted
education in 1991-'92. Sterling, a poor rural district, with a property wealth of only
$289,082 per pupil received 34.5% reimbursement for gifted education from the state.
Under New York's flat grant program, Sterling's losses would have equaled nearly 80%
of the town's state allocation. The Connecticut model, however, is based on the
contingency that individual towns will choose to spend on gifted education.
One reason that Connecticut's previous formula was not entirely equitable was
that it was highly dependent upon a district's choice to spend on gifted education.
Bridgeport, in Table 3 chose to put forth a relatively small local effort, and although
they received nearly 35% state support, they received significantly less than they might
have under New York's model, had they chosen to participate. Greenwich, among the
highest wealth towns in the state was able to acquire significant funding from the state by
spending significantly at the local level. Under the New York model, Greenwich would
have received 60% less in state funding, however, the total losses to the district would
only equal 3% of its total budget for gifted education compared to a potential 27.5% of
total budget loss for the previously mentioned Sterling school district.
29 32
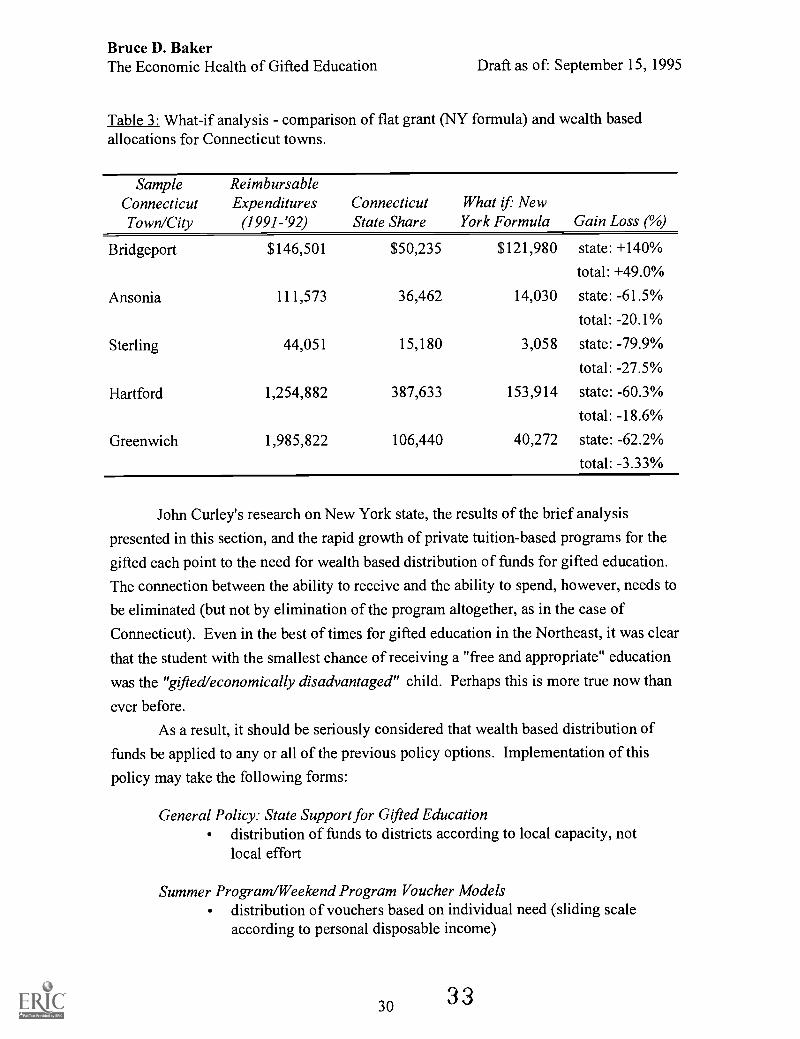
Bruce D. BakerThe Economic Health of Gifted Education Draft as of: September 15, 1995
Table 3: What-if analysis comparison of flat grant (NY formula) and wealth basedallocations for Connecticut towns.
Sample ReimbursableConnecticut Expenditures Connecticut What if NewTown/City (1991 -'92) State Share York Formula Gain Loss (%)
Bridgeport $146,501 $50,235 $121,980 state: +140%
total: +49.0%
Ansonia 111,573 36,462 14,030 state: -61.5%
total: -20.1%
Sterling 44,051 15,180 3,058 state: -79.9%
total: -27.5%
Hartford 1,254,882 387,633 153,914 state: -60.3%
total: -18.6%
Greenwich 1,985,822 106,440 40,272 state: -62.2%
total: -3.33%
John Curley's research on New York state, the results of the brief analysis
presented in this section, and the rapid growth of private tuition-based programs for the
gifted each point to the need for wealth based distribution of funds for gifted education.
The connection between the ability to receive and the ability to spend, however, needs to
be eliminated (but not by elimination of the program altogether, as in the case of
Connecticut). Even in the best of times for gifted education in the Northeast, it was clear
that the student with the smallest chance of receiving a "free and appropriate" education
was the "gifted/economically disadvantaged" child. Perhaps this is more true now than
ever before.
As a result, it should be seriously considered that wealth based distribution of
funds be applied to any or all of the previous policy options. Implementation of this
policy may take the following forms:
General Policy: State Support for Gifted Educationdistribution of funds to districts according to local capacity, notlocal effort
Summer Program/Weekend Program Voucher Modelsdistribution of vouchers based on individual need (sliding scaleaccording to personal disposable income)
30 33
Bruce D. BakerThe Economic Health of Gifted Education Draft as of: September 15, 1995
increased involvement of universities and colleges inpartnership ventures with public schools, particularly thoseschools or districts in needState support to model university and private programs tosupplement costs of providing programs to low-wealth districtsand pupils
Should we continue to ignore the plight of the "gifted poor" or even the "gifted middle-
class" by suggesting, as we have, that our current educational system and its philosophies
provide what is "best for all students", then we will continue to support the economic
segregation of our region's and nation's "best and brightest" students. "Special
opportunities" whether they be the enrichment offered by The Summer Institute for the
Gifted or accelerated classes offered by The Center for Talented Youth will continue to
be left to those who can afford them. This coincides with the fact that public school
districts most likely to support gifted and talented programs will continue to be those in
the "right neighborhoods" that have the local dollars to spend.
6.0 Conclusions and Recommendations
It is clear from the historical perspective presented in this report that gifted
students possess few, if any of the legal rights or privileges of other special populations.
As a result, gifted education funding continues to be disposable at the state or municipal
level. Although the blame for cuts to gifted education has been placed on the "fiscal
crisis", both Connecticut and New Jersey implemented their first major cuts to state level
funding against increases in general education expenditures that were +6% above
inflation. In each case, these cuts resulted in significantly fewer pupils being served over
time. The school districts that suffer most from these cuts are lower wealth districts, or
those districts that are more dependent on state support to keep their programs intact. As
previously indicated, it is in these areas, where the population is more likely to be of low
socioeconomic status, that publicly available opportunities are most needed. As can be
seen by the growth of private sector programs, the only right currently afforded to the
gifted child is the right to a "costly and appropriate" education. With few exceptions, this
is a right that is not widely available to students in lower wealth school districts.
In order to begin to revitalize the field of gifted education in the Northeast, and
support the rights of the gifted child, the following measures should be given serious
consideration:
31 34
Bruce D. BakerThe Economic Health of Gifted Education Draft as of: September 15, 1995
Develop state level policies, or Federal Guidelines that will ensurerights for gifted studentsEncourage creative, economically efficient opportunities that bringtogether the best of the public and private sectorsDevelop standards of horizontal equity that will ensure that giftedchildren, regardless of their socioeconomic status can attain a "free andappropriate" education
Although the policy options presented in this report seem to indicate that gifted
students needs can all be met simply by contracting out the necessary services, the
importance of designated personnel at the district or building level cannot be emphasized
enough. The "joint venture" options presented are intended to: 1) stimulate involvement
in districts where there were NO opportunities to begin with and 2) provide cost effective
supplementary opportunities in districts where gifted programs currently serve only
limited numbers of pupils. To ensure that even these opportunities occur, or are
distributed equitably among students, there continues to be a need for advocacy for the
gifted child within the schools.
Perhaps due to the lack of unity among the leaders of gifted education itself,
policy makers have been able to selectively extract the philosophies of the field that best
suit their political or economic agendas. Yet, just as inclusion of special education
students does not mean that the special population no longer exists, inclusion in gifted
education, as promoted in Renzulli's Schoolwide Enrichment Model or in National
Excellence, does not mean that gifted pupils, as a special population no longer exist.
Perhaps like no other population in our schools, rights and opportunities for gifted
students are entirely a matter of legislative convenience. One can only hope that the
legislators of our future will be the gifted students of our present, and that they will
choose not to do for others what was done for them.
32 35
Bruce D. BakerThe Economic Health of Gifted Education Draft as of: September 15, 1995
References
Broad ley v. Board of Education, Meriden. West's Educational Law Reporter, v. 90 (June16, 1994) p. 265
Brown, Delbert. New York State Department of Education. Personal CommunicationJune 1995
Corazza, Luciano. 1992 Academic Programs Report: A Brief History of CTY's AcademicPrograms. Johns Hopkins University. Center for Talented Youth. 1992
Council of State Directors of Programs for the Gifted. The 1994 State of the States Giftedand Talented Education Report. Texas Education Agency. Austin
Council of State Directors of Programs for the Gifted. The 1987 State of the States Giftedand Talented Education Report. Kansas State Department of Education
Curley, John. Financing programs for education of the gifted in New York State. Journalof Education Finance v. 16 (Winter '91) p. 332-47
Curley, John. New York State Department of Education. Personal Communication May1995
Curley, John. Reaching Out to Prevent Dropping Out: Financing Programs for Gifted At-Risk Students. 13th Annual Yearbook of the American Education FinanceAssociation. 1992
Dao, James. Cuomo Urges Schools for Gifted Students. New York Times. April 15, 1994
Desmond, Charles. A National Tragedy: The Retreat from Excellence in America.Roeper Review, Vol. 16 (4) pp. 224-225
Diegmueller, Karen. Gifted programs not a right, Conn. court rules. (Broadley v. Boardof Education of the City of Meriden) Education Week v. 13 (Mar. 30 '94) p. 8
Ellis v. Chester Upland School District. West's Educational Law Reporter, v. 96 (Mar.'95) p. 617
Feldhusen, John. A Case for Developing America's Talent; How we went wrong andwhere we go now. Roeper Review, Vol. 16 (4) pp. 231-232
Gourley, Ted. Education Information and Resource Center of New Jersey. PersonalCommunication. May 1995
33 36
Bruce D. BakerThe Economic Health of Gifted Education Draft as of: September 15, 1995
Hughes, John T. , Richards, Craig E. The New Ecology of School Management. Theory,Tools and Cases. Unpublished Manuscript. 1995
Kramer, Art. Director of CTY Academic Programs. Johns Hopkins University. PersonalCommunication. June 14, 1995.
Larsson, Yvonne. Governmental policies on the education of gifted and talented children:a world view. Educational Studies in Mathematics v. 17 (aug. '86) p. 213-19
Mahoney, Brian. Connecticut State Department of Education. Bureau of Grants Services.Personal Communication. May 19, 1995
Miserandino, Anthony. A Practitioner's Response:Admitting of a future that is unlike thepast. Roeper Review, Vol. 16 (4) pp. 227-228
Parrish, Thomas. The current federal role in special education funding. Center forSpecial Education Finance (1994)
Passow, Harry. Rudnitski, Rose. Transforming Policy to Enhance Educational Servicesfor the Gifted. Roeper Review, June, 1994
Passow, Harry. Rudnitski, Rose. State Policies Regarding Education of the Gifted asReflected in Legislation and Regulation. National Research Center on the Gifted andTalented, University of Connecticut. CRS93302
Pearsall, Susan. Best Students' Needs Regaining Attention. New York Times(Connecticut Weekly) June 26, 1994
Purcell, Jeanne. _The Status of Programs for High Ability Students. National ResearchCenter on the Gifted and Talented, University of Connecticut. CRS94306
Purcell, J. H. The effects of elimination of gifted and talented programs on participatingstudents and their parents. 37 (4) Fall 1993
Purcell, Jeanne. Programs for the gifted in a State Without a Mandate: An "EndangeredSpecies?" Roeper Review 15 (2) 1992
Purcell, Jeanne. Gifted Education at a Crossroads: The Program Status Study. GiftedChild Quarterly, Vol. 39 (2) Spring 1995
Radin, Charles. Gifted students face test of indifference. Boston Globe. September 30,1991
Renzulli, J. S. The reform movement and the quiet crisis in gifted education. GiftedChild Quarterly. 35 (1) Winter '91
34 37
Bruce D. BakerThe Economic Health of Gifted Education Draft as of: September 15, 1995
Renzulli, Joseph. Schools for Talent Development: A practical plan for total schoolimprovement. Mansfield Center. CT. Creative Learning Press
Taubald, Richard. Program proposal to the Secaucus Public Schools. Montclair StateUniversity, Fall 1995
VanTassel-Baska, Joyce. Gifted Education in the Balance: Building Relationships withGeneral Education. GCQ Vol. 35 (1) Winter 1991
Weiss, Gillian Lee. Brain Drain. In New Republic (On-line @aol.com) Feb 21. 1994
White, Alan. Connecticut State Department of Education. Gifted Education. PersonalCommunication. May 1995
Zipse, Phil & Dorhout, Albert. College Gifted Programs: Summer Institute for the Gifted.Personal Communication May 1995
35 3 8
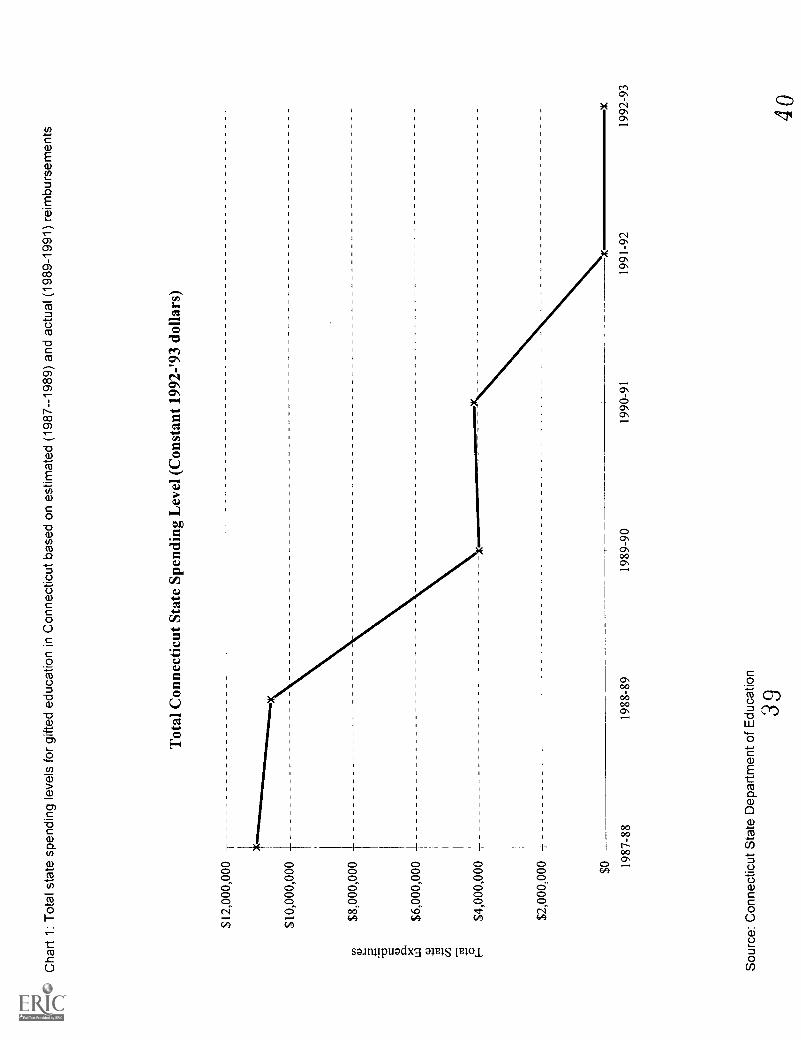
Chart
1:T
otalstate
spendinglevels
forgifted
educationin
Connecticut
basedon
estimated
(1987--1989)and
actual(1989-1991)
reimbursem
ents
Total
Connecticut
StateSpending
Level
(Constant
1992-'93dollars)
$12,000,000T
$10,000,000
$8,000,000
$6,000,000T
$4,000,000,
$2,000,000f-
$0
1987-881988-89
1989-90
Source:
Connecticut
State
Departm
entof
Education39
1990-911991-92
1992-93
40
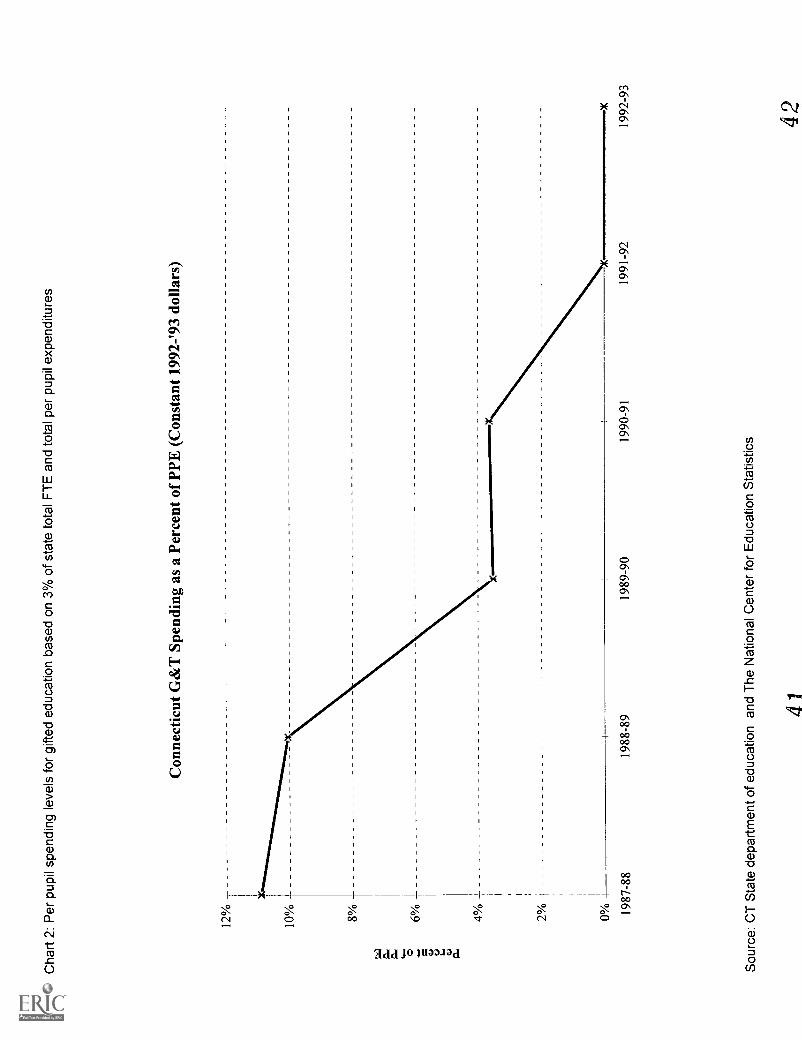
Cha
rt 2
: Per
pup
il sp
endi
ng le
vels
for
gifte
d ed
ucat
ion
base
d on
3%
of s
tate
tota
l FT
E a
nd to
tal p
er p
upil
expe
nditu
res
8% 4% 2%
Con
nect
icut
G&
T S
pend
ing
as a
Per
cent
of
PPE
(C
onst
ant 1
992-
'93
dolla
rs)
0%1
1i
x
1987
-88
1988
-89
1989
-90
1990
-91
Sou
rce:
CT
Sta
te d
epar
tmen
t of e
duca
tion
and
The
Nat
iona
l Cen
ter
for
Edu
catio
n S
tatis
tics
41
1991
-92
1992
-93
42
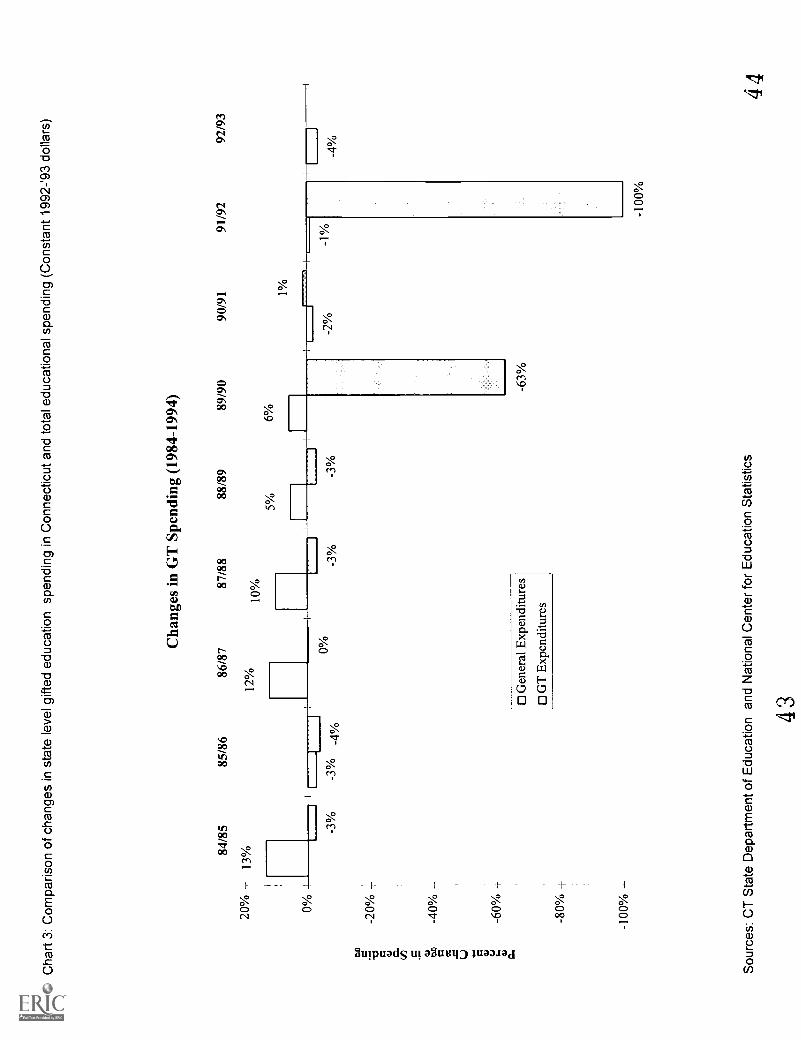
Cha
rt 3
: Com
paris
on o
f cha
nges
in s
tate
leve
l gift
ed e
duca
tion
spen
ding
in C
onne
ctic
ut a
nd to
tal e
duca
tiona
l spe
ndin
g (C
onst
ant 1
992-
'93
dolla
rs)
Cha
nges
in G
T S
pend
ing
(198
4-19
94)
84/8
585
/86
86/8
787
/88
88/8
989
/90
90/9
191
/92
92/9
3
20%
13%
12%
-20%
-40%
-60%
-I-
-80%
-100
%
-3%
-3%
-4%
10%
5%6%
1%
0%
0 G
ener
al E
xpen
ditu
res
0 G
T E
xpen
ditu
res
-3%
-3%
Sour
ces:
CT
Sta
te D
epar
tmen
t of E
duca
tion
and
Nat
iona
l Cen
ter
for
Edu
catio
n S
tatis
tics
-63%
-2%
.1%
-100
%
-4%
44
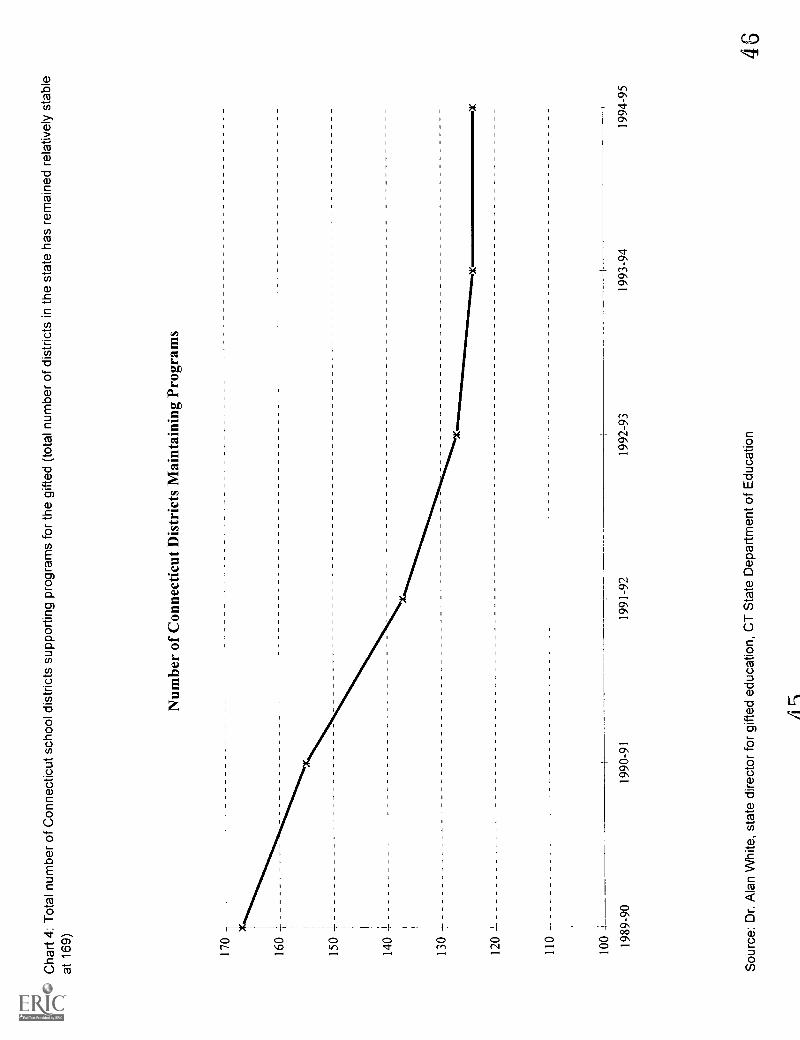
Cha
rt 4
: Tot
al n
umbe
r of
Con
nect
icut
sch
ool d
istr
icts
sup
port
ing
prog
ram
s fo
r th
e gi
fted
(tot
al n
umbe
r of
dis
tric
ts in
the
stat
e ha
s re
mai
ned
rela
tivel
y st
able
at 1
69)
170
160
T
150
-i-
140
130
Num
ber
of C
onne
ctic
ut D
istr
icts
Mai
ntai
ning
Pro
gram
s
120
-1--
110
-t-
- -
100 19
89-9
019
90-9
119
91-9
219
92-9
3
Sou
rce:
Dr.
Ala
n W
hite
, sta
te d
irect
or fo
r gi
fted
educ
atio
n, C
T S
tate
Dep
artm
ent o
f Edu
catio
n
1993
-94
1994
-95
46
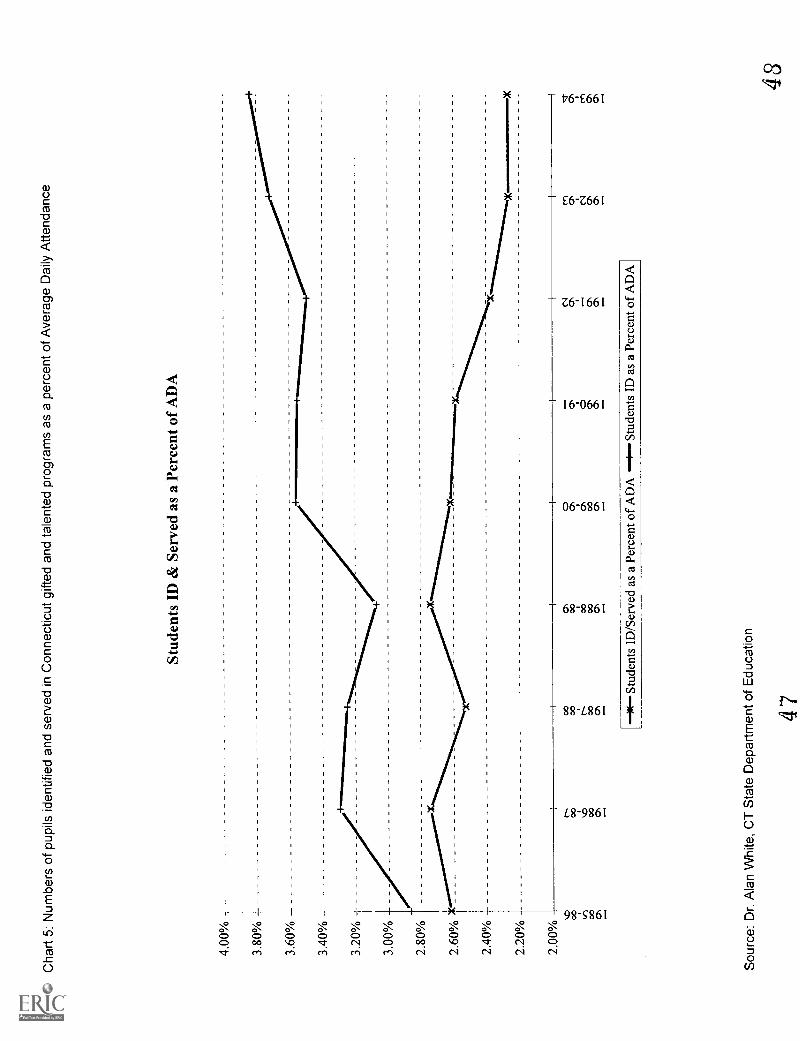
Cha
rt 5
: Num
bers
of p
upils
iden
tifie
d an
d se
rved
in C
onne
ctic
ut g
ifted
and
tale
nted
pro
gram
s as
a p
erce
nt o
f Ave
rage
Dai
lyA
ttend
ance
4.00
%-
--
3.80
%
T3.
60%
1
3.40
%
3.20
%
3.00
%
2.80
%
2.60
% t
2.40
%
2.20
% -
Stud
ents
ID
& S
erve
d as
a P
erce
nt o
f A
DA
2.00
%
00
x
1-00
C71
C)
0000
00as
,,,p
)irz
.I
c:;.,
0000
0000
0001
ON
0\0\
...1
...
O 0.
CN
IM
,:rC
\C
.'C
rt
NT M
01
C1
ON
O\
a's
....1
F-4*
- St
uden
ts I
D/S
erve
d as
a P
erce
nt o
f A
DA
-}-
Stu
dent
s ID
as
a Pe
rcen
t of
AD
A
Sou
rce:
Dr.
Ala
n W
hite
, CT
Sta
te D
epar
tmen
t of E
duca
tion
4748
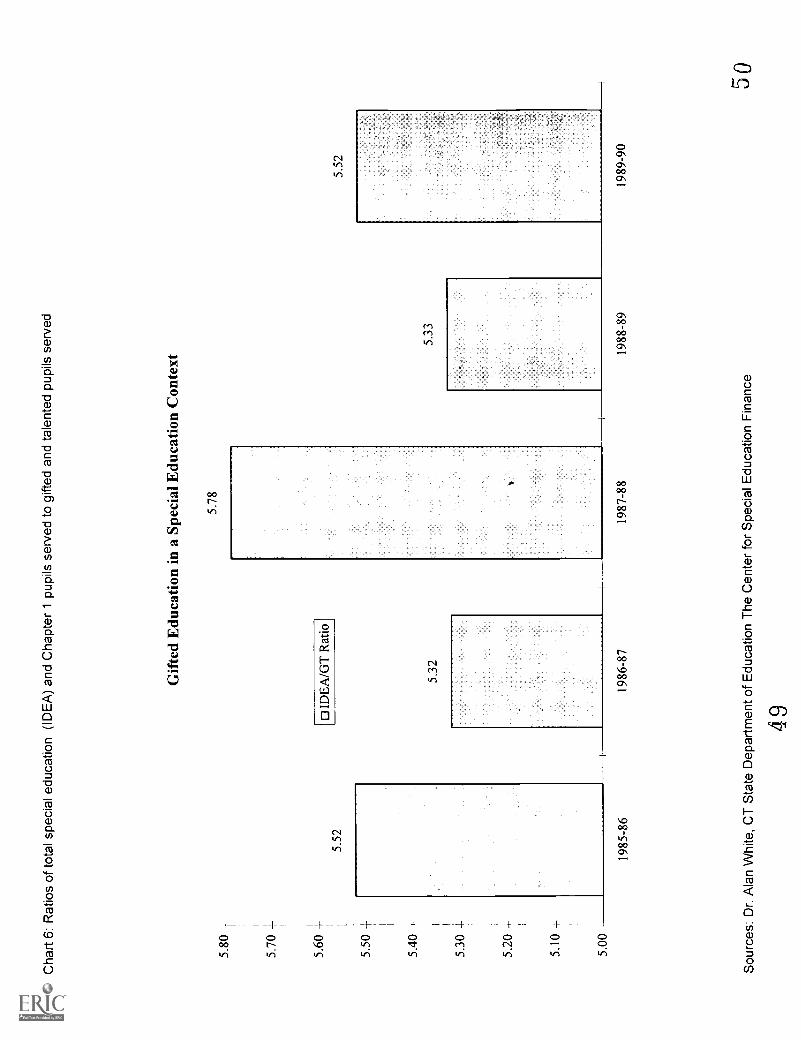
Cha
rt 6
: Rat
ios
of to
tal s
peci
al e
duca
tion
(ID
EA
) an
d C
hapt
er 1
pup
ils s
erve
d to
gift
ed a
nd ta
lent
ed p
upils
ser
ved
5.80
5.70
jr
5.60
+ 1
5.40
5.30
4-
5.20
5.10
1-
5.00
5.52
Gif
ted
Edu
catio
n in
a S
peci
al E
duca
tion
Con
text
0 ID
EA
/GT
Rat
io
5.32
1985
-86
5.78
1986
-87
1987
-88
5.52
5.33
Sou
rces
: Dr.
Ala
n W
hite
, CT
Sta
te D
epar
tmen
t of E
duca
tion
The
Cen
ter
for
Spe
cial
Edu
catio
n F
inan
ce
49
1988
-89
1989
-90
50
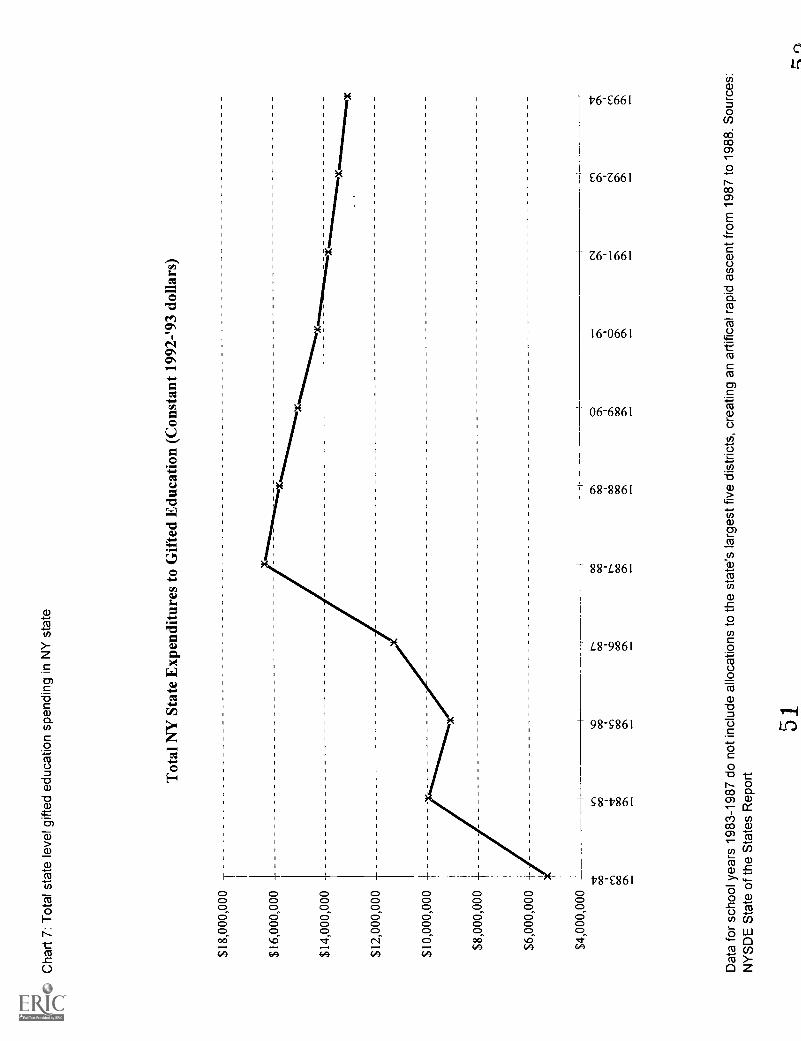
Cha
rt 7
: Tot
al s
tate
leve
l gift
ed e
duca
tion
spen
ding
in N
Y s
tate
$18,
000,
000
T-
-
$16,
000,
000
$14,
000,
000
$12,
000,
000
$10,
000,
000
J- i
$8,0
00,0
00 +
$6,0
00,0
00
$4,0
00,0
00«, c-
)00 O
,
Tot
al N
Y S
tate
Exp
endi
ture
s to
Gif
ted
Edu
catio
n (C
onst
ant 1
992-
'93
dolla
rs)
x
00 4 00 01
t---
--00 sz 00 O
N
-i- coaN
c>N
C.1
,:r00
ON
00
r.l.
4,6
c i '
sO
N NM
0000
0000
a,D
,a,
ON
ON
ON
01a
01C
T01
Dat
a fo
r sc
hool
yea
rs 1
983-
1987
do
not i
nclu
de a
lloca
tions
to th
e st
ate'
s la
rges
t fiv
e di
stric
ts, c
reat
ing
anar
tific
al r
apid
asc
ent f
rom
198
7 to
198
8. S
ourc
es:
NY
SD
E S
tate
of t
he S
tate
s R
epor
t
51
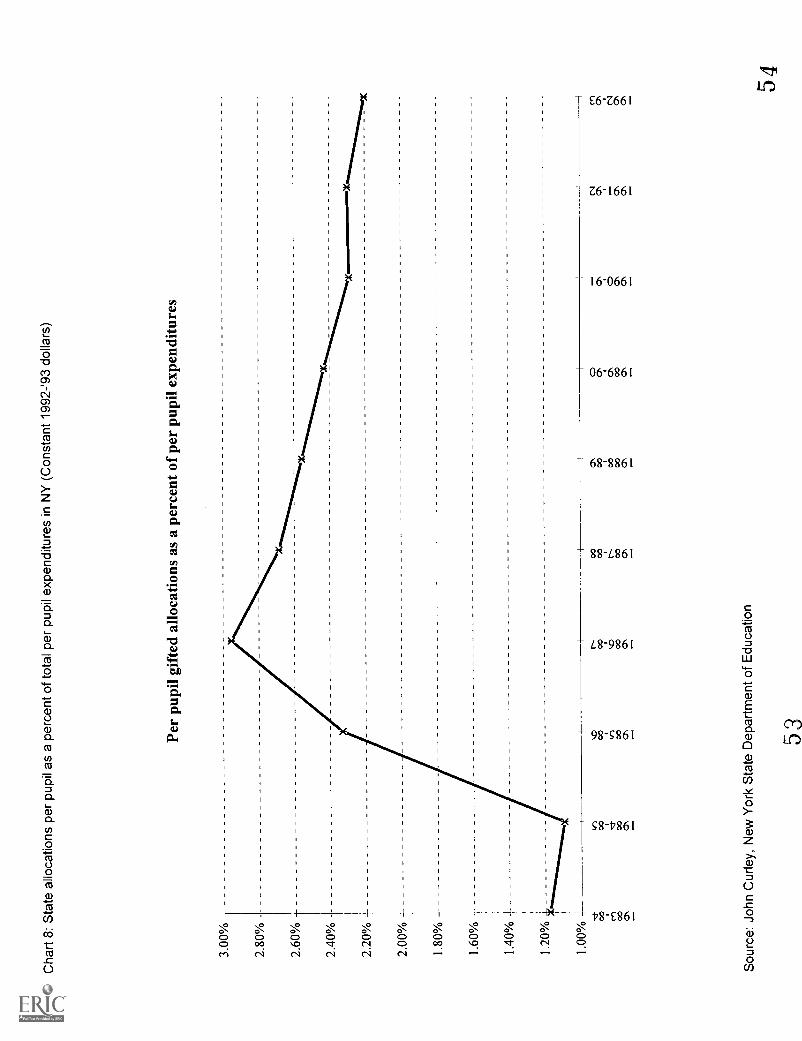
Cha
rt 8
: Sta
te a
lloca
tions
per
pup
il as
a p
erce
nt o
f tot
al p
er p
upil
expe
nditu
res
in N
Y (
Con
stan
t 199
2-'9
3 do
llars
)
3.00
% -
2.80
%
2.60
%
2.40
%T
2.20
% -
I-
2.00
%
1.80
%
1.60
%
1.40
% 4
-
Per
pupi
l gif
ted
allo
catio
ns a
s a
perc
ent o
f pe
r pu
pil e
xpen
ditu
res
00 4 00 C'
00 kr)
00 C7\
N-
00 s.2.
)00
Sou
rce:
Joh
n C
urle
y, N
ew Y
ork
Sta
te D
epar
tmen
t of E
duca
tion
00 00 DD C'
0 00 00 00 CT
O 00 C'
..tN
CI
0.,
Q.\
.
N_.
0,0,
a,a,
0, ......
54
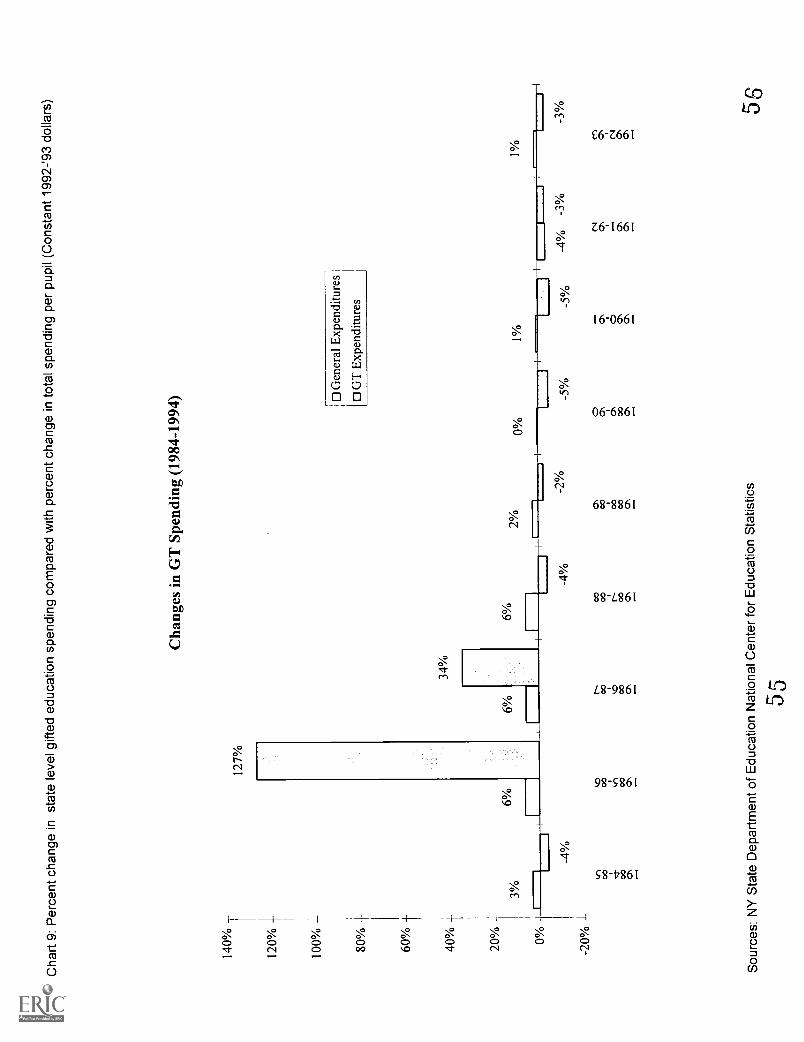
Cha
rt 9
: Per
cent
cha
nge
in s
tate
leve
l gift
ed e
duca
tion
spen
ding
com
pare
d w
ith p
erce
nt c
hang
e in
tota
l spe
ndin
g pe
rpu
pil (
Con
stan
t 199
2-'9
3 do
llars
)
140%
120%
T I
60%
t
40%
-F
20% 0%
3%
i
127%
6%
34%
6%
Cha
nges
in G
T S
pend
ing
(198
4-19
94)
6% 1---
2%
I 0
Gen
eral
Exp
endi
ture
s I
0 G
T E
xpen
ditu
res
1
0%1%
1%
-20%
-4%
-4%
-2%
I
tr.) 00 00 0'.
.ID
00 ...)
00 ON
N 00 ,L 00 cr
00 00 N 00 cr.
ON 00 00 00 cr,
0 CT
edN 00 cos,
Sou
rces
: NY
Sta
te D
epar
tmen
t of E
duca
tion
Nat
iona
l Cen
ter
for
Edu
catio
n S
tatis
tics
55
-5%
-5%
-4%
-3%
-3%
,-.
Ntn O
N8
9" ,.....
0.O
Na%
ON
cr
56
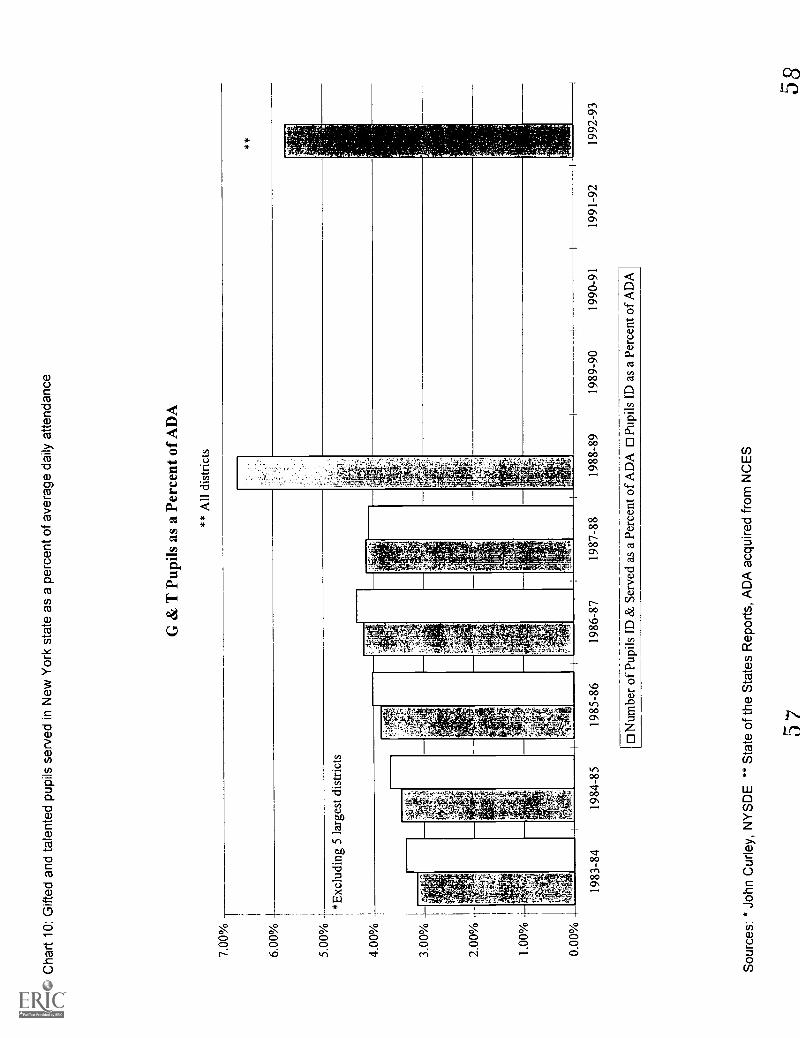
Cha
rt 1
0: G
ifted
and
tale
nted
pup
ils s
erve
d in
New
Yor
k st
ate
as a
per
cent
of a
vera
ge d
aily
atte
ndan
ce
7.00
%
6.00
%
5.00
%
4.00
%
3.00
%
2.00
%
1.00
%
0.00
%
G &
T P
upils
as
a Pe
rcen
t of
AD
A
** A
ll di
stri
cts
*Exc
ludi
ng 5
larg
est d
istr
icts
1983
-84
1984
-85
1985
-86
1986
-87
* *
1987
-88
1988
-89
1989
-90
1990
-91
0 N
umbe
r of
Pup
ils I
D &
Ser
ved
as a
Per
cent
of
AD
A 0
Pup
ils I
D a
s a
Perc
ent o
f A
DA
Sou
rces
: * J
ohn
Cur
ley,
NY
SD
E *
*Sta
te o
f the
Sta
tes
Rep
orts
, AD
A a
cqui
red
from
NC
ES
57
1991
-92
1992
-93
58
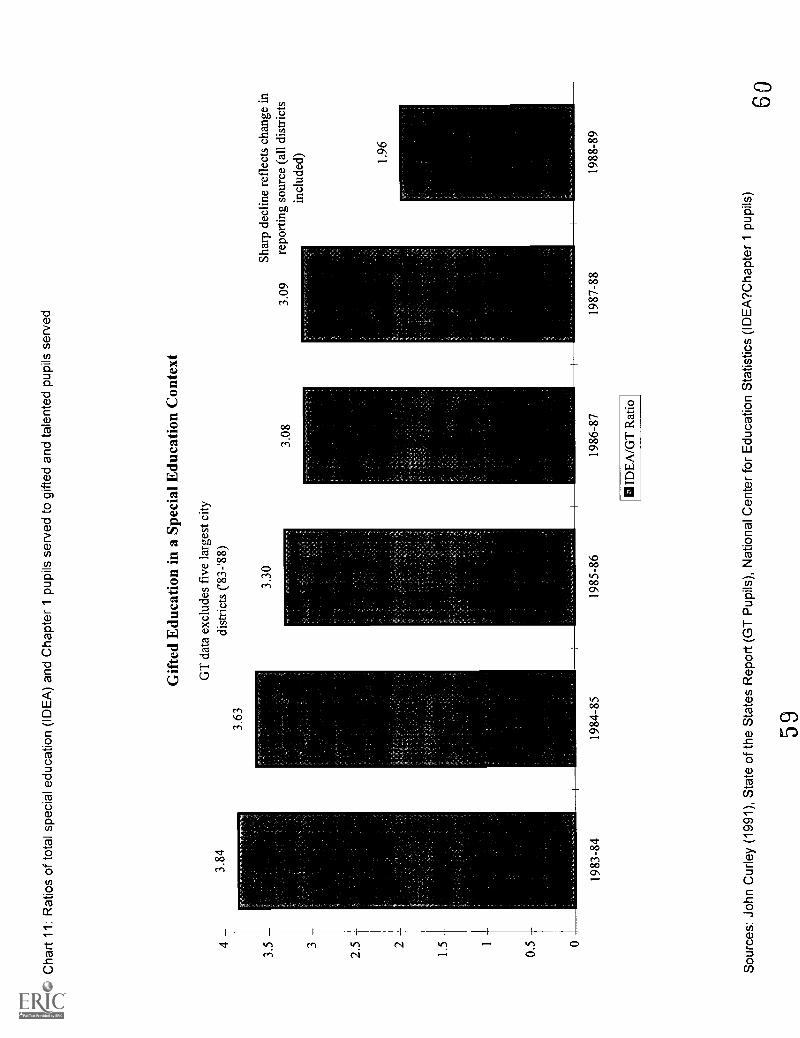
Cha
rt 1
1: R
atio
s of
tota
l spe
cial
edu
catio
n (I
DE
A)
and
Cha
pter
1 p
upils
ser
ved
to g
ifted
and
tale
nted
pup
ilsse
rved
4
3.5 3
2.5 2+
1.5 1-
0.5 0
Gif
ted
Edu
catio
n in
a S
peci
al E
duca
tion
Con
text
GT
data
exc
lude
s fi
ve la
rges
t city
3.84
dist
rict
s ('8
3-'8
8)3.
63
i444
444:
S444
3.30
3.08
Shar
p de
clin
e re
flec
ts c
hang
e in
3.09
repo
rtin
g so
urce
(al
l dis
tric
tsin
clud
ed) 1.96
1983
-84
1984
-85
1985
-86
1986
-87
DID
EA
/GT
Rat
io
1987
-88
Sou
rces
: Joh
n C
urle
y (1
991)
, Sta
te o
f the
Sta
tes
Rep
ort (
GT
Pup
ils),
Nat
iona
l Cen
ter
for
Edu
catio
n S
tatis
tics
(ID
EA
?Cha
pter
1 pu
pils
)
1988
-89
60
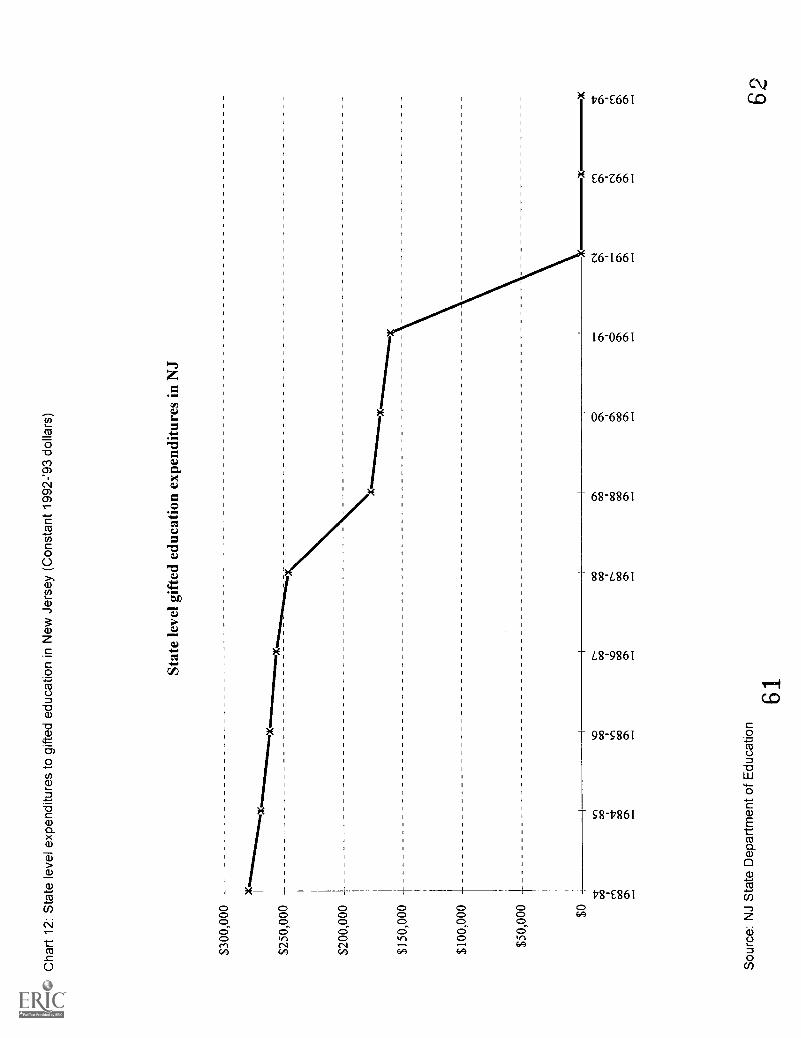
Cha
rt 1
2: S
tate
leve
l exp
endi
ture
s to
gift
ed e
duca
tion
in N
ew J
erse
y (C
onst
ant 1
992-
'93
dolla
rs)
$300
,000
$250
,000
$200
,000
$150
,000
+
$100
,000
-L
$50,
000
-I-1
$0
Stat
e le
vel g
ifte
d ed
ucat
ion
expe
nditu
res
in N
J
x
'Cr
00 l',1
00 01
Lel
00 4 oo O,
,_.
VD 00 tr)
oo 01 ,--,
C--
-00 1/
4.6
oo ON
...-
00 00 1.2_ oo 01 .--,
C7N 00 oo oo ON
.--.
0 CN
cl.,
oo CN --.
--. 6 cr,
Oh
,--.
N cl'
,-. cr ,--
en CN
czi
ch CN .
ct c` m a, CA --.
Sou
rce:
NJ
Sta
te D
epar
tmen
t of E
duca
tion
6162
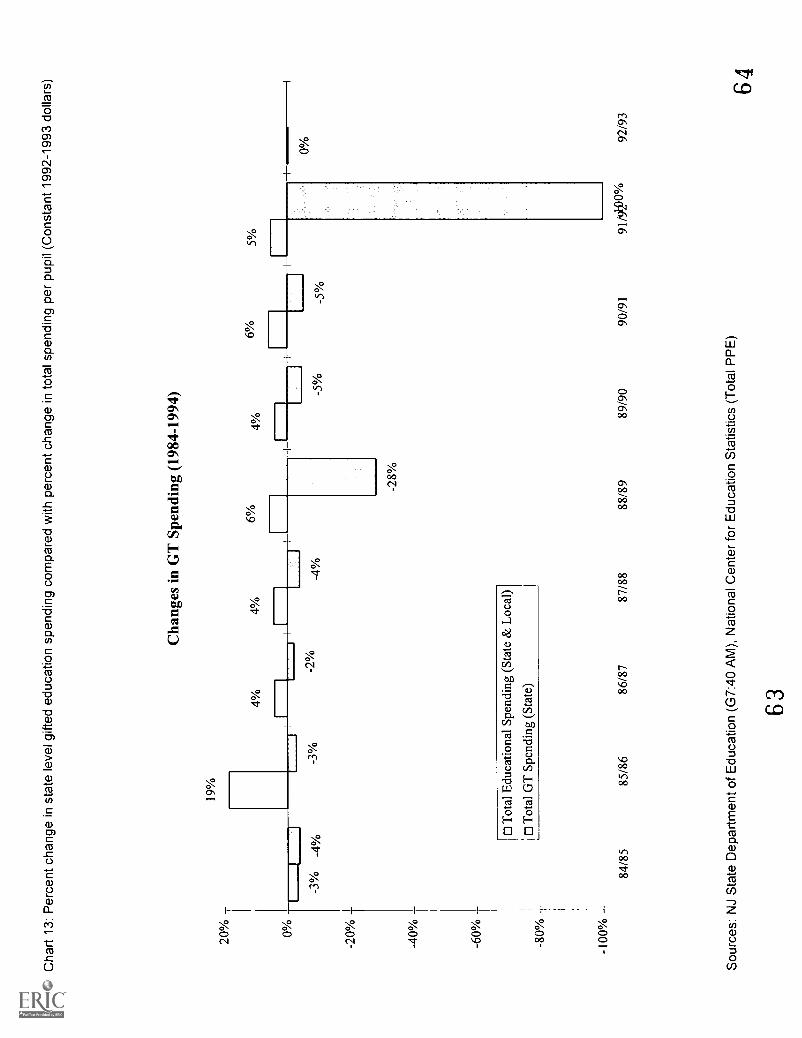
Cha
rt 1
3: P
erce
nt c
hang
e in
sta
te le
vel g
ifted
edu
catio
n sp
endi
ng c
ompa
red
with
per
cent
cha
nge
in to
tal s
pend
ing
per
pupi
l (C
onst
ant 1
992-
1993
dol
lars
)
Cha
nges
in G
T S
pend
ing
(198
4-19
94)
20% 0%
-20%
-40%
-60%
-80%
-100
%
II
-3%
-4%
19%
-3%
4%4%
-2%
i 0 T
otal
Edu
catio
nal S
pend
ing
(Sta
te &
Loc
al)
joT
otal
GT
Spe
ndin
g (S
tate
)
I-1-
-4%
6%
-28%
4%6%
5%
-5%
-5%
0%
84/8
585
/86
86/8
787
/88
88/8
989
/90
90/9
191
/00%
92/9
3
Sou
rces
: NJ
Sta
te D
epar
tmen
t of E
duca
tion
(G7:
40 A
M),
Nat
iona
l Cen
ter
for
Edu
catio
n S
tatis
tics
(Tot
al P
PE
)
6364
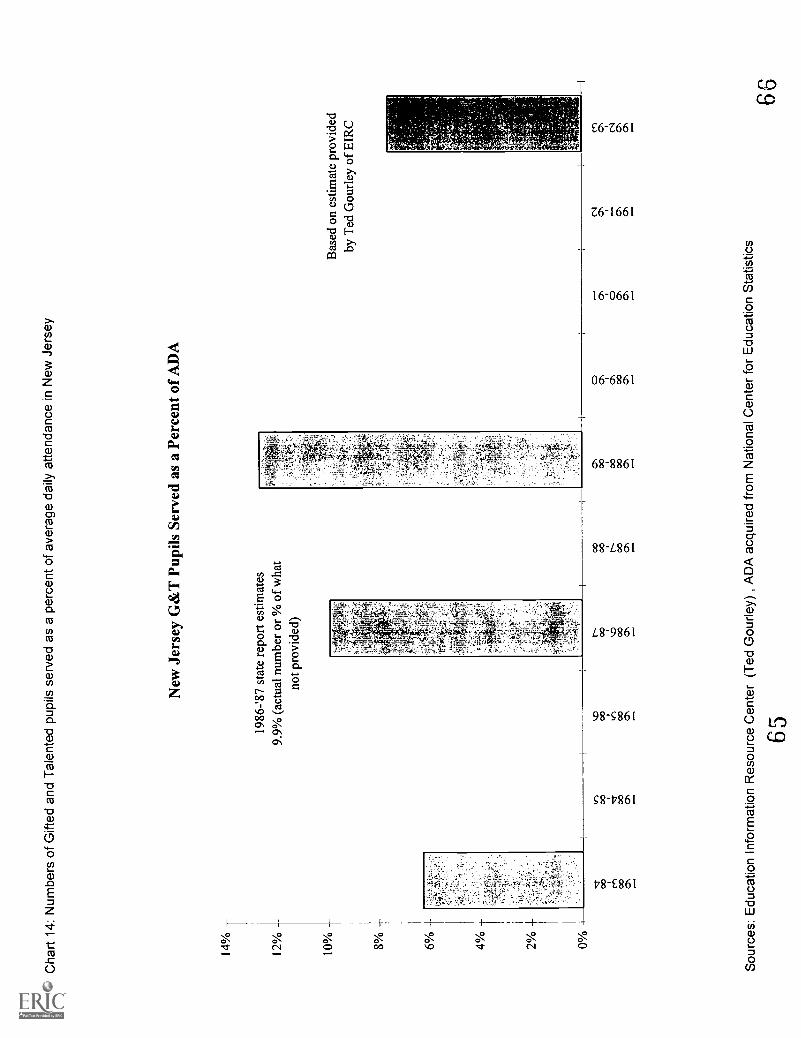
Cha
rt 1
4: N
umbe
rs o
f Gift
ed a
nd T
alen
ted
pupi
ls s
erve
d as
a p
erce
nt o
f ave
rage
dai
ly a
ttend
ance
in N
ew J
erse
y
14%
2% 0%
New
Jer
sey
G&
T P
upils
Ser
ved
as a
Per
cent
of
AD
A
1986
-'87
stat
e re
port
est
imat
es9.
9%(a
ctua
l num
ber
or %
ofw
hat
not p
rovi
ded)
Bas
ed o
n es
timat
e pr
ovid
edby
Ted
Gou
rley
of
EIR
C
00 00
oo 00 ON
r:)
00 00 01
00 00
00 00 DD
C 00 00 00
CD
ON 00 CT
O
Sou
rces
: Edu
catio
n In
form
atio
n R
esou
rce
Cen
ter
(Ted
Gou
rley)
, A
DA
acq
uire
d fr
om N
atio
nal C
ente
r fo
r E
duca
tion
Sta
tistic
s
65
N 01
66
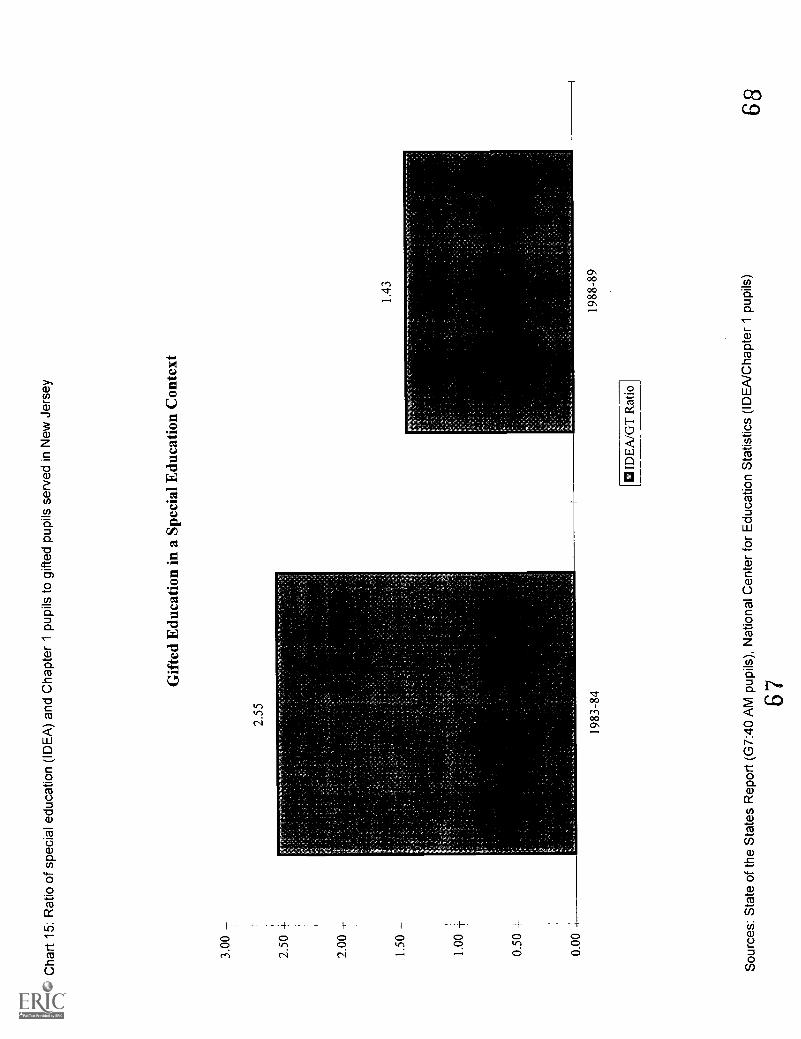
Cha
rt 1
5: R
atio
of s
peci
al e
duca
tion
(ID
EA
) an
d C
hapt
er 1
pup
ils to
gift
ed p
upils
ser
ved
in N
ew J
erse
y
3.00
2.55
Gif
ted
Edu
catio
n in
a S
peci
al E
duca
tion
Con
text
1983
-84
DID
EA
/GT
Rat
io
1988
-89
Sou
rces
: Sta
te o
f the
Sta
tes
Rep
ort (
G7:
40 A
M p
upils
), N
atio
nal C
ente
r fo
r E
duca
tion
Sta
tistic
s (I
DE
A/C
hapt
er 1
pup
ils)
6768
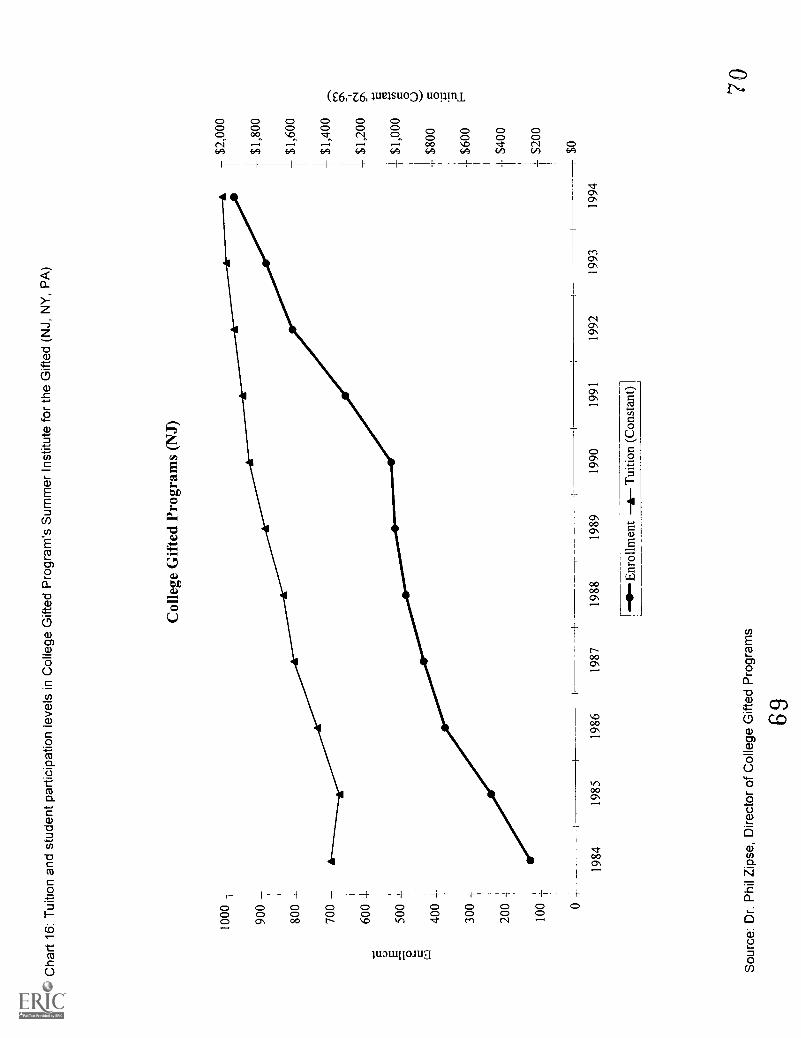
Cha
rt 1
6: T
uitio
n an
d st
uden
t par
ticip
atio
n le
vels
in C
olle
ge G
ifted
Pro
gram
's S
umm
er In
stitu
tefo
r th
e G
ifted
(N
J, N
Y, P
A)
1000
T
900
800
700
600
-I-
500
400
4--
300;
200
+
100
t
0;
Col
lege
Gif
ted
Prog
ram
s (N
J)
H-
7$2
,000
7$1
,800
$1,6
00
$1,4
00
$1,2
00
i$1,0
00
-11r
$800
$600
t $40
0
t $20
0
1984
1985
1986
1987
1988
1989
1990
1991
1992
1993
1994
-*E
nrol
lmen
t a T
uitio
n (C
onst
ant)
]
Sou
rce:
Dr.
Phi
l Zip
se, D
irect
or o
f Col
lege
Gift
ed P
rogr
ams
69
$0
7 0
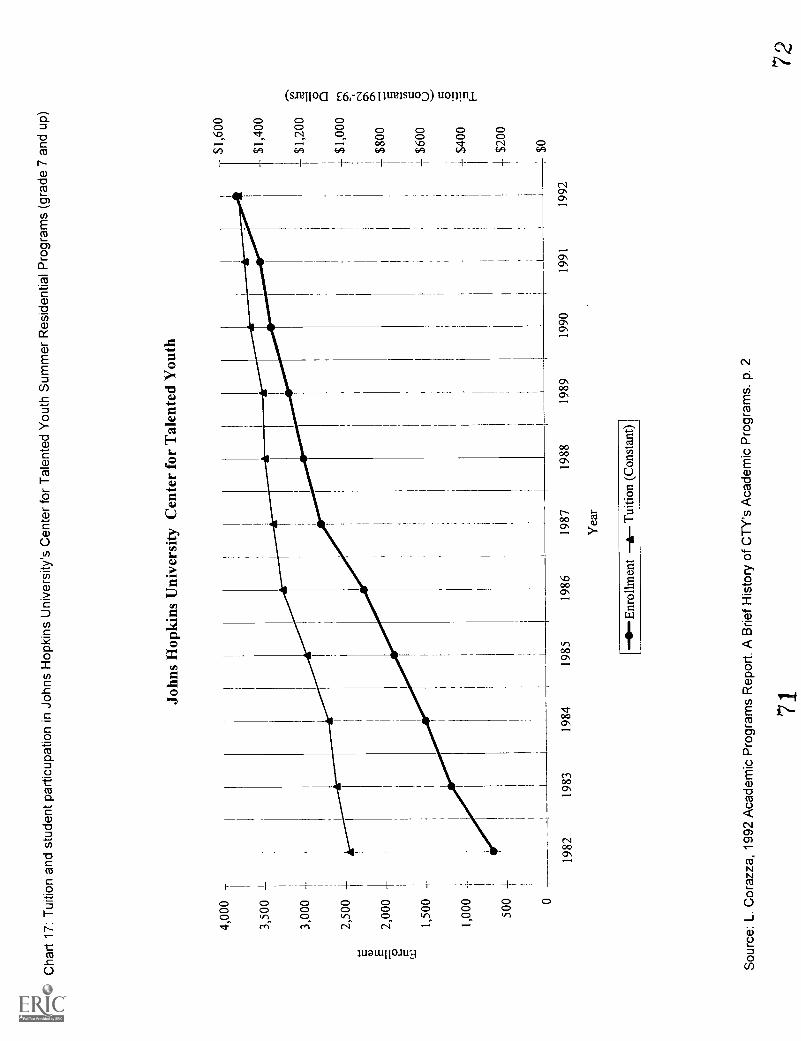
Cha
rt 1
7: T
uitio
n an
d st
uden
t par
ticup
atio
n in
Joh
ns H
opki
ns U
nive
rsity
'sC
ente
r fo
r T
alen
ted
You
th S
umm
er R
esid
entia
l Pro
gram
s (g
rade
7 a
nd u
p)
4,00
0
3,50
0
3,00
0 +
2,50
0
2,00
01-
1,50
0-t
-
1,00
0;- 1
500
±
0
John
s H
opki
ns U
nive
rsity
Cen
ter
for
Tal
ente
d Y
outh
1982
1983
1984
1985
1986
1987
1988
1989
1990
Yea
r
6Enr
ollm
ent 6
Tui
tion
(Con
stan
t)
Sou
rce:
L. C
oraz
za, 1
992
Aca
dem
ic P
rogr
ams
Rep
ort.
A B
rief H
isto
ry o
f CT
Y's
Aca
dem
ic P
rogr
ams.
p. 2
71
$1,6
00
$1,4
00
$1,2
00
t $1,
000
$800
$600
$400
± $
200
$0
1991
1992
72
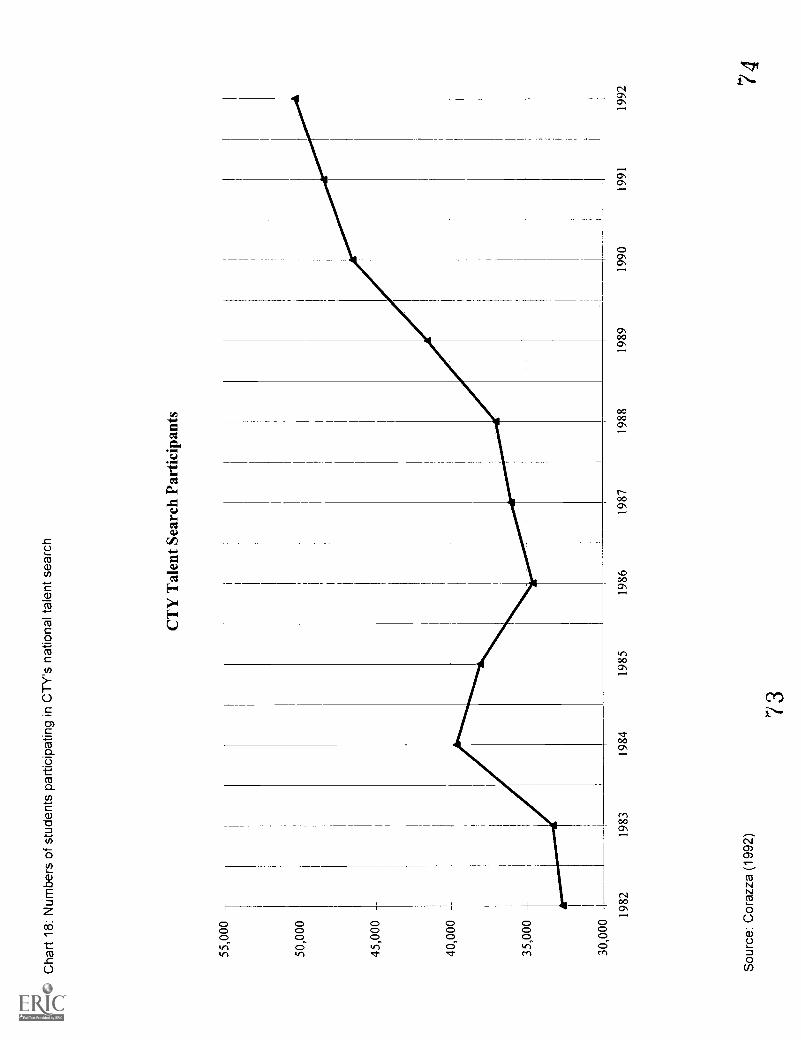
Cha
rt 1
8: N
umbe
rs o
f stu
dent
s pa
rtic
ipat
ing
in C
TY
's n
atio
nal t
alen
t sea
rch
CT
Y T
alen
t Sea
rch
Part
icip
ants
55,0
00T
30,0
00
1982
1983
1984
1985
1986
1987
1988
1989
1990
1991
1992
Sou
rce:
Cor
azza
(19
92)
73'7
4
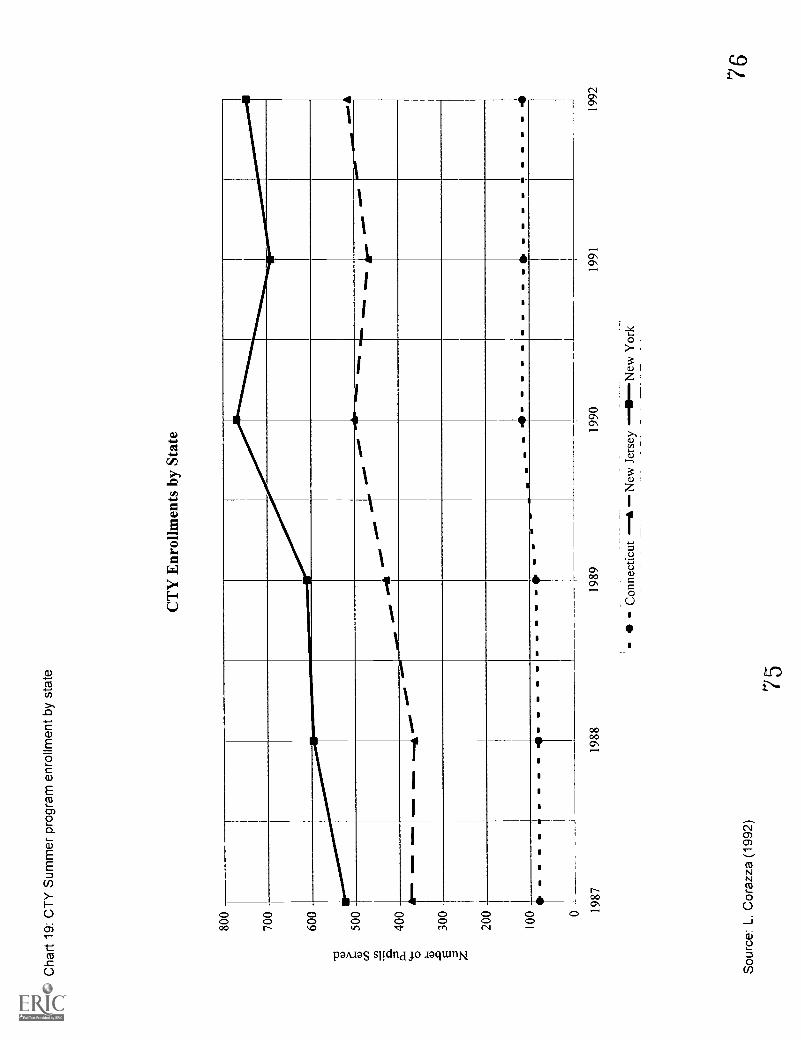
Cha
rt 1
9: C
TY
Sum
mer
pro
gram
enr
ollm
ent b
y st
ate
800
700
600
500
400
300
200
100 0 19
87
CT
Y E
nrol
lmen
ts b
y St
ate _
=I
1M
Sou
rce:
L. C
oraz
za (
1992
)
1988
1989
1990
1991
1992
75
Con
nect
icut
41
New
Jer
sey
0New
Yor
k
76
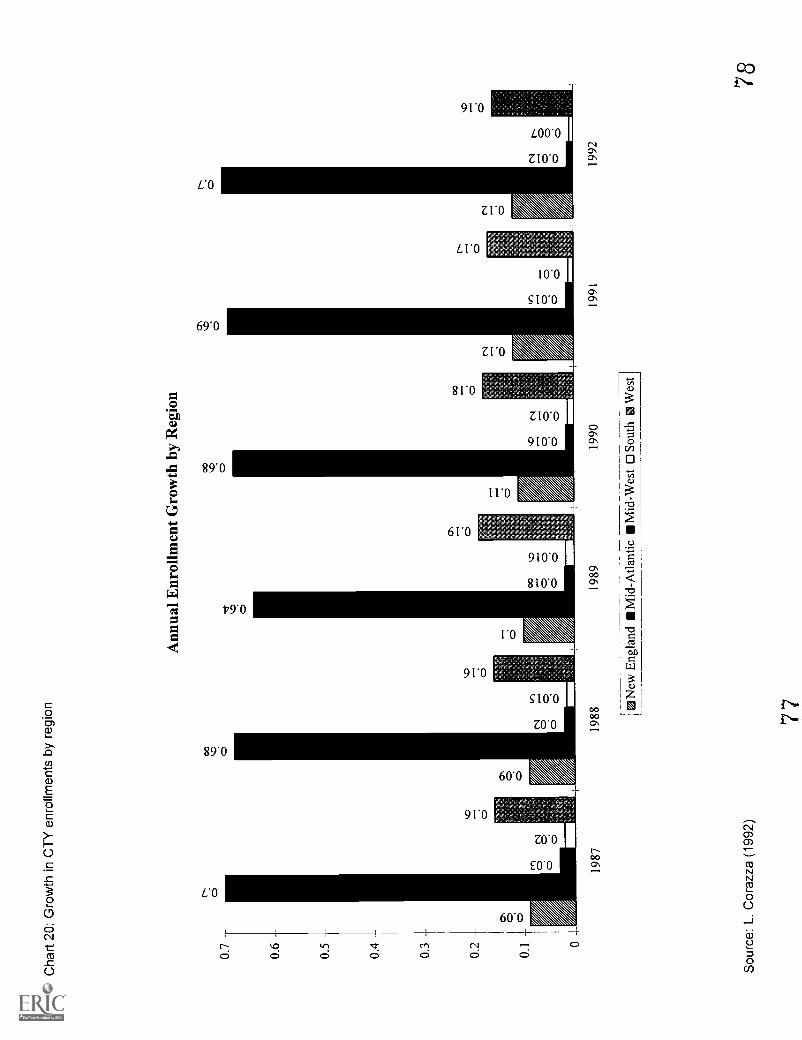
Cha
rt 2
0: G
row
th in
CT
Y e
nrol
lmen
ts b
y re
gion
0.7
0.6
0.5
0.4
0.3
N00
Ann
ual E
nrol
lmen
t Gro
wth
by
Reg
ion
00 sC).
0.2
T
rn
0.1
T
co,
--.
00
VD
.0c;
or-
-_-
6ci
ci,
ci
N
-I-
N O O
1987
Sou
rce:
L. C
oraz
za (
1992
)
1988
O O
000
O
NO
O
1989
1990
New
Eng
land
Mid
-Atla
ntic
Mid
-Wes
t 0 S
outh
0 W
est
1991
1992
78
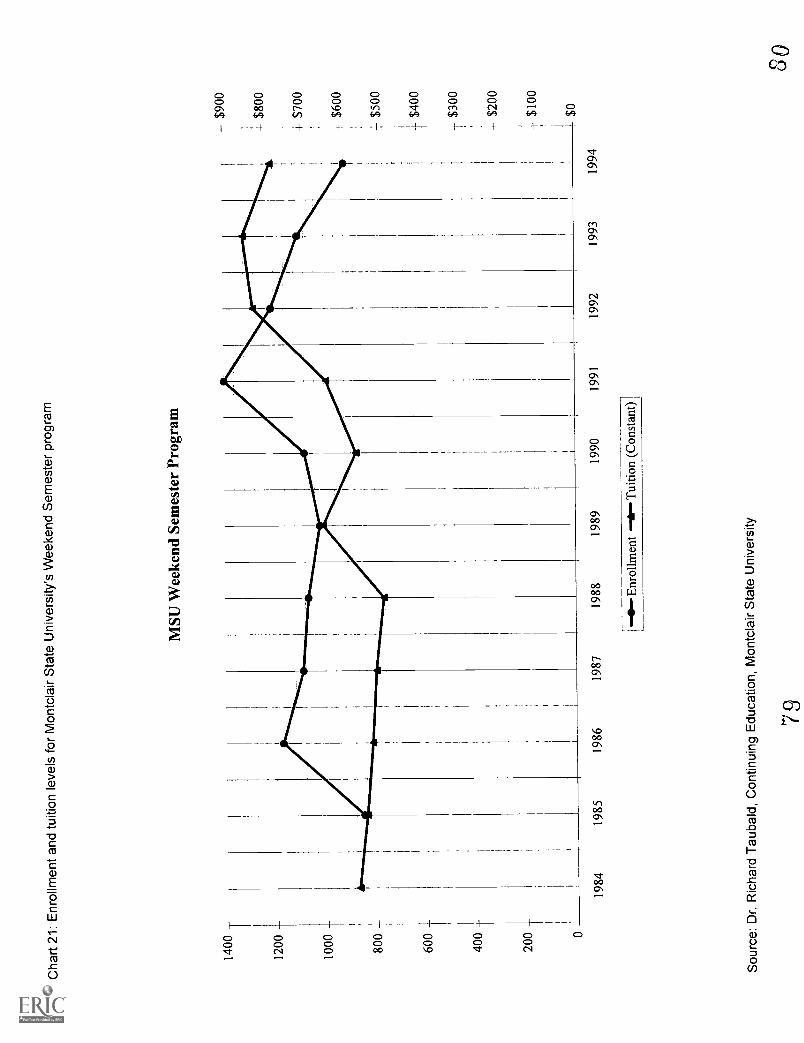
Cha
rt 2
1: E
nrol
lmen
t and
tuiti
on le
vels
for
Mon
tcla
ir S
tate
Uni
vers
ity's
Wee
kend
Sem
este
r pr
ogra
m
1400
T
1200
1000 80
0
600
400
200 0
MSU
Wee
kend
Sem
este
r Pr
ogra
m
1984
1985
1986
1987
1988
1989
1990
1991
1992
1993
1994
Enr
ollm
ent
Tui
tion
(Con
stan
t)
Sou
rce:
Dr.
Ric
hard
Tau
bald
, Con
tinui
ng E
duca
tion,
Mon
tcla
ir S
tate
Uni
vers
ity
79
T$9
00
4 $8
00
4. $
700
-7 $
600
-1,-
$50
0
$400
$300
4 $2
00
t $10
0
$0
so
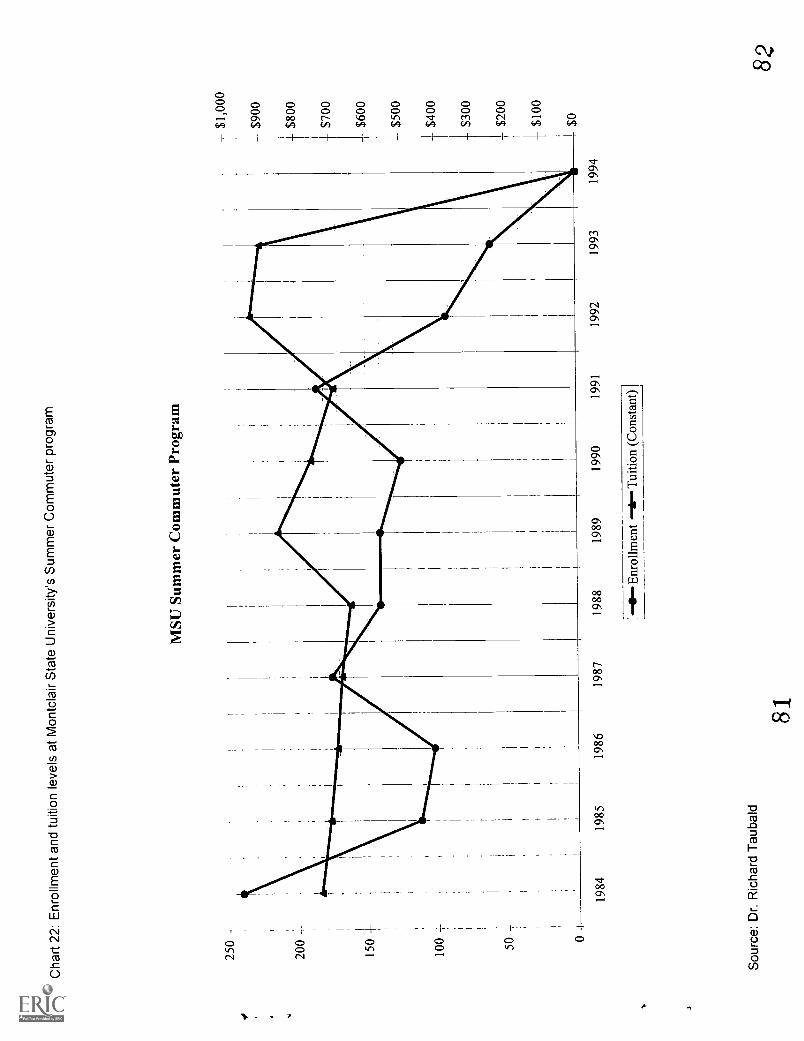
Cha
rt 2
2: E
nrol
lmen
t and
tuiti
on le
vels
at M
ontc
lair
Sta
te U
nive
rsity
's S
umm
er C
omm
uter
pro
gram
MSU
Sum
mer
Com
mut
er P
rogr
am
250
-
1984
1985
Sou
rce:
Dr.
Ric
hard
Tau
bald
1986
81
1987
1988
1989
1990
1991
Enr
ollm
ent t
Tui
tion
(Con
stan
t)
1992
1993
1994
T$1
,000
$900
$800
$700
$600
$500
$400
$300
$200
$100
$0
82
.
U.S. Department of EducationOffice of Educational Research and Improvement (OERI)
National Library of Education (NLE)Educational Resources Information Center (ERIC)
REPRODUCTION RELEASE(Specific Document)
I. DOCUMENT IDENTIFICATION:
0
Title: e, E 6 6L.1 bc.4-x. on't- tre...e_
Author(s):
Corporate Source: Publication Date:
II. REPRODUCTION RELEASE:
In order to disseminate as widely as possible timely and significant materials of interest to the educational community, documents announced in themonthly abstract journal of the ERIC system, Resources in Education (RIE), are usually made available to users in microfiche, reproduced papercopy,and electronic media, and sold through the ERIC Document Reproduction Service (EDRS). Credit is given to the source of each document, and, ifreproduction release is granted, one of the following notices is affixed to the document.
If permission is granted to reproduce and disseminate the identified document, please CHECK ONE of the following three options and sign at the bottomof the page.
The sample sticker shown below will beaffixed to all Level 1 documents
PERMISSION TO REPRODUCE ANDDISSEMINATE THIS MATERIAL HAS
BEEN GRANTED BY
TO THE EDUCATIONAL RESOURCESINFORMATION CENTER (ERIC)
Level
Check here for Level 1 release, permitting reproductionand dissemination in microfiche or other ERIC archival
media (e.g., electronic) and paper copy.
Signhere,--)please
The sample sticker shown below will beaffixed to all Level 2A documents
PERMISSION TO REPRODUCE ANDDISSEMINATE THIS MATERIAL IN
MICROFICHE, AND IN ELECTRONIC MEDIAFOR ERIC COLLECTION SUBSCRIBERS ONLY,
HAS BEEN GRANTED BY
2A
TO THE EDUCATIONAL RESOURCESINFORMATION CENTER (ERIC)
Level 2A
Check here for Level 2A release, permitting reproductionand dissemination in microfiche and in electronic media
for ERIC archival collection subscribers only
The sample sticker shown below will beaffixed to all Level 2B documents
PERMISSION TO REPRODUCE ANDDISSEMINATE THIS MATERIAL IN
MICROFICHE ONLY HAS BEEN GRANTED BY
22
TO THE EDUCATIONAL RESOURCESINFORMATION CENTER (ERIC)
Level 2B
nCheck here for Level 2B release, permitting
reproduction and dissemination in microfiche only
Documents will be processed as indicated provided reproduction quality permits.If permission to reproduce is granted, but no box is checked, documents will be processed at Level 1.
I hereby grant to the Educational Resources Information Center (ERIC) nonexclusive permission to reproduce and disseminate this documentas indicated above. Reproductidh from the ERIC microfiche or electronic media by persons other than ERIC employees and its systemcontractors requires permission from the copyright holder. Exception is made for non-profit reproduction by libraries and other service agenciesto satisfy information needs of educators in response to discrete inquiries.
Signature: Printed Name/Position/Title:
Organization/Address:
0 A, Oe-rS ; 0*-
Bs-0 c 74-%s-k
F9A)(-g.c-8 q--. 5737CTe'e r 94 y- te ciceE-Maill);dcArzia24.., Date: /s-prg
wz
(over)
III. DOCUMENT AVAILABILITY INFORMATION (FROM NON-ERIC SOURCE):
If permission to reproduce is not granted to ERIC, or, if you wish ERIC to cite the availability of the document from another source, pleaseprovide the following information regarding the availability of the document. (ERIC will not announce a document unless it is publiclyavailable, and a dependable source can be specified. Contributors should also be aware that ERIC selection criteria are significantly morestringent for documents that cannot be made available through EDRS.)
Publisher/Distributor:
Address:
Price:
IV. REFERRAL OF ERIC TO COPYRIGHT/REPRODUCTION RIGHTS HOLDER:
If the right to grant this reproduction release is held by someone other than the addressee, please provide the appropriate name andaddress:
Name:
Address:
V. WHERE TO SEND THIS FORM:
Send this form to the following ERIC Clearinghouse:ERIC Clearinghouse on Disabilities
and Gifted EducationThe Council for Exceptional Children1920 Association DriveReston, VA 20191-1589
Toll-Free: 800/328-0272FAX: 703/620-2521
However, if solicited by the ERIC Facility, or if making an unsolicited contribution to ERIC, return this form (and the document beingcontributed) to:
ERIC Processing and Reference Facility1100 West Street, 2nd Floor
Laurel, Maryland 20707-3598
Telephone: 301-497-4080Toll Free: 800-799-3742
FAX: 301-953-0263e-mail: [email protected]
WWW: hftp://ericfac.piccard.csc.com
EFF-088 (Rev. 9/97)PREVIOUS VERSIONS OF THIS FORM ARE OBSOLETE.