Embed Size (px)
Citation preview
7/12/2013
1
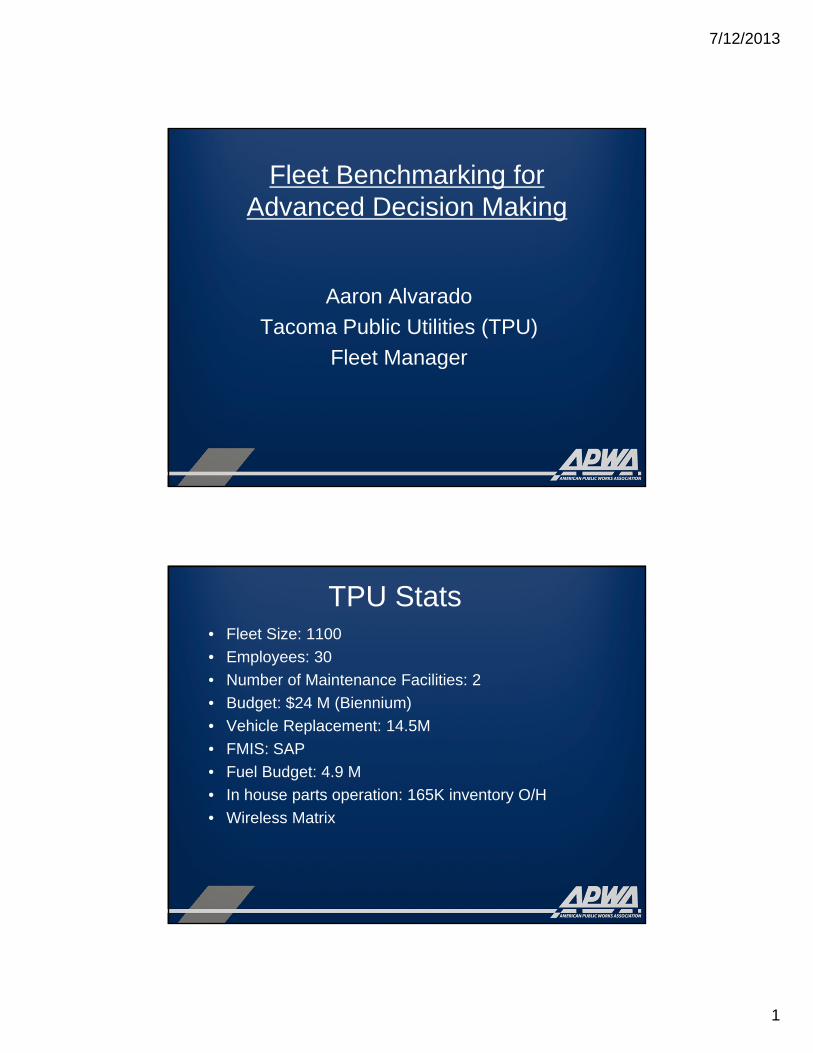
Fleet Benchmarking for Advanced Decision Making
Aaron Alvarado
Tacoma Public Utilities (TPU)
Fleet Manager
TPU Stats• Fleet Size: 1100
• Employees: 30
• Number of Maintenance Facilities: 2
• Budget: $24 M (Biennium)
• Vehicle Replacement: 14.5M
• FMIS: SAP
• Fuel Budget: 4.9 M
• In house parts operation: 165K inventory O/H
• Wireless Matrix
7/12/2013
2
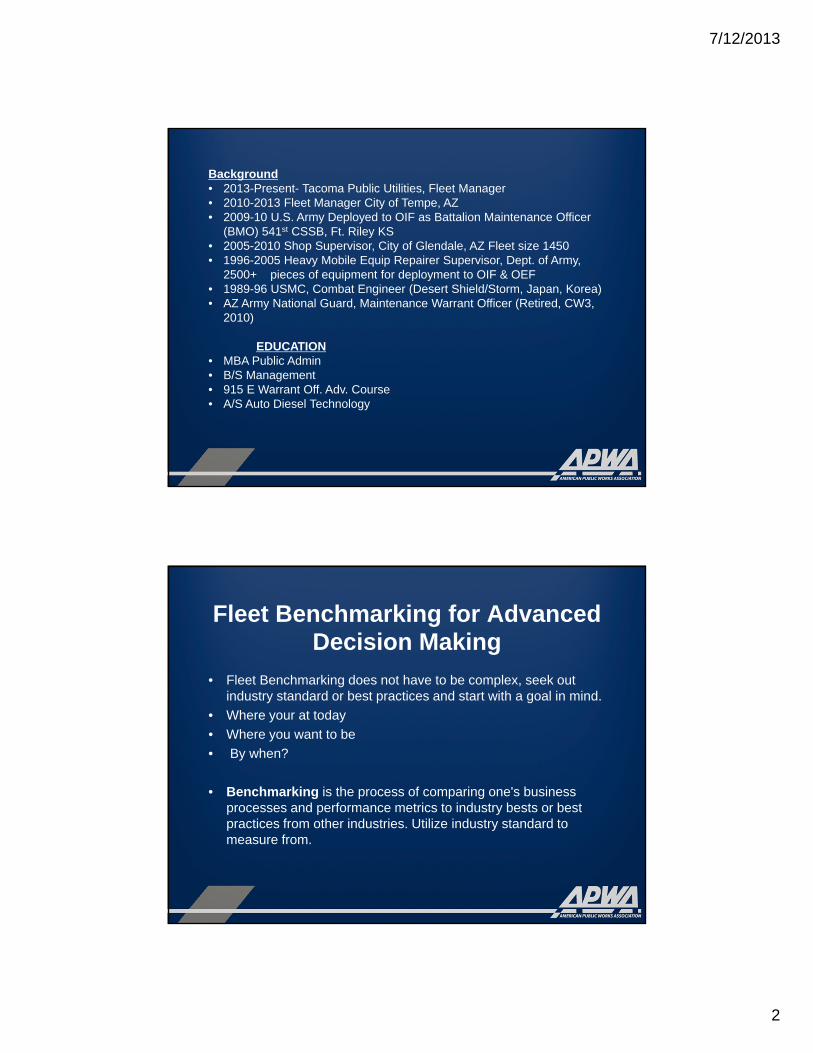
Background• 2013-Present- Tacoma Public Utilities, Fleet Manager• 2010-2013 Fleet Manager City of Tempe, AZ • 2009-10 U.S. Army Deployed to OIF as Battalion Maintenance Officer
(BMO) 541st CSSB, Ft. Riley KS• 2005-2010 Shop Supervisor, City of Glendale, AZ Fleet size 1450• 1996-2005 Heavy Mobile Equip Repairer Supervisor, Dept. of Army,
2500+ pieces of equipment for deployment to OIF & OEF• 1989-96 USMC, Combat Engineer (Desert Shield/Storm, Japan, Korea)• AZ Army National Guard, Maintenance Warrant Officer (Retired, CW3,
2010)
EDUCATION• MBA Public Admin• B/S Management• 915 E Warrant Off. Adv. Course• A/S Auto Diesel Technology
Fleet Benchmarking for Advanced Decision Making
• Fleet Benchmarking does not have to be complex, seek out industry standard or best practices and start with a goal in mind.
• Where your at today
• Where you want to be
• By when?
• Benchmarking is the process of comparing one's business processes and performance metrics to industry bests or best practices from other industries. Utilize industry standard to measure from.
7/12/2013
3
Fleet Benchmarking for Advanced Decision Making
• Measure items in your fleet that have some relevance to the executive management team
• Have common procedures to methodically organize your data, template and define data criteria
• Present often as possible to executive team to drive your point home, i.e. State of the Fleet address etc..
What’s worth Benchmarking?
Possibilities include:
productivity measures
CPM/CPG/CPH
idle time
vehicle lifecycle cost
downtime
turn around time
PM compliance
7/12/2013
4
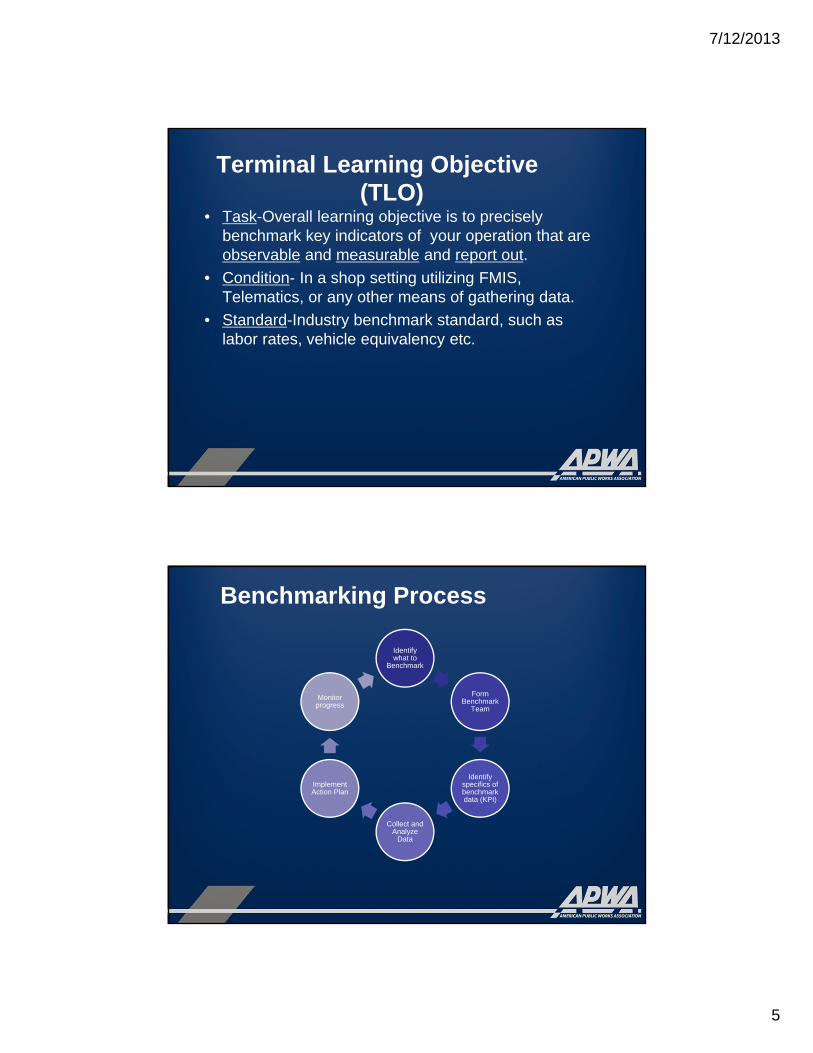
What’s worth Benchmarking?
•Each fleet operation is unique, recommendation: Define the key objectives and benchmark what is most important to your organization.
Microsoft Excel 97-2003 Workshee
Benchmarking process
•What are the results from benchmarking? Better understanding of your operations true performance
•Define each aspect of what you are going to measure and ensure you make it clear as to what goes into your study.
•Identify similar operations to gather data from, or benchmark similar equipment in your fleet
7/12/2013
5
Terminal Learning Objective(TLO)
• Task-Overall learning objective is to precisely benchmark key indicators of your operation that are observable and measurable and report out.
• Condition- In a shop setting utilizing FMIS, Telematics, or any other means of gathering data.
• Standard-Industry benchmark standard, such as labor rates, vehicle equivalency etc.
Benchmarking Process
Identify what to
Benchmark
Form Benchmark
Team
Identify specifics of benchmark data (KPI)
Collect and Analyze
Data
Implement Action Plan
Monitor progress
7/12/2013
6
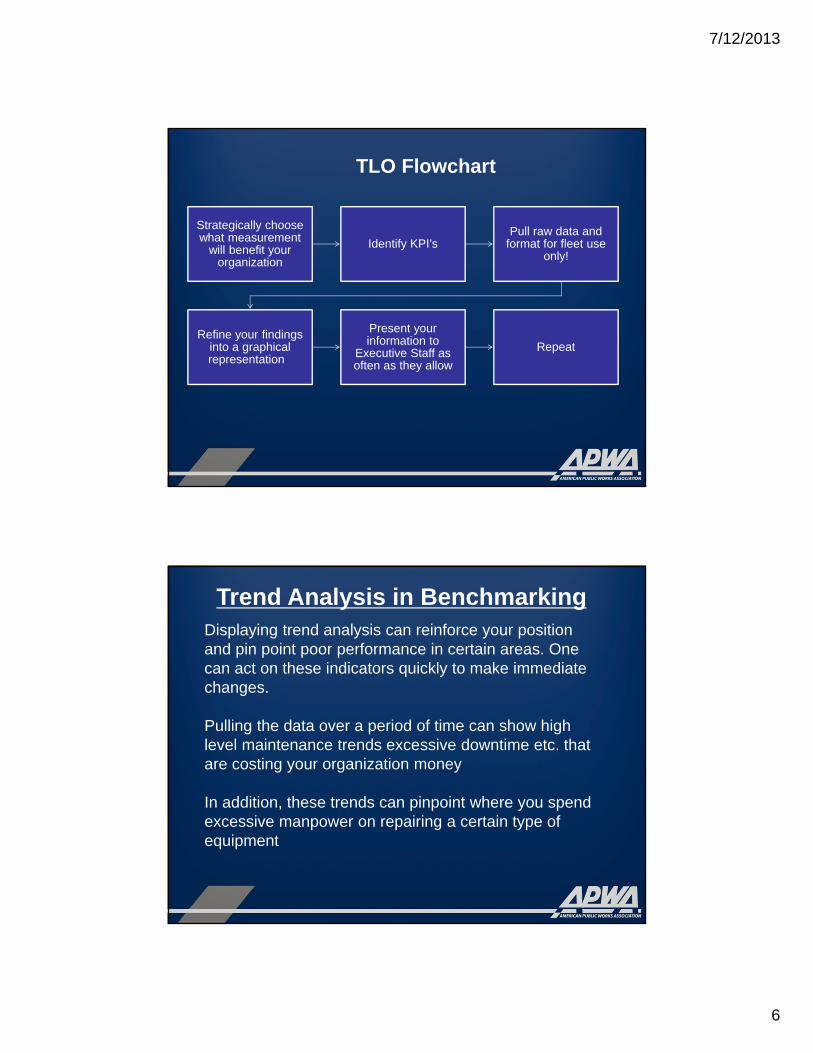
TLO Flowchart
Strategically choose what measurement
will benefit your organization
Identify KPI’s Pull raw data and
format for fleet use only!
Refine your findings into a graphical representation
Present your information to
Executive Staff as often as they allow
Repeat
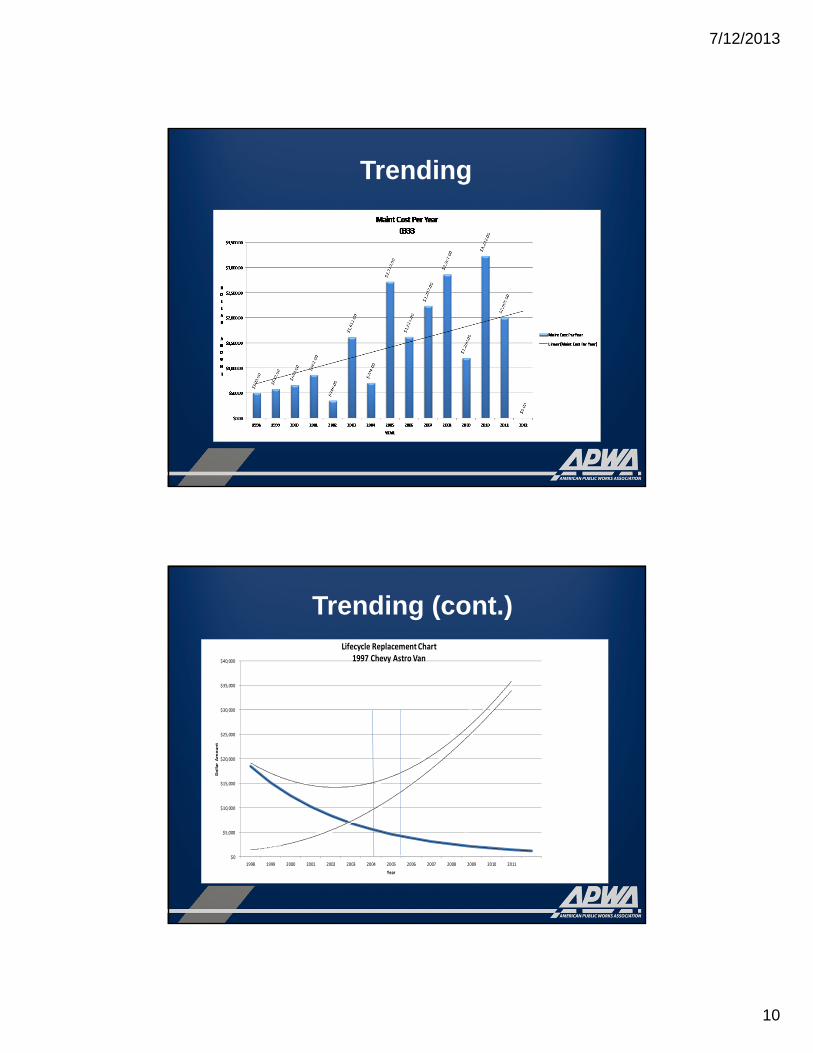
Trend Analysis in BenchmarkingDisplaying trend analysis can reinforce your position and pin point poor performance in certain areas. One can act on these indicators quickly to make immediate changes.
Pulling the data over a period of time can show high level maintenance trends excessive downtime etc. that are costing your organization money
In addition, these trends can pinpoint where you spend excessive manpower on repairing a certain type of equipment
7/12/2013
7
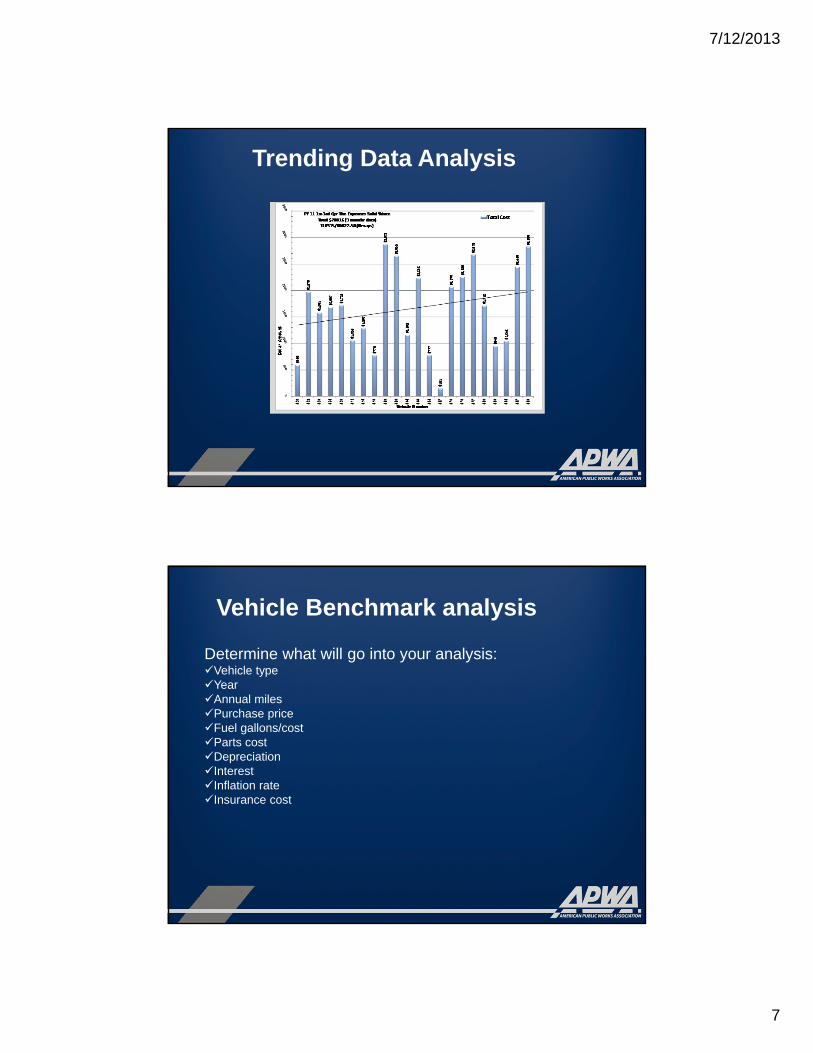
Trending Data Analysis
Vehicle Benchmark analysis
Determine what will go into your analysis: Vehicle typeYear Annual milesPurchase priceFuel gallons/costParts costDepreciation Interest Inflation rateInsurance cost
7/12/2013
8
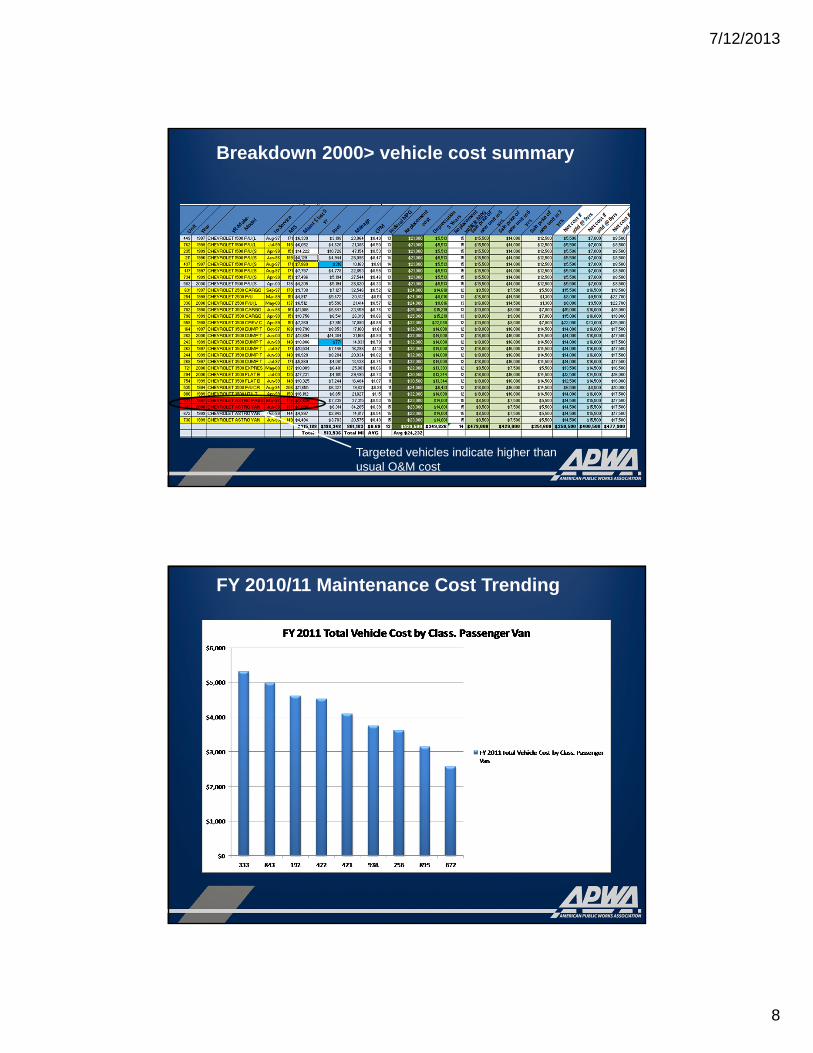
Breakdown 2000> vehicle cost summary
Targeted vehicles indicate higher than usual O&M cost
FY 2010/11 Maintenance Cost Trending
7/12/2013
9
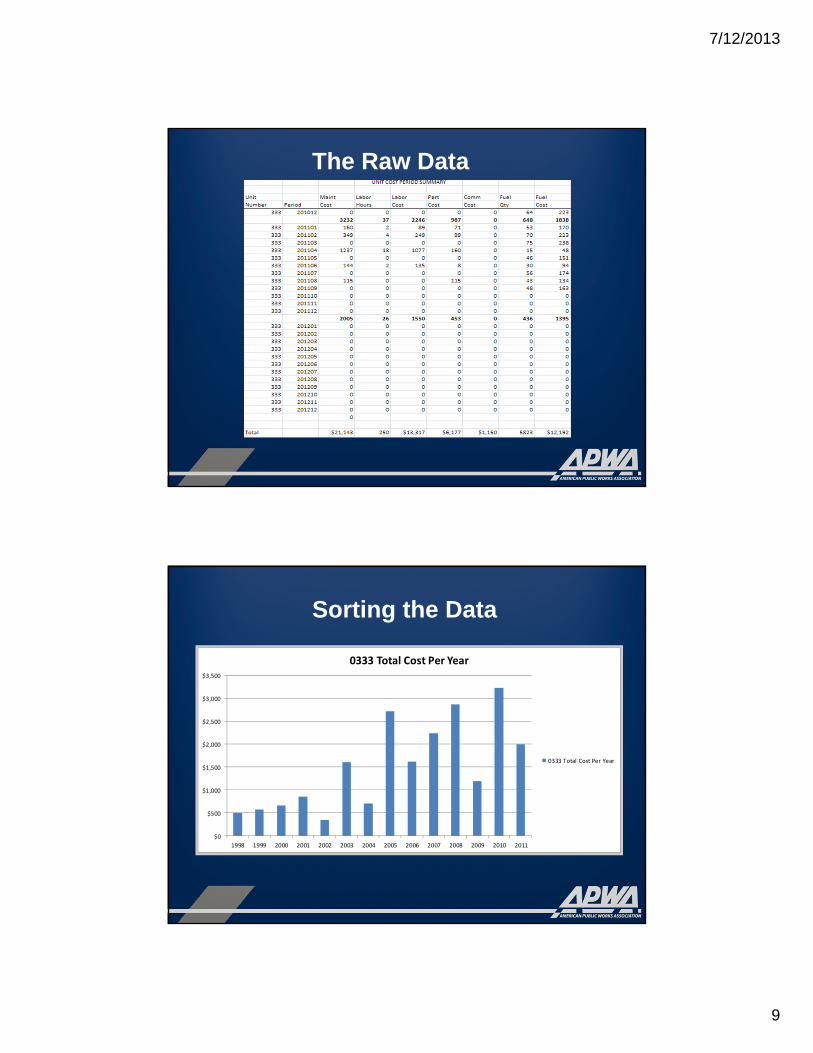
The Raw Data
Sorting the Data
$0
$500
$1,000
$1,500
$2,000
$2,500
$3,000
$3,500
1998 1999 2000 2001 2002 2003 2004 2005 2006 2007 2008 2009 2010 2011
0333 Total Cost Per Year
0333 Total Cost Per Year
7/12/2013
10
Trending
Trending (cont.)
$0
$5,000
$10,000
$15,000
$20,000
$25,000
$30,000
$35,000
$40,000
1998 1999 2000 2001 2002 2003 2004 2005 2006 2007 2008 2009 2010 2011
Dollar Amount
Year
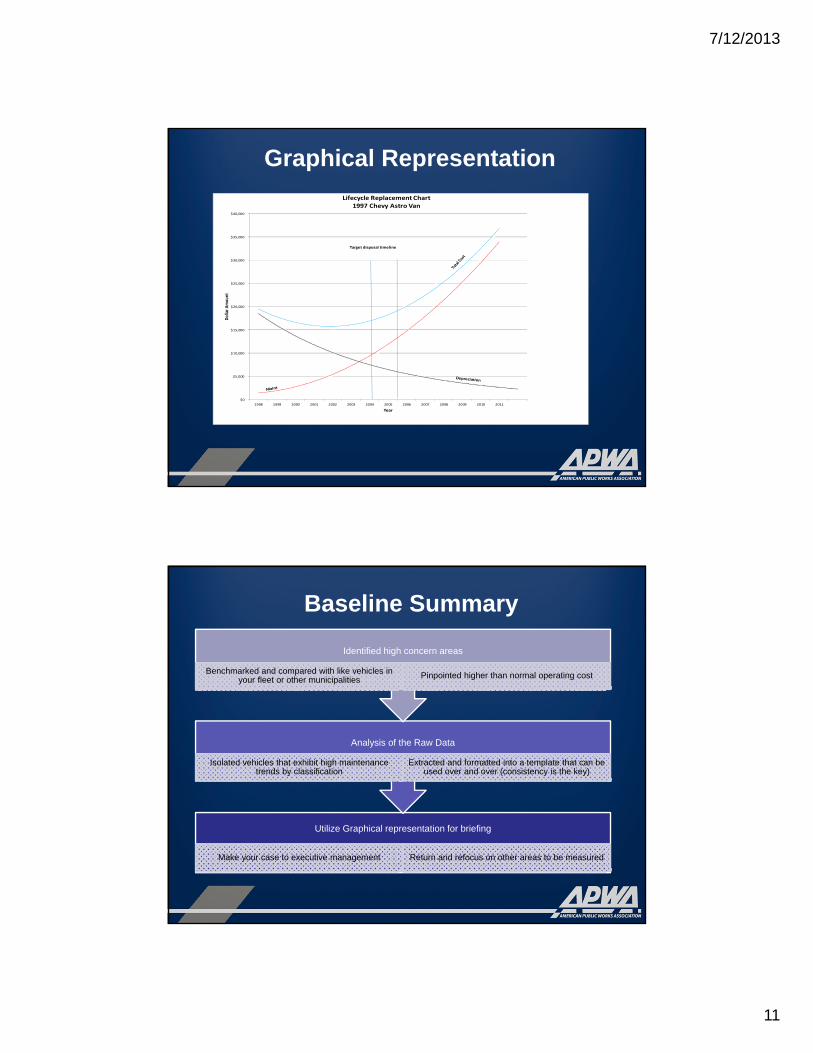
Lifecycle Replacement Chart1997 Chevy Astro Van
Target disposal timeline
7/12/2013
11
Graphical Representation
$0
$5,000
$10,000
$15,000
$20,000
$25,000
$30,000
$35,000
$40,000
1998 1999 2000 2001 2002 2003 2004 2005 2006 2007 2008 2009 2010 2011
Dollar A
mou
nt
Year
Lifecycle Replacement Chart1997 Chevy Astro Van
Target disposal timeline
Baseline Summary
Utilize Graphical representation for briefing
Make your case to executive management Return and refocus on other areas to be measured
Analysis of the Raw Data
Isolated vehicles that exhibit high maintenance trends by classification
Extracted and formatted into a template that can be used over and over (consistency is the key)
Identified high concern areas
Benchmarked and compared with like vehicles in your fleet or other municipalities Pinpointed higher than normal operating cost
7/12/2013
12
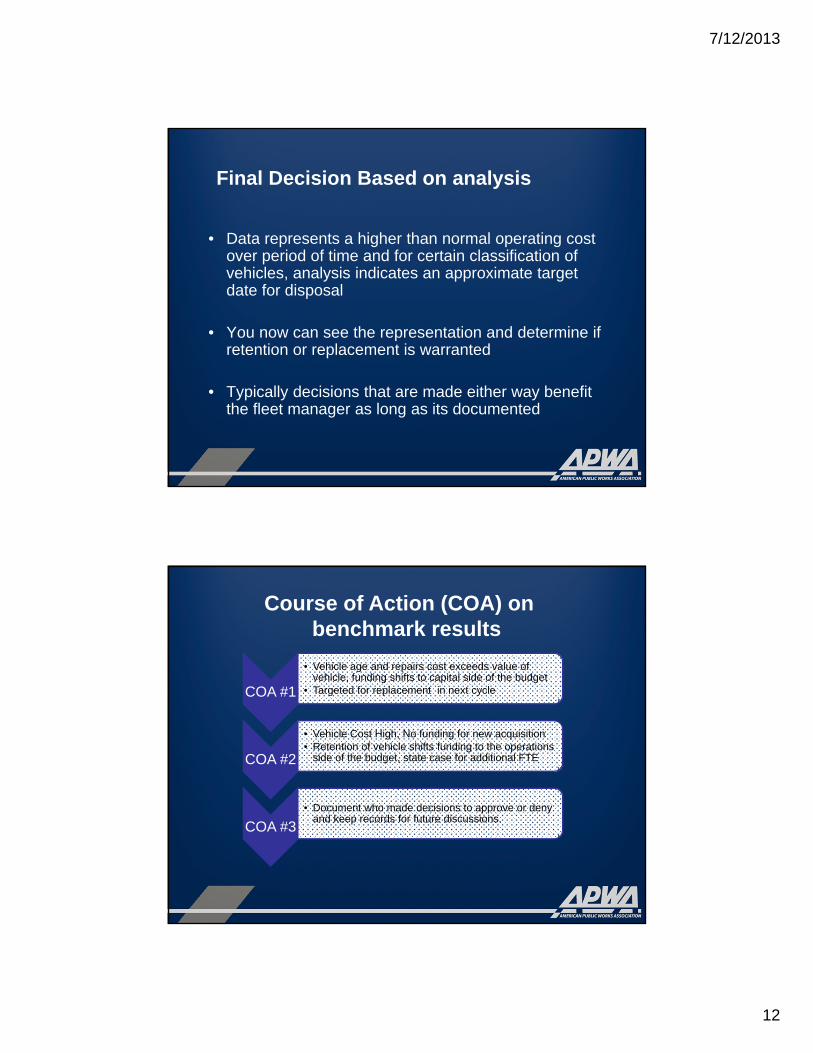
Final Decision Based on analysis
• Data represents a higher than normal operating cost over period of time and for certain classification of vehicles, analysis indicates an approximate target date for disposal
• You now can see the representation and determine if retention or replacement is warranted
• Typically decisions that are made either way benefit the fleet manager as long as its documented
Course of Action (COA) on benchmark results
COA #1
• Vehicle age and repairs cost exceeds value of vehicle, funding shifts to capital side of the budget
• Targeted for replacement in next cycle
COA #2
• Vehicle Cost High, No funding for new acquisition• Retention of vehicle shifts funding to the operations
side of the budget, state case for additional FTE
COA #3• Document who made decisions to approve or deny
and keep records for future discussions.
7/12/2013
13
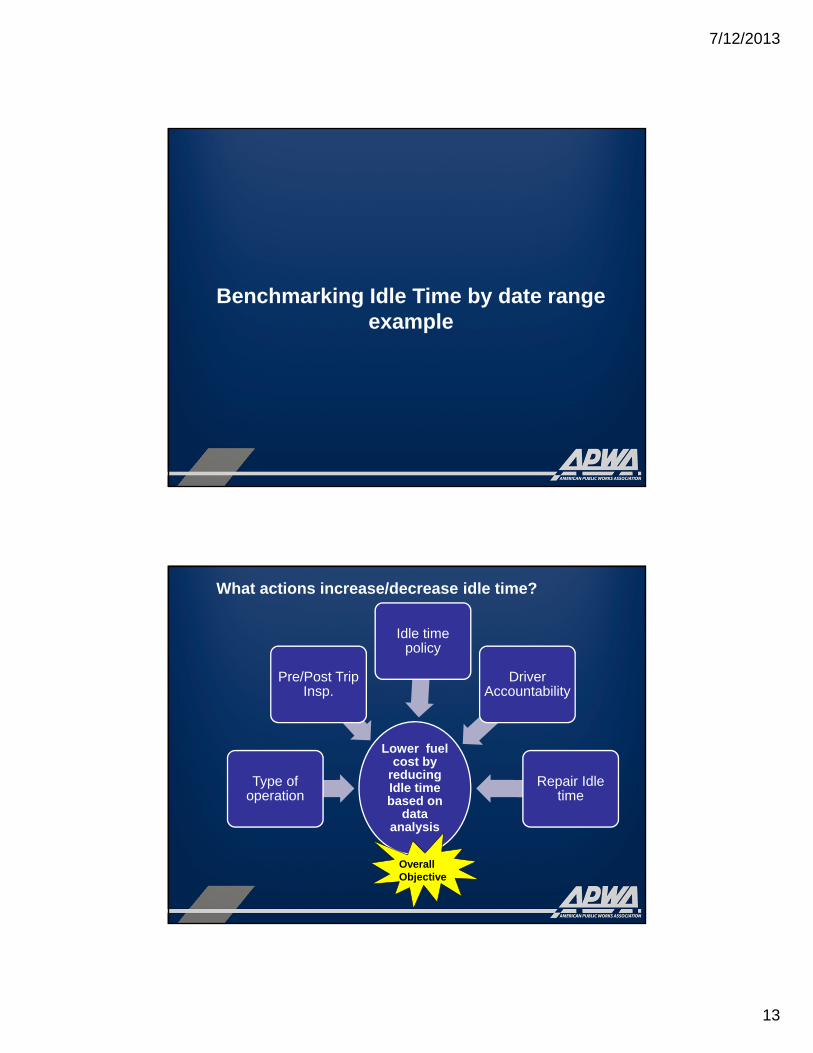
Benchmarking Idle Time by date range example
What actions increase/decrease idle time?
Lower fuel cost by
reducing Idle time based on
data analysis
Type of operation
Pre/Post Trip Insp.
Idle time policy
Driver Accountability
Repair Idle time
Overall Objective
7/12/2013
14
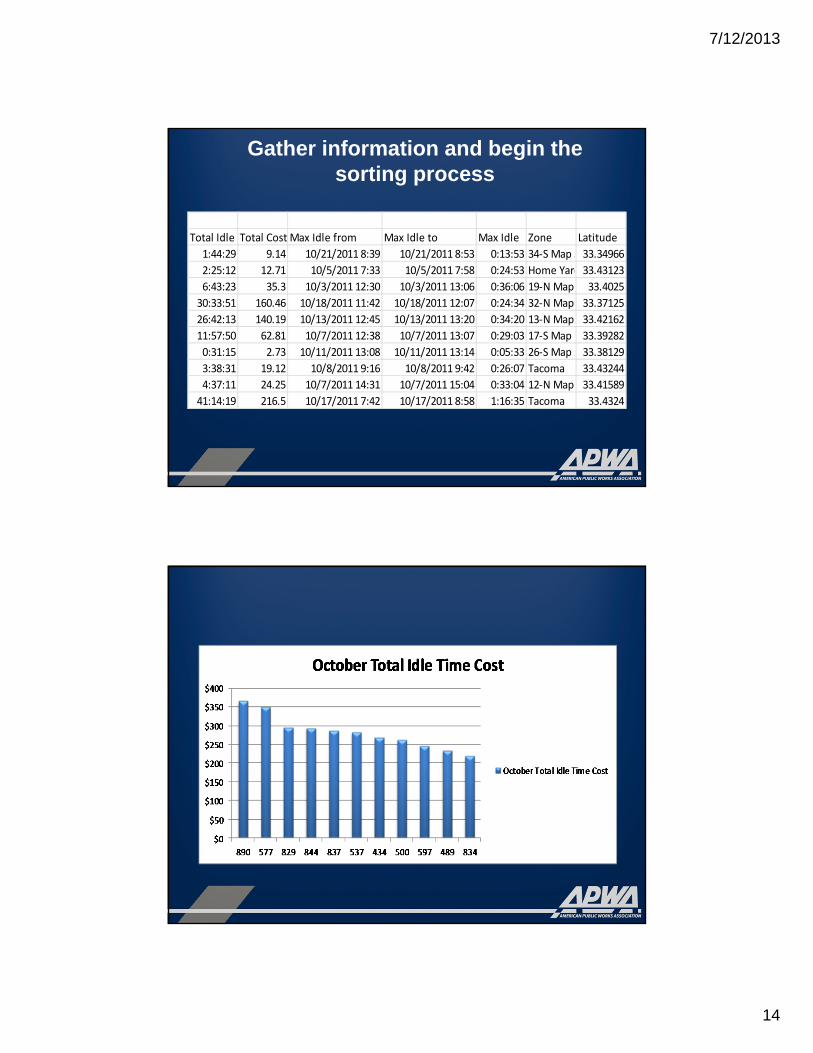
Gather information and begin the sorting process
Total Idle Total Cost Max Idle from Max Idle to Max Idle Zone Latitude
1:44:29 9.14 10/21/2011 8:39 10/21/2011 8:53 0:13:53 34‐S Map 3 33.34966
2:25:12 12.71 10/5/2011 7:33 10/5/2011 7:58 0:24:53 Home Yard 33.43123
6:43:23 35.3 10/3/2011 12:30 10/3/2011 13:06 0:36:06 19‐N Map 33.4025
30:33:51 160.46 10/18/2011 11:42 10/18/2011 12:07 0:24:34 32‐N Map 33.37125
26:42:13 140.19 10/13/2011 12:45 10/13/2011 13:20 0:34:20 13‐N Map 33.42162
11:57:50 62.81 10/7/2011 12:38 10/7/2011 13:07 0:29:03 17‐S Map 1 33.39282
0:31:15 2.73 10/11/2011 13:08 10/11/2011 13:14 0:05:33 26‐S Map 2 33.38129
3:38:31 19.12 10/8/2011 9:16 10/8/2011 9:42 0:26:07 Tacoma 33.43244
4:37:11 24.25 10/7/2011 14:31 10/7/2011 15:04 0:33:04 12‐N Map 33.41589
41:14:19 216.5 10/17/2011 7:42 10/17/2011 8:58 1:16:35 Tacoma 33.4324
7/12/2013
15
Practical Exercise Sort & Graph Data
Enabling Learning Objective(ELO #1)
Using idle information from Zonar, export, sort data, make table and graph
7/12/2013
16
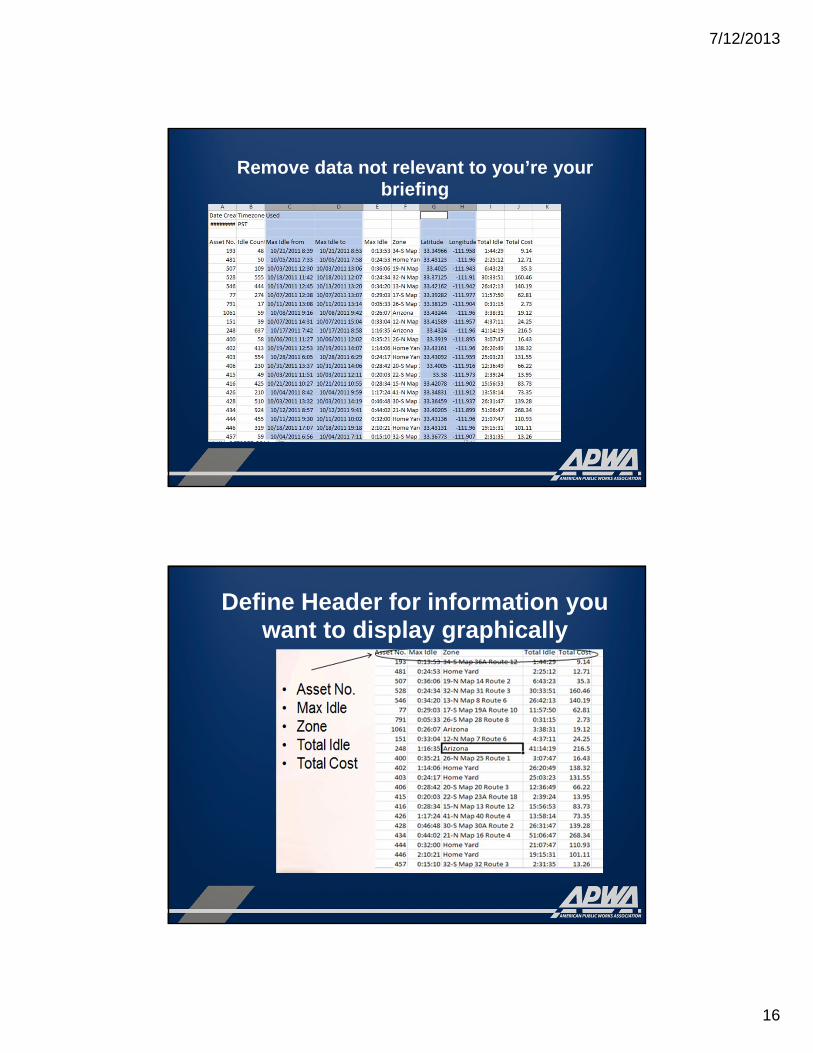
Remove data not relevant to you’re your briefing
Define Header for information you want to display graphically
7/12/2013
17
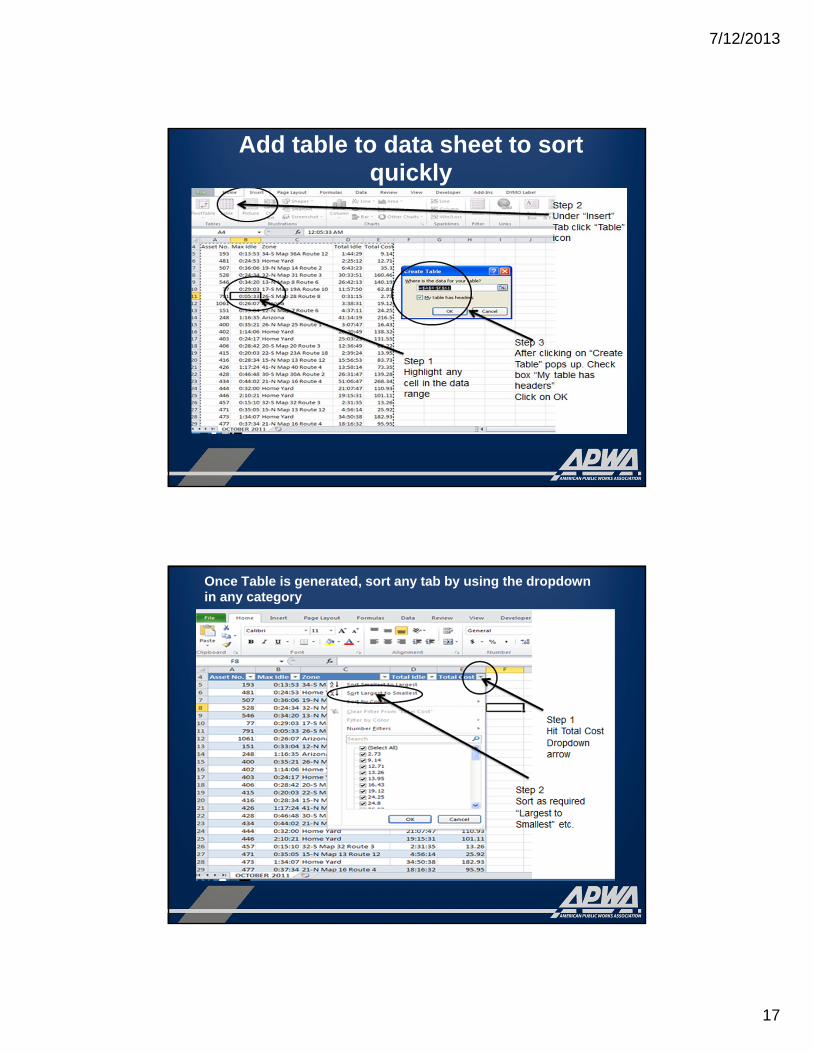
Add table to data sheet to sort quickly
Once Table is generated, sort any tab by using the dropdown in any category
7/12/2013
18
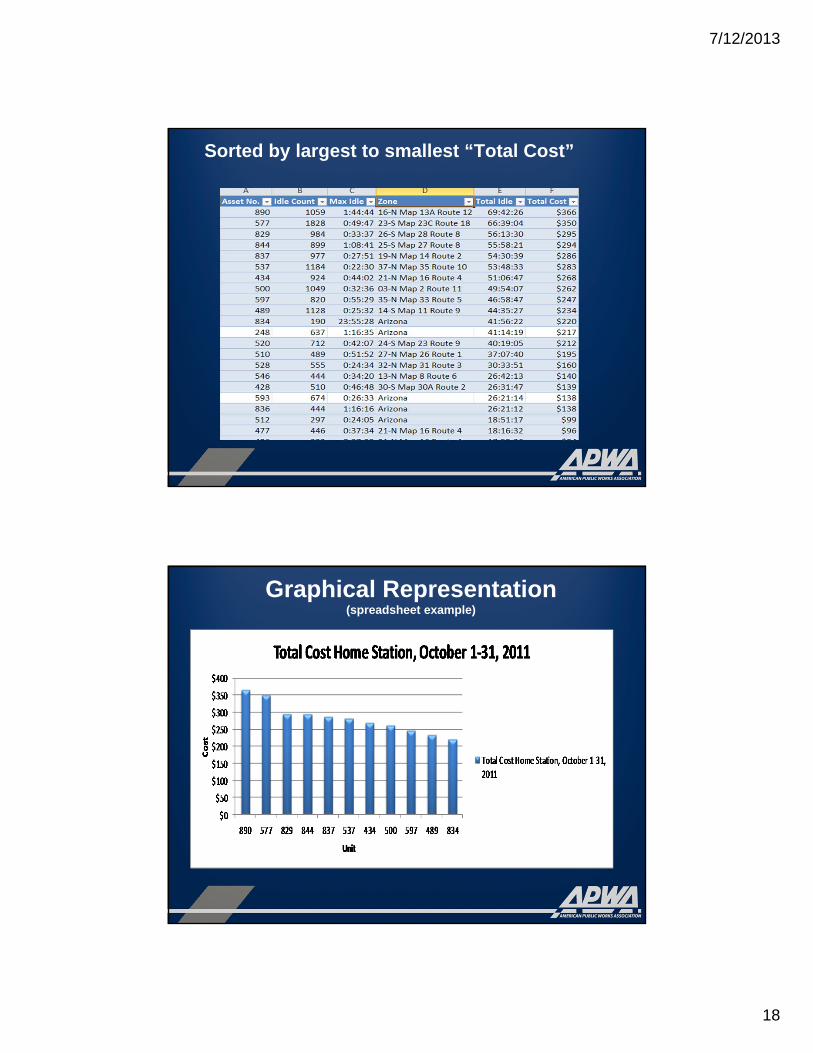
Sorted by largest to smallest “Total Cost”
Graphical Representation(spreadsheet example)
7/12/2013
19
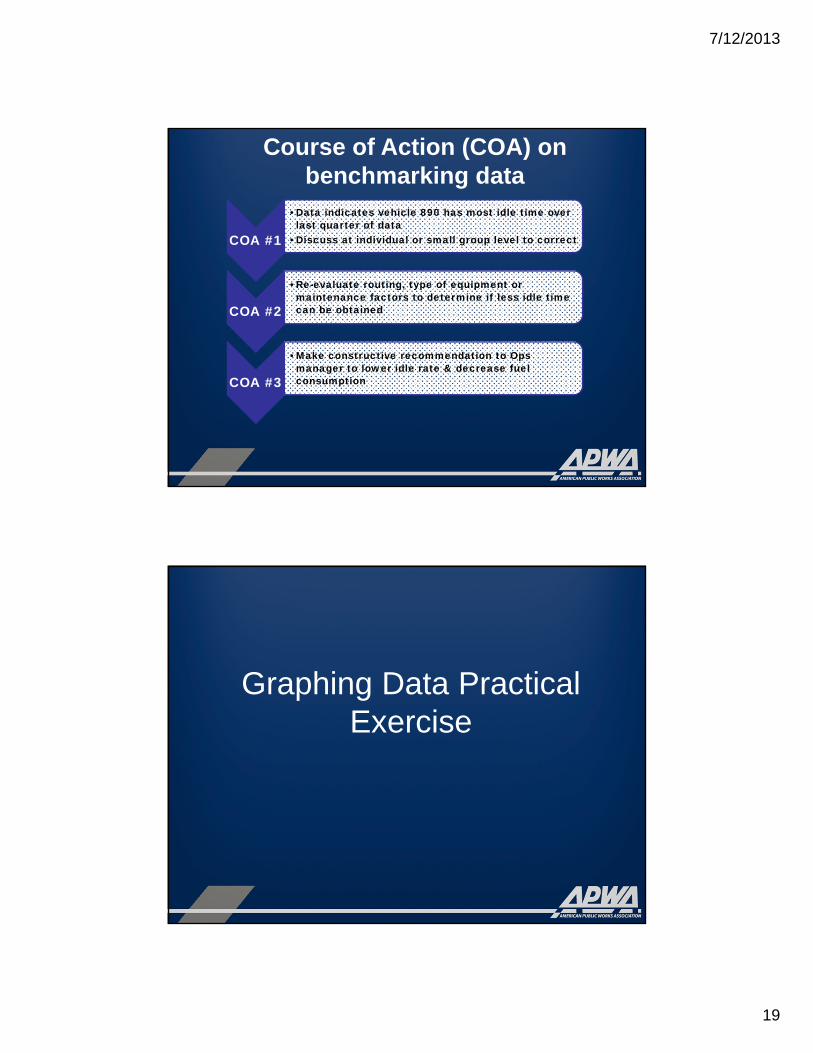
Course of Action (COA) on benchmarking data
COA #1
•Data indicates vehicle 890 has most idle time over last quarter of data
•Discuss at individual or small group level to correct
COA #2
•Re-evaluate routing, type of equipment or maintenance factors to determine if less idle time can be obtained
COA #3
•Make constructive recommendation to Ops manager to lower idle rate & decrease fuel consumption
Graphing Data Practical Exercise
7/12/2013
20
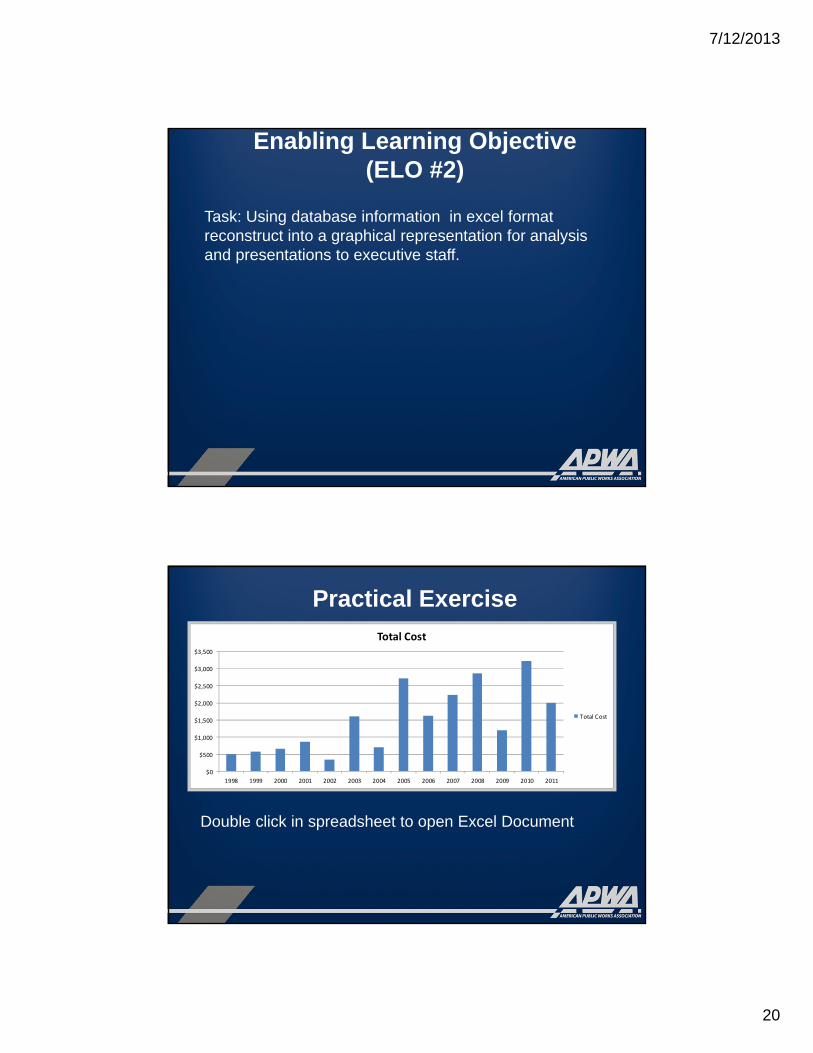
Enabling Learning Objective(ELO #2)
Task: Using database information in excel format reconstruct into a graphical representation for analysis and presentations to executive staff.
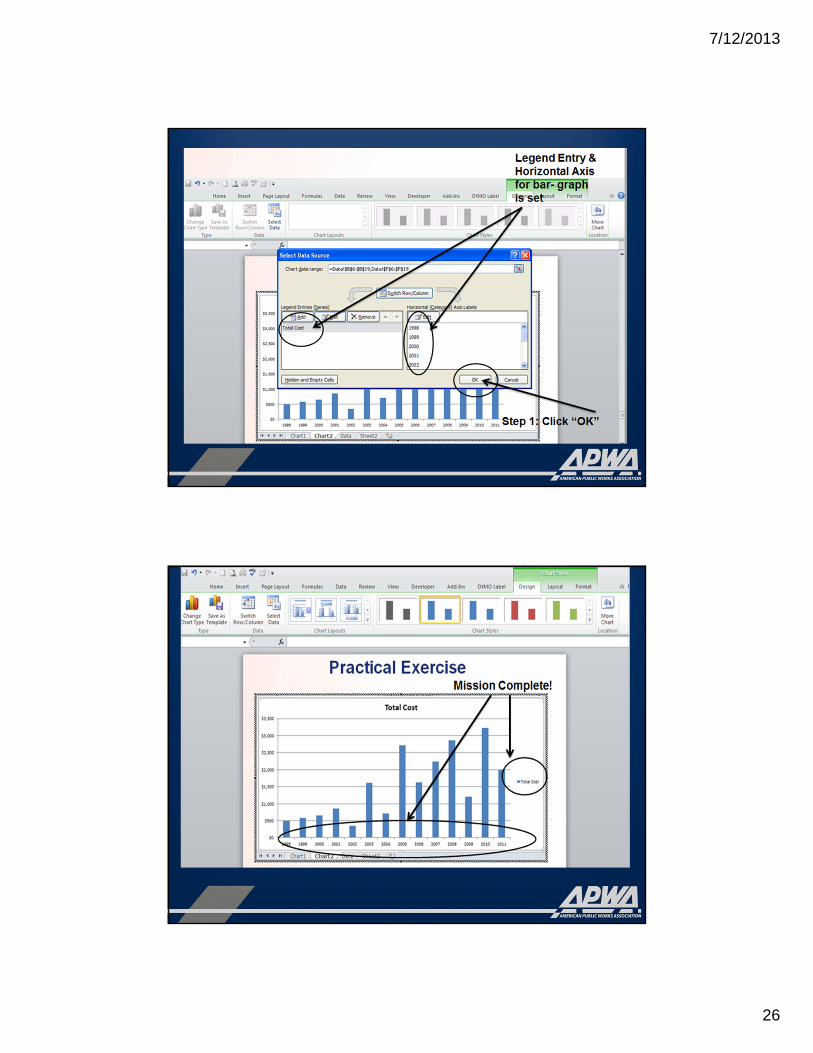
Practical Exercise
$0
$500
$1,000
$1,500
$2,000
$2,500
$3,000
$3,500
1998 1999 2000 2001 2002 2003 2004 2005 2006 2007 2008 2009 2010 2011
Total Cost
Total Cost
Double click in spreadsheet to open Excel Document
7/12/2013
21
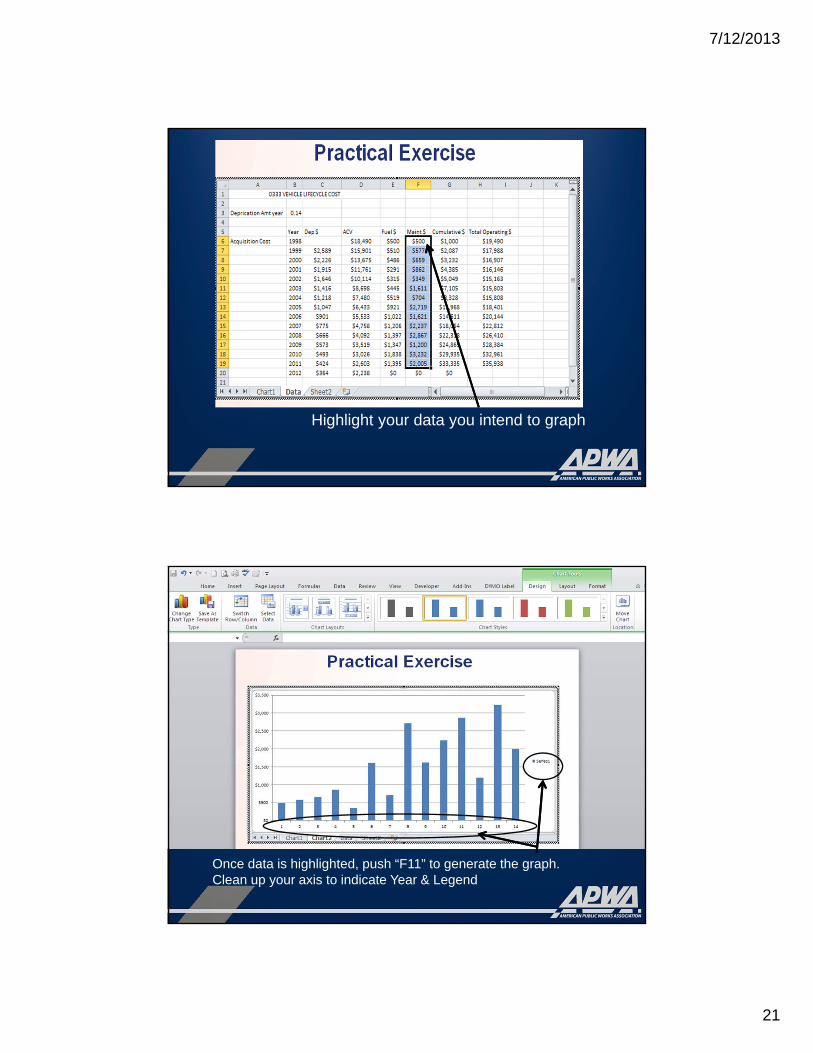
Highlight your data you intend to graph
Once data is highlighted, push “F11” to generate the graph.Clean up your axis to indicate Year & Legend
7/12/2013
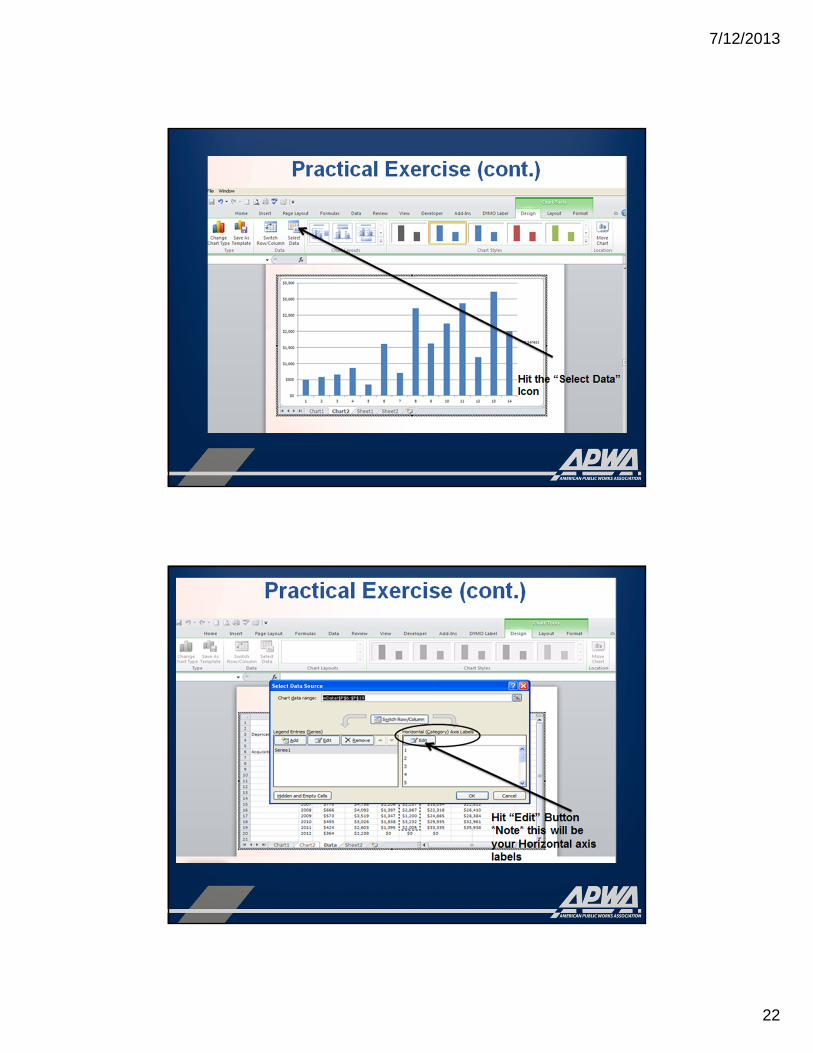
22
7/12/2013
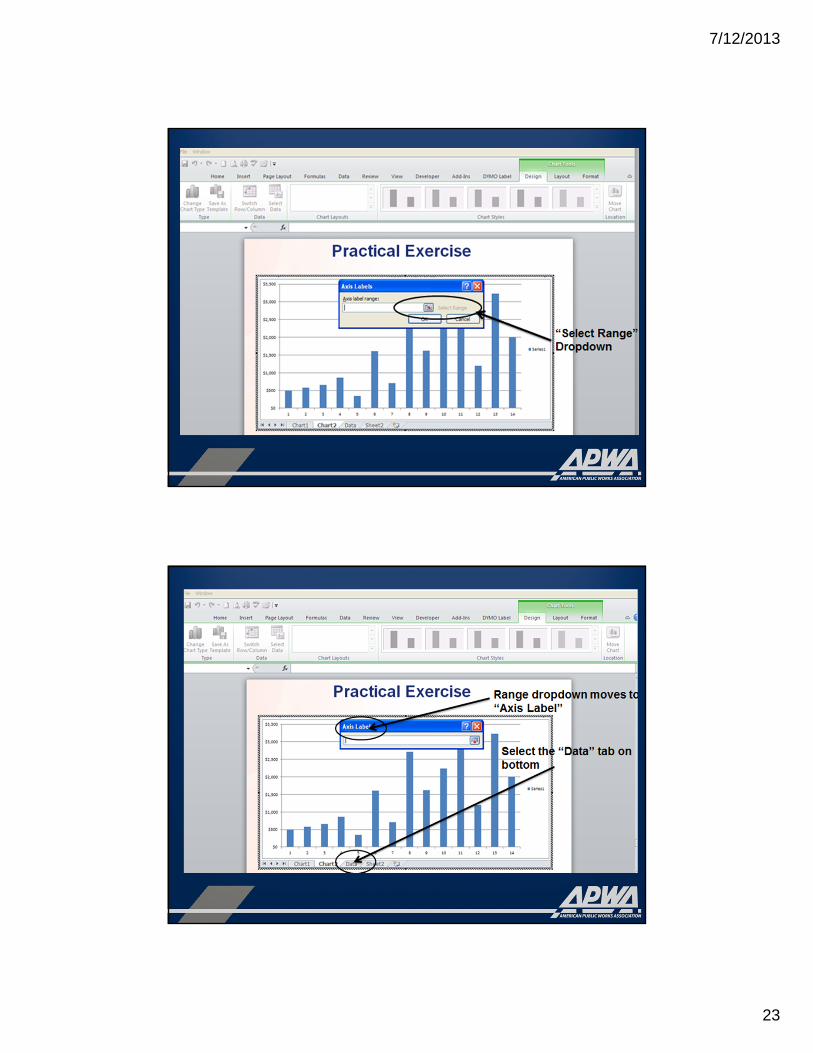
23
7/12/2013
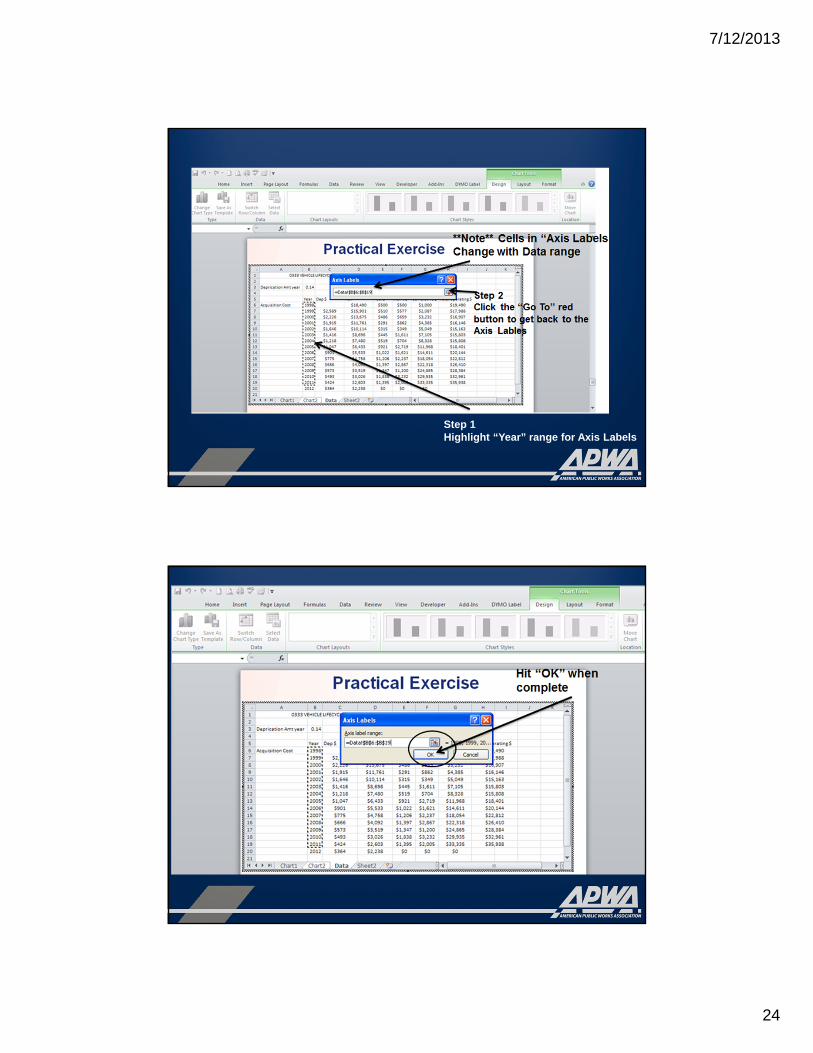
24
Step 1 Highlight “Year” range for Axis Labels
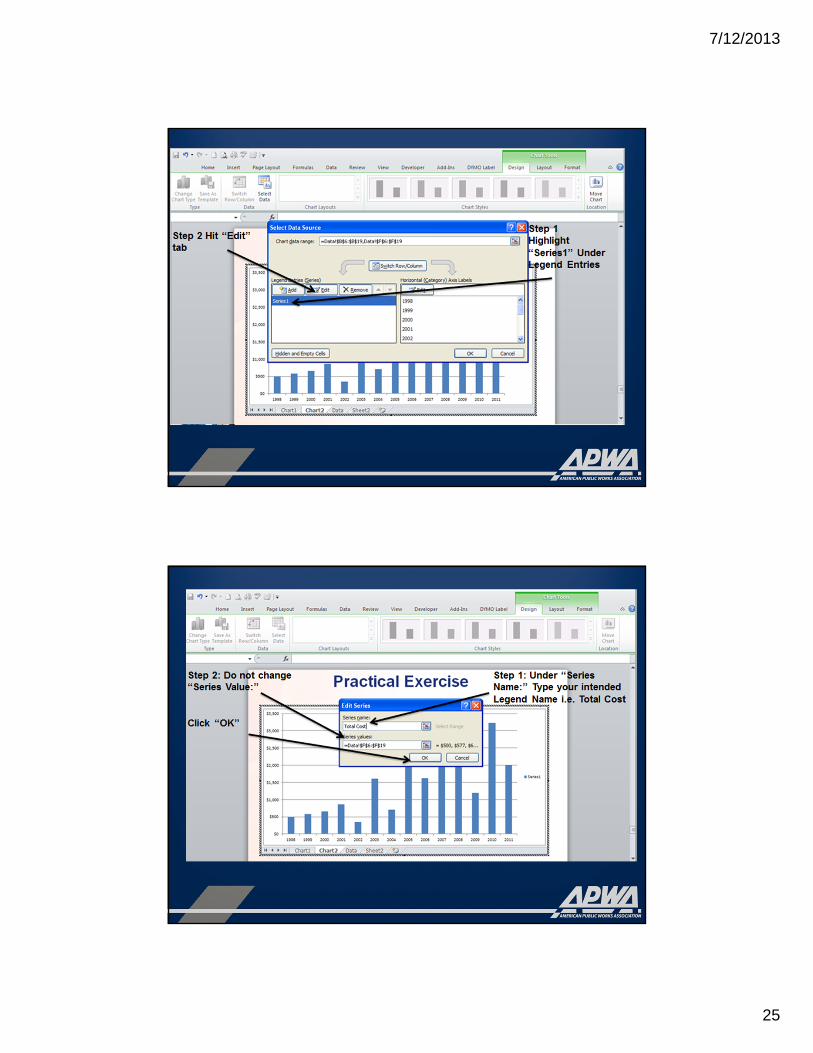
7/12/2013
25
7/12/2013
26
7/12/2013
27
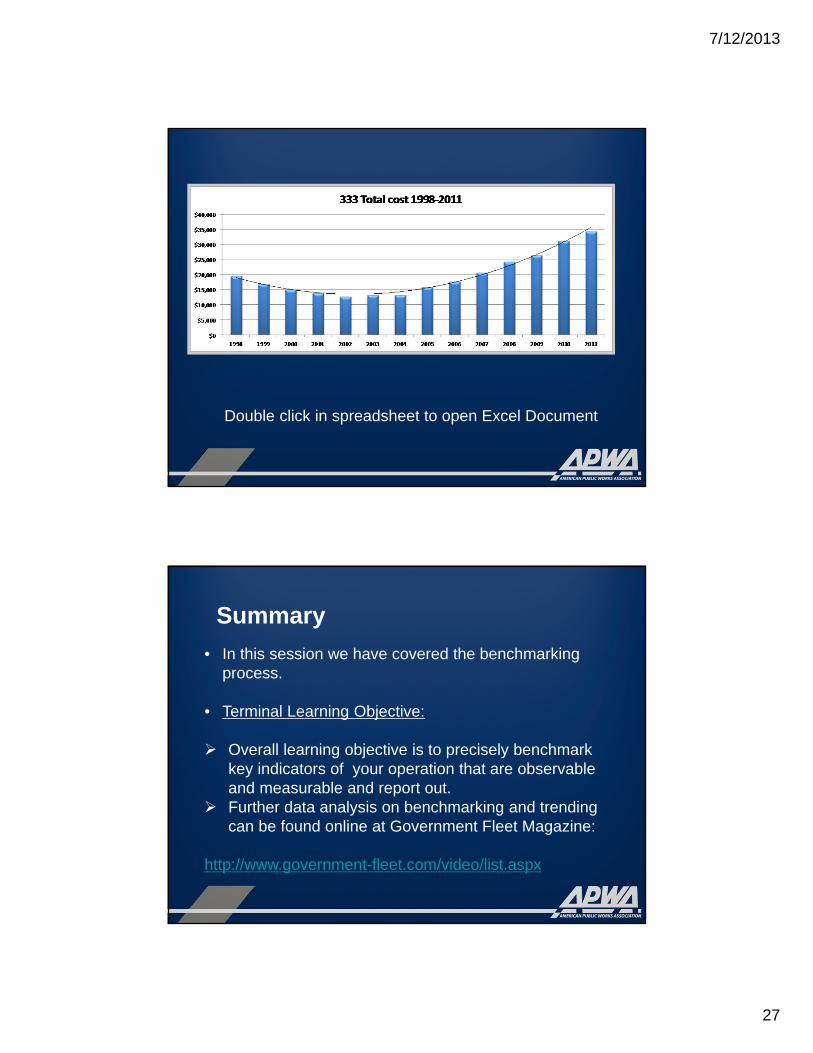
Double click in spreadsheet to open Excel Document
Summary
• In this session we have covered the benchmarking process.
• Terminal Learning Objective:
Overall learning objective is to precisely benchmark key indicators of your operation that are observable and measurable and report out.
Further data analysis on benchmarking and trending can be found online at Government Fleet Magazine:
http://www.government-fleet.com/video/list.aspx
7/12/2013
28