Embed Size (px)
Citation preview
8.08 REAL-TIME VERIFICATION OF MESOSCALE MODEL PRODUCTS OVER COMPLEX TERRAIN
Manfred Dorninger*, R. Steinacker, T. Gorgas, B. Chimani, S. Tschannett, B. Bica
University of Vienna
Vienna, Austria
1. INTRODUCTION
Verification of NWP model products is done
primarily through comparison of model analysed
fields or through a comparison of selected surface
stations with nearby grid points. The new generation
of operational mesoscale forecast models with a
horizontal resolution of around 4km does not
contain its own data assimilation system in general
and consequently does not produce an analysis
field. Further, the horizontal resolution is still too
rough to compare instantaneous values of surface
stations especially over complex terrain with model
grid points with success.
The analysis tool VERA (Vienna Enhanced
Resolution Analysis) fits this gap. It produces
surface fields of potential temperature, equivalent
potential temperature, mean sea level pressure and
10m wind on a regular basis in real time without
using a first guess field. It is therefore best suited to
serve as an independent reference for model
evaluation. Downscaling of the fields in data sparse
areas is performed by using the fingerprint
technique, which introduces an a priori physical
knowledge of the field distribution over complex
terrain. For a detailed discussion on VERA including
the treating of the data quality problem see e.g.
Steinacker et al. (2000), Häberli et al. (2004), Bica
et al. (2005) , Steinacker et al. (2005) and
Tschannett et al. (2005).
* Corresponding author address:
Manfred Dorninger, University of Vienna,
Dept. of Meteorology and Geophysics , UZA II,
Althanstraße 14, 1090 Vienna, Austria;
e-mail: [email protected]
2. NWP-MODELS
Currently products of three operational NWP-
models are compared with the VERA fields. These
are the ALADIN, the LM and the IFS-ECMWF
model. The evaluation is performed over the larger
Alpine area. ALADIN and LM are limited area
models with a horizontal resolution of 9 km and 7
km, respectively. Both, the surface fields of the 00
UTC-run as well as of the 12 UTC run are available
and evaluated on an hourly interval. The IFS model
of the ECMWF is a spectral (T511) and global
model. From this model the surface fields of the 12
UTC run on a three hourly interval enter the
evaluation procedure
3. COMPARISON METHOD
Since the VERA parameters like potential
temperature and equivalent potential temperature
are not standard model output parameters, they are
calculated from the appropriate model parameters
of the model surface. In a second step the model
data are interpolated to the VERA grid by using a
simple inverse distance weighting scheme
(Cressman scheme). In a final step the differences
between the VERA topography and the model
topography are taken into account by using the
values of the standard atmosphere for the vertical
interpolation.
3. RESULTS
3.1 Case study: Cold front with squall line
A squall line forms in front of a cold front over
southern Germany on June 23rd, 2002. The cold air
outflow stemming from this squall line rushes down
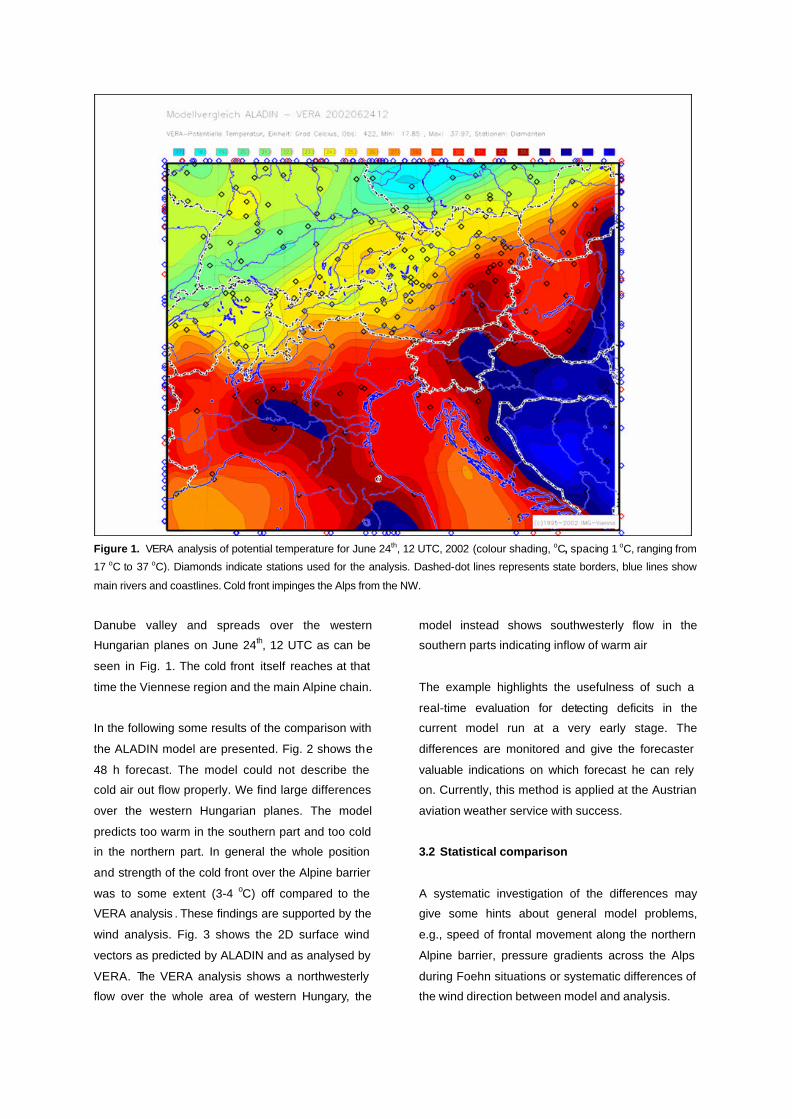
Figure 1. VERA analysis of potential temperature for June 24th, 12 UTC, 2002 (colour shading, oC, spacing 1 oC, ranging from
17 oC to 37 oC). Diamonds indicate stations used for the analysis. Dashed-dot lines represents state borders, blue lines show
main rivers and coastlines. Cold front impinges the Alps from the NW.
Danube valley and spreads over the western
Hungarian planes on June 24th, 12 UTC as can be
seen in Fig. 1. The cold front itself reaches at that
time the Viennese region and the main Alpine chain.
In the following some results of the comparison with
the ALADIN model are presented. Fig. 2 shows the
48 h forecast. The model could not describe the
cold air out flow properly. We find large differences
over the western Hungarian planes. The model
predicts too warm in the southern part and too cold
in the northern part. In general the whole position
and strength of the cold front over the Alpine barrier
was to some extent (3-4 oC) off compared to the
VERA analysis . These findings are supported by the
wind analysis. Fig. 3 shows the 2D surface wind
vectors as predicted by ALADIN and as analysed by
VERA. The VERA analysis shows a northwesterly
flow over the whole area of western Hungary, the
model instead shows southwesterly flow in the
southern parts indicating inflow of warm air
The example highlights the usefulness of such a
real-time evaluation for detecting deficits in the
current model run at a very early stage. The
differences are monitored and give the forecaster
valuable indications on which forecast he can rely
on. Currently, this method is applied at the Austrian
aviation weather service with success.
3.2 Statistical comparison
A systematic investigation of the differences may
give some hints about general model problems,
e.g., speed of frontal movement along the northern
Alpine barrier, pressure gradients across the Alps
during Foehn situations or systematic differences of
the wind direction between model and analysis.
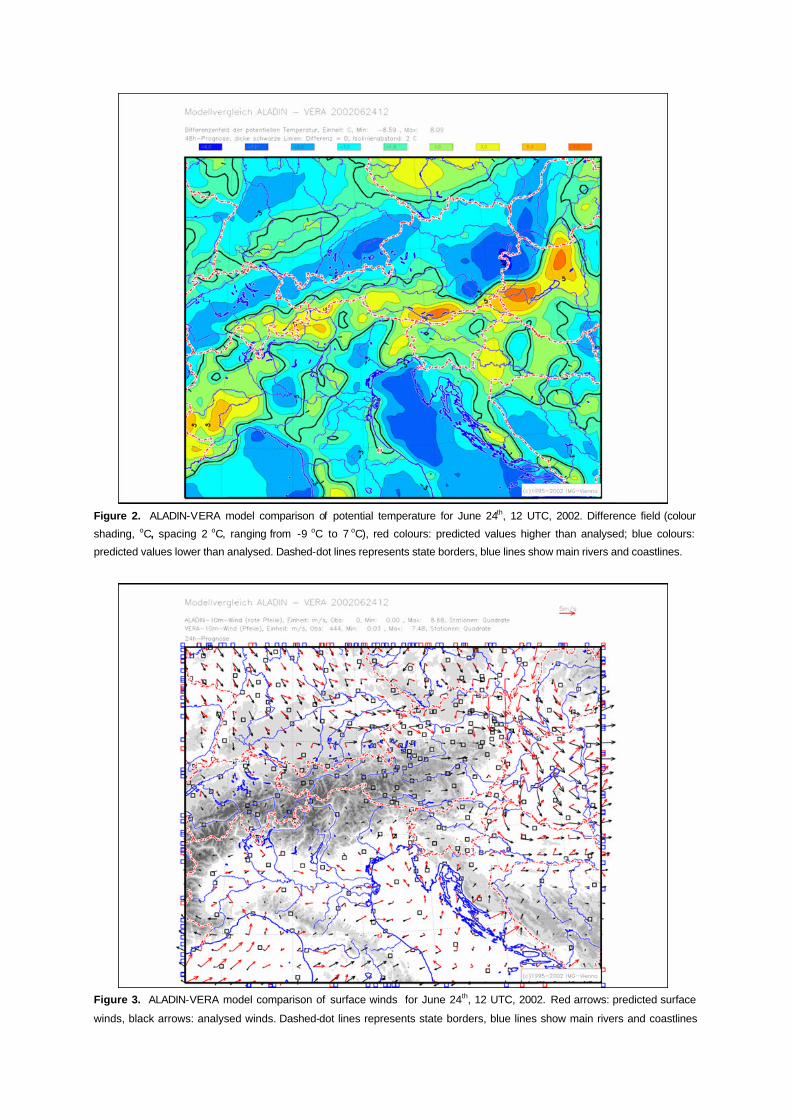
Figure 2. ALADIN-VERA model comparison of potential temperature for June 24th, 12 UTC, 2002. Difference field (colour
shading, oC, spacing 2 oC, ranging from -9 oC to 7 oC), red colours: predicted values higher than analysed; blue colours:
predicted values lower than analysed. Dashed-dot lines represents state borders, blue lines show main rivers and coastlines.
Figure 3. ALADIN-VERA model comparison of surface winds for June 24th, 12 UTC, 2002. Red arrows: predicted surface
winds, black arrows: analysed winds. Dashed-dot lines represents state borders, blue lines show main rivers and coastlines
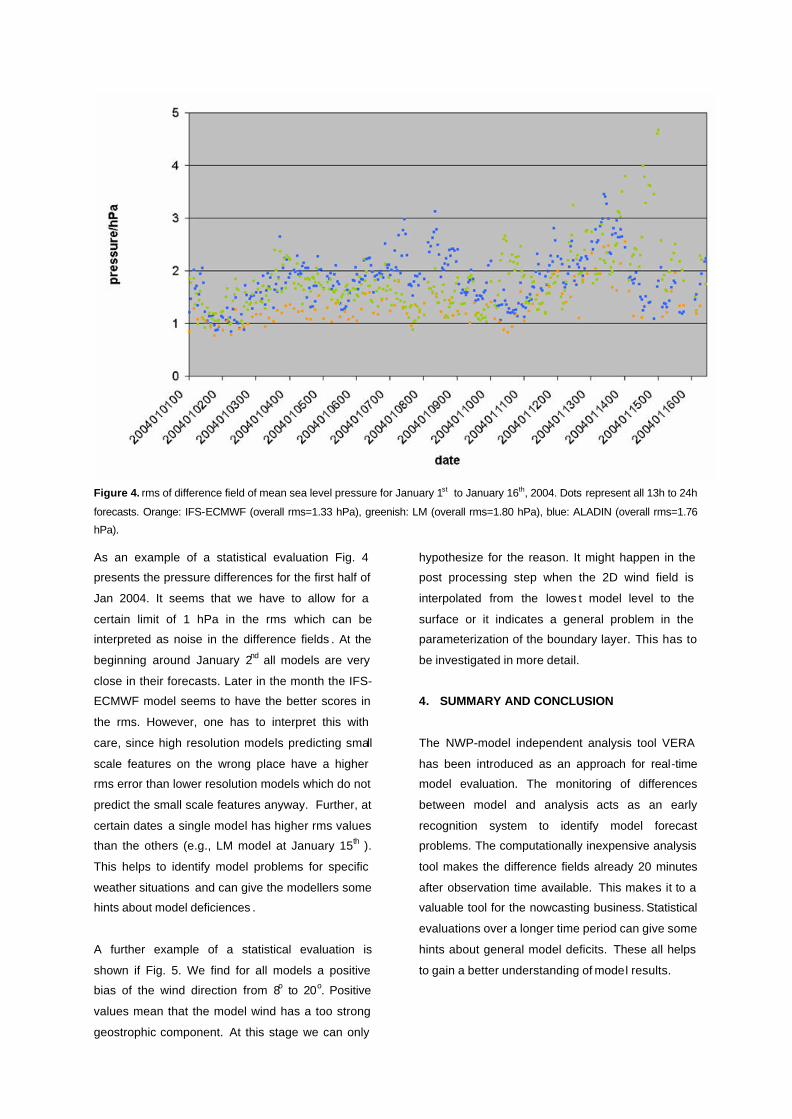
Figure 4. rms of difference field of mean sea level pressure for January 1st to January 16th, 2004. Dots represent all 13h to 24h
forecasts. Orange: IFS-ECMWF (overall rms=1.33 hPa), greenish: LM (overall rms=1.80 hPa), blue: ALADIN (overall rms=1.76
hPa).
As an example of a statistical evaluation Fig. 4
presents the pressure differences for the first half of
Jan 2004. It seems that we have to allow for a
certain limit of 1 hPa in the rms which can be
interpreted as noise in the difference fields . At the
beginning around January 2nd all models are very
close in their forecasts. Later in the month the IFS-
ECMWF model seems to have the better scores in
the rms. However, one has to interpret this with
care, since high resolution models predicting small
scale features on the wrong place have a higher
rms error than lower resolution models which do not
predict the small scale features anyway. Further, at
certain dates a single model has higher rms values
than the others (e.g., LM model at January 15th ).
This helps to identify model problems for specific
weather situations and can give the modellers some
hints about model deficiences .
A further example of a statistical evaluation is
shown if Fig. 5. We find for all models a positive
bias of the wind direction from 8o to 20o. Positive
values mean that the model wind has a too strong
geostrophic component. At this stage we can only
hypothesize for the reason. It might happen in the
post processing step when the 2D wind field is
interpolated from the lowes t model level to the
surface or it indicates a general problem in the
parameterization of the boundary layer. This has to
be investigated in more detail.
4. SUMMARY AND CONCLUSION
The NWP-model independent analysis tool VERA
has been introduced as an approach for real-time
model evaluation. The monitoring of differences
between model and analysis acts as an early
recognition system to identify model forecast
problems. The computationally inexpensive analysis
tool makes the difference fields already 20 minutes
after observation time available. This makes it to a
valuable tool for the nowcasting business. Statistical
evaluations over a longer time period can give some
hints about general model deficits. These all helps
to gain a better understanding of model results.
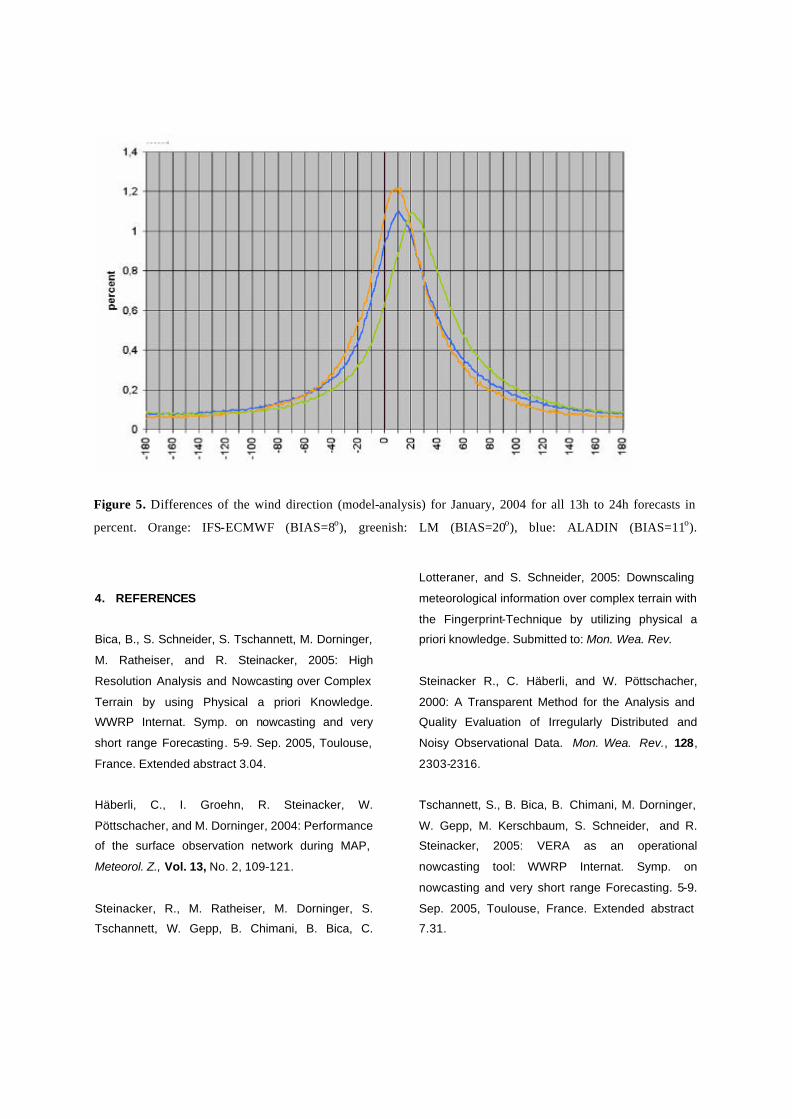
Figure 5. Differences of the wind direction (model-analysis) for January, 2004 for all 13h to 24h forecasts in
percent. Orange: IFS-ECMWF (BIAS=8o), greenish: LM (BIAS=20o), blue: ALADIN (BIAS=11o).
4. REFERENCES
Bica, B., S. Schneider, S. Tschannett, M. Dorninger,
M. Ratheiser, and R. Steinacker, 2005: High
Resolution Analysis and Nowcasting over Complex
Terrain by using Physical a priori Knowledge.
WWRP Internat. Symp. on nowcasting and very
short range Forecasting. 5-9. Sep. 2005, Toulouse,
France. Extended abstract 3.04.
Häberli, C., I. Groehn, R. Steinacker, W.
Pöttschacher, and M. Dorninger, 2004: Performance
of the surface observation network during MAP,
Meteorol. Z., Vol. 13, No. 2, 109-121.
Steinacker, R., M. Ratheiser, M. Dorninger, S.
Tschannett, W. Gepp, B. Chimani, B. Bica, C.
Lotteraner, and S. Schneider, 2005: Downscaling
meteorological information over complex terrain with
the Fingerprint-Technique by utilizing physical a
priori knowledge. Submitted to: Mon. Wea. Rev.
Steinacker R., C. Häberli, and W. Pöttschacher,
2000: A Transparent Method for the Analysis and
Quality Evaluation of Irregularly Distributed and
Noisy Observational Data. Mon. Wea. Rev., 128,
2303-2316.
Tschannett, S., B. Bica, B. Chimani, M. Dorninger,
W. Gepp, M. Kerschbaum, S. Schneider, and R.
Steinacker, 2005: VERA as an operational
nowcasting tool: WWRP Internat. Symp. on
nowcasting and very short range Forecasting. 5-9.
Sep. 2005, Toulouse, France. Extended abstract
7.31.
![Web viewChapter 8.08 - Solid Waste and Sludge (Superseded by chapter 8.08A) (Chapter 8.08, Solid Waste and Sludge, Res., July 15, 1963, vol. 12, p. 207; Res. 536[a], April 15](https://img.pdfslide.us/doc/110x75/5a9b5d497f8b9a451b8de1d5/viewchapter-808-solid-waste-and-sludge-superseded-by-chapter-808a-chapter.jpg)