Embed Size (px)
Citation preview
1
Working Paper No. 172
800 languages and counting:
Lessons from survey research
across a linguistically diverse
continent
by Carolyn Logan | May 2017
Afrobarometer Working Papers
Copyright ©Afrobarometer 2017 0
Working Paper No. 172
800 languages and counting:
Lessons from survey research
across a linguistically diverse
continent by Carolyn Logan | May 2017
Carolyn Logan is deputy director of Afrobarometer and assistant professor in the Department of Political Science at Michigan State University. Email: [email protected].
Abstract
Using data on more than 800 home languages identified during Afrobarometer Round 5 (2011/2013) surveys in 35 countries, as well as information on multilingualism gathered in 20 countries in Round 4 (2008/2009), this paper explores linguistic diversity and multilingualism at the individual level, within communities, and across countries. Afrobarometer data offer a unique perspective on the distribution of languages and language capabilities from the viewpoint of the users of language rather than those who study it. The paper also identifies some of the challenges encountered in collecting public opinion data in linguistically diverse environments. The findings reveal that even in many rural zones, many Africans are living within ethnically and linguistically diverse communities, and preliminary analysis suggests this may have important implications for social and political attitudes. The data have untapped potential for understanding language evolution and for studying language both as a product and as a variable driving attitudes and outcomes.
Afrobarometer Working Papers
Copyright ©Afrobarometer 2017 1
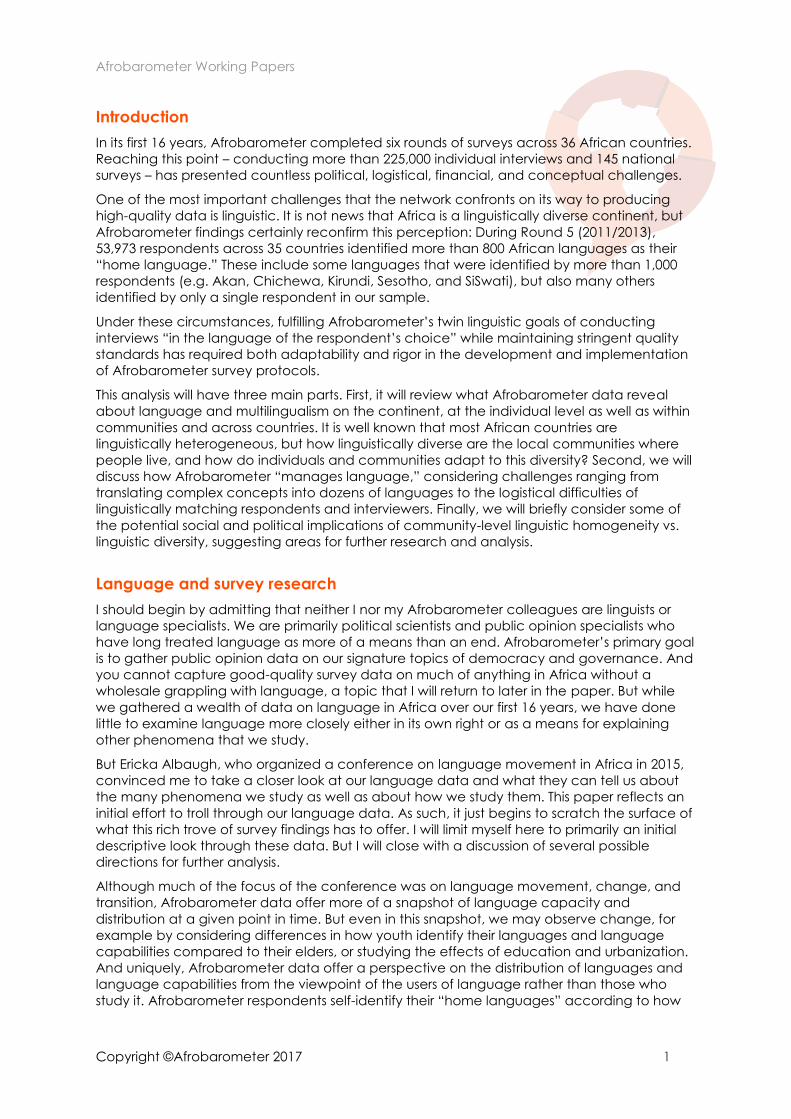
Introduction
In its first 16 years, Afrobarometer completed six rounds of surveys across 36 African countries.
Reaching this point – conducting more than 225,000 individual interviews and 145 national
surveys – has presented countless political, logistical, financial, and conceptual challenges.
One of the most important challenges that the network confronts on its way to producing
high-quality data is linguistic. It is not news that Africa is a linguistically diverse continent, but
Afrobarometer findings certainly reconfirm this perception: During Round 5 (2011/2013),
53,973 respondents across 35 countries identified more than 800 African languages as their
“home language.” These include some languages that were identified by more than 1,000
respondents (e.g. Akan, Chichewa, Kirundi, Sesotho, and SiSwati), but also many others
identified by only a single respondent in our sample.
Under these circumstances, fulfilling Afrobarometer’s twin linguistic goals of conducting
interviews “in the language of the respondent’s choice” while maintaining stringent quality
standards has required both adaptability and rigor in the development and implementation
of Afrobarometer survey protocols.
This analysis will have three main parts. First, it will review what Afrobarometer data reveal
about language and multilingualism on the continent, at the individual level as well as within
communities and across countries. It is well known that most African countries are
linguistically heterogeneous, but how linguistically diverse are the local communities where
people live, and how do individuals and communities adapt to this diversity? Second, we will
discuss how Afrobarometer “manages language,” considering challenges ranging from
translating complex concepts into dozens of languages to the logistical difficulties of
linguistically matching respondents and interviewers. Finally, we will briefly consider some of
the potential social and political implications of community-level linguistic homogeneity vs.
linguistic diversity, suggesting areas for further research and analysis.
Language and survey research
I should begin by admitting that neither I nor my Afrobarometer colleagues are linguists or
language specialists. We are primarily political scientists and public opinion specialists who
have long treated language as more of a means than an end. Afrobarometer’s primary goal
is to gather public opinion data on our signature topics of democracy and governance. And
you cannot capture good-quality survey data on much of anything in Africa without a
wholesale grappling with language, a topic that I will return to later in the paper. But while
we gathered a wealth of data on language in Africa over our first 16 years, we have done
little to examine language more closely either in its own right or as a means for explaining
other phenomena that we study.
But Ericka Albaugh, who organized a conference on language movement in Africa in 2015,
convinced me to take a closer look at our language data and what they can tell us about
the many phenomena we study as well as about how we study them. This paper reflects an
initial effort to troll through our language data. As such, it just begins to scratch the surface of
what this rich trove of survey findings has to offer. I will limit myself here to primarily an initial
descriptive look through these data. But I will close with a discussion of several possible
directions for further analysis.
Although much of the focus of the conference was on language movement, change, and
transition, Afrobarometer data offer more of a snapshot of language capacity and
distribution at a given point in time. But even in this snapshot, we may observe change, for
example by considering differences in how youth identify their languages and language
capabilities compared to their elders, or studying the effects of education and urbanization.
And uniquely, Afrobarometer data offer a perspective on the distribution of languages and
language capabilities from the viewpoint of the users of language rather than those who
study it. Afrobarometer respondents self-identify their “home languages” according to how
Afrobarometer Working Papers
Copyright ©Afrobarometer 2017 2
they themselves understand and name the languages they speak. But even in this there may
be much for a professional linguist to glean. Do individuals in a particular locale identify
themselves, for example, with local dialects or larger language groups? Does this
identification vary with social status or age? Do the names and language patterns revealed
by respondents match the patterns that experts report?
The same applies to our data on multilingualism. Respondents also self-identify their capacity
to speak other languages “well.” This is clearly an imperfect measure of language capacity –
not least because each respondent sets his or her own standard for what “well” means.
Olson and Lewis (2017), in contrast, describe some of the challenges inherent in more fine-
tuned measurement of language proficiency for the purposes of the Ethnologue. But there is
rich potential for deepening our understanding of multilingualism and second-language
capacity and change, especially when multiple data sources like Afrobarometer and
Ethnologue can be analyzed alongside one another.
Once we have explored and elaborated these patterns, we can move on to the next layers
of analysis, exploring what might explain the patterns we see – including questions of power,
policy, trade, and migration – as well as how these patterns can help us understand
phenomena such as trust and social cohesion, national identity, and commitment to the
state and its institutions. Many of these questions are beyond the scope of the present
analysis, but by providing an initial description of these rich data, I hope to open the door for
further exploration and analysis of the role language plays in shaping society, politics, and
governance across the African continent.
An overview of the data
Afrobarometer is a pan-African, non-partisan research network that conducts public attitude
surveys on democracy, governance, economic conditions, and related issues across more
than 30 countries in Africa. Six rounds of surveys were completed between 1999 and 2015,
and a seventh round was launched in late 2016. Afrobarometer conducts face-to-face
interviews in the language of the respondent’s choice with nationally representative samples
of between 1,200 and 2,400 respondents. Samples of this size yield results with a margin of
error of +/-2% (for a sample of 2,400) or +/-3% (for a sample of 1,200) at a 95% confidence
level.
The findings reported here are drawn primarily from two Afrobarometer data sets.
Specifically:
In every round, Afrobarometer has asked respondents to identify their “home
language, … that is, the language of your group of origin.” The findings presented
here regarding home language draw from Afrobarometer Round 5 surveys,
conducted with 53,973 respondents in 35 countries between 2011 and 2013.
In addition, in Round 4 (2008/2009) only, Afrobarometer asked individuals, “What
languages do you speak well?” This question was asked of 27,713 respondents across
the 20 countries covered in Round 4.
Every interview also captures the “language of interview.” We use findings on
“language of interview” from Round 5 to test success in matching interviewers and
respondents and from Round 4 to check and correct each respondent’s list of
languages spoken.
Measuring linguistic diversity
The question about the respondent’s “home language” is one of the first asked during an
Afrobarometer interview. The question is open-ended, and interviewers capture the
individual’s exact response. In almost 54,000 interviews across 35 countries in 2011/2013, more
Afrobarometer Working Papers
Copyright ©Afrobarometer 2017 3
than 800 languages were identified in response to this question.1 With the addition of five
North African countries (Algeria, Egypt, Morocco, Sudan, and Tunisia) to Afrobarometer in
Round 5, Arabic became the most widely spoken home language (5,748 respondents,
slightly more than 10% of all interviews), followed by Chichewa/Chinyanja (2,055
respondents), Akan (1,279), SiSwati (1,233), and Cape Verde’s Crioulo (1,206). However, at
the other end of the spectrum, some 1,583 respondents (3% of the sample) named 532
languages that were identified by 10 respondents or fewer as their home language. In
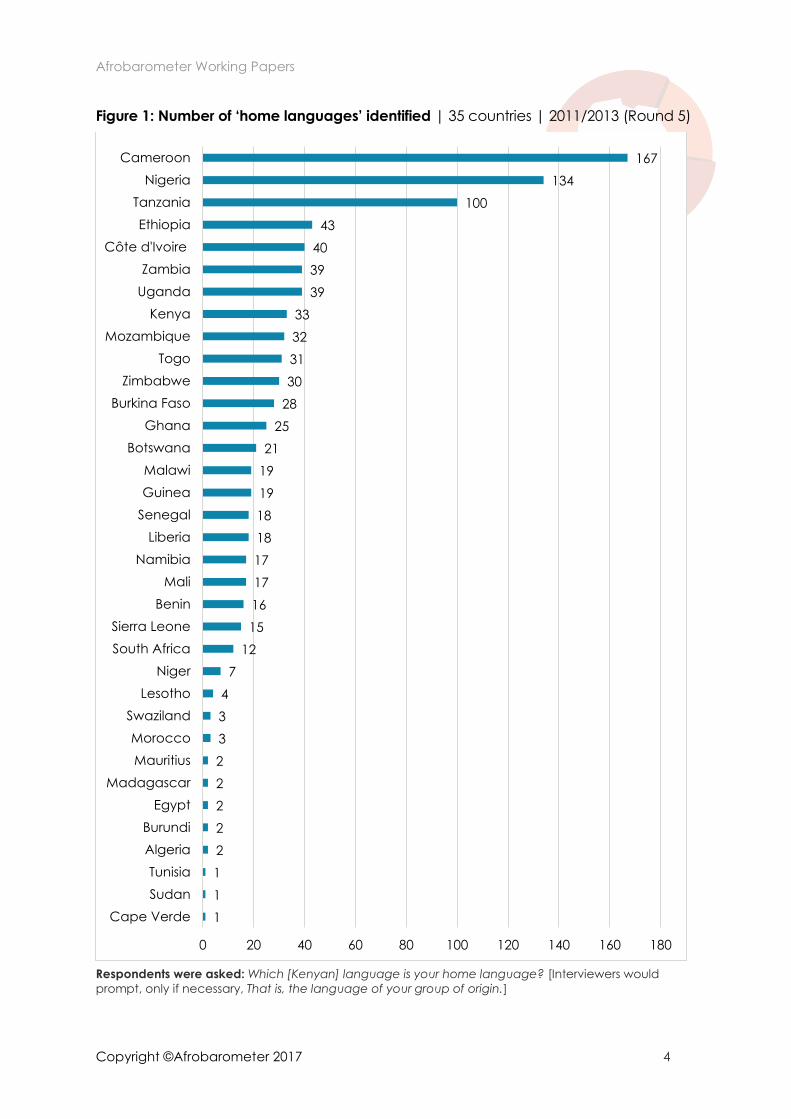
Cameroon alone, respondents identified 167 home languages.
National-level diversity
Several African countries are widely recognized as being linguistically relatively homogenous,
especially in North Africa, where Arabic is nearly universal in Egypt, Sudan, and Tunisia (while
Algeria and Morocco are home to sizeable minorities of Amizigh speakers). It is also the case
in a handful of small countries such as Cape Verde (where 100% identified Crioulo as their
home language), Burundi (100% Kirundi)2, Lesotho (98% Sesotho), Mauritius (96% Creole), and
Swaziland (98% SiSwati) (Figure 1). Across the rest of the continent, however, linguistic
diversity reigns, with respondents reporting anywhere from a mere seven home languages in
Niger and 12 in South Africa to 100 or more in Tanzania (100 languages), Nigeria (134), and
Cameroon (167). The lone large-country exception is Madagascar, where 100% report
speaking either “official Malagasy” or a “Malagasy dialect” as their home language.
Despite the increasing foothold of various lingua francas across the continent, including
European official languages as well as African languages of business and commerce
(especially Kiswahili, various forms of Pidgin, and Hausa), the resilience of African languages
is evident in these findings. Although English, French, and Portuguese are increasingly the
main language spoken in the home in some urban areas on the continent, especially where
parents are from different ethno-linguistic backgrounds, just 2% of respondents identified one
of these three languages as their home language.
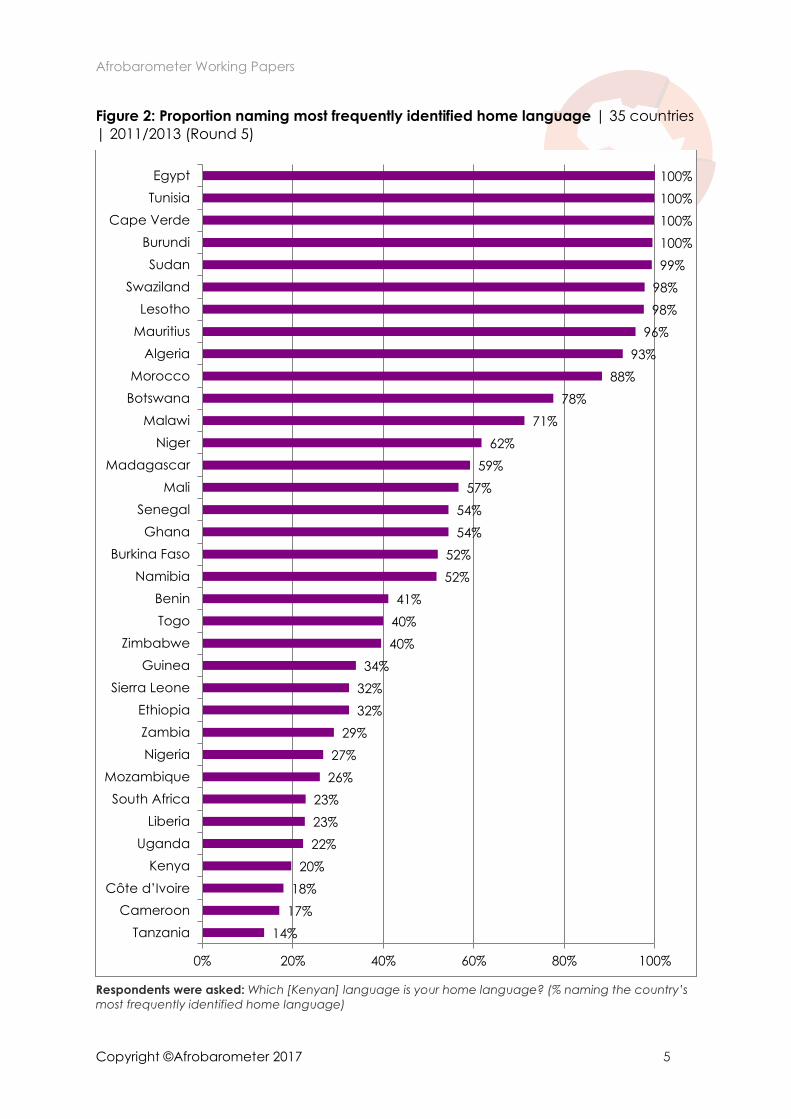
Some of the implications of Africa’s linguistic diversity are also revealed when we consider
the proportion of respondents in each country who named the most frequently identified
home language for the country as their own home language. The figure ranges from a low of
14% who speak Kisukuma in Tanzania (where just 9% identified Kiswahili as their home
language) to 98% or more in the seven most linguistically homogenous countries (Egypt,
Tunisia, Cape Verde, Burundi, Sudan, Swaziland, and Lesotho)3 (Figure 2). Keep in mind,
however, that this does not mean that Tanzanians, Ivorians, or Cameroonians cannot
communicate with one another, but only that most of the time they must do so in second or
third languages rather than their home language. The incentives to learn a national
language or a local lingua franca are consequently higher. This helps explain why the vast
majority of Round 5 surveys in Côte d'Ivoire, for example, were done in French, which is
widely spoken there, in contrast to Niger, another francophone country, where less than 10%
of interviews were done in French, while nearly two-thirds were done in the widely shared
Haoussa language.
1 Afrobarometer national partners, who collected the data, coded these responses. To the extent possible, different names or pronunciations for the same language have been eliminated. 2 A handful of respondents – less than 1% -- identified either French or Kiswahili as their home language. 3 In addition, in Madagascar all respondents identified either “official Malagasy” (identified by 59%) or “Malagasy dialects” (41%) as their home language.
Afrobarometer Working Papers
Copyright ©Afrobarometer 2017 4
Figure 1: Number of ‘home languages’ identified | 35 countries | 2011/2013 (Round 5)
Respondents were asked: Which [Kenyan] language is your home language? [Interviewers would
prompt, only if necessary, That is, the language of your group of origin.]
1
1
1
2
2
2
2
2
3
3
4
7
12
15
16
17
17
18
18
19
19
21
25
28
30
31
32
33
39
39
40
43
100
134
167
0 20 40 60 80 100 120 140 160 180
Cape Verde
Sudan
Tunisia
Algeria
Burundi
Egypt
Madagascar
Mauritius
Morocco
Swaziland
Lesotho
Niger
South Africa
Sierra Leone
Benin
Mali
Namibia
Liberia
Senegal
Guinea
Malawi
Botswana
Ghana
Burkina Faso
Zimbabwe
Togo
Mozambique
Kenya
Uganda
Zambia
Côte d'Ivoire
Ethiopia
Tanzania
Nigeria
Cameroon
Afrobarometer Working Papers
Copyright ©Afrobarometer 2017 5
Figure 2: Proportion naming most frequently identified home language | 35 countries
| 2011/2013 (Round 5)
Respondents were asked: Which [Kenyan] language is your home language? (% naming the country’s
most frequently identified home language)
14%
17%
18%
20%
22%
23%
23%
26%
27%
29%
32%
32%
34%
40%
40%
41%
52%
52%
54%
54%
57%
59%
62%
71%
78%
88%
93%
96%
98%
98%
99%
100%
100%
100%
100%
0% 20% 40% 60% 80% 100%
Tanzania
Cameroon
Côte d’Ivoire
Kenya
Uganda
Liberia
South Africa
Mozambique
Nigeria
Zambia
Ethiopia
Sierra Leone
Guinea
Zimbabwe
Togo
Benin
Namibia
Burkina Faso
Ghana
Senegal
Mali
Madagascar
Niger
Malawi
Botswana
Morocco
Algeria
Mauritius
Lesotho
Swaziland
Sudan
Burundi
Cape Verde
Tunisia
Egypt
Afrobarometer Working Papers
Copyright ©Afrobarometer 2017 6
Individual-level linguistic diversity
We now turn to the data collected during Afrobarometer Round 4 regarding the languages
each respondent reported speaking well. This question, too, was open-ended, and
respondents were given the opportunity to list as many languages as they wanted, all of
which were recorded by interviewers. As noted, the results are thus based entirely on
respondents’ self-assessments of their language abilities, which, aside from the language in
which the interview was conducted, were not tested by the interviewer.4
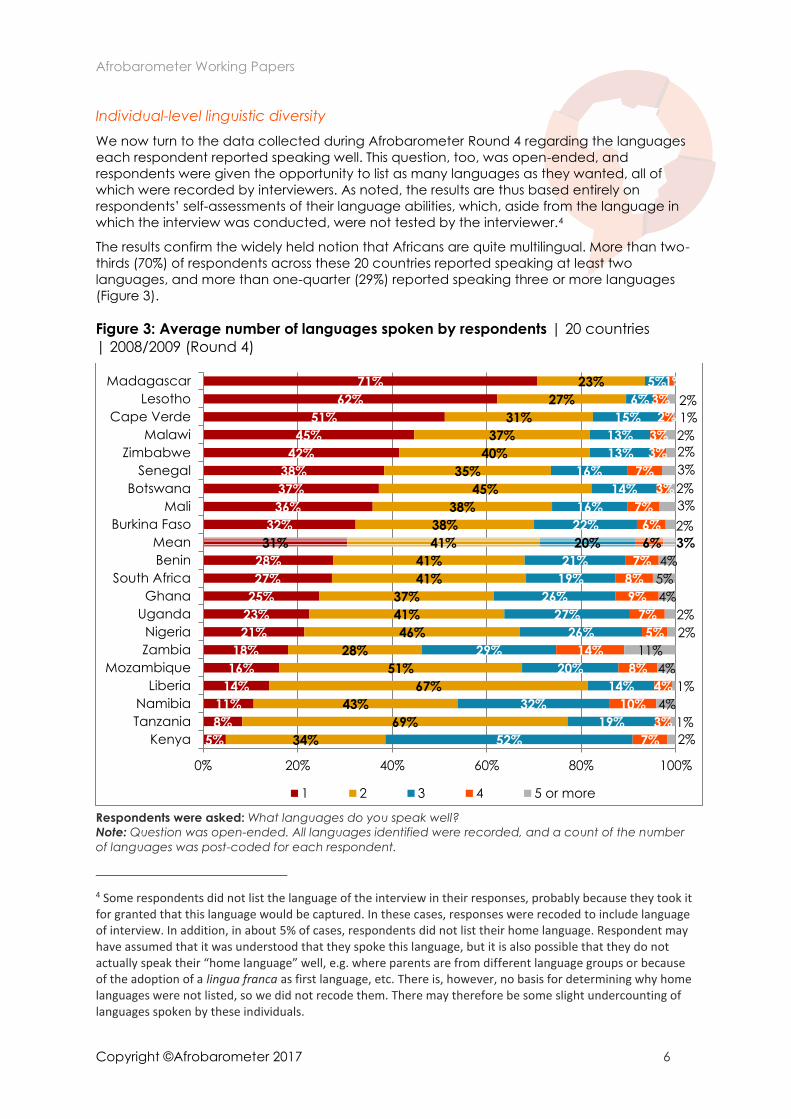
The results confirm the widely held notion that Africans are quite multilingual. More than two-
thirds (70%) of respondents across these 20 countries reported speaking at least two
languages, and more than one-quarter (29%) reported speaking three or more languages
(Figure 3).
Figure 3: Average number of languages spoken by respondents | 20 countries
| 2008/2009 (Round 4)
Respondents were asked: What languages do you speak well?
Note: Question was open-ended. All languages identified were recorded, and a count of the number
of languages was post-coded for each respondent.
4 Some respondents did not list the language of the interview in their responses, probably because they took it for granted that this language would be captured. In these cases, responses were recoded to include language of interview. In addition, in about 5% of cases, respondents did not list their home language. Respondent may have assumed that it was understood that they spoke this language, but it is also possible that they do not actually speak their “home language” well, e.g. where parents are from different language groups or because of the adoption of a lingua franca as first language, etc. There is, however, no basis for determining why home languages were not listed, so we did not recode them. There may therefore be some slight undercounting of languages spoken by these individuals.
5%
8%
11%
14%
16%
18%
21%
23%
25%
27%
28%
31%
32%
36%
37%
38%
42%
45%
51%
62%
71%
34%
69%
43%
67%
51%
28%
46%
41%
37%
41%
41%
41%
38%
38%
45%
35%
40%
37%
31%
27%
23%
52%
19%
32%
14%
20%
29%
26%
27%
26%
19%
21%
20%
22%
16%
14%
16%
13%
13%
15%
6%
5%
7%
3%
10%
4%
8%
14%
5%
7%
9%
8%
7%
6%
6%
7%
3%
7%
3%
3%
2%
3%
1%
2%
1%
4%
1%
4%
11%
2%
2%
4%
5%
4%
3%
2%
3%
2%
3%
2%
2%
1%
2%
0% 20% 40% 60% 80% 100%
Kenya
Tanzania
Namibia
Liberia
Mozambique
Zambia
Nigeria
Uganda
Ghana
South Africa
Benin
Mean
Burkina Faso
Mali
Botswana
Senegal
Zimbabwe
Malawi
Cape Verde
Lesotho
Madagascar
1 2 3 4 5 or more
Afrobarometer Working Papers
Copyright ©Afrobarometer 2017 7
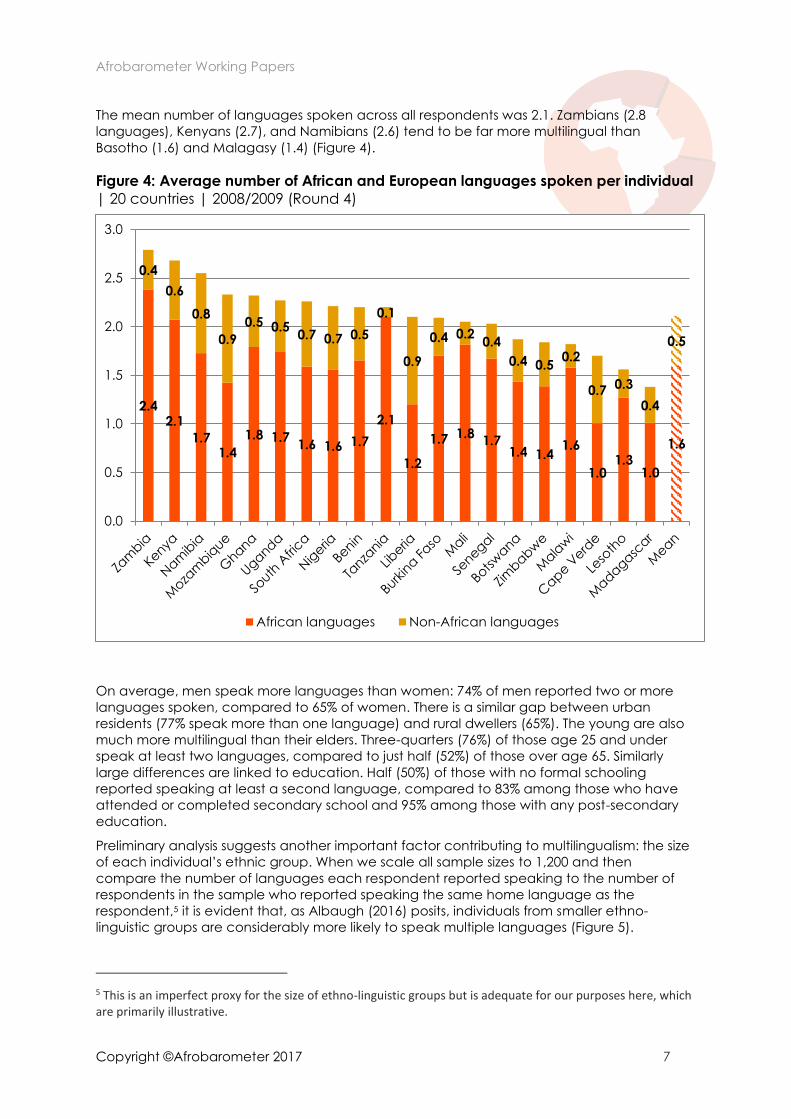
The mean number of languages spoken across all respondents was 2.1. Zambians (2.8
languages), Kenyans (2.7), and Namibians (2.6) tend to be far more multilingual than
Basotho (1.6) and Malagasy (1.4) (Figure 4).
Figure 4: Average number of African and European languages spoken per individual
| 20 countries | 2008/2009 (Round 4)
On average, men speak more languages than women: 74% of men reported two or more
languages spoken, compared to 65% of women. There is a similar gap between urban
residents (77% speak more than one language) and rural dwellers (65%). The young are also
much more multilingual than their elders. Three-quarters (76%) of those age 25 and under
speak at least two languages, compared to just half (52%) of those over age 65. Similarly
large differences are linked to education. Half (50%) of those with no formal schooling
reported speaking at least a second language, compared to 83% among those who have
attended or completed secondary school and 95% among those with any post-secondary
education.
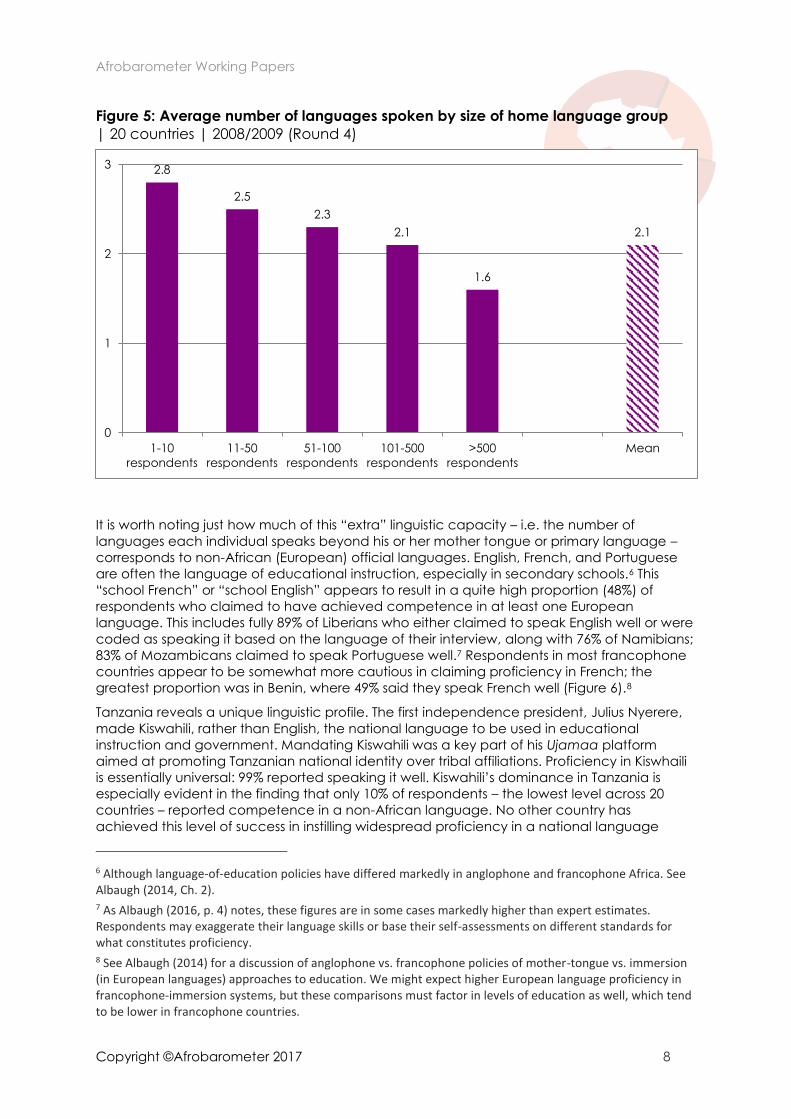
Preliminary analysis suggests another important factor contributing to multilingualism: the size
of each individual’s ethnic group. When we scale all sample sizes to 1,200 and then
compare the number of languages each respondent reported speaking to the number of
respondents in the sample who reported speaking the same home language as the
respondent,5 it is evident that, as Albaugh (2016) posits, individuals from smaller ethno-
linguistic groups are considerably more likely to speak multiple languages (Figure 5).
5 This is an imperfect proxy for the size of ethno-linguistic groups but is adequate for our purposes here, which are primarily illustrative.
2.42.1
1.71.4
1.8 1.71.6 1.6 1.7
2.1
1.2
1.7 1.81.7
1.4 1.41.6
1.01.3
1.0
1.6
0.4
0.6
0.8
0.9
0.5 0.50.7 0.7 0.5
0.1
0.9
0.4 0.20.4
0.4 0.50.2
0.7 0.3
0.4
0.5
0.0
0.5
1.0
1.5
2.0
2.5
3.0
African languages Non-African languages
Afrobarometer Working Papers
Copyright ©Afrobarometer 2017 8
Figure 5: Average number of languages spoken by size of home language group
| 20 countries | 2008/2009 (Round 4)
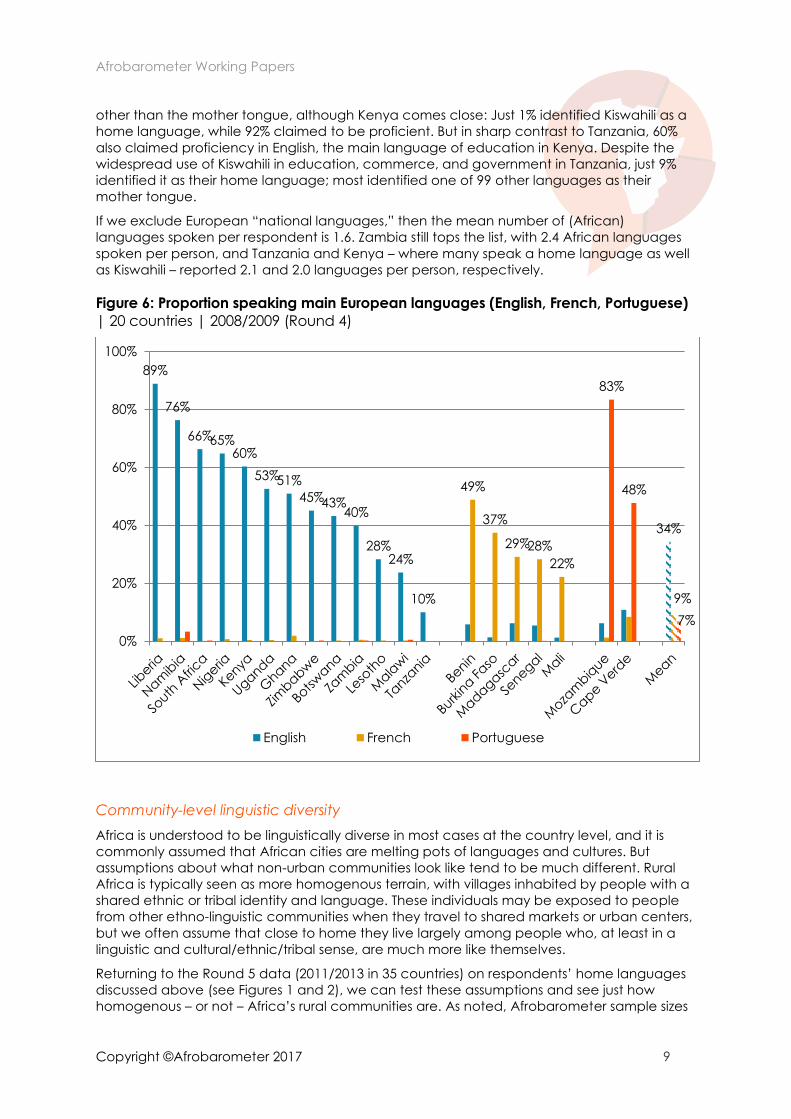
It is worth noting just how much of this “extra” linguistic capacity – i.e. the number of
languages each individual speaks beyond his or her mother tongue or primary language –
corresponds to non-African (European) official languages. English, French, and Portuguese
are often the language of educational instruction, especially in secondary schools.6 This
“school French” or “school English” appears to result in a quite high proportion (48%) of
respondents who claimed to have achieved competence in at least one European
language. This includes fully 89% of Liberians who either claimed to speak English well or were
coded as speaking it based on the language of their interview, along with 76% of Namibians;
83% of Mozambicans claimed to speak Portuguese well.7 Respondents in most francophone
countries appear to be somewhat more cautious in claiming proficiency in French; the
greatest proportion was in Benin, where 49% said they speak French well (Figure 6).8
Tanzania reveals a unique linguistic profile. The first independence president, Julius Nyerere,
made Kiswahili, rather than English, the national language to be used in educational
instruction and government. Mandating Kiswahili was a key part of his Ujamaa platform
aimed at promoting Tanzanian national identity over tribal affiliations. Proficiency in Kiswhaili
is essentially universal: 99% reported speaking it well. Kiswahili’s dominance in Tanzania is
especially evident in the finding that only 10% of respondents – the lowest level across 20
countries – reported competence in a non-African language. No other country has
achieved this level of success in instilling widespread proficiency in a national language
6 Although language-of-education policies have differed markedly in anglophone and francophone Africa. See Albaugh (2014, Ch. 2). 7 As Albaugh (2016, p. 4) notes, these figures are in some cases markedly higher than expert estimates. Respondents may exaggerate their language skills or base their self-assessments on different standards for what constitutes proficiency. 8 See Albaugh (2014) for a discussion of anglophone vs. francophone policies of mother-tongue vs. immersion (in European languages) approaches to education. We might expect higher European language proficiency in francophone-immersion systems, but these comparisons must factor in levels of education as well, which tend to be lower in francophone countries.
2.8
2.5
2.3
2.1
1.6
2.1
0
1
2
3
1-10
respondents
11-50
respondents
51-100
respondents
101-500
respondents
>500
respondents
Mean
Afrobarometer Working Papers
Copyright ©Afrobarometer 2017 9
other than the mother tongue, although Kenya comes close: Just 1% identified Kiswahili as a
home language, while 92% claimed to be proficient. But in sharp contrast to Tanzania, 60%
also claimed proficiency in English, the main language of education in Kenya. Despite the
widespread use of Kiswahili in education, commerce, and government in Tanzania, just 9%
identified it as their home language; most identified one of 99 other languages as their
mother tongue.
If we exclude European “national languages,” then the mean number of (African)
languages spoken per respondent is 1.6. Zambia still tops the list, with 2.4 African languages
spoken per person, and Tanzania and Kenya – where many speak a home language as well
as Kiswahili – reported 2.1 and 2.0 languages per person, respectively.
Figure 6: Proportion speaking main European languages (English, French, Portuguese)
| 20 countries | 2008/2009 (Round 4)
Community-level linguistic diversity
Africa is understood to be linguistically diverse in most cases at the country level, and it is
commonly assumed that African cities are melting pots of languages and cultures. But
assumptions about what non-urban communities look like tend to be much different. Rural
Africa is typically seen as more homogenous terrain, with villages inhabited by people with a
shared ethnic or tribal identity and language. These individuals may be exposed to people
from other ethno-linguistic communities when they travel to shared markets or urban centers,
but we often assume that close to home they live largely among people who, at least in a
linguistic and cultural/ethnic/tribal sense, are much more like themselves.
Returning to the Round 5 data (2011/2013 in 35 countries) on respondents’ home languages
discussed above (see Figures 1 and 2), we can test these assumptions and see just how
homogenous – or not – Africa’s rural communities are. As noted, Afrobarometer sample sizes
89%
76%
66%65%60%
53%51%
45%43%40%
28%24%
10%
34%
49%
37%
29%28%
22%
9%
83%
48%
7%
0%
20%
40%
60%
80%
100%
English French Portuguese
Afrobarometer Working Papers
Copyright ©Afrobarometer 2017 10
range from 1,200 to 2,400 respondents per country. Samples are distributed across a
country’s administrative units (provinces, districts, regions, etc.) and urban-rural areas in
proportion to the share of each in the total population of the country based on the most
recent census figures. Thus, if according to the census 12% of a country’s population lives in
the urban portion of District A, then 12% of Afrobarometer’s sample in the country will be
allocated within that same stratum.
All individual respondents in a sample are randomly selected from “primary sampling units”
(PSUs), usually census enumeration areas (EAs), that are randomly selected from lists of all
PSUs in each stratum. EAs are small units, typically assumed to encompass roughly 100
households, although in reality they can vary considerably both within and across countries,
from as few as 20 to as many as several hundred households. But the key points are that: a)
they are one of the smallest standard units of measure of population and area in a country
and b) they represent a very small slice of a country’s population.
An ideal sample would be completely random. That is, Afrobarometer would randomly
select 1,200 or 2,400 EAs (depending on sample size) from around the entire country and
then randomly select one individual from within each EA. However, from the perspective of
logistics, time, management, and cost, it is not feasible to send interviewers to 1,200 (or 2,400)
EAs. Afrobarometer therefore clusters samples, conducting eight interviews in each of 150
EAs (or 300, for a sample size of 2,400). Eight respondents are randomly selected from the
entire adult population of the EA using randomly selected start points, walk patterns, and
individual selection protocols within selected households.9 Although clustering makes for a
less-perfect sample in terms of national representativeness, it offers other advantages,
because it allows us, to a limited extent, to look at local community profiles. While a sample
of eight individuals from a given EA is not representative, in a statistical sense, of everything
about the EA (the margin of error on such a tiny sample is extremely high), we can
nonetheless develop some broad conclusions about the characteristics of an EA from the
collective profile of these eight respondents.
The findings regarding the linguistic diversity among these eight respondents in each EA
across much of the continent – including in rural areas – are revealing. We counted the
number of home languages spoken by the eight respondents within each EA across 22 of the
35 Round 5 countries.10 We expect to find linguistic diversity even at the EA level in urban
areas. But if rural inhabitants largely live in ethnically or tribally based villages and
communities, then at the fine-grained EA level we would expect that all respondents from
within an EA might be members of the same tribe or ethnic group and share a common
home language.
But this is frequently not the case. Judging by respondents’ self-reported home languages,
there is, in fact, a remarkable degree of heterogeneity even in the rural zones of many
countries. In Senegal, Ghana, and even relatively homogenous Botswana, only about half of
rural respondents live in what appear to be ethnically homogenous local communities where
all eight respondents from the EA reported speaking the same home language, and in Sierra
Leone, Togo, and Zambia, only about one in four do (Figure 7). In Cameroon, there appear
to be virtually no ethnically homogenous communities. In contrast, rural communities in Niger,
Namibia, Guinea, Kenya, and Benin tend to be more segregated linguistically – just 24% of
9 For a complete description of Afrobarometer’s sampling protocols, see the Afrobarometer Round 6 Survey Manual at http://www.afrobarometer.org/sites/default/files/survey_manuals/ab_r6_survey_manual_en.pdf. 10 The most homogenous countries, i.e. those where 88% or more speak the same home language, were excluded from this analysis because they are expected to show low variability on this indicator. Madagascar was also excluded because all respondents identified either “official Malagasy” or “Malagasy dialects” as their home language. South Africa was excluded because its sample was only clustered at a level of four respondents per EA, rather than eight, so the findings are not directly comparable to those from other countries.
Afrobarometer Working Papers
Copyright ©Afrobarometer 2017 11
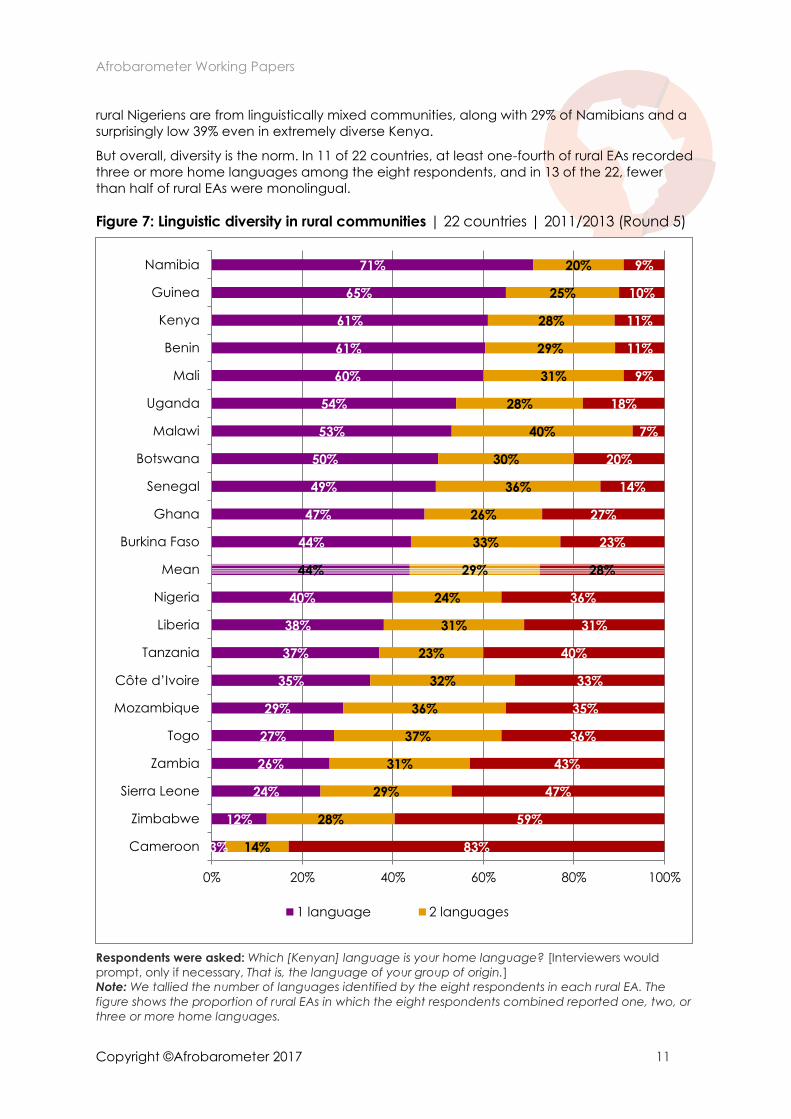
rural Nigeriens are from linguistically mixed communities, along with 29% of Namibians and a
surprisingly low 39% even in extremely diverse Kenya.
But overall, diversity is the norm. In 11 of 22 countries, at least one-fourth of rural EAs recorded
three or more home languages among the eight respondents, and in 13 of the 22, fewer
than half of rural EAs were monolingual.
Figure 7: Linguistic diversity in rural communities | 22 countries | 2011/2013 (Round 5)
Respondents were asked: Which [Kenyan] language is your home language? [Interviewers would
prompt, only if necessary, That is, the language of your group of origin.]
Note: We tallied the number of languages identified by the eight respondents in each rural EA. The
figure shows the proportion of rural EAs in which the eight respondents combined reported one, two, or
three or more home languages.
3%
12%
24%
26%
27%
29%
35%
37%
38%
40%
44%
44%
47%
49%
50%
53%
54%
60%
61%
61%
65%
71%
14%
28%
29%
31%
37%
36%
32%
23%
31%
24%
29%
33%
26%
36%
30%
40%
28%
31%
29%
28%
25%
20%
83%
59%
47%
43%
36%
35%
33%
40%
31%
36%
28%
23%
27%
14%
20%
7%
18%
9%
11%
11%
10%
9%
0% 20% 40% 60% 80% 100%
Cameroon
Zimbabwe
Sierra Leone
Zambia
Togo
Mozambique
Côte d’Ivoire
Tanzania
Liberia
Nigeria
Mean
Burkina Faso
Ghana
Senegal
Botswana
Malawi
Uganda
Mali
Benin
Kenya
Guinea
Namibia
1 language 2 languages
Afrobarometer Working Papers
Copyright ©Afrobarometer 2017 12
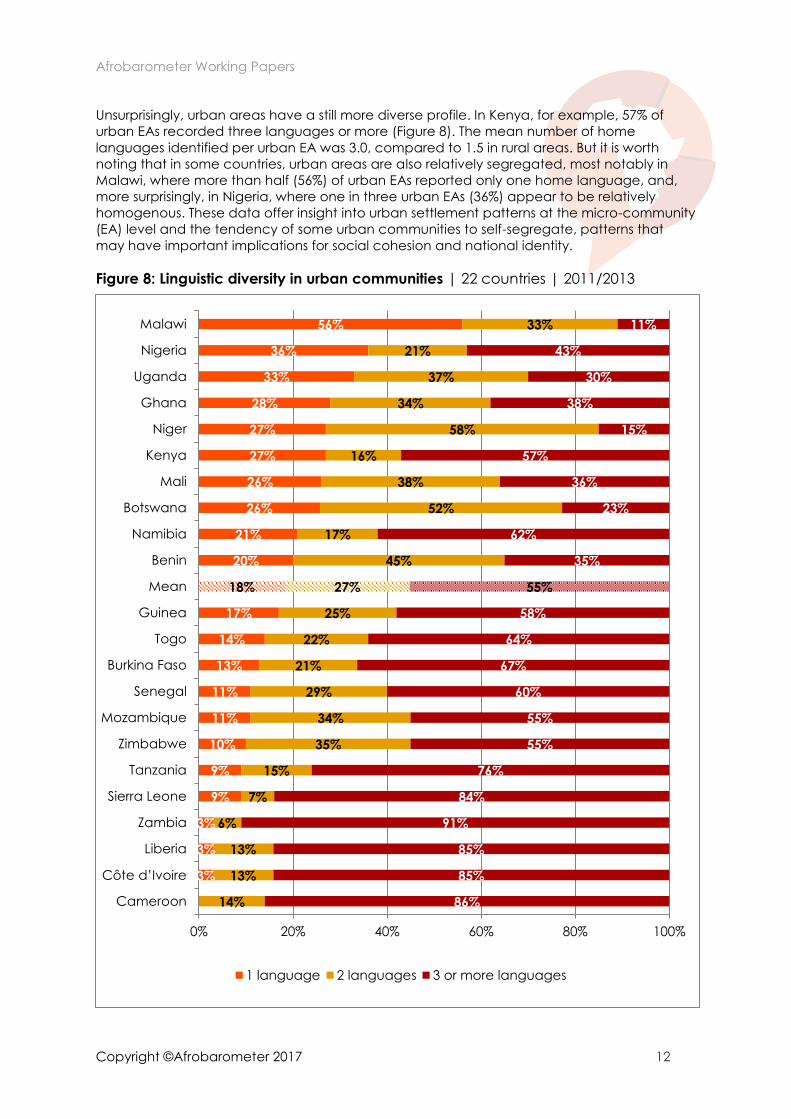
Unsurprisingly, urban areas have a still more diverse profile. In Kenya, for example, 57% of
urban EAs recorded three languages or more (Figure 8). The mean number of home
languages identified per urban EA was 3.0, compared to 1.5 in rural areas. But it is worth
noting that in some countries, urban areas are also relatively segregated, most notably in
Malawi, where more than half (56%) of urban EAs reported only one home language, and,
more surprisingly, in Nigeria, where one in three urban EAs (36%) appear to be relatively
homogenous. These data offer insight into urban settlement patterns at the micro-community
(EA) level and the tendency of some urban communities to self-segregate, patterns that
may have important implications for social cohesion and national identity.
Figure 8: Linguistic diversity in urban communities | 22 countries | 2011/2013
3%
3%
3%
9%
9%
10%
11%
11%
13%
14%
17%
18%
20%
21%
26%
26%
27%
27%
28%
33%
36%
56%
14%
13%
13%
6%
7%
15%
35%
34%
29%
21%
22%
25%
27%
45%
17%
52%
38%
16%
58%
34%
37%
21%
33%
86%
85%
85%
91%
84%
76%
55%
55%
60%
67%
64%
58%
55%
35%
62%
23%
36%
57%
15%
38%
30%
43%
11%
0% 20% 40% 60% 80% 100%
Cameroon
Côte d’Ivoire
Liberia
Zambia
Sierra Leone
Tanzania
Zimbabwe
Mozambique
Senegal
Burkina Faso
Togo
Guinea
Mean
Benin
Namibia
Botswana
Mali
Kenya
Niger
Ghana
Uganda
Nigeria
Malawi
1 language 2 languages 3 or more languages
Afrobarometer Working Papers
Copyright ©Afrobarometer 2017 13
Managing surveys amid linguistic diversity
This incredible linguistic diversity has some obvious implications for managing a survey
research project. Afrobarometer implements a relatively long questionnaire that includes
some conceptually complex questions. Maintaining comprehensibility and comparability
even as questions are translated into dozens of languages is essential to producing high-
quality results. But producing high-quality translations is, as it turns out, only half the battle.
Being able to put them to good use – i.e. getting the right translation in front of the right
respondent in the hands of an interviewer who is qualified to use it – proves to be equally
challenging. In this section, I will briefly review some of Afrobarometer’s core protocols aimed
at achieving these goals and discuss challenges posed by the degree of linguistic diversity
reported here.
Selecting interview languages
Producing reliable survey data requires that survey samples be representative and that the
surveys accurately capture the views of respondents. Two key linguistic conditions required
to meet these goals are, first, that we minimize the number of people who are excluded from
the sample because they do not speak a survey language and second, that we ensure that
respondents are interviewed in languages in which they are proficient enough to understand
the meaning of the questions and core concepts. Shortcuts, such as limiting survey
languages to a common lingua franca or a couple of the largest languages spoken will
often leave us short of these goals. For example, implementing a survey in Kenya using only a
Kiswahili translation would be problematic because the roughly 8% of respondents who do
not identify Kiswahili as a language they speak well (based on Round 4 data) would be
excluded, potentially introducing bias into the findings. And in a majority of countries, there is
no single lingua franca that is spoken even this widely.
It has also been a core Afrobarometer principle that respondents be interviewed, to the
extent possible, in “the language of the respondent’s choice.” Yet it is clearly not feasible to
interview all respondents in their mother tongue. Afrobarometer’s protocol therefore relies on
a “5% rule,” i.e. in addition to any key lingua franca, “every language group that is likely to
constitute at least 5% of the sample should have a translated questionnaire” (Afrobarometer,
2014, p.19). Using this rule, it is often possible to capture the home languages of a significant
proportion of the population with four or five translations. For example, in Benin, five
translations into Adja, Bariba, Dendi, Fon, and Yoruba covered the home languages of 87%
of respondents in Round 5. An additional 6% of respondents spoke Otamari, so a translation
into this language would have been justified. But no other group constituted more than 3% of
the sample. Realistically, the only ways that smaller linguistic groups can be captured is by
using national-language questionnaires (Arabic, French, English, Portuguese, or Kiswhaili),
using a lingua franca such as Pidgin in Cameroon, and taking advantage of the fact that
individuals from smaller language groups are likely to speak one of the major local
languages.
However, in some countries, the 5% rule generates very low levels of home-language
coverage. In Cameroon, for example, official translations into Foufoulde and Ewondo cover
only 18% of the population. French (16%) and English (1%) questionnaires cover the home
languages of another 17%. But for the remaining 65%, there is no language group that
constitutes more than 3% of the sample, so we must rely on the multilingualism of members of
the many smaller language groups.
Kenya, South Africa, and Uganda present a contrasting challenge. In these countries,
following the 5% rule covers a large share of the population but results in as many as nine
translations. Working with too many translations can be both costly and unwieldy;
Afrobarometer prefers a maximum of six. We therefore sometimes drop some of the smaller
languages, even if they meet the 5% threshold.
Afrobarometer Working Papers
Copyright ©Afrobarometer 2017 14
In short, Afrobarometer’s 5% rule – with occasional adjustments – is imperfect, but may
remain the best option for balancing competing demands. Ultimately, for Round 5,
Afrobarometer produced more than 80 translations of the questionnaire across 35 countries.
By at least one key metric, the process has worked reasonably well: We have relatively few
failed contacts with respondents based on available interview languages. Across all 35
countries included in Round 5, 53,973 face-to-face interviews were completed (“successful
calls”) and 16,866 “unsuccessful calls” were reported where a selected household or
respondent could not complete an interview. Of these, 581 – less than 1% of all calls made –
failed due to the selected respondent either being deaf or not speaking a survey
language.11
Producing translations
To ensure comparability of responses within and across countries, it is essential that, to the
extent possible, all respondents be asked the same question in the same way, even when
the language changes. One of the greatest challenges for Afrobarometer is making sure
that all language, especially core concepts and words such as “democracy,”
“accountability,” “freeness and fairness,” or even “trust,” is translated correctly, consistently,
and effectively. Ensuring the conceptual equivalence of local-language translations is one of
the most critical steps in the entire survey process – a potential “weakest link” if it is not done
well. In the end, Afrobarometer data are only as good – and as comparable both within and
across countries – as the quality and consistency of the local-language translations used to
collect them.
Afrobarometer has developed rigorous translation protocols to ensure the success of this
process. They include not just forward and back blind translations done by translators in
isolation, but also synchronization meetings. These meetings offer an opportunity for
translators and the national investigator to discuss each question to come to a common
understanding of the intent, so that there is as much consistency as possible in how key
concepts are translated across languages.12 During this process, Afrobarometer prefers to
rely as much as possible on experienced translators who are familiar with daily usage rather
than linguists or academics who may produce more formal, but less accessible, translations
that may be difficult for day-to-day users of the language to understand.
One of the most common questions asked of Afrobarometer is how we handle the “d-word”,
i.e. “democracy.” In each round, several questions on the Afrobarometer questionnaire use
the word “democracy.” But as many a challenger has pointed out, even in a single
language the word democracy can mean different things to different people. So how do we
know what our respondents are thinking of when we ask them whether they support
democracy or think they are getting it in their country? The problem is compounded by the
even more diverse meanings associated with the word “democracy” as it is translated into
dozens of local languages.
Afrobarometer deals with this challenge in several ways.13 First, we triangulate. While a
number of questions ask specifically about “democracy,” many more ask about various
processes and institutions of democracy without using the d-word itself. These questions offer
insight into how individuals understand democracy without mentioning the word. In some
rounds, we also ask respondents directly, “What, if anything, does the word ‘democracy’
mean to you?”
“Democracy” is also the one word in the questionnaire that we do not translate into a local
language unless it is essential. The survey manual describes the protocol for asking d-word
questions by saying, “Always read the question in the language of the interview, but always
11 The two reasons for “unsuccessful calls” are captured together on the questionnaire. 12 Full details can be found in the Afrobarometer Survey Manual Section 5. 13 For a detailed discussion of this issue, see Bratton (2010).
Afrobarometer Working Papers
Copyright ©Afrobarometer 2017 15
read ‘democracy’ in the national language (i.e. English, French, Portuguese, or Kiswahili).
Translate ‘democracy’ into the local language only if the respondent does not understand
the national-language term.” This is, again, an imperfect solution to a challenging problem,
but by using this approach, and recording whether the term was used in the national
language or the local language, we aim to reduce the impact of its variable definitions while
also collecting enough data to analyze those differences when necessary.
Finally, in Round 5 surveys, Afrobarometer also experimented with “anchoring vignettes” as a
systematic solution. To elucidate individual understandings of democracy, we asked
respondents to rate the level of democracy in several hypothetical political systems that
were described to them. The results can be used to rescale responses from questions that
specifically mention “democracy” (Bratton, 2010, pp. 109-112).
The questioners: Selecting and deploying multilingual fieldworkers
The final challenge arises when it comes time to put these carefully crafted translations to
use. There are many important and complex questions related to how best to match
interviewers and respondents in terms of ethnicity, race, gender, religion, and other factors.
As recent work by Adida, Ferree, Posner, and Robinson (2015) has shown, racial and ethnic
matching, or mismatching, between interviewers and respondents can affect how
respondents answer some types of sensitive questions. But Afrobarometer’s primary goal is to
select and deploy fieldworkers so as to best manage “language of interview,” ideally by
matching interviewers and respondents as closely as possible in terms of language capacity.
It is an unspoken ideal that wherever possible, respondents should be interviewed in their
home language by another native speaker of that same language, although it is clear that
in most countries this ideal cannot always be met. The evidence described above indicating
that the linguistic heterogeneity we see at the national level often extends even into rural
communities suggests that the challenge is even more complex than previously recognized.
Afrobarometer protocol calls for teams of four interviewers and a supervisor to work and
travel together throughout fieldwork. Teams are constructed and assigned routes and EAs
with the goal of placing fieldworkers so that their linguistic skills best match the profile of the
region they will cover. Each field team must realistically cover a significant number of EAs, as
fielding too many interviewers and teams can pose training and supervision challenges and
prove detrimental to the overall quality of data.
But it quickly becomes clear just how imperfect this approach may be in terms of our ability
to linguistically match fieldworkers and respondents. Fieldwork teams and their linguistic skills
are essentially static, yet the linguistic profiles of selected communities and respondents can
vary widely. However, it is not feasible to “fine-tune” the composition and skills of interview
teams to closely match the profile of each separate community they will visit. In short, a
fieldwork team deployed to a region where one or two languages are dominant will be
selected to ensure that the team members are native speakers of, or at least highly
competent in, those languages. But once in the field, they may frequently encounter
communities, and individual respondents, with different linguistic profiles.
One way to assess how well Afrobarometer is doing in terms of linguistically matching
respondents and interviewers is to look at the language of interview and the actual utilization
of the local-language translations that are produced. We can do this by looking at the
proportion of individuals who speak a survey language as their home language who are
actually interviewed in that language. In the Burkina Faso Round 5 survey, for example, 619
respondents (52% of the sample) identified Moore as their home language. Of those, 444
were actually interviewed in Moore, a 72% match rate. Other Moore speakers were
interviewed in French (132 respondents) or Dioula (44 respondents). In total, 69% of Burkinabe
identified a home language that matched an interview language (Moore, Dioula, Fulfuldé,
or French), and 48% used these same languages in their interview, a 70% match rate for the
country as a whole (Figure 9).
Afrobarometer Working Papers
Copyright ©Afrobarometer 2017 16
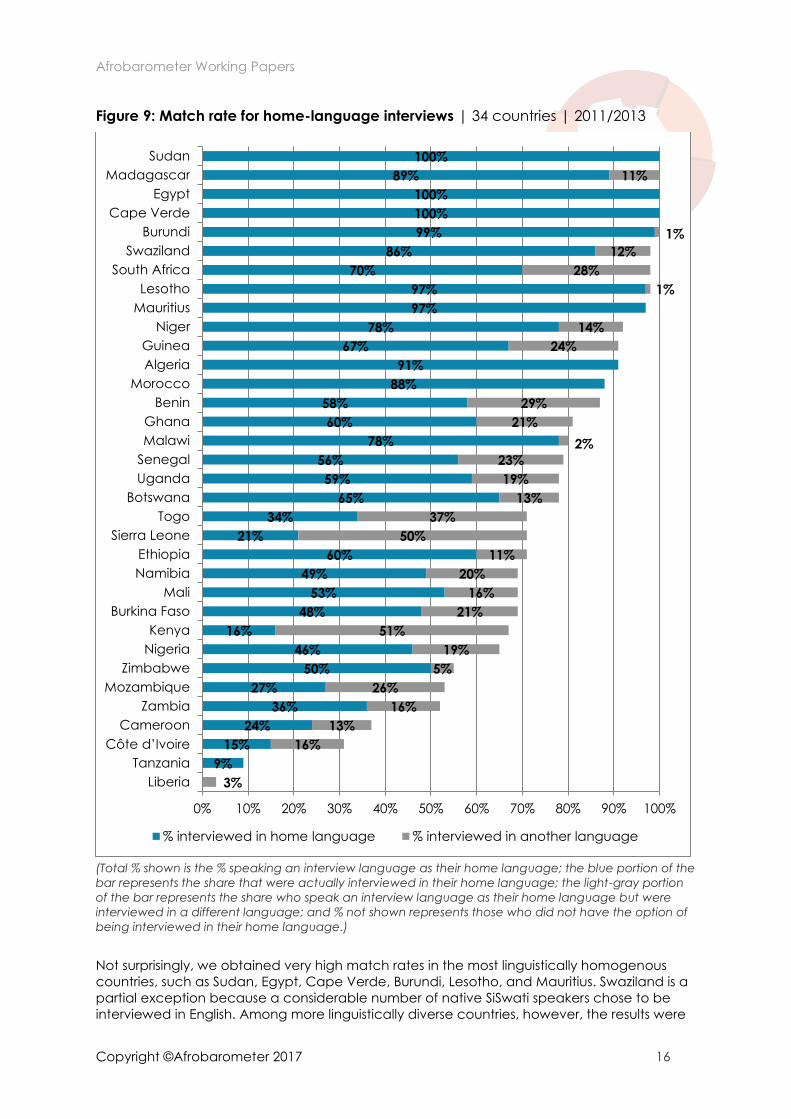
Figure 9: Match rate for home-language interviews | 34 countries | 2011/2013
(Total % shown is the % speaking an interview language as their home language; the blue portion of the
bar represents the share that were actually interviewed in their home language; the light-gray portion
of the bar represents the share who speak an interview language as their home language but were
interviewed in a different language; and % not shown represents those who did not have the option of
being interviewed in their home language.)
Not surprisingly, we obtained very high match rates in the most linguistically homogenous
countries, such as Sudan, Egypt, Cape Verde, Burundi, Lesotho, and Mauritius. Swaziland is a
partial exception because a considerable number of native SiSwati speakers chose to be
interviewed in English. Among more linguistically diverse countries, however, the results were
9%
15%
24%
36%
27%
50%
46%
16%
48%
53%
49%
60%
21%
34%
65%
59%
56%
78%
60%
58%
88%
91%
67%
78%
97%
97%
70%
86%
99%
100%
100%
89%
100%
3%
16%
13%
16%
26%
5%
19%
51%
21%
16%
20%
11%
50%
37%
13%
19%
23%
2%
21%
29%
24%
14%
1%
28%
12%
1%
11%
0% 10% 20% 30% 40% 50% 60% 70% 80% 90% 100%
Liberia
Tanzania
Côte d’Ivoire
Cameroon
Zambia
Mozambique
Zimbabwe
Nigeria
Kenya
Burkina Faso
Mali
Namibia
Ethiopia
Sierra Leone
Togo
Botswana
Uganda
Senegal
Malawi
Ghana
Benin
Morocco
Algeria
Guinea
Niger
Mauritius
Lesotho
South Africa
Swaziland
Burundi
Cape Verde
Egypt
Madagascar
Sudan
% interviewed in home language % interviewed in another language
Afrobarometer Working Papers
Copyright ©Afrobarometer 2017 17
much more mixed. On the one hand we have Malawi, where home-language
questionnaires were available for 80% of respondents and used by 78%, a match rate of 98%.
At the other end of the spectrum we find Kenya, where 67% could have done an interview in
their home language, but only 16% actually did, a match rate of just 24%. Instead, 59% of
interviews in Kenya were conducted in the main lingua franca, Kiswahili, and another 24%
were conducted in English.
These apparent mismatches could arise from several factors, including:
Interviewer-respondent mismatch – A respondent’s home-language questionnaire
may not be usable, either due to poor positioning of fieldworkers (i.e. not sending
teams with the right mix of language skills) or because of challenges imposed by
community-level linguistic diversity (i.e. respondents from many language groups in a
small area, some of which may not be recognized as common in the region).
Inter-ethnic relationships – These may affect the choice of interview language when
interviewer and respondent are from different ethno-linguistic groups.
Respondent choice – Afrobarometer protocol requires interviewing in “the language
of the respondent’s choice,” and some respondents may prefer to be interviewed in
a language other than their mother tongue for status, ease of communication, or
other reasons. This might, for example, explain the significant number of native SiSwati
speakers in Swaziland who chose to be interviewed in English rather than SiSwati.
Interviewers may prefer working in some languages rather than others and may
therefore, consciously or unconsciously, steer respondents toward those languages.
In short, on the one hand matching failures could reflect weaknesses in survey management
in terms of selection and deployment of fieldworkers with appropriate language skills. But it is
possible that even with careful attention to fieldworker recruitment and deployment, the
linguistic profiles of some countries may make achieving higher levels of home-language
matching prohibitively difficult and expensive. This could explain at least part of the low
match rate in Kenya, for example, where considerable internal migration has occurred,
especially into the most agriculturally productive regions, resulting in diverse local-level
language profiles that are difficult to match.
This suggests that each country where match rates are low needs to be subjected to an in-
depth analysis to determine the underlying reasons. In some cases, adjustments to
management practices may be called for, while in others, the outcome may be to drop
under-utilized translations in future rounds.
Social and political impacts of community-level linguistic diversity
My focus here has been primarily descriptive – revealing individual, community, and national
linguistic profiles – and practical, in terms of understanding the implications of this diversity for
doing the kinds of survey research that allow us to collect fine-grained individual-level
information. But several possibilities exist for further analysis, both to more fully understand
what explains the patterns we see here and to explore the implications of language
patterns, language distribution, and language capacity as variables that may help explain
other social and political phenomena captured by Afrobarometer. While there are rich
possibilities for further analysis with respect to all levels (individual, communal, and national)
of language capacity and diversity, I want to focus in particular on the potential implications
of the community-level diversity revealed in this analysis.
Aside from its implications for survey management, does community-level linguistic diversity
matter? Does it, for example, shape individuals’ attitudes toward their own identity, their
neighbours, or their country? In particular, does living in a more diverse community draw
people outward toward trust in, tolerance for, and acceptance of others, and toward a
Afrobarometer Working Papers
Copyright ©Afrobarometer 2017 18
multi-ethnic national identity? Or does it accentuate differences, pushing people apart and
back toward the comfort of their own people, their own linguistic or ethnic group? A number
of analysts have begun to look at these questions in the African context. For example,
Albaugh (2016) analyzes the relationships between learning European languages and size of
language group on the one hand, and preferences for parochial ethnic vs. national
identities on the other. The findings presented here on community-level linguistic diversity
suggest that this variable could be added into that analysis to deepen our understanding of
intercommunal trust. Along these lines, Kasara (2013) explores the impact of ethnic
composition at the location level in Kenya (approximately 13,000 people) on inter-ethnic
trust, and Robinson (2016) explores similar issues looking at district-level ethnic composition,
across countries. A brief exploration of the data suggests that disaggregating even further, to
investigate the impacts of ethnic composition at the EA level in respondents’ local
communities, could be a fruitful extension of this research.
We can illustrate this potential with a few initial tests. For example, focusing again on the 22
more linguistically diverse countries identified earlier, we find that the number of home
languages spoken in an EA is negatively correlated with trust in neighbours (Pearson’s r=-.154,
p<.01). In general, it appears that those whose neighbours are less like themselves are less
likely to trust those neighbours. This significant negative relationship holds even after
controlling for other demographic factors such as age, gender, rural-urban location, and
education, although the relationship appears to be somewhat weaker after accounting for
these factors.14
However, when we look at how communal diversity shapes attitudes vis-à-vis oneself and the
nation, the picture may change. Afrobarometer asks respondents to identify their ethnic
group, and then follows that with a question asking, “Let us suppose that you had to choose
between being a [respondent’s nationality] and being a [member of respondent’s self-
identified ethnic group]. Which would you choose?” In this case a simple correlation test
reveals that those in more diverse communities are slightly more likely to identify with their
national identity rather than their ethnic group, although the relationship is again very
modest (Pearson’s r=.029, p<.01). This relationship still holds when we control for other
demographics.15
But the picture becomes more complex when we examine these relationships at the country
level. In several countries, including Guinea, Cameroon, and Burkina Faso, identification with
one’s national identity appears to be markedly higher in more diverse EAs, while in others,
especially Sierra Leone, the opposite appears to be true. These findings are merely
exploratory at this stage, but they suggest the potential analytical value in these findings
about community-level diversity, which will be explored more thoroughly in future work.
Conclusion
Many of the findings presented here will be no surprise to anyone familiar with linguistic
patterns in Africa. The continent, like many of the individual countries within it, is
characterized by enormous linguistic diversity. The widespread individual-level multilingualism
that results is also well known, though Afrobarometer can document this in much more
specific and comparative terms across the continent than has previously been possible.
Perhaps more surprising is the diversity that has been revealed at the micro-community level.
Even in many rural zones, Africans are living within ethnically and linguistically diverse
communities, rather than the more homogenous ethnic homelands we may have imagined.
At the same time, we also see that while the linguistic profiles of many urban communities
14 In an OLS regression with trust in neighbours as the dependent variable, the standardized beta for number of home languages spoken in the EA is -0.073, p<.001. 15 In an OLS regression with the extent of identification with national identity over ethnic identity, the standardized beta for number of home languages spoken in the EA is 0.033, p<.001.
Afrobarometer Working Papers
Copyright ©Afrobarometer 2017 19
are consistent with the image of the urban melting pot, in some countries there appears to
be a higher tendency to self-segregate into ethno-linguistic “hometown groups” even in
urban centers, a tendency that may both reflect and produce important patterns with
respect to national identity and cohesion.
But as indicated at the outset, a key purpose of this chapter was to begin the exploration of
these data with an eye to pointing out some of the opportunities it offers for further insight
and analysis. I can suggest four main directions for this analysis.
I would first highlight opportunities for further exploration of the micro-data, especially the
detailed information captured in Round 4 on multilingualism. There is much more to be
gleaned about how and why individuals invest in learning second, third, or fourth languages;
which languages they choose to invest in; and how the language profiles of minority groups
compare to those of majorities. Comparisons of these self-reported language patterns with
the expert assessments captured in the Ethnologue could also offer new insights into
multilingualism and language choice that take both expert assessments and individual
understandings and realities into account.
There are also opportunities for further analysis, in the terms described by Albaugh and de
Luna (2017), of language both as product (the second research direction) and as variable
(the third). Although Afrobarometer data essentially offer a snapshot of language distribution
and capacity, analysis of differences across age, education, and urbanization can help us
understand how linguistic patterns have developed and how they are changing over time
and across generations. And as Albaugh (2016) has demonstrated, these data can also
provide empirical evidence that allows us to test the impacts of education and language
policy across the continent.
The evidence also suggests that as variable, language patterns can carry some explanatory
weight as we seek to better understand the factors that shape social and political attitudes
and behaviors. By taking this analytical approach from the district or location level down to a
micro-community level, we may add a new depth of understanding about the formative
processes that shape forces of cohesion, competition, and conflict.
Finally, more analysis remains to be done regarding languages and survey methodology.
Building on the work of Adida et al. (2015), we might ask, for example, what we can learn
about inter-ethnic relations and the power of languages by analyzing survey languages, how
translations are used, and how different interviewer-respondent dyads select the interview
language. For Afrobarometer, enriching our understanding of how languages are used both
socially and politically will contribute to our ongoing efforts to refine our methods and
enhance data quality.
Afrobarometer Working Papers
Copyright ©Afrobarometer 2017 20
References
Adida, C. L., Ferree, K. E., Posner, D. N., & Robinson, A. L. (2015). Who’s asking? Interviewer co-ethnicity effects in African survey data. Afrobarometer Working Paper No. 158. http://www.afrobarometer.org/publications?title=&field_publication_type_tid=7&field_language_tid=All&field_publication_country_nid=All&field_author_value=posner.
Afrobarometer. (2014). Round 6 survey manual. http://www.afrobarometer.org/sites/ default/files/survey_manuals/ab_r6_survey_manual_en.pdf .
Albaugh, E. (2014). State-building and multi-lingual education in Africa. New York: Cambridge University Press.
Albaugh, E. (2016). Language, education, and citizenship in Africa. Afrobarometer Working Paper No. 162. http://afrobarometer.org/sites/default/files/publications/Working%20papers/ afropaperno162_language_education_and_citizenship_in_africa.pdf.
Albaugh, E., & de Luna, K. M. (2017, forthcoming). Toward an interdisciplinary perspective on language movement and change. In E. Albaugh & K.M. de Luna (Eds.), Tracing Language Movement in Africa. Oxford: Oxford University Press.
Bratton, M. (2010). Anchoring the d-word in Africa. Journal of Democracy, 21 (4), 106-113.
Kasara, K. (2013). Separate and suspicious: Local social and political context and ethnic tolerance in Kenya. Journal of Politics, 75(4), 921-936.
Olson, K., &Lewis, M. P. (2017, forthcoming). The Ethnologue and L2 mapping. In E. Albaugh & K. M. de Luna (Eds.), Tracing Language Movement in Africa. Oxford: Oxford University Press.
Robinson, A. L. (2016). Ethnic diversity, segregation and ethnocentric trust in Africa. Afrobarometer Working Paper No. 166. http://afrobarometer.org/sites/default/files/publications/ Working%20papers/afropaperno166.pdf.
Afrobarometer Working Papers
Copyright ©Afrobarometer 2017 21
Recent Afrobarometer working papers
No. 171 Guardado, Jenny & Leonard Wantchekon. Do electoral handouts affect voting behavior? 2017.
No. 170 Kerr, Nicholas & Anna Lührmann. Public trust in elections: The role of media freedom and election management autonomy. 2017.
No. 169 McNamee, Lachlan. Indirect colonial rule and the political salience of ethnicity. 2016.
No. 168 Coulibaly, Massa. Measuring democracy in Africa: Applying anchors. (French). 2016
No. 167 Monyake, Moletsane. Does personal experience of bribery explain protest participation in Africa? 2016.
No. 166 Robinson, Amanda Lea. Ethnic diversity, segregation, and ethnocentric trust in Africa. 2016.
No. 165 Hounsounon, Damas. Décentralisation et qualité de l’offre de services socio-publics en Afrique subsaharienne. 2016.
No. 164 Mattes, Robert & Mulu Teka. Ethiopians’ views of democratic government: Fear, ignorance, or unique understanding of democracy? 2016.
No. 163 Manacorda, Marco & Andrea Tesei. Liberation technology: Mobile phones and political mobilization in Africa. 2016.
No. 162 Albaugh, Ericka A. Language, education, and citizenship in Africa. 2016.
No. 161 De Kadt, D., & Evan S. Lieberman. Do citizens reward good service? Voter responses to basic service provision in southern Africa. 2015
No. 160 Aquino, J. A. The effect of exposure to political institutions and economic events on demand for democracy in Africa. 2015
No. 159 Tsubura, Machiko. Does clientelism help Tanzanian MPs establish long-term electoral support? 2015
No. 158 Claire, Adida L., Karen E. Ferree, Daniel N. Posner, & Amanda L. Robinson. Who’s asking? Interviewer coethnicity effects in African survey data. 2015
No. 157 Bratton, Michael & E. Gyimah-Boadi. Political risks facing African democracies: Evidence from Afrobarometer. 2015
No. 156 Croke, Kevin, Guy Grossman, Horacio A. Larreguy, & John Marshall. Deliberate disengagement: How education decreases political participation in electoral authoritarian regimes. 2015
No. 155 Bleck, Jaimie & Kristin Michelitch. On the primacy of weak public service provision in rural Africa: Malians redefine ‘state breakdown’ amidst 2012 political crisis. 2015
No. 154 Leo, Benjamin, Robert Morello, & Vijaya Ramachandran. The face of African infrastructure: Service availability and citizens’ demands. 2015
No. 153 Gottlieb, Jessica, Guy Grossman, & Amanda Lea Robinson. Do men and women have different policy preferences, and if so, why? 2015
No. 152 Mattes, Robert & Samantha Richmond. Are South Africa’s youth really a ‘ticking time bomb’? 2015
No. 151 Mattes, Robert. South Africa’s emerging black middle class: A harbinger of political change? 2014
No. 150 Cheeseman, Nic. Does the African middle class defend democracy? Evidence from Kenya. 2014
No. 149 Schaub, Max. Solidarity with a sharp edge: Communal conflict and local collective action in rural Nigeria. 2014
Afrobarometer Working Papers
Copyright ©Afrobarometer 2017 22
Afrobarometer Working Papers Series
Editor: Michael Bratton, [email protected] Editorial Board: E. Gyimah-Boadi, Carolyn Logan, Robert Mattes, Leonard Wantchekon Afrobarometer publications report the results of national sample surveys on the attitudes of citizens in selected African countries toward democracy, markets, civil society, and other aspects of development. Afrobarometer publications are simultaneously co-published by the six Afrobarometer Core Partner and Support Unit Institutions. All Afrobarometer publications can be searched and downloaded from www.afrobarometer.org.
Support for Afrobarometer is provided by the UK’s Department for International Development (DFID), the Mo Ibrahim Foundation, the Swedish International Development Cooperation Agency (SIDA), the United States Agency for International Development (USAID), and the World Bank.
Core partners: Center for Democratic Development (CDD-Ghana)
95 Nortei Ababio Street, North Airport Residential Area
P.O. Box LG 404, Legon-Accra, Ghana Tel: +233 21 776 142
Fax: +233 21 763 028
www.cddghana.org
Institute for Development Studies (IDS), University of Nairobi P.O. Box 30197, Nairobi, 00100, Kenya Tel: +254 20 2247968 Fax: +254 20 2222036 www.ids.uonbi.ac.ke
Institute for Empirical Research in Political Economy (IREEP) Arconville, Lot 104 - Parcelle J, 02 BP: 372, Cotonou, Republique du Benin Tel: +229 21 363 873/ 229 94 940 108 Fax: +229 21 362 029
www.ireep.org
Institute for Justice and Reconciliation (IJR) 105 Hatfield Street, Gardens, 8001, Cape Town, South Africa Tel: +27 21 763 7128 Fax: +27 21 763 7138 www.ijr.org.za
Support units:
Michigan State University (MSU) Department of Political Science
East Lansing, MI 48824
Tel: +1 517 353 6590; Fax: +1 517 432 1091 www.polisci.msu.edu
University of Cape Town UCT) Democracy in Africa Research Unit Centre for Social Science Research
Private Bag Rondebosch 7701, South Africa Tel: +27 21 650 3827 Fax: +27 21 650 4657 www.cssr.uct.org.za