Embed Size (px)
Citation preview

80 Years of Property Losses: What Will it Take to Survive to
Next 80 Years?Loss Executives Association Annual Meeting
Tampa, FLFebruary 3, 2011
Download at www.iii.org/presentationsRobert P. Hartwig, Ph.D., CPCU, President & Economist
Insurance Information Institute 110 William Street New York, NY 10038Tel: 212.346.5520 Cell: 917.453.1885 [email protected] www.iii.org
2
Presentation Outline
80 Years: The Dollars and Cents Paying Claims Over the Long Haul: What Does it Take?
Claims Paying Capital & Capacity Financial Strength
Profits, Profitability and Claims Paying Ability Claims Paying and Investment Performance & Volatility
The “Great Recession” as a case study
External Challenges Shifting tort environment
Claims Paying Capacity and the Economy Insurers must maintain the ability to pay claims even in deep recessions
Catastrophe Loss Trends US Global Importance of reinsurance in claims paying capacity
Q&A
3
CONGRATULATIONS LEA!!
80 YEARS: 1931-2011
7,215,698,210,618
QUIZ: What is the significance of this number?
4
$7,215,698,210,618
ANSWER: This is the dollar value of all claims paid by P/C insurers since 1931.

5
CONGRATULATIONS LEA!!
80 YEARS: 1931-2011
12,539,027,130,890
QUIZ: What is the significance of this number?
6
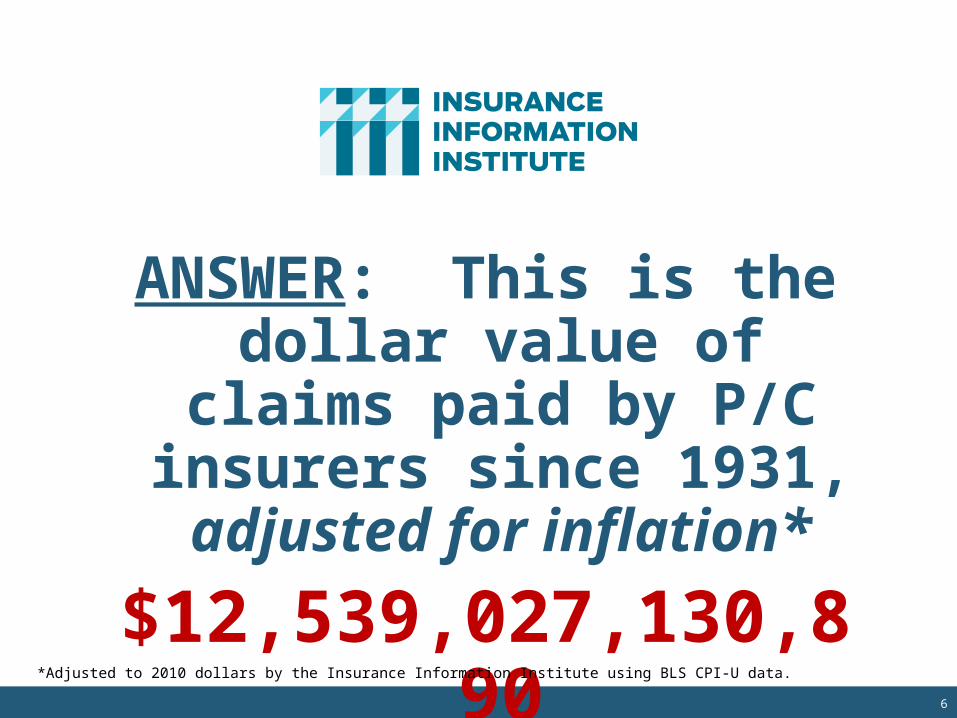
$12,539,027,130,890
ANSWER: This is the dollar value of claims paid by P/C
insurers since 1931, adjusted for inflation*
*Adjusted to 2010 dollars by the Insurance Information Institute using BLS CPI-U data.
7
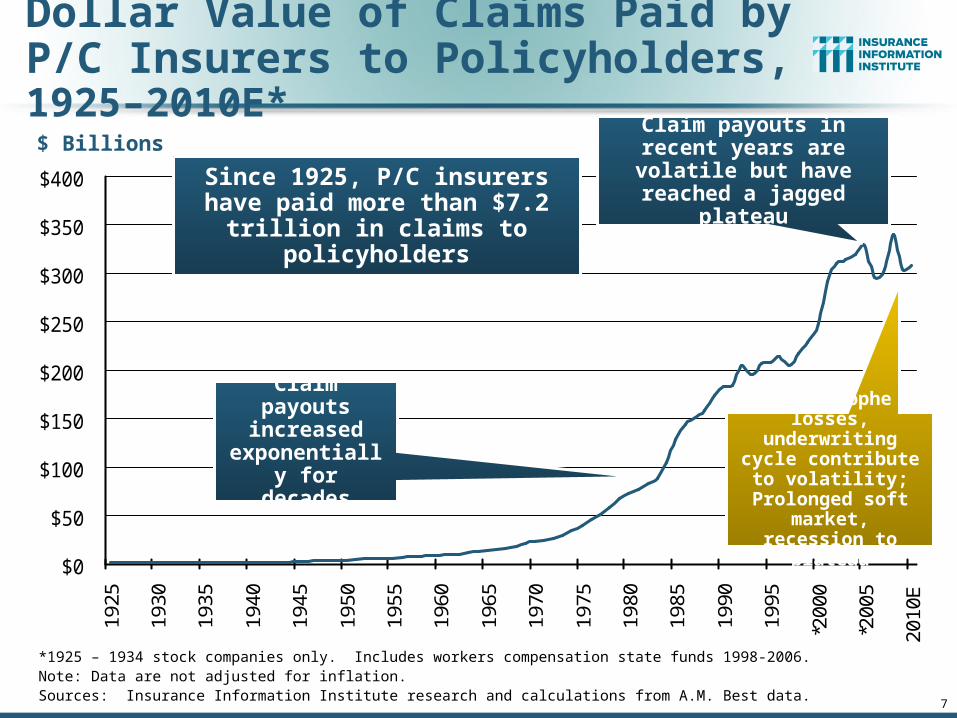
Dollar Value of Claims Paid by P/C Insurers to Policyholders, 1925–2010E*
*1925 – 1934 stock companies only. Includes workers compensation state funds 1998-2006.Note: Data are not adjusted for inflation.Sources: Insurance Information Institute research and calculations from A.M. Best data.
$0
$50
$100
$150
$200
$250
$300
$350
$400
1925
1930
1935
1940
1945
1950
1955
1960
1965
1970
1975
1980
1985
1990
1995
*200
0
*200
5
2010
E
Since 1925, P/C insurers have paid more than $7.2 trillion in
claims to policyholders
Claim payouts increased
exponentially for decades
Claim payouts in recent years are volatile but have reached a jagged plateau
Catastrophe losses, underwriting cycle
contribute to volatility; Prolonged
soft market, recession to plateau
$ Billions

8
Cumulative Value of Claims Paid by P/C Insurers to Policyholders, 1925–2010E*
*1925 – 1934 stock companies only. Includes workers compensation state funds 1998-2006.Note: Data are not adjusted for inflation.Sources: Insurance Information Institute research and calculations from A.M. Best data.
$0
$1,000
$2,000
$3,000
$4,000
$5,000
$6,000
$7,000
$8,000
1925
1930
1935
1940
1945
1950
1955
1960
1965
1970
1975
1980
1985
1990
1995
*200
0
*200
5
2010
E
It took 60 years for the industry to pay its first $1 trillion in claims in the years since 1925. Today, the industry pays
$1 trillion in claims every 3 to 4 years.
60 years (1925 – 1984)
$ Billions
7 years (1991)
4 years (1995)
5 years (2000)
3 years (2003)
3 years (2006)
4 years (2010)

9
Inflation-Adjusted Dollar Value of Claims Paid by P/C Insurers, 1925–2010E*
*1925 – 1934 stock companies only. Includes workers compensation state funds 1998-2006.Sources: Insurance Information Institute research and calculations from A.M. Best data.
$0
$50
$100
$150
$200
$250
$300
$350
$400
1925
1930
1935
1940
1945
1950
1955
1960
1965
1970
1975
1980
1985
1990
1995
2000
2005
2010
E
Since 1925, P/C insurers have paid more than $12.6
trillion in claims to policyholders on an
inflation-adjusted basis
Claim payouts increased
exponentially for decades, but
more erratically in the post-1980 era
On an inflation-adjusted basis, claims paid have fallen to 1990s
levels, reflecting improved underwriting results, exposure
loss during the “Great Recession” and leakage to alternative markets
$ Billions
10
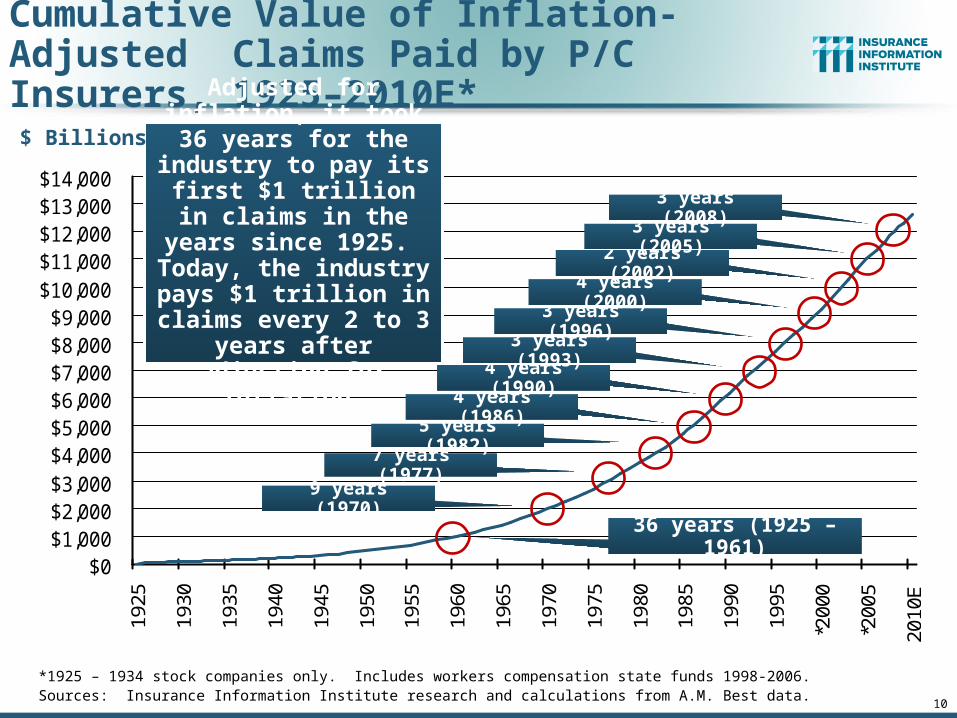
Cumulative Value of Inflation-Adjusted Claims Paid by P/C Insurers, 1925–2010E*
*1925 – 1934 stock companies only. Includes workers compensation state funds 1998-2006.Sources: Insurance Information Institute research and calculations from A.M. Best data.
$0$1,000$2,000$3,000$4,000$5,000$6,000$7,000$8,000$9,000
$10,000$11,000$12,000$13,000$14,000
1925
1930
1935
1940
1945
1950
1955
1960
1965
1970
1975
1980
1985
1990
1995
*200
0
*200
5
2010
E
Adjusted for inflation, it took 36 years for the
industry to pay its first $1 trillion in claims in the years since 1925. Today, the industry
pays $1 trillion in claims every 2 to 3 years after adjusting for inflation.
36 years (1925 – 1961)
$ Billions
9 years (1970)
7 years (1977)
5 years (1982)
4 years (1986)
4 years (1990)
3 years (1993)
3 years (1996)
4 years (2000)
2 years (2002)
3 years (2005)
3 years (2008)

11
What Does it Take to Pay Out $1 Trillion Every 3-4 Years?
Financial Strength Was the Key to the Past 80 Years— It is the Key to the Next 80
As Well
Capital/PolicyholderSurplus (US)
12
Total Surplus Exhibits Little Cyclicality, While Surplus Leverage
Ratios Influence Cycle

$0
$50
$100
$150
$200
$250
$300
$350
$400
$450
$500
$550
$600
75 77 79 81 83 85 87 89 91 93 95 97 99 01 03 05 07 09
US Policyholder Surplus:1975–2010*
* As of 9/30/10; **Calculated using annualized net premiums written based on 9-month 2010 data.Source: A.M. Best, ISO, Insurance Information Institute.
“Surplus” is a measure of underwriting capacity. It is
analogous to “Owners Equity” or “Net Worth” in
non-insurance organizations
($ Billions)
The Premium-to-Surplus Ratio Stood at $0.77:$1 as of9/30/10, A Record Low (at Least in Recent History)**
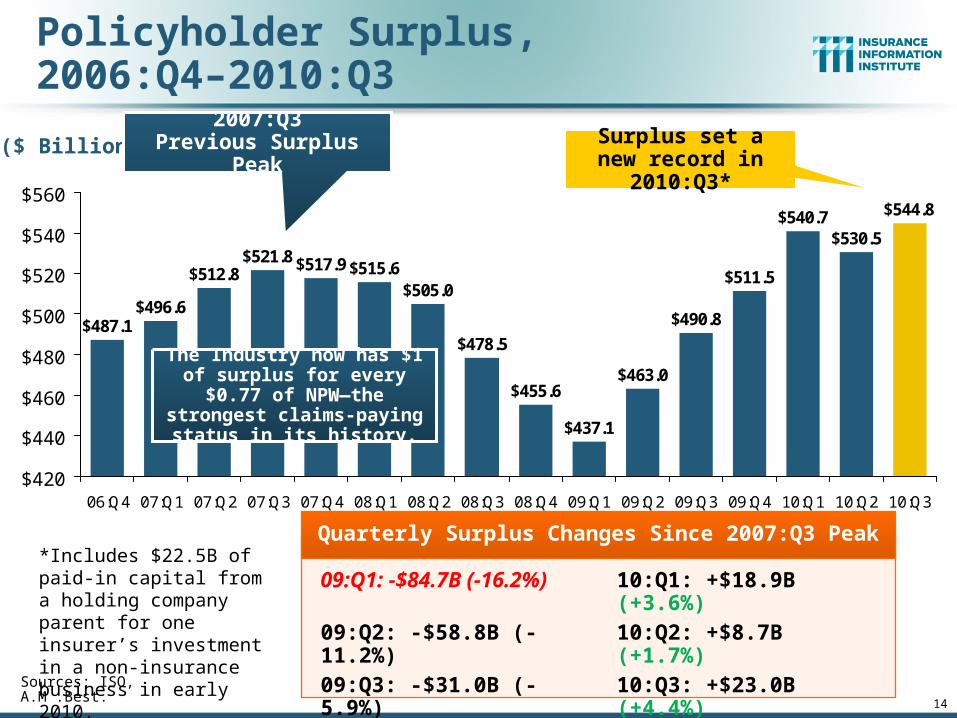
Surplus as of 9/30/10 was a record $544.8B, up from $437.1B at the crisis trough at 3/31/09. Prior
peak was $521.8 as of 9/30/07. Surplus as of 9/30/10 is now 4.4% above 2007 peak; Crisis trough was as
of 3/31/0916.2% below 2007 peak.
14
Policyholder Surplus, 2006:Q4–2010:Q3
Sources: ISO, A.M .Best.
($ Billions)
$487.1$496.6
$512.8$521.8
$478.5
$455.6
$437.1
$463.0
$490.8
$511.5
$540.7$530.5
$544.8
$505.0$515.6$517.9
$420
$440
$460
$480
$500
$520
$540
$560
06:Q4 07:Q1 07:Q2 07:Q3 07:Q4 08:Q1 08:Q2 08:Q3 08:Q4 09:Q1 09:Q2 09:Q3 09:Q4 10:Q1 10:Q2 10:Q3
2007:Q3Previous Surplus Peak
Quarterly Surplus Changes Since 2007:Q3 Peak
09:Q1: -$84.7B (-16.2%) 09:Q2: -$58.8B (-11.2%)09:Q3: -$31.0B (-5.9%)09:Q4: -$10.3B (-2.0%)
10:Q1: +$18.9B (+3.6%)10:Q2: +$8.7B (+1.7%)10:Q3: +$23.0B (+4.4%)
Surplus set a new record in 2010:Q3*
*Includes $22.5B of paid-in capital from a holding company parent for one insurer’s investment in a non-insurance business in early 2010.
The Industry now has $1 of surplus for every $0.77 of
NPW—the strongest claims-paying status in its history.
15
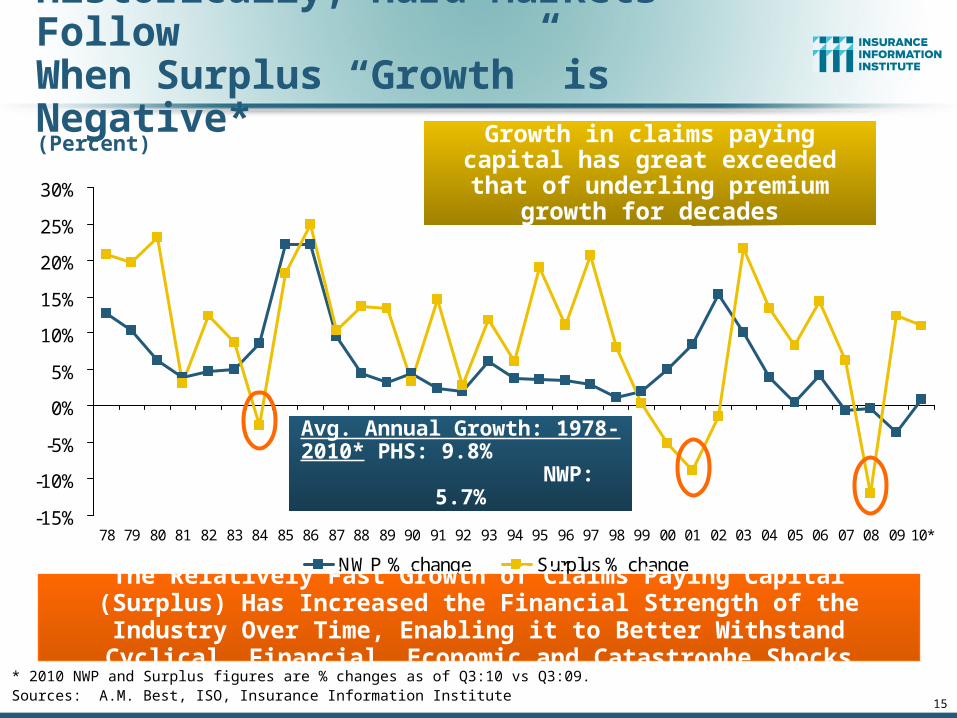
* 2010 NWP and Surplus figures are % changes as of Q3:10 vs Q3:09. Sources: A.M. Best, ISO, Insurance Information Institute
Historically, Hard Markets FollowWhen Surplus “Growth” is Negative*
-15%
-10%
-5%
0%
5%
10%
15%
20%
25%
30%
78 79 80 81 82 83 84 85 86 87 88 89 90 91 92 93 94 95 96 97 98 99 00 01 02 03 04 05 06 07 08 09 10*
NWP % change Surplus % change
(Percent)
The Relatively Fast Growth of Claims Paying Capital (Surplus) Has Increased the Financial Strength of the Industry Over Time, Enabling it to Better Withstand Cyclical, Financial, Economic and Catastrophe Shocks
Avg. Annual Growth: 1978-2010* PHS: 9.8% NWP:
5.7%
Growth in claims paying capital has great exceeded that of underling
premium growth for decades
16
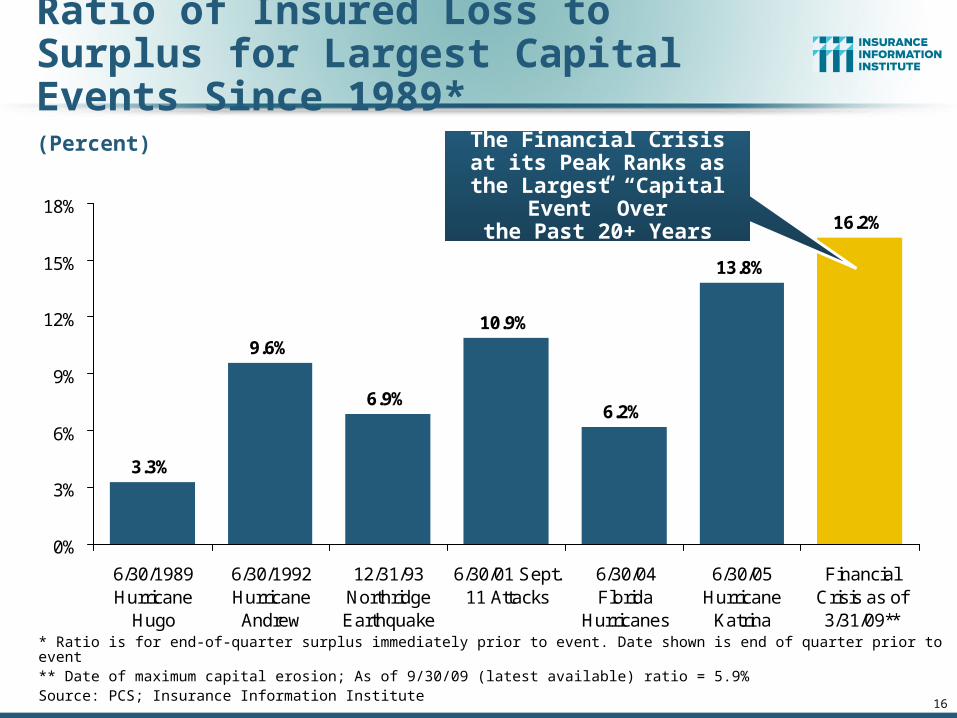
Ratio of Insured Loss to Surplus for Largest Capital Events Since 1989*
* Ratio is for end-of-quarter surplus immediately prior to event. Date shown is end of quarter prior to event** Date of maximum capital erosion; As of 9/30/09 (latest available) ratio = 5.9%Source: PCS; Insurance Information Institute
3.3%
9.6%
6.9%
10.9%
6.2%
13.8%
16.2%
0%
3%
6%
9%
12%
15%
18%
6/30/1989Hurricane
Hugo
6/30/1992HurricaneAndrew
12/31/93NorthridgeEarthquake
6/30/01 Sept.11 Attacks
6/30/04Florida
Hurricanes
6/30/05Hurricane
Katrina
FinancialCrisis as of3/31/09**
The Financial Crisis at its Peak Ranks as the Largest
“Capital Event” Overthe Past 20+ Years
(Percent)
17
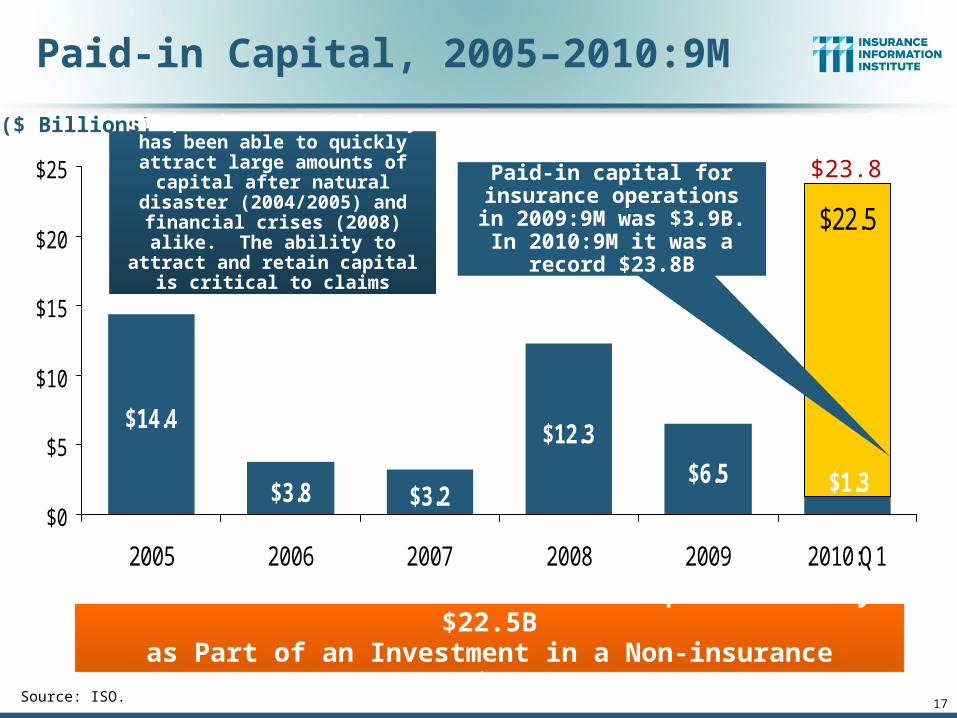
Paid-in Capital, 2005–2010:9M
Source: ISO.
($ Billions)
$14.4
$3.8 $3.2
$12.3
$1.3$6.5
$22.5
$0
$5
$10
$15
$20
$25
2005 2006 2007 2008 2009 2010:Q1
Paid-in capital for insurance operations in 2009:9M was $3.9B. In 2010:9M it was a
record $23.8B
In 2010:H1 One Insurer’s Paid-in Capital Rose by $22.5Bas Part of an Investment in a Non-insurance Business
$23.8The p/c insurance industry has
been able to quickly attract large amounts of capital after natural
disaster (2004/2005) and financial crises (2008) alike. The ability to
attract and retain capital is critical to claims paying over the long
run.
18
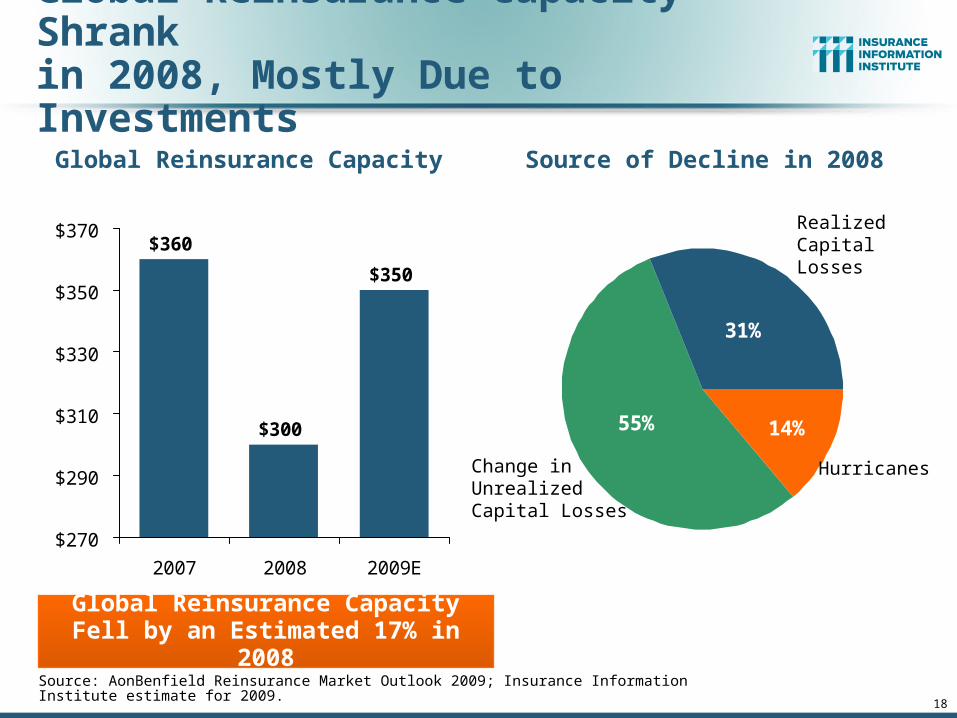
Global Reinsurance Capacity Source of Decline in 2008
Global Reinsurance Capacity Shrankin 2008, Mostly Due to Investments
$360
$300
$350
$270
$290
$310
$330
$350
$370
2007 2008 2009E
55% 14%
31%
Source: AonBenfield Reinsurance Market Outlook 2009; Insurance Information Institute estimate for 2009.
Global Reinsurance CapacityFell by an Estimated 17% in 2008
Change inUnrealizedCapital Losses
RealizedCapitalLosses
Hurricanes

Financial Strength is Synonymous With Claims
Paying Ability
19
Industry is Resilient but Cyclical Pattern in P-C Impairment History is Directly Tied to Underwriting,
Reserving & Pricing
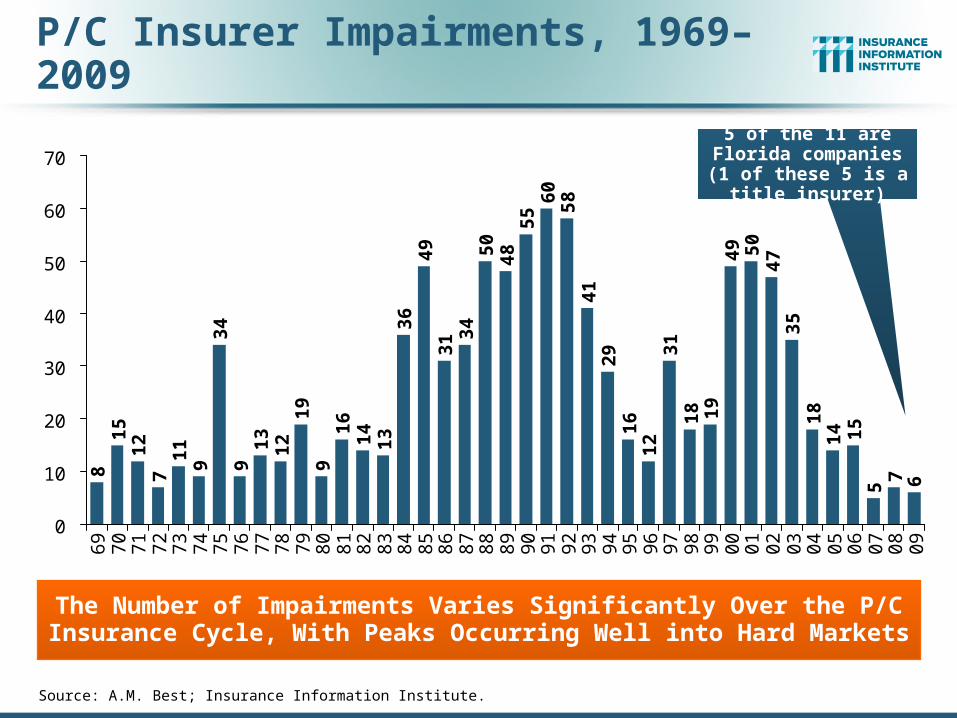
P/C Insurer Impairments, 1969–20098
15
12
71
19
34
91
31
21
99
16
14
13
36
49
31 3
45
04
85
56
05
84
12
91
61
23
11
8 19
49 50
47
35
18
14 15
7 65
0
10
20
30
40
50
60
70
69
70
71
72
73
74
75
76
77
78
79
80
81
82
83
84
85
86
87
88
89
90
91
92
93
94
95
96
97
98
99
00
01
02
03
04
05
06
07
08
09
Source: A.M. Best; Insurance Information Institute.
The Number of Impairments Varies Significantly Over the P/C Insurance Cycle, With Peaks Occurring Well into Hard Markets
5 of the 11 are Florida companies (1 of these
5 is a title insurer)

21
P/C Insurer Impairment Frequency vs. Combined Ratio, 1969-2009
90
95
100
105
110
115
1206
97
07
17
27
37
47
57
67
77
87
98
08
18
28
38
48
58
68
78
88
99
09
19
29
39
49
59
69
79
89
90
00
10
20
30
40
50
60
70
80
9*
Co
mb
ine
d R
ati
o
0.0
0.2
0.4
0.6
0.8
1.0
1.2
1.4
1.6
1.8
2.0
Imp
airm
en
t Ra
te
Combined Ratio after Div P/C Impairment Frequency
Source: A.M. Best; Insurance Information Institute
2009 estimated impairment rate rose to 0.36% up from a near record low of 0.23% in 2008 and the 0.17% record low in 2007; Rate is still less than one-half the 0.79% average since 1969
Impairment Rates Are Highly Correlated With Underwriting Performance and Reached Record Lows in 2007/08
22
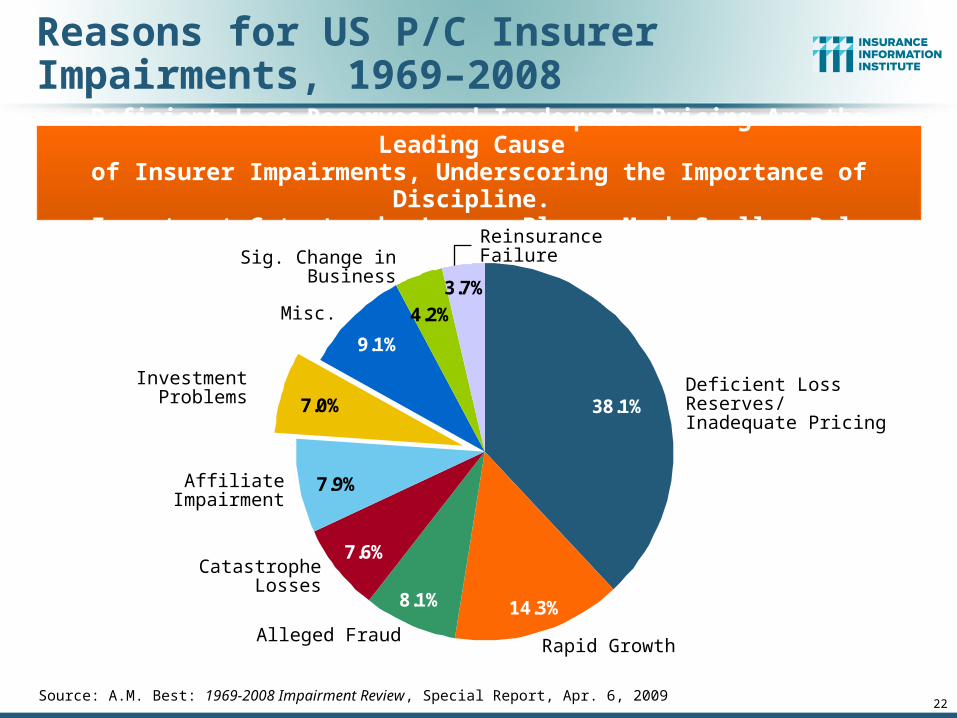
Reasons for US P/C Insurer Impairments, 1969–2008
38.1%
14.3%8.1%
7.6%
7.9%
7.0%
9.1%
4.2%
3.7%
Source: A.M. Best: 1969-2008 Impairment Review, Special Report, Apr. 6, 2009
Deficient Loss Reserves and Inadequate Pricing Are the Leading Cause of Insurer Impairments, Underscoring the Importance of Discipline.
Investment Catastrophe Losses Play a Much Smaller Role
Deficient Loss Reserves/Inadequate Pricing
Reinsurance Failure
Rapid GrowthAlleged Fraud
Catastrophe Losses
Affiliate Impairment
Investment Problems
Misc.
Sig. Change in Business

23
The Ability to Pay Claims Begins With Sustained
Profitability
Profits Are Volatile but Resilient in the P/C Insurance Industry

P/C Net Income After Taxes1991–2010:Q3 ($ Millions)
$1
4,1
78
$5
,84
0
$1
9,3
16
$1
0,8
70
$2
0,5
98
$2
4,4
04 $
36
,81
9
$3
0,7
73
$2
1,8
65
$3
,04
6
$3
0,0
29
$6
2,4
96
$3
,04
3
$2
6,7
00
$2
8,3
11
-$6,970
$6
5,7
77
$4
4,1
55
$2
0,5
59
$3
8,5
01
-$10,000
$0
$10,000
$20,000
$30,000
$40,000
$50,000
$60,000
$70,000
$80,000
91 92 93 94 95 96 97 98 99 00 01 02 03 04 05 06 07 08 09 10:Q3
2005 ROE*= 9.6% 2006 ROE = 12.7% 2007 ROE = 10.9% 2008 ROE = 0.3% 2009 ROAS1 = 5.8% 2010:Q3 ROAS = 6.7%
P-C Industry 2010:Q3 profits were$26.7B vs.$16.4B in 2009:Q3,
due mainly to $4.4B in realized capital gains vs. -$9.6B in previous
realized capital losses
* ROE figures are GAAP; 1Return on avg. surplus. Excluding Mortgage & Financial Guaranty insurers yields a 7.7% ROAS for 2010:Q3 and 4.6% for 2009. 2009:Q3 net income was $29.8 billion excluding M&FG.Sources: A.M. Best, ISO, Insurance Information Institute

25
ROE: Property/Casualty Insurance,1987–2010E*
* Excludes Mortgage & Financial Guarantee in 2008 - 2010.Sources: ISO, Fortune; Insurance Information Institute figure for 2010 is actual through 2010:Q3.
-5%
0%
5%
10%
15%
20%
87 88 89 90 91 92 93 94 95 96 97 98 99 00 01 02 03 04 05 06 07 08 09 10E
P/C Profitability Is Both by Cyclicality and Ordinary Volatile
Hugo
Andrew
Northridge
Lowest CAT Losses in 15 Years
Sept. 11
Katrina, Rita, Wilma
4 Hurricanes
Financial Crisis*
(Percent)

26
ROE vs. Equity Cost of Capital:U.S. P/C Insurance:1991-2010:9-Months*
* Return on average surplus in 2008-2010 excluding mortgage and financial guaranty insurers.Source: The Geneva Association, Insurance Information Institute
-2%
0%
2%
4%
6%
8%
10%
12%
14%
16%
18%
91 92 93 94 95 96 97 98 99 00 01 02 03 04 05 06 07 08* 09* 10*
ROE Cost of Capital
-13
.2 p
ts +1
.7 p
ts
+2
.3 p
ts
-9.0
pts
-6.4
pts
-3.2
pts
The P/C Insurance Industry Fell WellShort of Its Cost of Capital in 2008 but
Narrowed the Gap in 2009 and 2010
US P/C Insurers Missed Their Cost of Capital by an Average 6.7 Points from
1991 to 2002, but on Target or Better 2003-07, Fell Short in 2008-2010
The Cost of Capital is the Rate of Return Insurers Need to
Attract and Retain Capital to the Business
(Percent)
-2.7
pts

A 100 Combined Ratio Isn’t What ItOnce Was: Investment Impact on ROEs
Combined Ratio / ROE
* 2009 and 2010:Q3 figures are return on average statutory surplus. 2008, 2009 and 2010:H1figures exclude mortgage and financial guaranty insurersSource: Insurance Information Institute from A.M. Best and ISO data.
97.5
100.6 100.1 100.7
92.6
99.5 99.7101.0
7.7%7.3%
9.6%
15.9%
14.3%
12.7%
4.4%
8.9%
80
85
90
95
100
105
110
1978 1979 2003 2005 2006 2008* 2009* 2010:Q3*0%
3%
6%
9%
12%
15%
18%
Combined Ratio ROE*
Combined Ratios Must Be Lower in Today’s DepressedInvestment Environment to Generate Risk Appropriate ROEs
A combined ratio of about 100 generated ~7.5% ROE in 2009/10,
10% in 2005 and 16% in 1979
Claims Paying Ability Must Be Maintained Over the Cycle
28
Industry’s Ability to Pay Claims Was Unimpaired by Protracted
Period of Weak/Negative Growth

29
-5%
0%
5%
10%
15%
20%
25%
71 72 73 74 75 76 77 78 79 80 81 82 83 84 85 86 87 88 89 90 91 92 93 94 95 96 97 98 99 00 01 02 03 04 05 06 07 08 0910
F
Soft Market Persisted in 2010 but May Be Easing: Relief in 2011?
(Percent)1975-78 1984-87 2000-03
Shaded areas denote “hard market” periodsSources: A.M. Best (historical and forecast), ISO, Insurance Information Institute.
Net Written Premiums Fell 0.7% in 2007 (First Decline Since 1943) by 2.0% in 2008, and 4.2% in 2009, the First 3-Year Decline Since 1930-33.
NWP was up 0.8% through 10:Q3 vs. -4.5% through 09:Q3

30
P/C Net Premiums Written: % Change, Quarter vs. Year-Prior Quarter
Sources: ISO, Insurance Information Institute.
Finally! Back-to-back quarters of net written premium growth(vs. the same quarter, prior year)
10.2
%15
.1%
16.8
%16
.7%
12.5
%10
.1%
9.7%
7.8%
7.2%
5.6%
2.9%
5.5%
-4.6
%-4
.1%
-5.8
%-1
.6%
10.3
%10
.2% 13
.4%
6.6%
-1.6
%2.
1%0.
0%-1
.9%
0.5%
-1.8
%-0
.7%
-4.4
%-3
.7%
-5.3
%-5
.2%
-1.4
%-1
.3%
1.3% 2.
3%
-10%
-5%
0%
5%
10%
15%
20%
2002
:Q1
2002
:Q2
2002
:Q3
2002
:Q4
2003
:Q1
2003
:Q2
2003
:Q3
2003
:Q4
2004
:Q1
2004
:Q2
2004
:Q3
2004
:Q4
2005
:Q1
2005
:Q2
2005
:Q3
2005
:Q4
2006
:Q1
2006
:Q2
2006
:Q3
2006
:Q4
2007
:Q1
2007
:Q2
2007
:Q3
2007
:Q4
2008
:Q1
2008
:Q2
2008
:Q3
2008
:Q4
2009
:Q1
2009
:Q2
2009
:Q3
2009
:Q4
2010
:Q1
2010
:Q2
2010
:Q3
The long-awaited uptick:
mainly personal lines

31
Net Written Premium Growth by Segment: 2008-2011F
-0.1%
-9.4%
2.8%
-2.0%
2.5%
0.3%
-3.1%
-0.1%
-12%
-10%
-8%
-6%
-4%
-2%
0%
2%
4%
Personal Lines Commercial Lines
2008 2009E 2010P 2011F
Rate and exposure are more favorable in personal lines, whereas a prolonged soft market and sluggish recovery from the recession
weigh on commercial lines.
Personal lines growth resumed in 2010 and will continue in 2011, while commercial lines contracted
again in 2010 and but will stabilize in 2011
Sources: A.M. Best; Insurance Information Institute.
Claims Paying Ability Must Be Maintained Irrespective of
Investment Climate
32
Investment Volatility Shouldn’t Matter to Policyholders

Property/Casualty Insurance Industry Investment Gain: 1994–2010:Q31
$35.4
$42.8$47.2
$52.3
$44.4
$36.0
$45.3$48.9
$59.4$55.7
$64.0
$31.7
$39.0 $39.5
$58.0
$51.9$56.9
$0
$10
$20
$30
$40
$50
$60
$70
94 95 96 97 98 99 00 01 02 03 04 05* 06 07 08 09 10:Q3In 2008, Investment Gains Fell by 50% Due to Lower Yields and
Nearly $20B of Realized Capital Losses 2009 Saw Smaller Realized Capital Losses But Declining Investment Income
Investment Gains Recovered Significantly in 20101 Investment gains consist primarily of interest, stock dividends and realized capital gains and losses.* 2005 figure includes special one-time dividend of $3.2B.Sources: ISO; Insurance Information Institute.
($ Billions) 2009:Q3 gain was $29.3B
Investment gains in 2010 are on track to be their best since 2007

34
P/C Insurer Net Realized Capital Gains, 1990-2010:Q3
Sources: A.M. Best, ISO, Insurance Information Institute.
$2.8
8
$4.8
1 $9.8
9
$9.8
2
$10.
81 $18.
02
$13.
02
$16.
21
$6.6
3
-$1.
21
$6.6
1
$9.1
3
$9.7
0
$3.5
2 $8.9
2
-$7.
98
$4.4
3
-$19
.81
$9.2
4
$6.0
0
$1.6
6
-$25-$20-$15-$10
-$5$0$5
$10$15$20
90 91 92 93 94 95 96 97 98 99 00 01 02 03 04 05 06 07 08 0910:Q3
Realized Capital Losses Were the Primary Cause of 2008/2009’s Large Drop in Profits and ROE and Were a Major
Driver of Its Recovery in 2010
($ Billions)Capital losses have
turned to capital gains, aiding earnings

35
Treasury Yield Curves: Pre-Crisis (July 2007) vs. December 2010
0.09% 0.14% 0.19% 0.29%0.62%
2.66%
3.29%
4.82% 4.96% 5.04% 4.96% 4.82% 4.82% 4.88% 5.00% 4.93% 5.00%5.19%
1.93%
0.99%
4.42%4.17%
0%
1%
2%
3%
4%
5%
6%
1M 3M 6M 1Y 2Y 3Y 5Y 7Y 10Y 20Y 30Y
October 2010 Yield Curve*Pre-Crisis (July 2007)
Treasury yield curve is near its most depressed level in at least 45 years,
though longer yields rose in late 2010 as economy improves. Investment
income is falling as a result.
The Fed’s Announced Intention to Pursue Additional Quantitative Easing Could Further Depress Rates in the 7 to 10-Year Maturity Range
Sources: Board of Governors of the United States Federal Reserve Bank; Insurance Information Institute.
QE2 Target

36
-1.8
%
-1.8
%
-2.0
%
-3.6
%
-3.3
%
-3.3
%
-3.7
%
-4.3
%
-5.2
%
-5.7
%
-7.3%
-1.9
%
-2.1
%
-3.1
%
-8%-7%-6%-5%-4%-3%-2%-1%0%
Perso
nal L
ines
Pvt Pass
Aut
o
Pers P
rop
Comm
ercia
l
Comm
l Auto
Credit
Comm
Pro
p
Comm
Cas
Fidelity
/Sure
ty
War
rant
y
Surplu
s Line
s
Med
Mal
WC
Reinsu
ranc
e**
Lower Investment Earnings Place a Greater Burden on Underwriting and Pricing Discipline
*Based on 2008 Invested Assets and Earned Premiums**US domestic reinsurance onlySource: A.M. Best; Insurance Information Institute.
Reduction in Combined Ratio Necessary to Offset 1% Decline in Investment Yield to Maintain Constant ROE, by Line*
37*Net admitted assets. Sources: NAIC; Insurance Information Institute research.
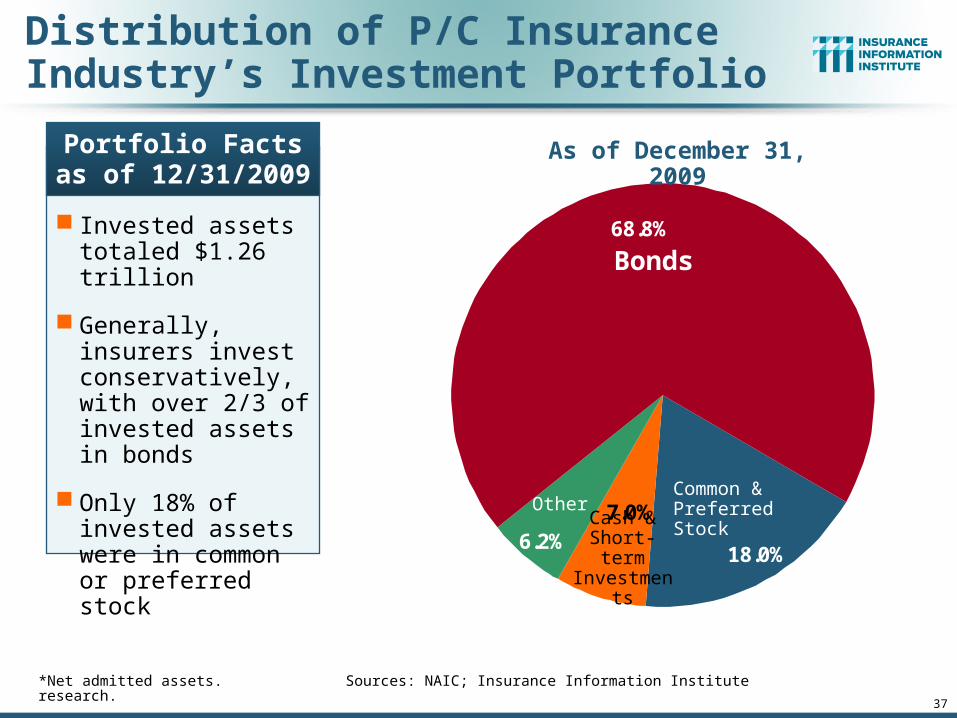
Invested assets totaled $1.26 trillion
Generally, insurers invest conservatively, with over 2/3 of invested assets in bonds
Only 18% of invested assets were in common or preferred stock
Portfolio Factsas of 12/31/2009
68.8%
6.2%18.0%
7.0%
Bonds
Common & Preferred Stock
As of December 31, 2009
Cash & Short-term
Investments
Other
Distribution of P/C Insurance Industry’s Investment Portfolio

38
2011 Financial Overview About Half of the P/C Insurance Industry’s Bond Investments Are in Municipal Bonds
Sources: NAIC, via SNL Financial; Insurance Information Institute research.
Investments in “Political Subdivision [of states]” bonds were $102.5 billion
Investments in “States, Territories, & Possessions” bonds were $58.9 billion
Investments in “Special Revenue” bonds were $288.2 billion
All state, local, and special revenue bonds totaled 48.2% of bonds, about 35.7% of total invested assets
Bond Investment Factsas of 12/31/09
0.9%
2.0%15.5%
6.3%
11.0%
31.0%33.3%
U.S. Government
Special Revenue
As of December 31, 2009
States, Terr., etc.
Industrial
Foreign Govt
Political Subdivisions
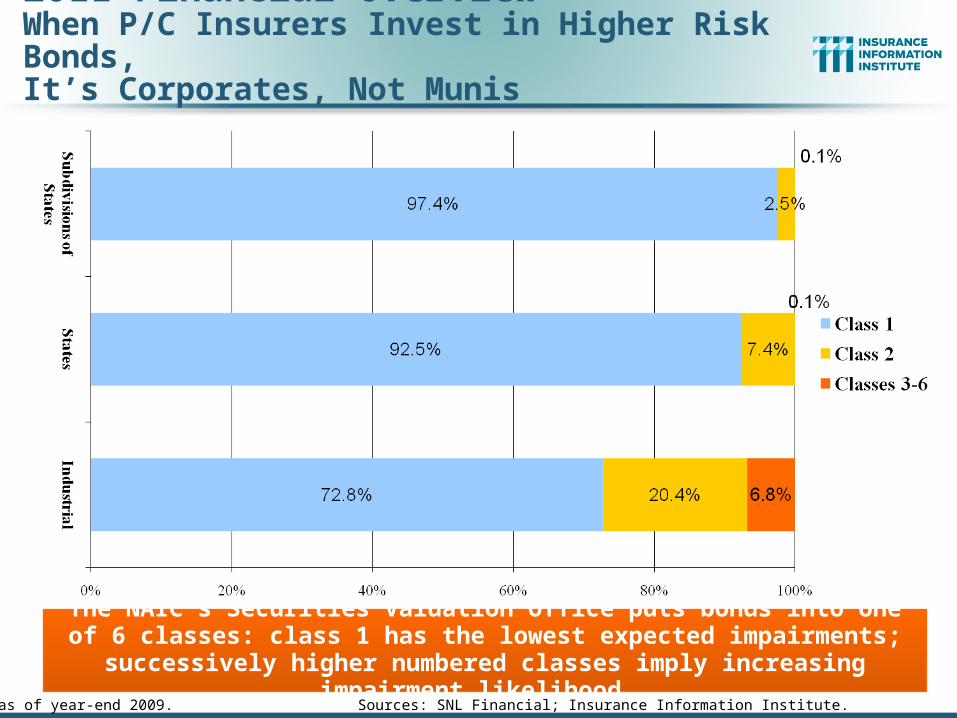
2011 Financial Overview When P/C Insurers Invest in Higher Risk Bonds,It’s Corporates, Not Munis
Data are as of year-end 2009. Sources: SNL Financial; Insurance Information Institute.
The NAIC’s Securities Valuation Office puts bonds into one of 6 classes: class 1 has the lowest expected impairments; successively higher
numbered classes imply increasing impairment likelihood.

40
Strength Through Underwriting: Underwriting Profits Support
Claims Paying Capability When Investments Can’t
41
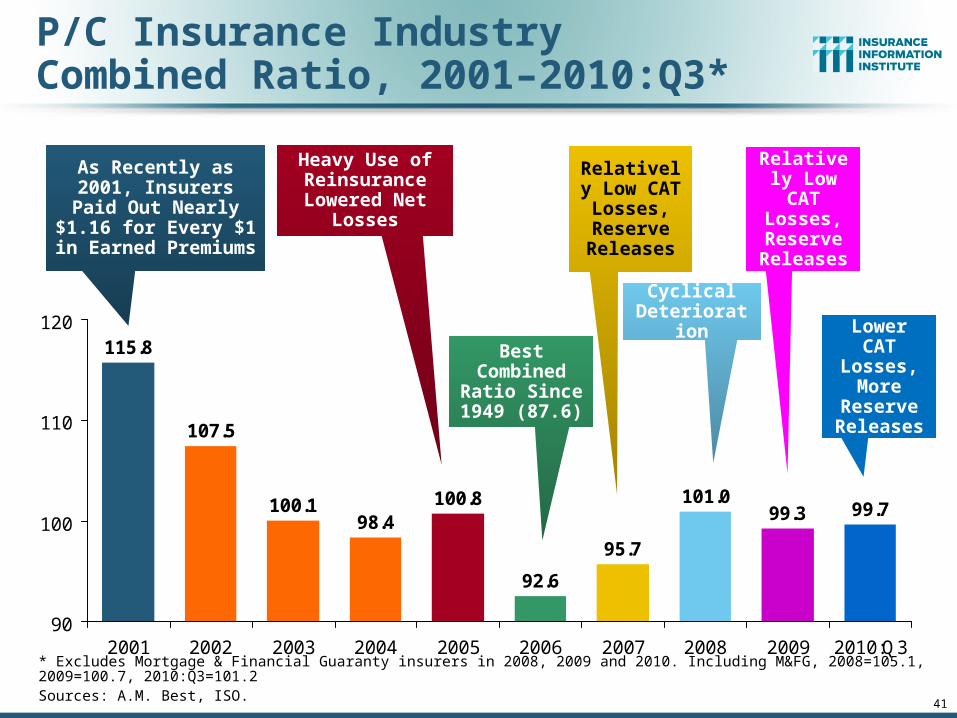
P/C Insurance Industry Combined Ratio, 2001–2010:Q3*
* Excludes Mortgage & Financial Guaranty insurers in 2008, 2009 and 2010. Including M&FG, 2008=105.1, 2009=100.7, 2010:Q3=101.2 Sources: A.M. Best, ISO.
95.7
99.3 99.7101.0
92.6
100.898.4
100.1
107.5
115.8
90
100
110
120
2001 2002 2003 2004 2005 2006 2007 2008 2009 2010:Q3
Best Combined
Ratio Since 1949 (87.6)
As Recently as 2001, Insurers Paid Out
Nearly $1.16 for Every $1 in Earned
Premiums
Relatively Low CAT Losses, Reserve Releases
Cyclical Deterioration
Heavy Use of Reinsurance Lowered Net
Losses
Relatively Low CAT Losses, Reserve Releases
Lower CAT
Losses, More
Reserve Releases

Underwriting Gain (Loss)1975–2010:Q3*
* Includes mortgage and financial guarantee insurers.Sources: A.M. Best, ISO; Insurance Information Institute.
Large Underwriting Losses Are NOT Sustainable in Current Investment Environment
-$55
-$45
-$35
-$25
-$15
-$5
$5
$15
$25
$35
75 77 79 81 83 85 87 89 91 93 95 97 99 01 03 05 07 09
The industry recorded a $6.2B underwriting
loss in 2010:Q3 compared to $3.2B in
2009:Q3
Cumulative underwriting deficit from 1975 through
2009 is $445B
($ Billions)

43
Number of Years with Underwriting Profits by Decade, 1920s–2000s
0 0
3
54
8
10
76
0
2
4
6
8
10
12
1920s 1930s 1940s 1950s 1960s 1970s 1980s 1990s 2000s*
* 2000 through 2009. 2009 combined ratio excluding mortgage and financial guaranty insurers was 99.3, which would bring the 2000s total to 4 years with an underwriting profit.Note: Data for 1920–1934 based on stock companies only.Sources: Insurance Information Institute research from A.M. Best Data.
Number of Years with Underwriting Profits
Underwriting Profits Were Common Before the 1980s (40 of the 60 Years Before 1980 Had Combined Ratios Below 100) –
But Then They Vanished. Not a Single Underwriting Profit Was Recorded in the 25 Years from 1979 Through 2003

45
Calendar Year Combined Ratios by Segment: 2008-2011F
Sources: A.M. Best . Insurance Information Institute.
102.4
98.9100
106
99.5
108
103.8104.5
9092949698
100102104106108110
Personal Lines Commercial Lines
2008 2009 2010P 2011F
Overall deterioration in 2011 underwriting performance is due to expected return to normal catastrophe activity along with deteriorating underwriting
performance related to the prolonged commercial soft market
Personal lines combined ratio is expected to remain stable in 2010 while commercial lines and reinsurance deteriorate

Legal Liability & Tort Environment Can Stress
Claims Paying Ability
46
Tort Trends Have a Major Impact on the Price/Availability of Insurance
47
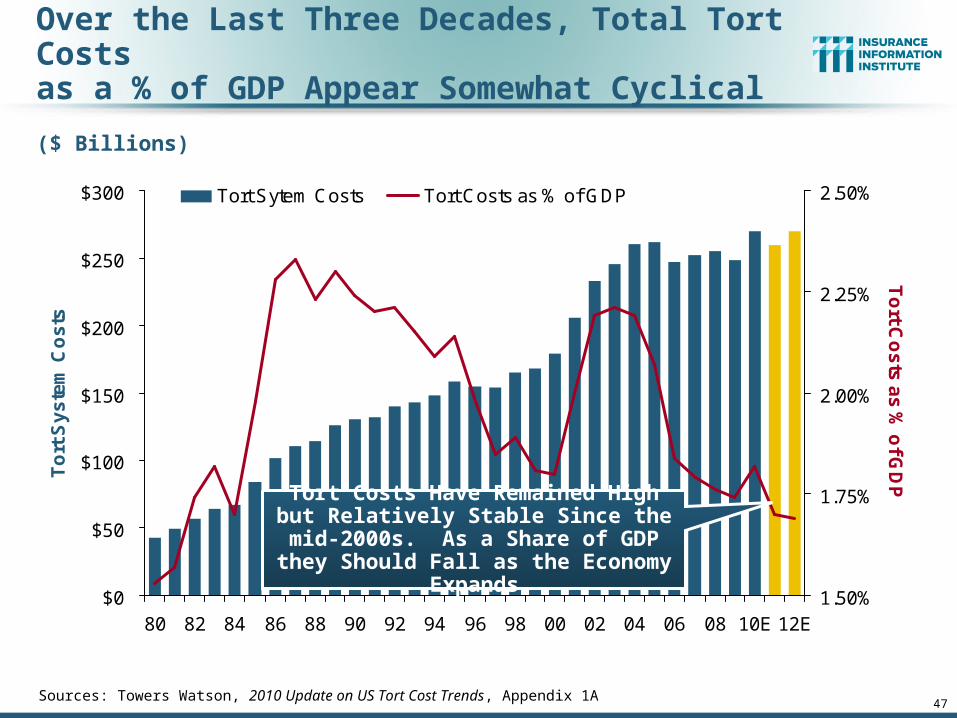
Over the Last Three Decades, Total Tort Costs as a % of GDP Appear Somewhat Cyclical
$0
$50
$100
$150
$200
$250
$300
80 82 84 86 88 90 92 94 96 98 00 02 04 06 08 10E 12E
To
rt S
ys
tem
Co
sts
1.50%
1.75%
2.00%
2.25%
2.50%
To
rt Co
sts
as
% o
f GD
P
Tort Sytem Costs Tort Costs as % of GDP
($ Billions)
Sources: Towers Watson, 2010 Update on US Tort Cost Trends, Appendix 1A
Tort Costs Have Remained High but Relatively Stable Since the mid-2000s. As a Share of GDP they Should Fall as
the Economy Expands

Cost of US Tort System ($ Billions)$1
29
$130 $1
41
$144
$148 $1
59
$156
$156 $1
67
$169 $1
80 $205 $2
33 $246 $2
60
$261
$247
$252
$255
$248 $2
70
$259 $2
70
$0
$50
$100
$150
$200
$250
$300
90 92 94 96 98 00 02 04 06 08
10E
12E
* Restated in 2009 dollars, based on CPI.Source: Towers Watson, 2010 Update on US Tort Cost Trends.
Per capita “tort tax” was $808 in 2009, up from $793 in 2000*
Tort costs consumed 1.74% of GDP in 2009, down from 2.21% in 2003
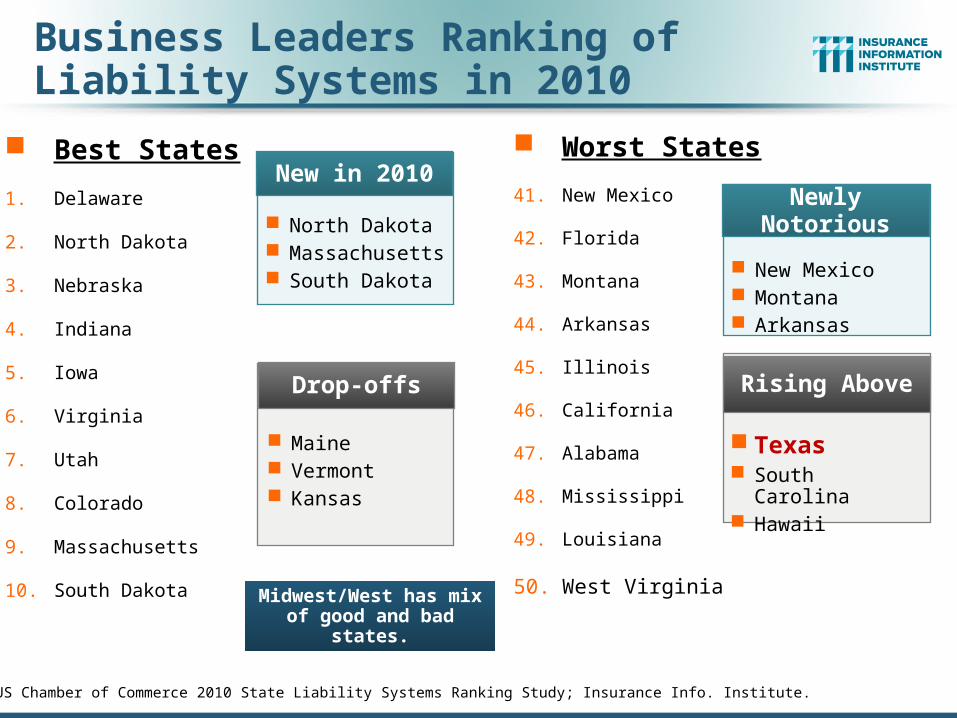
Business Leaders Ranking of Liability Systems in 2010
Best States
1. Delaware
2. North Dakota
3. Nebraska
4. Indiana
5. Iowa
6. Virginia
7. Utah
8. Colorado
9. Massachusetts
10. South Dakota
Worst States
41. New Mexico
42. Florida
43. Montana
44. Arkansas
45. Illinois
46. California
47. Alabama
48. Mississippi
49. Louisiana
50. West Virginia
Source: US Chamber of Commerce 2010 State Liability Systems Ranking Study; Insurance Info. Institute.
New in 2010
North Dakota Massachusetts South Dakota
Drop-offs
Maine Vermont Kansas
Newly Notorious
New Mexico Montana Arkansas
Rising Above
Texas South Carolina Hawaii
Midwest/West has mix of good and bad states.
50
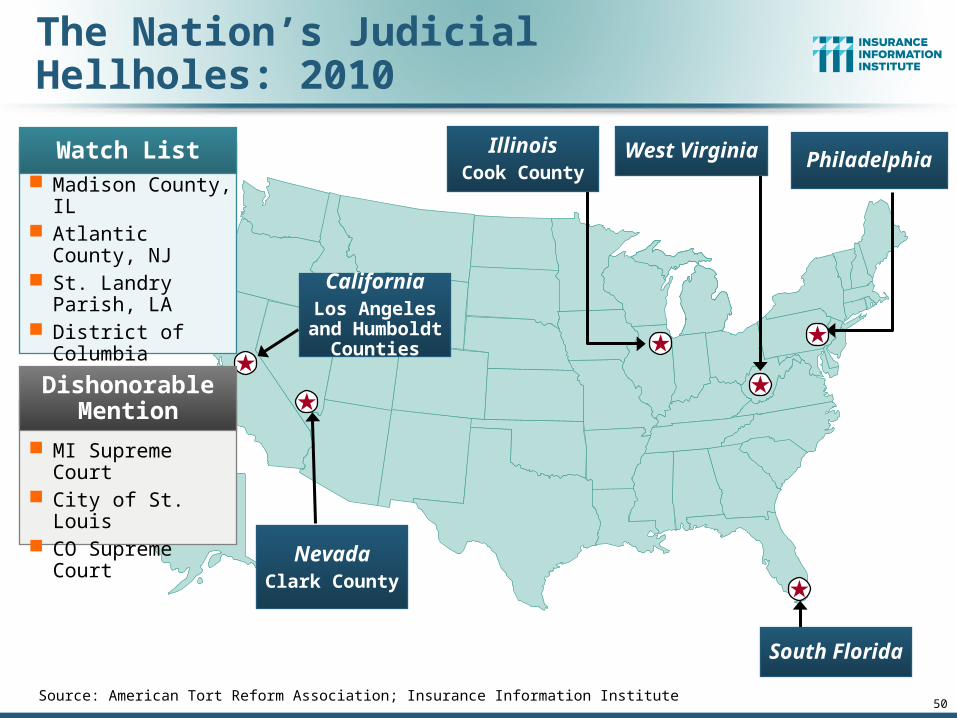
The Nation’s Judicial Hellholes: 2010
Source: American Tort Reform Association; Insurance Information Institute
South Florida
West VirginiaIllinoisCook County
NevadaClark County
Watch List Madison County, IL Atlantic County, NJ St. Landry Parish,
LA District of Columbia NYC & Albany, NY St. Clair County, IL
Dishonorable Mention
MI Supreme Court City of St. Louis CO Supreme Court
CaliforniaLos Angeles
and Humboldt Counties
Philadelphia

Excess Liability Market CapacityNorth America ($ Billions)
Source: Marsh, 2008 Limits of Liability Report
$2
.01
5
$1
.66
0
$1
.64
5
$1
.57
0
$1
.53
5
$1
.42
5
$1
.57
5
$1
.71
0
$2
.04
5
$1
.94
1
$2
.01
1
$1
.72
1
$1
.40
5
$1
.33
4
$1
.43
2
$0.0
$0.5
$1.0
$1.5
$2.0
$2.5
$3.0
Claims Paying Ability and the Economy
52
Insurers Must Have the Ability to Pay Claims Even in Times of Economic
Turmoil and Panic

53
US Real GDP Growth*
* Estimates/Forecasts from Blue Chip Economic Indicators.Source: US Department of Commerce, Blue Economic Indicators 1/11; Insurance Information Institute.
2.7
%
0.9
%
3.2
%
2.3
%
2.9
%
-0.7
%
0.6
%
-4.0
%
-6.8
% -4.9
%
-0.7
%
1.6
%
5.0
%
3.7
%
1.7
%
2.6
%
3.2
%
3.2
%
3.3
%
3.3
%
3.5
%
3.1
%
3.2
%
3.2
%3
.3%
4.1
%
1.1
%
1.8
%
2.5
% 3.6
%
3.1
%
-8%
-6%
-4%
-2%
0%
2%
4%
6%
2
00
0
2
00
1
2
00
2
2
00
3
2
00
4
2
00
5
2
00
6
07
:1Q
07
:2Q
07
:3Q
07
:4Q
08
:1Q
08
:2Q
08
:3Q
08
:4Q
09
:1Q
09
:2Q
09
:3Q
09
:4Q
10
:1Q
10
:2Q
10
:3Q
10
:4Q
11
:1Q
11
:2Q
11
:3Q
11
:4Q
12
:1Q
12
:2Q
12
:3Q
12
:4Q
Demand for Insurance Continues To Be Impacted by Sluggish Economic Conditions, but the Benefits of Even Slow Growth Will Compound and
Gradually Benefit the Economy Broadly
Real GDP Growth (%)
Recession began in Dec. 2007. Economic toll of credit
crunch, housing slump, labor market contraction has
been severe but modest recovery is underway
The Q4:2008 decline was the steepest since the Q1:1982 drop of 6.8%
Economic growth projections for 2011 have been revised
upward. This is a major positive for insurance demand
and exposure growth.
54
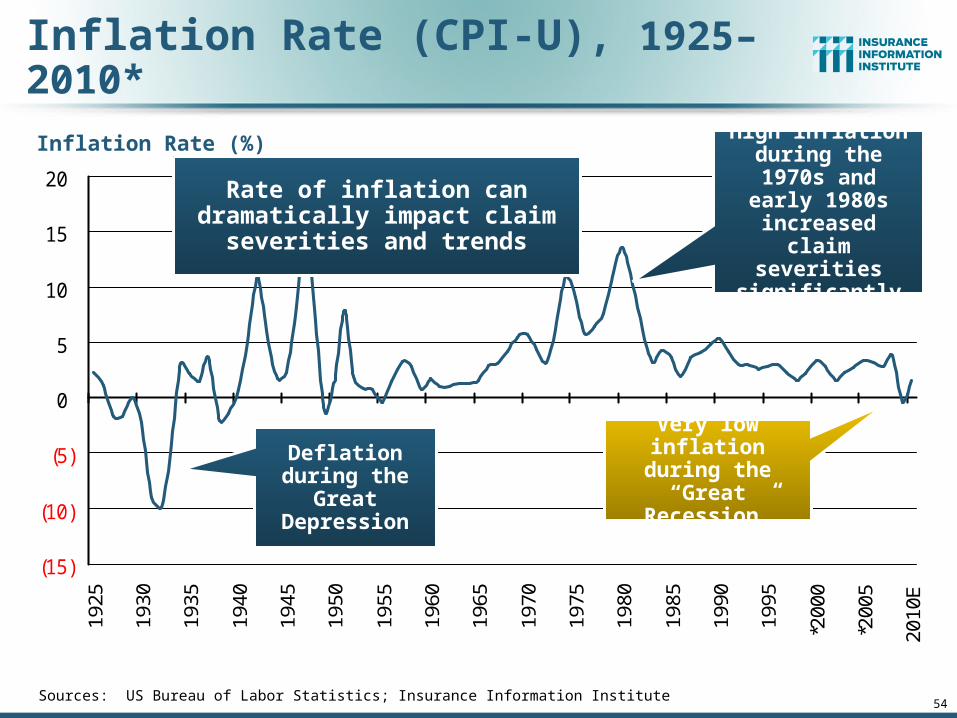
Inflation Rate (CPI-U), 1925–2010*
Sources: US Bureau of Labor Statistics; Insurance Information Institute
(15)
(10)
(5)
0
5
10
15
20
1925
1930
1935
1940
1945
1950
1955
1960
1965
1970
1975
1980
1985
1990
1995
*200
0
*200
5
2010
E
Rate of inflation can dramatically impact claim severities and
trends
Deflation during the Great
Depression
Very low inflation during the “Great
Recession”
Inflation Rate (%) High inflation during the 1970s and early 1980s increased claim
severities significantly
55
Capital/Capacity Are Not Enough
Risk Management Matters

56
Frequency: 1926–2008A Long-Term Drift Downward
Note: Recessions indicated by gray bars.Sources: NCCI from US Bureau of Labor Statistics; National Bureau of Economic Research
Manufacturing – Total Recordable CasesRate of Injury and Illness Cases per 100 Full-Time Workers
0
5
10
15
20
25
30
'26 '29 '32 '35 '39 '42 '45 '48 '52 '55 '58 '61 '65 '68 '71 '74 '78 '81 '84 '87 '91 '94 '97 '00 '04 '07

57
Examples Where Attention Risk Management Reduces Claims
Workplace Safety
Automobile and Highway Safety
Aviation
Marine
Health & Environmental Safety
Food Safety
Medicine
Energy
Corporate Governance (D&O)
58
Catastrophic Loss –Catastrophe Losses Trends Are
Trending Adversely

59
$8
.3
$7
.4
$2
.6 $1
0.1
$8
.3
$4
.6
$2
6.5
$5
.9 $1
2.9 $
27
.5
$6
1.9
$9
.2
$6
.7
$2
7.1
$1
0.6
$1
3.6
$1
00
.0
$7
.5
$2
.7
$4
.7
$2
2.9
$5
.5 $1
6.9
$0
$20
$40
$60
$80
$100
$120
89 90 91 92 93 94 95 96 97 98 99 00 01 02 03 04 05 06 07 08 09 10*20??
US Insured Catastrophe Losses
*Estimate from Munich Re.Note: 2001 figure includes $20.3B for 9/11 losses reported through 12/31/01. Includes only business and personal property claims, business interruption and auto claims. Non-prop/BI losses = $12.2B.Sources: Property Claims Service/ISO; Munich Re; Insurance Information Institute.
2010 CAT Losses Were Close to “Average” Figures Do Not Include an Estimate of Deepwater Horizon Loss
$100 Billion CAT Year is Coming Eventually
First Half 2010 CAT
Losses Were Down 19% or $1.4B from
first half 2009
($ Billions)
2000s: A Decade of Disaster
2000s: $193B (up 117%)
1990s: $89B

60
Combined Ratio Points Associated with Catastrophe Losses: 1960 – 2010E
Notes: Private carrier losses only. Excludes loss adjustment expenses and reinsurance reinstatement premiums. Figures are adjusted for losses ultimately paid by foreign insurers and reinsurers.Source: ISO; Insurance Information Institute estimate for 2010.
0.4
1.2
0.4 0.
8 1.3
0.3 0.4 0.
71.
51.
00.
40.
4 0.7
1.8
1.1
0.6
1.4 2.
01.
3 2.0
0.5
0.5 0.7
3.0
1.2
2.1
8.8
2.3
5.9
3.3
2.8
1.0
3.6
2.9
1.6
5.4
1.6
3.3
3.3
8.1
2.7
1.6
5.0
2.6 3.
33.6
0.9
0.1
1.1
1.1
0.8
0
1
2
3
4
5
6
7
8
9
10
1960
1962
1964
1966
1968
1970
1972
1974
1976
1978
1980
1982
1984
1986
1988
1990
1992
1994
1996
1998
2000
2002
2004
2006
2008
2010
E
The Catastrophe Loss Component of Private Insurer Losses Has Increased Sharply in Recent Decades
Avg. CAT Loss Component of the Combined Ratio
by Decade
1960s: 1.04 1970s: 0.85 1980s: 1.31 1990s: 3.39
2000s: 3.52
Combined Ratio Points

Nu
mb
er
Geophysical (earthquake, tsunami, volcanic activity)
Climatological (temperature extremes, drought, wildfire)
Meteorological (storm)
Hydrological (flood, mass movement)
Natural Disasters in the United States, 1980 – 2010Number of Events (Annual Totals 1980 – 2010)
Source: MR NatCatSERVICE 61
There were a record 247 natural disaster events in
the US in 2010

Sources: MR NatCatSERVICE
Significant Natural Catastrophes, 1950 – 2010
Number of Events ($1 billion economic loss and/or 50 fatalities)
65
There were 5 significant natural catastrophes in the
US in 2010
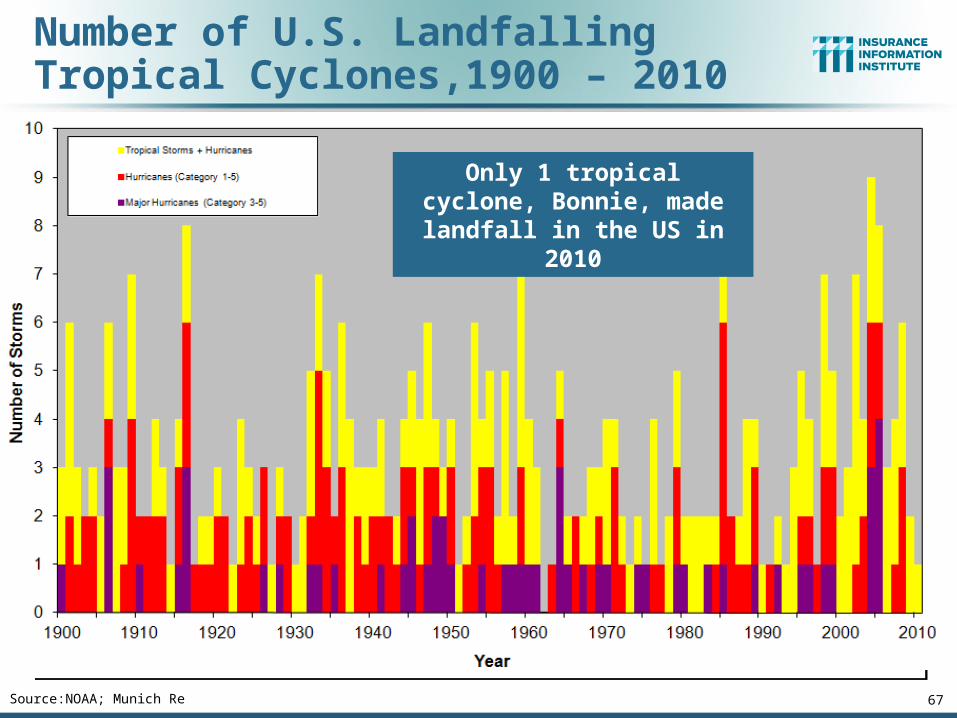
Number of U.S. Landfalling Tropical Cyclones,1900 – 2010
Source:NOAA; Munich Re 67
Only 1 tropical cyclone, Bonnie, made landfall in the
US in 2010
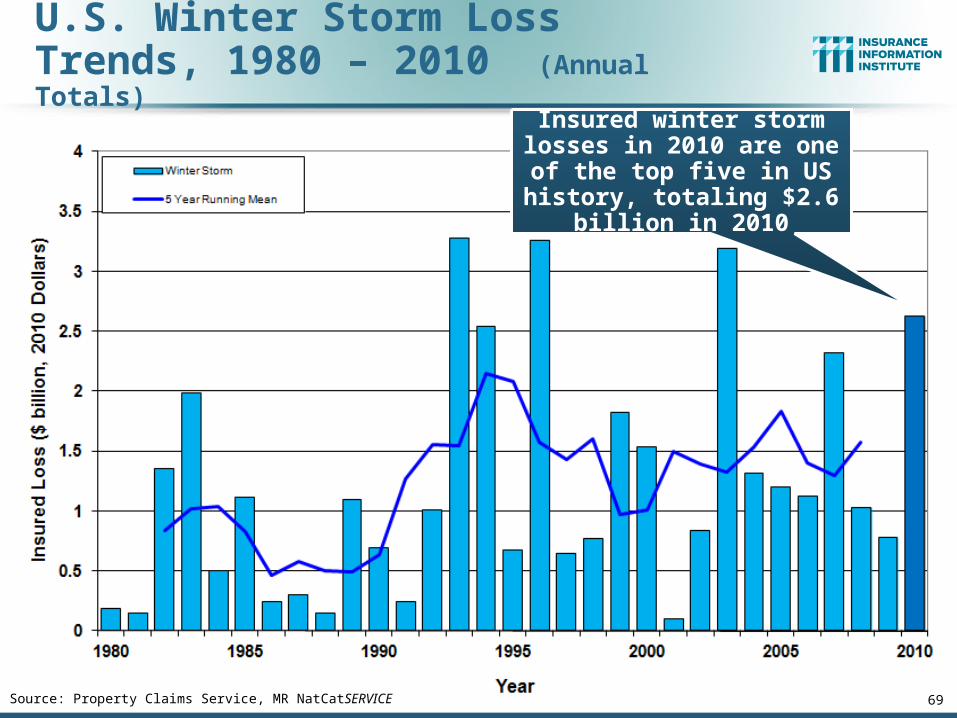
Source: Property Claims Service, MR NatCatSERVICE
U.S. Winter Storm Loss Trends, 1980 – 2010 (Annual Totals)
69
Insured winter storm losses in 2010 are one of the top five in US history, totaling
$2.6 billion in 2010

U.S. Thunderstorm Loss Trends, 1980 – 2010 (Annual Totals)
Source: Property Claims Service, MR NatCatSERVICE 70
Thunderstorm losses in 2010 totaled $9.5 billion, the
3rd highest ever
Average thunderstorm losses have now quintupled since
the early 1980s
Hurricanes get all the headlines, but thunderstorms are consistent
producers of large scale loss

73
Top 12 Most Costly Disastersin US History
(Insured Losses, 2009, $ Billions)
Sources: PCS; Insurance Information Institute inflation adjustments.
$11.3 $12.6$17.2
$22.2 $22.7
$45.1
$8.5$8.1$6.6$6.2$5.2$4.2
$0$5
$10$15$20$25$30$35$40$45$50
Jeanne(2004)
Frances(2004)
Rita (2005)
Hugo(1989)
Ivan (2004)
Charley(2004)
Wilma(2005)
Ike (2008)
Northridge(1994)
Andrew(1992)
9/11Attacks(2001)
Katrina(2005)
8 of the 12 Most Expensive Disasters in US History Have Occurred Since 2004;
8 of the Top 12 Disasters Affected FL
Hurricane Katrina Remains, By Far, the Most Expensive Insurance Event in US
and World History

Share of Losses Paid by Reinsurers for Major Catastrophic Events
30%25%
60%
20%
45%
33%
0%
10%
20%
30%
40%
50%
60%
70%
HurricaneHugo (1989)
HurricaneAndrew (1992)
Sept. 11Terrorist
Attack (2001)
2004Hurricane
Season
2005Hurricane
Season
2008 TexasHurricane
Source: Wharton Risk Center, Disaster Insurance Project, Renaissance Re, Insurance Information Institute.
Reinsurance plays a very large role in claims payouts
associated with major catastrophes

75
Total Value of Insured Coastal Exposure
(2007, $ Billions)
Source: AIR Worldwide
$224.4$191.9
$158.8$146.9$132.8
$92.5$85.6$60.6$55.7$51.8$54.1
$14.9
$479.9$635.5
$772.8$895.1
$2,378.9$2,458.6
$0 $500 $1,000 $1,500 $2,000 $2,500 $3,000
FloridaNew York
TexasMassachusetts
New JerseyConnecticut
LouisianaS. Carolina
VirginiaMaine
North CarolinaAlabamaGeorgia
DelawareNew Hampshire
MississippiRhode Island
Maryland
$895B Insured Coastal
Exposure in Texas in 2007
In 2007, Florida Still Ranked as the #1 Most Exposed State to Hurricane Loss, with
$2.459 Trillion Exposure, but Texas is very exposed too, and ranked #3 with $895B
in insured coastal exposure
The Insured Value of All Coastal Property Was $8.9 Trillion in 2007, Up 24% from $7.2 Trillion in 2004

76
US Residual Market Exposure to Loss
$372.3$430.5 $419.5
$656.7
$771.9
$696.4
$292.0$244.2$221.3
$281.8
$150.0
$54.7
$0
$100
$200
$300
$400
$500
$600
$700
$800
$900
1990 1995 1999 2000 2001 2002 2003 2004 2005 2006 2007 2008
Source: PIPSO; Insurance Information Institute
Hurricane Andrew
4 Florida Hurricanes
Katrina, Rita, and Wilma
In the 19-year Period Between 1990 and 2008, Total Exposure to Loss in the Residual Market (FAIR & Beach/Windstorm) Plans Has Surged from
$54.7B in 1990 to $696.4B in 2008
($ Billions)

77
Global Catastrophe Loss Trends
Claims Paying Capacity Will Need to Increase in the Future if Current
Disaster Trends Continue

2010 2009
Average of the last 10
years2000-2009
Average of the last 30
years1980-2009
Number of events 950 900 785 615
Overall losses (US$m)
130,000 60,000 110,000 95,000
Insured losses (US$m)
37,000 22,000 35,000 23,000
Fatalities 295,000 11,000 77,000 66,000
Natural Catastrophes, 2010Overview and comparison with previous years
Source: Geo Risks Research, NatCatSERVICE 78
The number and cost of natural catastrophes on a global scale was far above
average in 2010
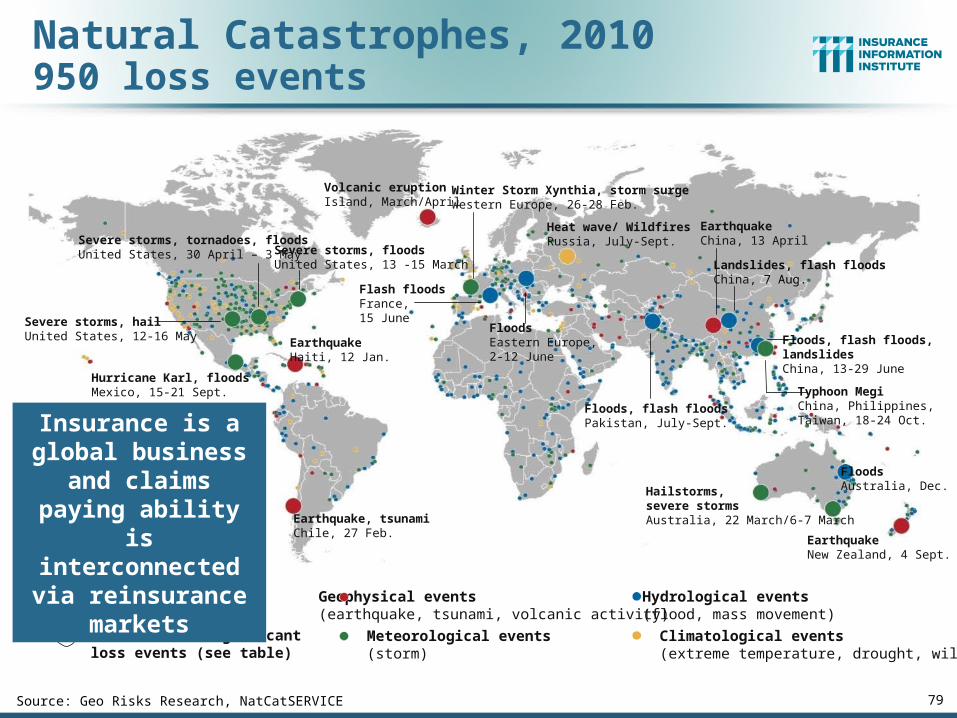
Geophysical events(earthquake, tsunami, volcanic activity)
Meteorological events (storm)
Hydrological events(flood, mass movement)
Climatological events(extreme temperature, drought, wildfire)
Selection of significant loss events (see table)
Natural catastrophes
Volcanic eruption Island, March/April
Heat wave/ WildfiresRussia, July-Sept.
Severe storms, floodsUnited States, 13 -15 March
EarthquakeHaiti, 12 Jan.
Hurricane Karl, floodsMexico, 15-21 Sept.
Earthquake, tsunamiChile, 27 Feb.
Winter Storm Xynthia, storm surgeWestern Europe, 26-28 Feb.
Flash floodsFrance, 15 June
Floods, flash floodsPakistan, July-Sept.
Earthquake China, 13 April
FloodsEastern Europe, 2-12 June
Floods, flash floods,landslidesChina, 13-29 June
Landslides, flash floodsChina, 7 Aug.
Hailstorms, severe stormsAustralia, 22 March/6-7 March
EarthquakeNew Zealand, 4 Sept.
Severe storms, hailUnited States, 12-16 May
Severe storms, tornadoes, floodsUnited States, 30 April – 3 May
Typhoon MegiChina, Philippines,Taiwan, 18-24 Oct.
FloodsAustralia, Dec.
Natural Catastrophes, 2010950 loss events
Source: Geo Risks Research, NatCatSERVICE 79
Insurance is a global business and claims paying ability
is interconnected via reinsurance
markets

41%
Natural Catastrophes, 2010Insured losses US$ 37bn - % distribution by continent
22%
15%
<1%
2%
20%
Source: Geo Risks Research, NatCatSERVICE 81
US accounts for the greatest share of
losses over the past 30 years, but more losses in the future
will originate in developing countries

66% 20%
9%
2%3%
<1%
Source: Geo Risks Research, NatCatSERVICE 82
Natural Catastrophes, 1980 - 2009
US accounts for the greatest share of
losses over the past 30 years, but more losses in the future
will originate in developing countries

Costliest Natural Catastrophes Since 1950Rank by insured losses - in values of 2010
Year Event Region Insured lossUS$m, 2010 values
2005 Hurricane Katrina USA 69,900
1992 Hurricane Andrew USA 26,500
1994 EQ Northridge USA 22,500
2008 Hurricane Ike USA, Caribbean 18,700
2004 Hurricane Ivan USA, Caribbean 16,000
2005 Hurricane Wilma USA, Mexico 14,000
2005 Hurricane Rita USA 13,500
1991 Typhoon Mireille Japan 11,200
2004 Hurricane Charley USA, Caribbean 9,250
1989 Hurricane Hugo USA, Caribeean 9,000
1990 Winter Storm Daria Europe 8,500
2010 Earthquake Chile 8,000
Source: Geo Risks Research, NatCatSERVICE 83© 2011 Munich Re

Natural Catastrophes Worldwide, 1980 – 2010 (Number of events with trend)
Number
Meteorological events(Storm)
Hydrological events(Flood, mass movement)
Climatological events(Extreme temperature, drought, forest fire)
Geophysical events(Earthquake, tsunami,
volcanic eruption)
200
400
600
800
1 000
1 200
1980 1982 1984 1986 1988 1990 1992 1994 1996 1998 2000 2002 2004 2006 2008 2010
Source: Geo Risks Research, NatCatSERVICE 84© 2011 Munich Re
Increased claims paying capacity will be required on
a global scale if current trends continue (as is
expected)
www.iii.org
Thank you for your timeand your attention!
Twitter: twitter.com/bob_hartwigDownload: www.iii.org/presentations
Insurance Information Institute Online: