Embed Size (px)
Citation preview
The Oregon Resilience Plan –Water and Wastewater Systems – February 2013 203
8. Water and Wastewater Systems
Introduction
Oregon’s water and wastewater systems are especially vulnerable to damage resulting from a Cascadia
subduction zone earthquake. Some of the inherent seismic vulnerabilities of water and wastewater
systems include:
The systems tend to be large and complex, consisting of a combination of pipeline networks
serving large areas and concentrated facilities (such as treatment plants and pump stations),
with numerous potential points of failure.
The systems are highly dependent on other resources—such as power, transportation,
chemicals, and skilled staff—to remain operational and to complete needed repairs.
The systems are financially dependent on consistent revenue streams to fund ongoing
operations, maintenance, and debt service obligations.
Essential facilities, such as intakes, treatment plants, pump stations, and outfalls, are often
located near rivers and lakes and are vulnerable to damage from liquefaction of alluvial soils.
Many critical facilities, such as reservoirs, pump stations, and treatment plants, were designed
and constructed before the adoption of seismic design standards that reflect the current state of
knowledge of regional seismicity.
Pipeline networks include extensive use of non-ductile (inflexible) materials, such as concrete
and cast-iron pipe, which tend to fail during strong ground motion.
Pipelines are especially vulnerable to failure from permanent ground deformation (resulting
from liquefaction and landslides), because the deformation causes push-on pipe joints to
separate.
Water and sewer pipelines tend to be prone to failure at connections to aboveground
structures, such as reservoirs, treatment plants, pump stations, and service connections to
homes.
Water from leaks and breaks in water pipelines and private plumbing systems will cause
collateral damage, drain available water storage, and contribute to loss of water supply and
pressure, which will in turn result in a loss of fire protection capability.
The performance of gravity sanitation and storm sewers depends on accurate grades and slopes,
which are disrupted by ground displacement resulting from liquefaction.
Failures of storm sewers can contribute to localized flooding during even minor rain events,
resulting in collateral damage.
The Oregon Resilience Plan –Water and Wastewater Systems – February 2013 204
THE EXISTING STATE
If it were to occur today, a Cascadia subduction zone earthquake would result in catastrophic impacts to
existing water and wastewater systems throughout western Oregon. The Oregon coast would most
likely experience strong ground shaking for over three minutes. Facilities within the tsunami inundation
zone would be extensively damaged; in many cases, these facilities would not be repairable. Facilities
outside of the tsunami zone would be heavily damaged, with total loss of water and wastewater services
for periods measured in months and, in some cases, years.
The Willamette Valley would experience moderate ground shaking. Well-engineered structures may
perform well, but many older structures would likely fail, including treatment facilities, reservoirs, and
pump stations. One of the major impacts to large population centers would be from liquefaction:
extensive alluvial and fill deposits along rivers would lose strength, lose bearing capacity, and move
towards riverbanks. Old cast iron water pipelines buried in the liquefied soil would snap, and modern
pipelines constructed of ductile iron and PVC would likely pull apart at joints, resulting in a total loss of
water pressure throughout communities. Large drainage structures along riverbanks in liquefiable areas
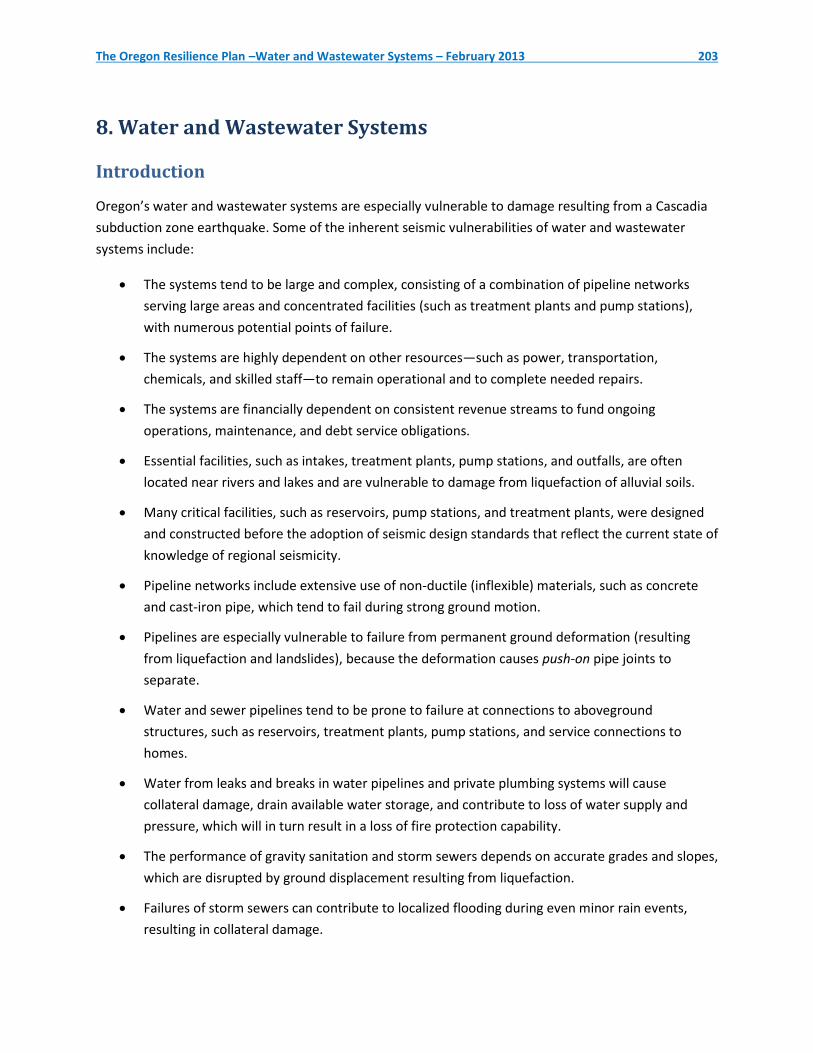
would likely move, severing connecting piping and rendering the structures useless. Examples of the
type of damage likely to occur are illustrated in Figures 8.1–8.7.
Figure 8.1: Tank piping separated, Northridge earthquake, California,
1994 (Source: Los Angeles Department of Water and Power)
The Oregon Resilience Plan –Water and Wastewater Systems – February 2013 205
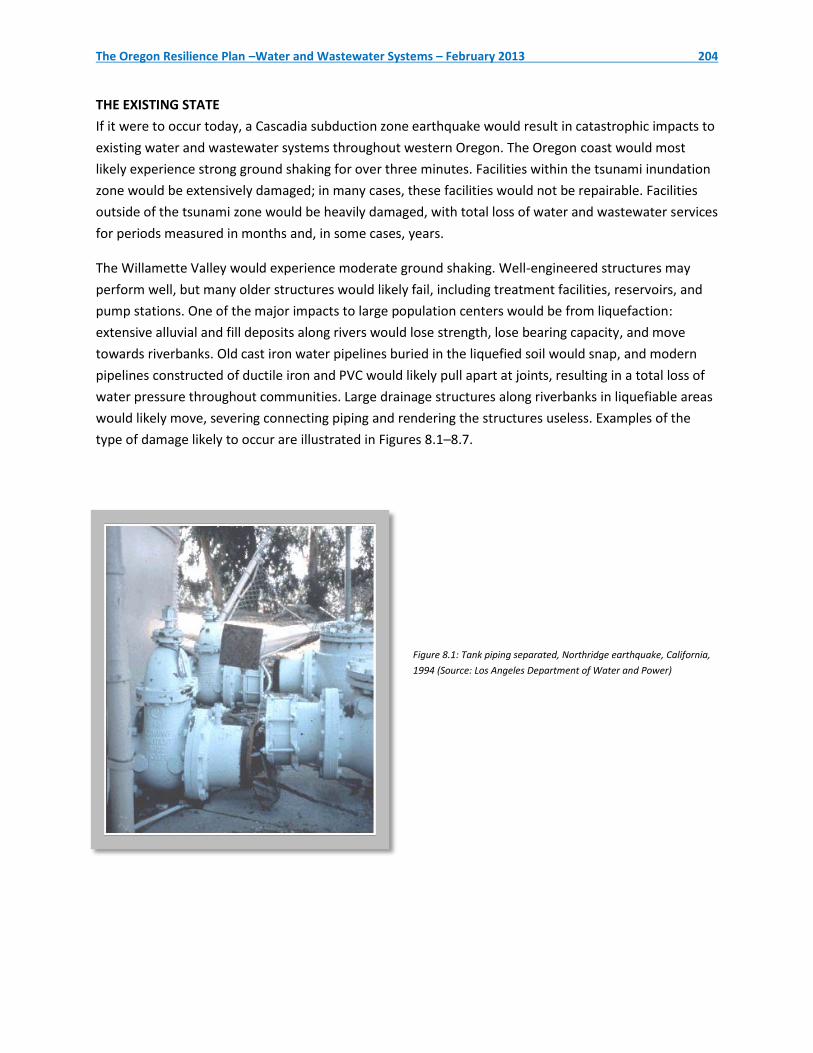
Figure 8.2: Tank
buckling, Northridge
earthquake, California,
1994 (Source: Photo by
Don Ballantyne)
Figure 8.3: Wire wrapped concrete tank burst in Purisima
Hills, Loma Prieta earthquake, California, 1989
(Source: Photo by Don Ballantyne)
Figure 8.4: Welded steel
pipe failed in compression,
San Fernando (Sylmar)
earthquake, California,
1971(Source: Photo
Source Unknown)
The Oregon Resilience Plan –Water and Wastewater Systems – February 2013 206
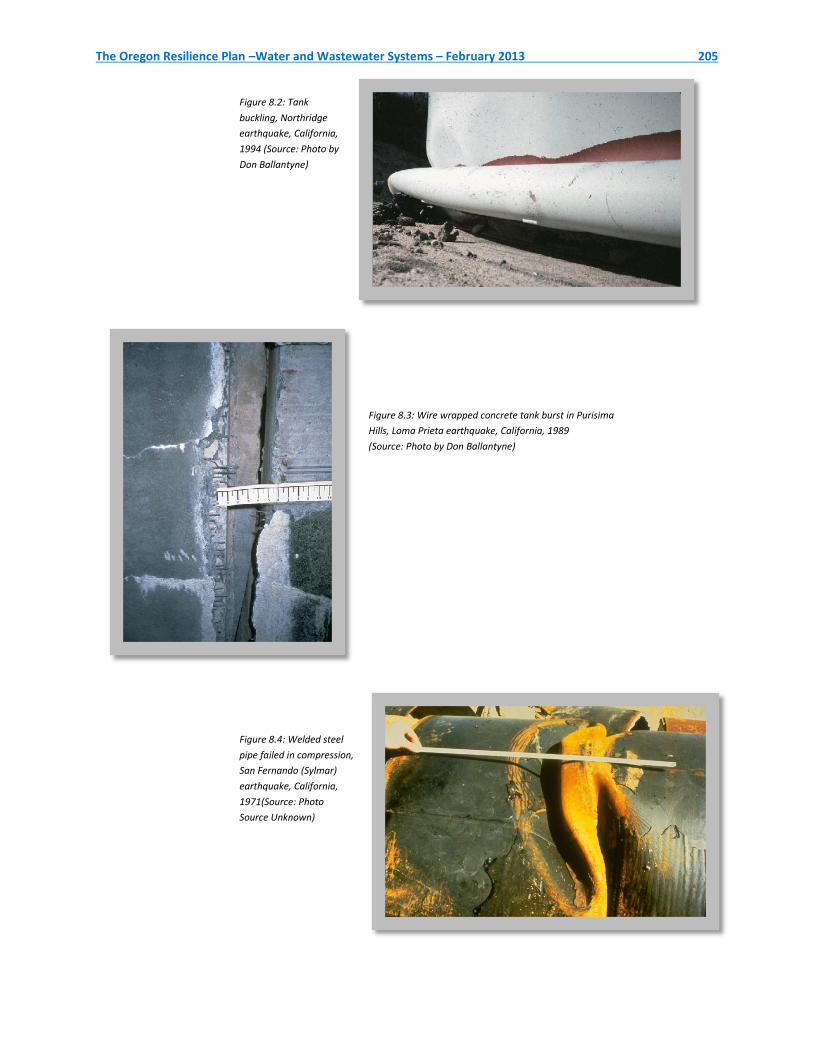
Figure 8.5: Pipelines separated, Great Hanshin
earthquake, Kobe, Japan,
1995 (Source: Kobe Water Department)
Figure 8.6: Water
well and treatment
facility in tsunami
inundation area,
Tohoku earthquake,
Japan, 2011 (Source:
Photo Source
Unknown)
Figure 8.7: Minami Gamou Wastewater Treatment Plant impacted by
tsunamis, Tohoku earthquake, Sendai, Japan, 2011 (Source: Photo by
Don Ballantyne)
The Oregon Resilience Plan –Water and Wastewater Systems – February 2013 207
Water for Fire Suppression
In the current state of readiness, existing water systems would experience extensive leaks and breaks in
water supply pipelines. These leaks, coupled with loss of water supply facilities, such as treatment plants
and pump stations, would drain the water systems. This loss of volume and pressure would critically
limit the availability of water supply for conventional urban firefighting: fire hydrants would be rendered
useless, and many fire sprinkler systems would be inoperable (even those sprinkler systems that remain
intact).
Urban and suburban firefighting strategies would resemble those commonly used in rural areas: water
for fire suppression would only be available from lakes, rivers, streams, swimming pools, and any
surviving local water storage reservoirs. Fire engines would draft from these sites and rely on tankers to
move water to fires. The combination of transportation infrastructure damage, compromised
emergency communications systems, and high emergency incident volumes, would limit the ability of
fire departments to respond to individual incidents. Fire departments would have to identify, assess,
and prioritize responses and would focus on life safety and containment rather than trying to extinguish
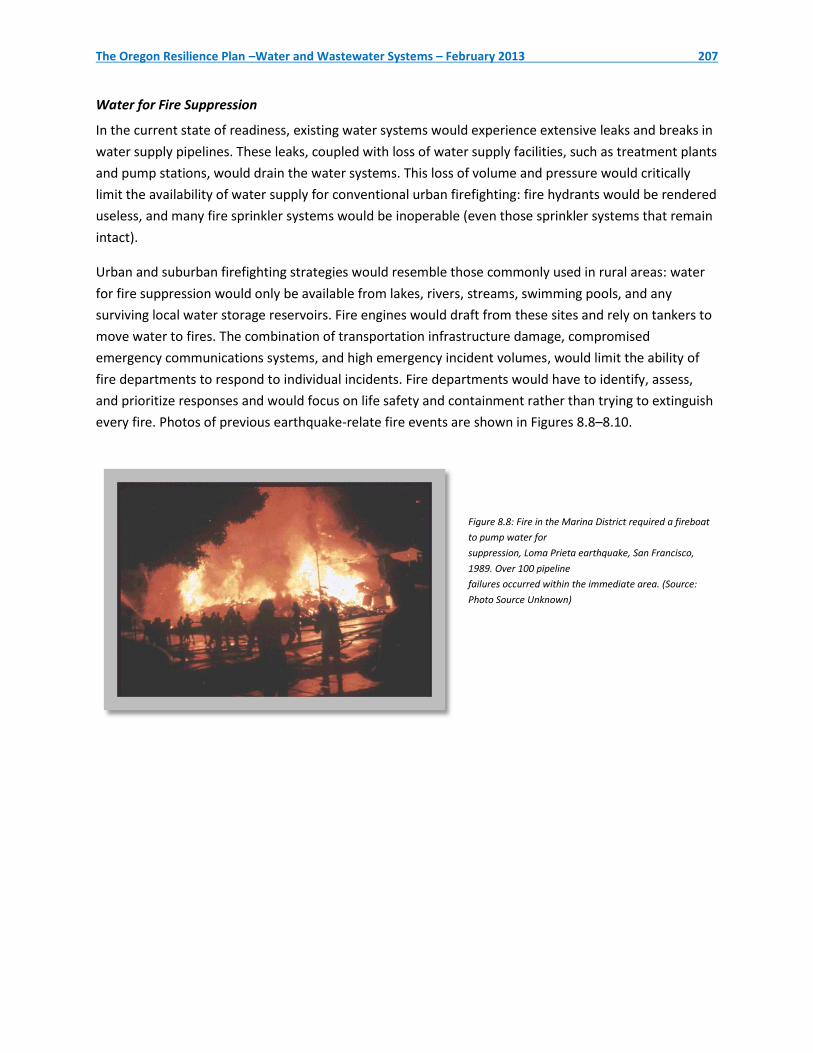
every fire. Photos of previous earthquake-relate fire events are shown in Figures 8.8–8.10.
Figure 8.8: Fire in the Marina District required a fireboat
to pump water for
suppression, Loma Prieta earthquake, San Francisco,
1989. Over 100 pipeline
failures occurred within the immediate area. (Source:
Photo Source Unknown)
The Oregon Resilience Plan –Water and Wastewater Systems – February 2013 208
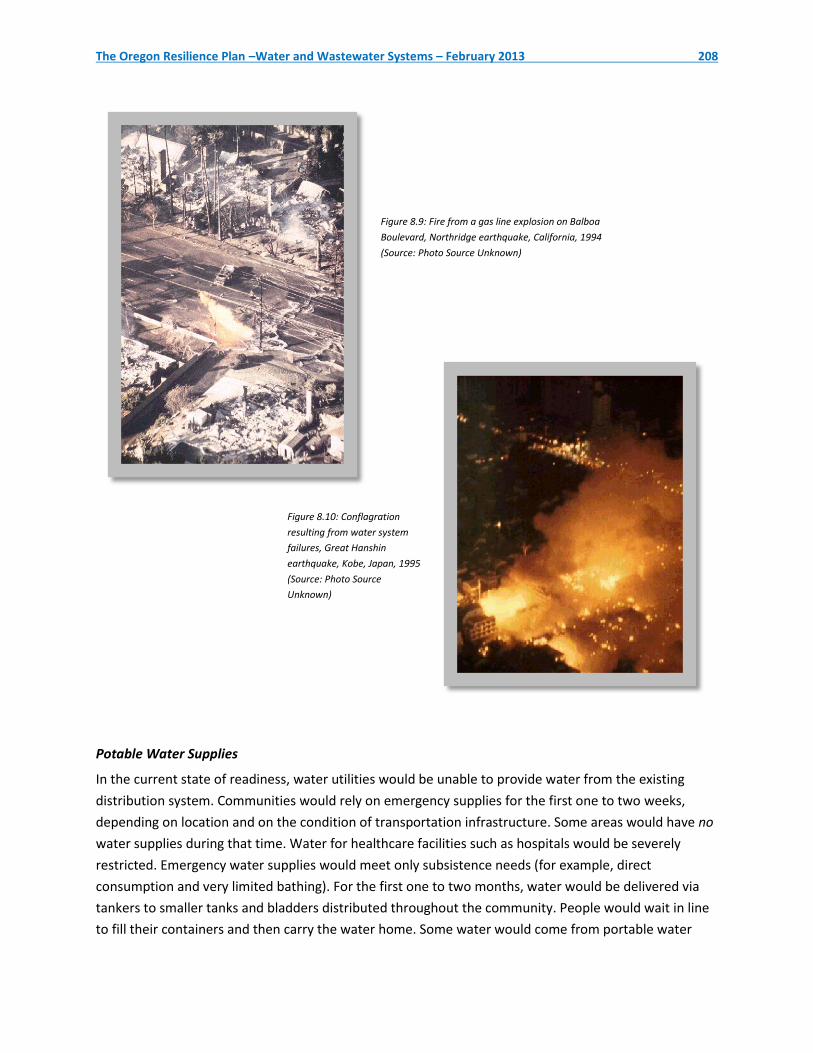
Figure 8.9: Fire from a gas line explosion on Balboa
Boulevard, Northridge earthquake, California, 1994
(Source: Photo Source Unknown)
Figure 8.10: Conflagration
resulting from water system
failures, Great Hanshin
earthquake, Kobe, Japan, 1995
(Source: Photo Source
Unknown)
Potable Water Supplies
In the current state of readiness, water utilities would be unable to provide water from the existing
distribution system. Communities would rely on emergency supplies for the first one to two weeks,
depending on location and on the condition of transportation infrastructure. Some areas would have no
water supplies during that time. Water for healthcare facilities such as hospitals would be severely
restricted. Emergency water supplies would meet only subsistence needs (for example, direct
consumption and very limited bathing). For the first one to two months, water would be delivered via
tankers to smaller tanks and bladders distributed throughout the community. People would wait in line
to fill their containers and then carry the water home. Some water would come from portable water
The Oregon Resilience Plan –Water and Wastewater Systems – February 2013 209
treatment units provided by the military, equipment suppliers, and foreign countries; however, the
quantity of water supplied from those resources would be small compared to demands. Photos of water
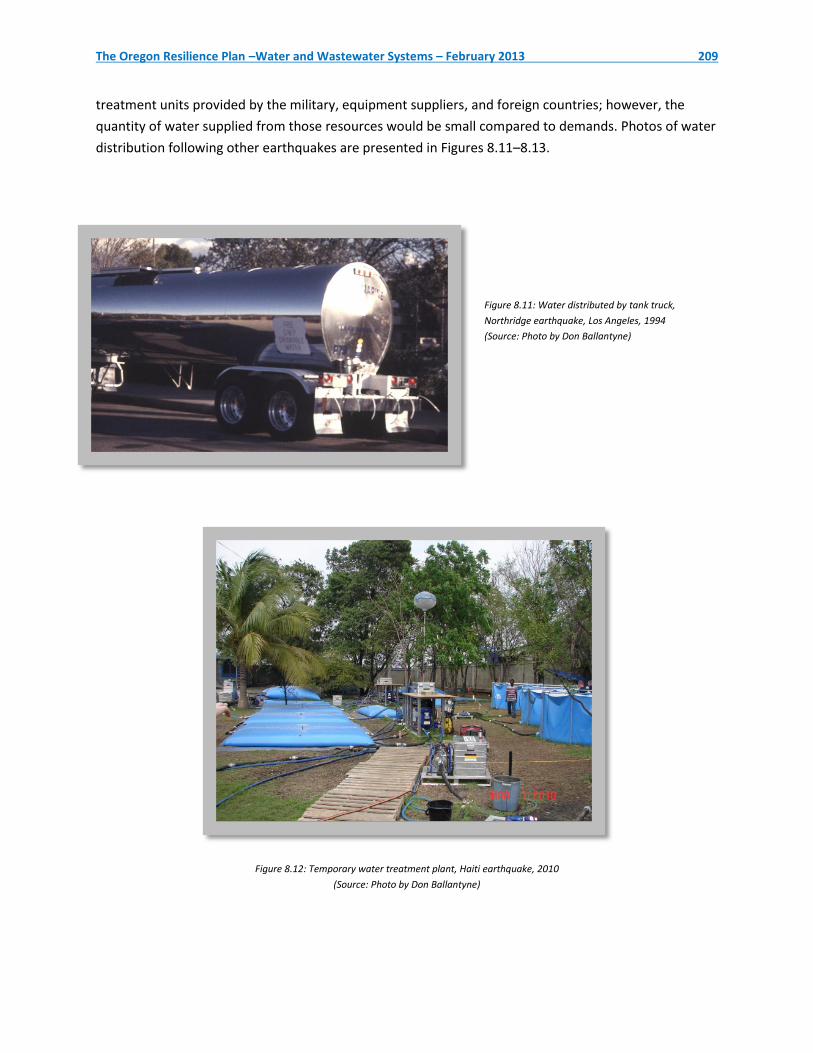
distribution following other earthquakes are presented in Figures 8.11–8.13.
Figure 8.11: Water distributed by tank truck,
Northridge earthquake, Los Angeles, 1994
(Source: Photo by Don Ballantyne)
Figure 8.12: Temporary water treatment plant, Haiti earthquake, 2010
(Source: Photo by Don Ballantyne)
The Oregon Resilience Plan –Water and Wastewater Systems – February 2013 210
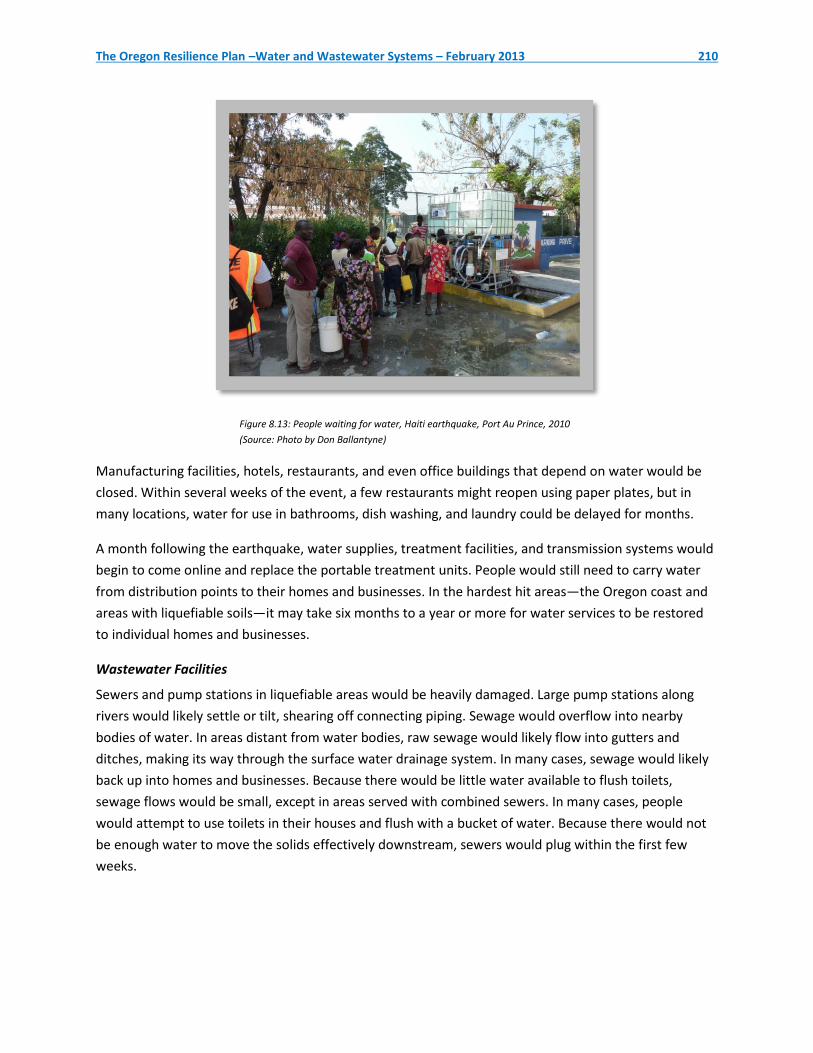
Figure 8.13: People waiting for water, Haiti earthquake, Port Au Prince, 2010
(Source: Photo by Don Ballantyne)
Manufacturing facilities, hotels, restaurants, and even office buildings that depend on water would be
closed. Within several weeks of the event, a few restaurants might reopen using paper plates, but in
many locations, water for use in bathrooms, dish washing, and laundry could be delayed for months.
A month following the earthquake, water supplies, treatment facilities, and transmission systems would
begin to come online and replace the portable treatment units. People would still need to carry water
from distribution points to their homes and businesses. In the hardest hit areas—the Oregon coast and
areas with liquefiable soils—it may take six months to a year or more for water services to be restored
to individual homes and businesses.
Wastewater Facilities
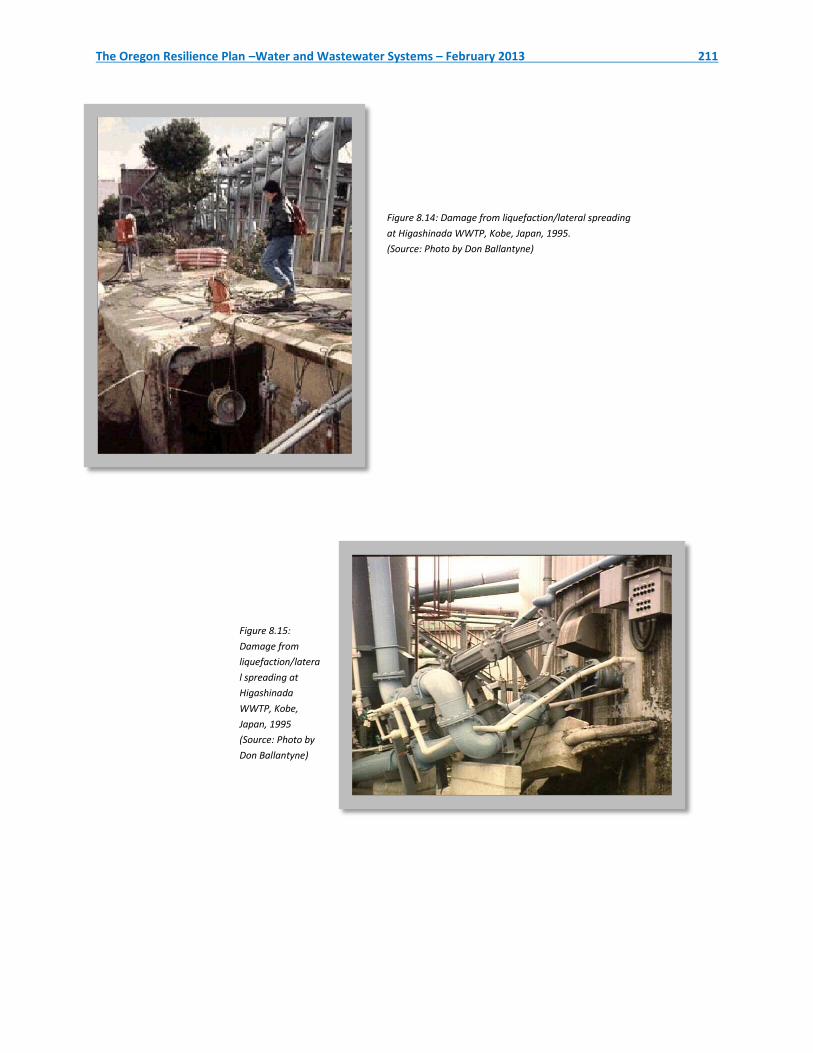
Sewers and pump stations in liquefiable areas would be heavily damaged. Large pump stations along
rivers would likely settle or tilt, shearing off connecting piping. Sewage would overflow into nearby
bodies of water. In areas distant from water bodies, raw sewage would likely flow into gutters and
ditches, making its way through the surface water drainage system. In many cases, sewage would likely
back up into homes and businesses. Because there would be little water available to flush toilets,
sewage flows would be small, except in areas served with combined sewers. In many cases, people
would attempt to use toilets in their houses and flush with a bucket of water. Because there would not
be enough water to move the solids effectively downstream, sewers would plug within the first few
weeks.
The Oregon Resilience Plan –Water and Wastewater Systems – February 2013 211
Figure 8.14: Damage from liquefaction/lateral spreading
at Higashinada WWTP, Kobe, Japan, 1995.
(Source: Photo by Don Ballantyne)
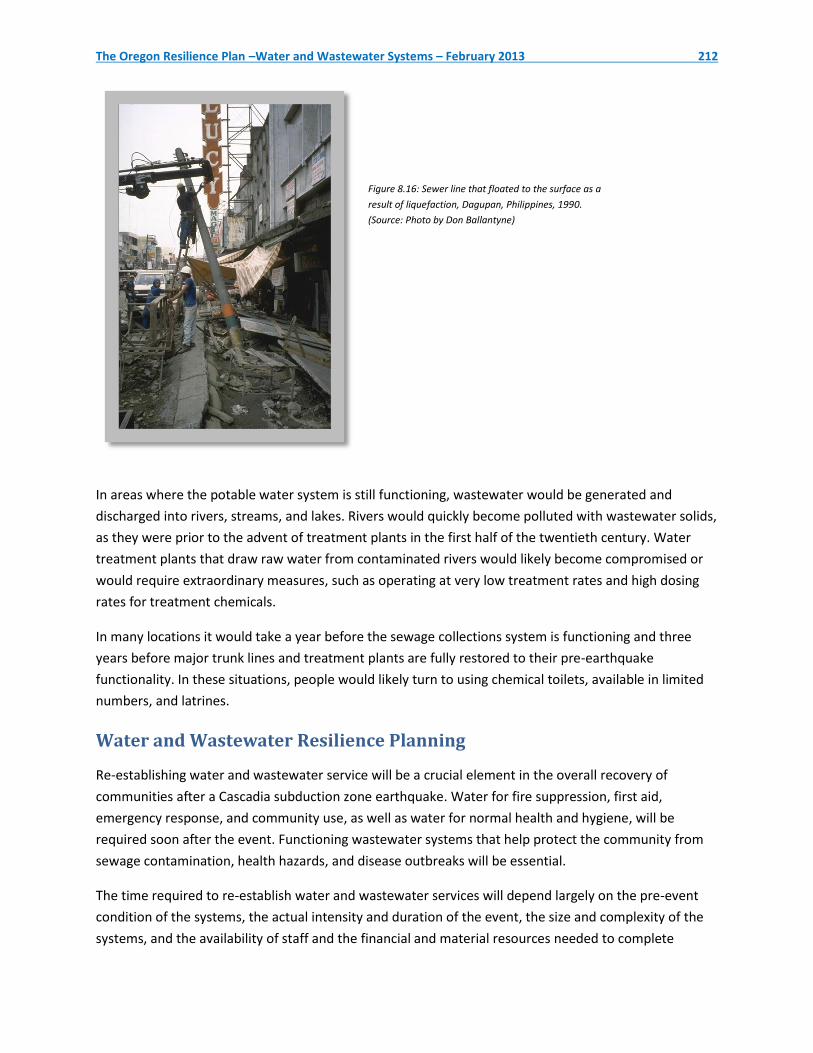
Figure 8.15:
Damage from
liquefaction/latera
l spreading at
Higashinada
WWTP, Kobe,
Japan, 1995
(Source: Photo by
Don Ballantyne)
The Oregon Resilience Plan –Water and Wastewater Systems – February 2013 212
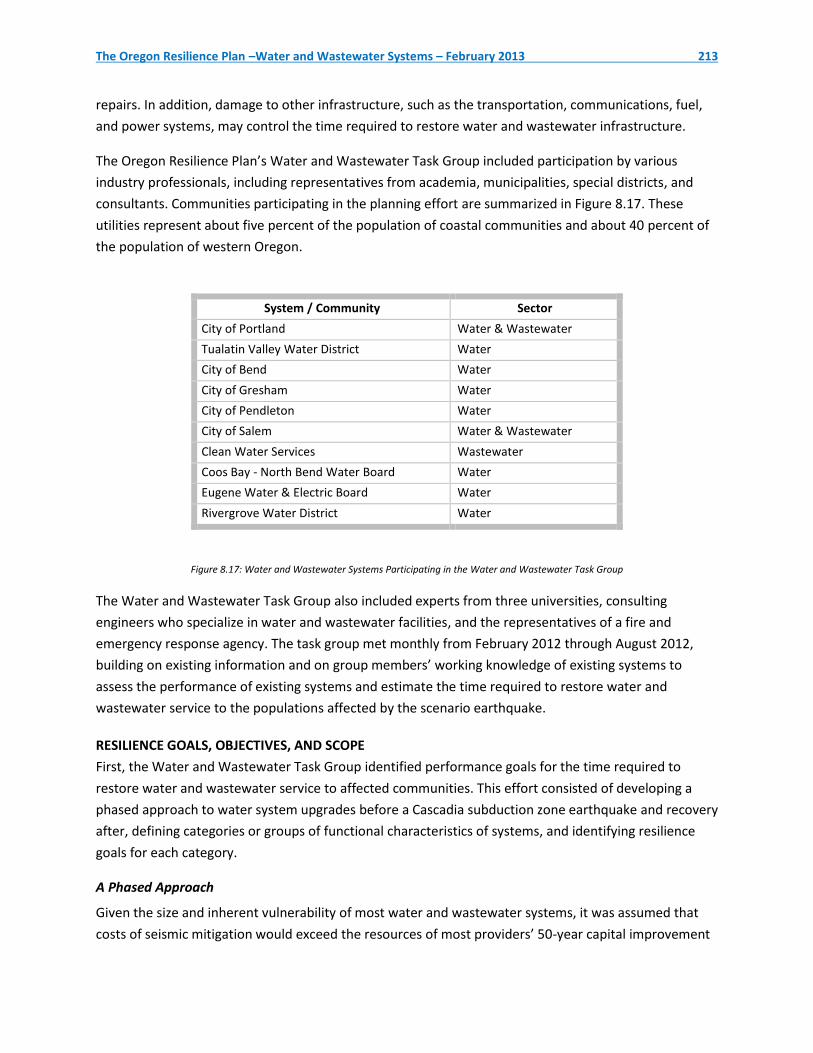
Figure 8.16: Sewer line that floated to the surface as a
result of liquefaction, Dagupan, Philippines, 1990.
(Source: Photo by Don Ballantyne)
In areas where the potable water system is still functioning, wastewater would be generated and
discharged into rivers, streams, and lakes. Rivers would quickly become polluted with wastewater solids,
as they were prior to the advent of treatment plants in the first half of the twentieth century. Water
treatment plants that draw raw water from contaminated rivers would likely become compromised or
would require extraordinary measures, such as operating at very low treatment rates and high dosing
rates for treatment chemicals.
In many locations it would take a year before the sewage collections system is functioning and three
years before major trunk lines and treatment plants are fully restored to their pre-earthquake
functionality. In these situations, people would likely turn to using chemical toilets, available in limited
numbers, and latrines.
Water and Wastewater Resilience Planning
Re-establishing water and wastewater service will be a crucial element in the overall recovery of
communities after a Cascadia subduction zone earthquake. Water for fire suppression, first aid,
emergency response, and community use, as well as water for normal health and hygiene, will be
required soon after the event. Functioning wastewater systems that help protect the community from
sewage contamination, health hazards, and disease outbreaks will be essential.
The time required to re-establish water and wastewater services will depend largely on the pre-event
condition of the systems, the actual intensity and duration of the event, the size and complexity of the
systems, and the availability of staff and the financial and material resources needed to complete
The Oregon Resilience Plan –Water and Wastewater Systems – February 2013 213
repairs. In addition, damage to other infrastructure, such as the transportation, communications, fuel,
and power systems, may control the time required to restore water and wastewater infrastructure.
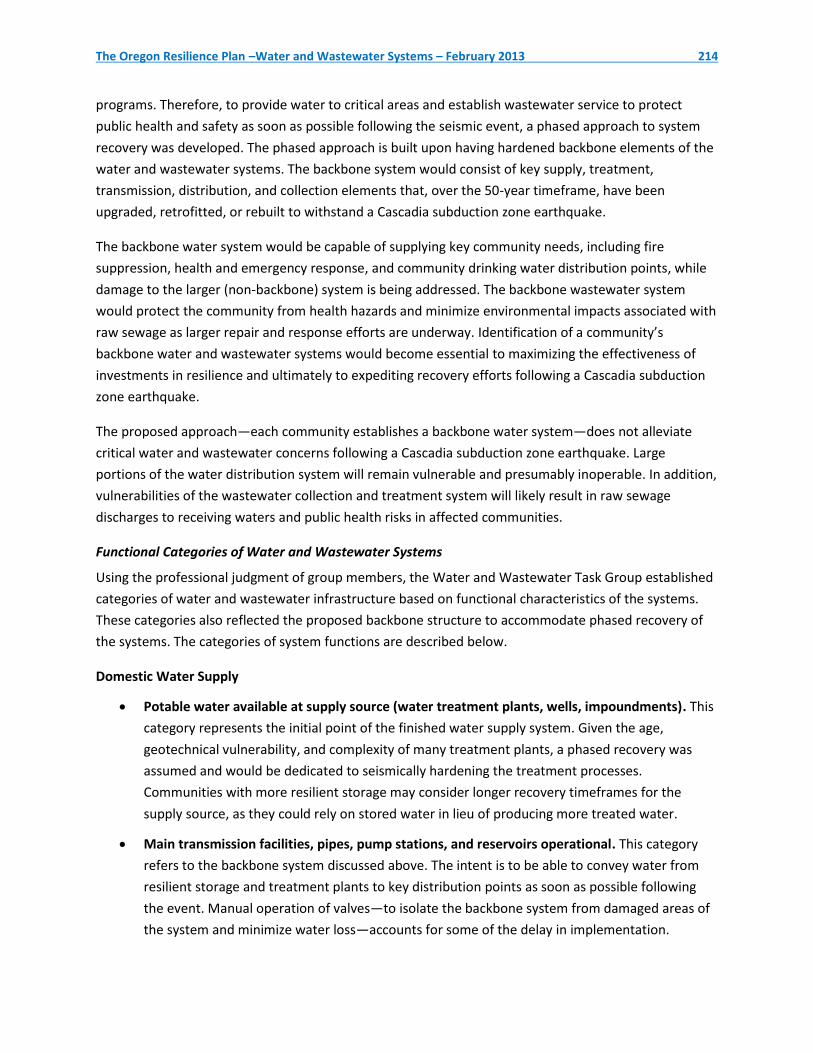
The Oregon Resilience Plan’s Water and Wastewater Task Group included participation by various
industry professionals, including representatives from academia, municipalities, special districts, and
consultants. Communities participating in the planning effort are summarized in Figure 8.17. These
utilities represent about five percent of the population of coastal communities and about 40 percent of
the population of western Oregon.
System / Community Sector
City of Portland Water & Wastewater
Tualatin Valley Water District Water
City of Bend Water
City of Gresham Water
City of Pendleton Water
City of Salem Water & Wastewater
Clean Water Services Wastewater
Coos Bay - North Bend Water Board Water
Eugene Water & Electric Board Water
Rivergrove Water District Water
Figure 8.17: Water and Wastewater Systems Participating in the Water and Wastewater Task Group
The Water and Wastewater Task Group also included experts from three universities, consulting
engineers who specialize in water and wastewater facilities, and the representatives of a fire and
emergency response agency. The task group met monthly from February 2012 through August 2012,
building on existing information and on group members’ working knowledge of existing systems to
assess the performance of existing systems and estimate the time required to restore water and
wastewater service to the populations affected by the scenario earthquake.
RESILIENCE GOALS, OBJECTIVES, AND SCOPE
First, the Water and Wastewater Task Group identified performance goals for the time required to
restore water and wastewater service to affected communities. This effort consisted of developing a
phased approach to water system upgrades before a Cascadia subduction zone earthquake and recovery
after, defining categories or groups of functional characteristics of systems, and identifying resilience
goals for each category.
A Phased Approach
Given the size and inherent vulnerability of most water and wastewater systems, it was assumed that
costs of seismic mitigation would exceed the resources of most providers’ 50-year capital improvement
The Oregon Resilience Plan –Water and Wastewater Systems – February 2013 214
programs. Therefore, to provide water to critical areas and establish wastewater service to protect
public health and safety as soon as possible following the seismic event, a phased approach to system
recovery was developed. The phased approach is built upon having hardened backbone elements of the
water and wastewater systems. The backbone system would consist of key supply, treatment,
transmission, distribution, and collection elements that, over the 50-year timeframe, have been
upgraded, retrofitted, or rebuilt to withstand a Cascadia subduction zone earthquake.
The backbone water system would be capable of supplying key community needs, including fire
suppression, health and emergency response, and community drinking water distribution points, while
damage to the larger (non-backbone) system is being addressed. The backbone wastewater system
would protect the community from health hazards and minimize environmental impacts associated with
raw sewage as larger repair and response efforts are underway. Identification of a community’s
backbone water and wastewater systems would become essential to maximizing the effectiveness of
investments in resilience and ultimately to expediting recovery efforts following a Cascadia subduction
zone earthquake.
The proposed approach—each community establishes a backbone water system—does not alleviate
critical water and wastewater concerns following a Cascadia subduction zone earthquake. Large
portions of the water distribution system will remain vulnerable and presumably inoperable. In addition,
vulnerabilities of the wastewater collection and treatment system will likely result in raw sewage
discharges to receiving waters and public health risks in affected communities.
Functional Categories of Water and Wastewater Systems
Using the professional judgment of group members, the Water and Wastewater Task Group established
categories of water and wastewater infrastructure based on functional characteristics of the systems.
These categories also reflected the proposed backbone structure to accommodate phased recovery of
the systems. The categories of system functions are described below.
Domestic Water Supply
Potable water available at supply source (water treatment plants, wells, impoundments). This
category represents the initial point of the finished water supply system. Given the age,
geotechnical vulnerability, and complexity of many treatment plants, a phased recovery was
assumed and would be dedicated to seismically hardening the treatment processes.
Communities with more resilient storage may consider longer recovery timeframes for the
supply source, as they could rely on stored water in lieu of producing more treated water.
Main transmission facilities, pipes, pump stations, and reservoirs operational. This category
refers to the backbone system discussed above. The intent is to be able to convey water from
resilient storage and treatment plants to key distribution points as soon as possible following
the event. Manual operation of valves—to isolate the backbone system from damaged areas of
the system and minimize water loss—accounts for some of the delay in implementation.
The Oregon Resilience Plan –Water and Wastewater Systems – February 2013 215
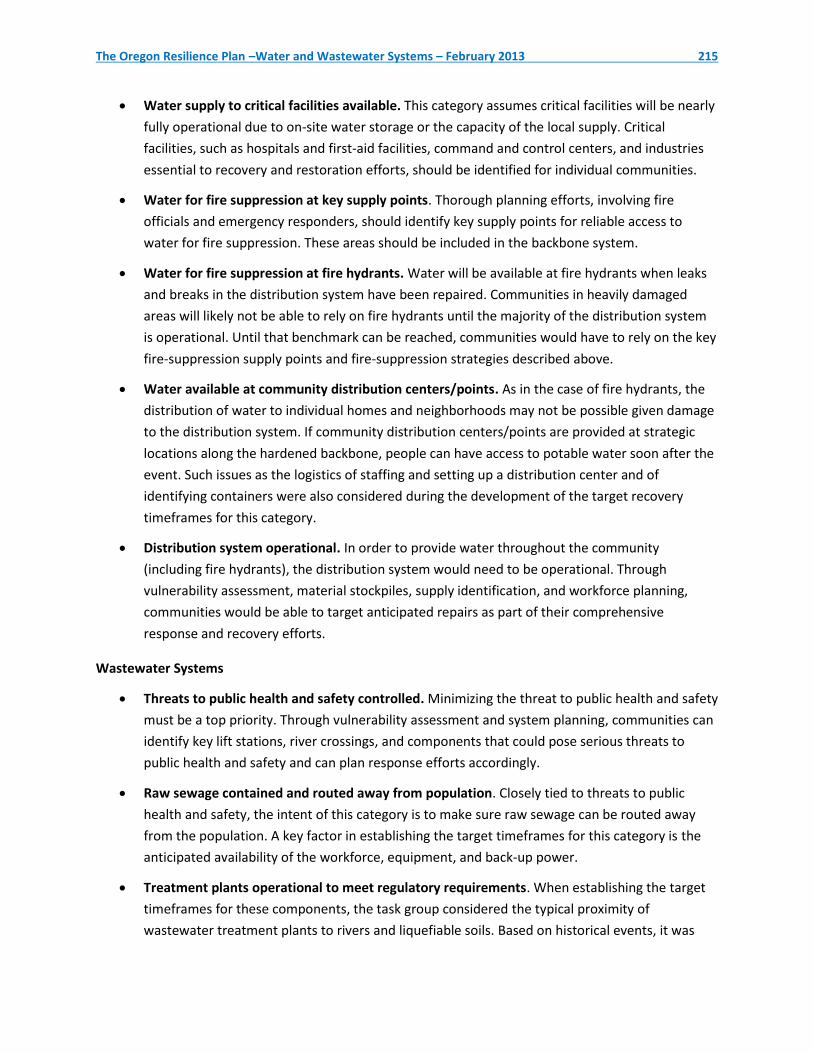
Water supply to critical facilities available. This category assumes critical facilities will be nearly
fully operational due to on-site water storage or the capacity of the local supply. Critical
facilities, such as hospitals and first-aid facilities, command and control centers, and industries
essential to recovery and restoration efforts, should be identified for individual communities.
Water for fire suppression at key supply points. Thorough planning efforts, involving fire
officials and emergency responders, should identify key supply points for reliable access to
water for fire suppression. These areas should be included in the backbone system.
Water for fire suppression at fire hydrants. Water will be available at fire hydrants when leaks
and breaks in the distribution system have been repaired. Communities in heavily damaged
areas will likely not be able to rely on fire hydrants until the majority of the distribution system
is operational. Until that benchmark can be reached, communities would have to rely on the key
fire-suppression supply points and fire-suppression strategies described above.
Water available at community distribution centers/points. As in the case of fire hydrants, the
distribution of water to individual homes and neighborhoods may not be possible given damage
to the distribution system. If community distribution centers/points are provided at strategic
locations along the hardened backbone, people can have access to potable water soon after the
event. Such issues as the logistics of staffing and setting up a distribution center and of
identifying containers were also considered during the development of the target recovery
timeframes for this category.
Distribution system operational. In order to provide water throughout the community
(including fire hydrants), the distribution system would need to be operational. Through
vulnerability assessment, material stockpiles, supply identification, and workforce planning,
communities would be able to target anticipated repairs as part of their comprehensive
response and recovery efforts.
Wastewater Systems
Threats to public health and safety controlled. Minimizing the threat to public health and safety
must be a top priority. Through vulnerability assessment and system planning, communities can
identify key lift stations, river crossings, and components that could pose serious threats to
public health and safety and can plan response efforts accordingly.
Raw sewage contained and routed away from population. Closely tied to threats to public
health and safety, the intent of this category is to make sure raw sewage can be routed away
from the population. A key factor in establishing the target timeframes for this category is the
anticipated availability of the workforce, equipment, and back-up power.
Treatment plants operational to meet regulatory requirements. When establishing the target
timeframes for these components, the task group considered the typical proximity of
wastewater treatment plants to rivers and liquefiable soils. Based on historical events, it was
The Oregon Resilience Plan –Water and Wastewater Systems – February 2013 216
assumed that treatment plants would at first be operating at lower regulatory requirements
given the emergency situation. As repairs are made, the treatment plants would resume
meeting applicable discharge requirements.
Major trunk lines and pump stations operational. Through assessment of vulnerability and
back-up power capability, communities can identify the key pump stations that will be needed
to maintain the functionality of the major trunk lines. As treatment plants return to normal
operation, the available storage in the trunk lines can be utilized to store raw sewage as needed
to minimize threats to public health and safety and route raw sewage away from the
population.
Collection system operational. As repairs to key pump stations, trunk lines, and treatment
plants are completed, the available work force, equipment, and resources can be focused on
repairing the collection systems that serve individual neighborhoods. Damage to and limited
functionality of collection systems should be addressed as part of the comprehensive response
and recovery efforts. Community sanitary collection centers and community education efforts
should be considered.
WATER AND WASTEWATER RECOVERY GOALS
Recovery goals were established for each functional category for water and wastewater systems. Due to
the unique characteristics of various regions of the state, recovery goals were developed for each of
three geographic regions: the Oregon coast, the Willamette Valley, and eastern Oregon.
The proposed target recovery times were developed based on the considerations described above, using
input from a range of water and wastewater professionals participating in the Oregon Resilience Plan
effort, and based on input from the Business Task Group. In general, the recovery goals established by
the professionals who participated in the Water and Wastewater Task Group were longer than the two-
week goal identified by the Business Task Group. These longer goals were based on the professional
judgment of the Water and Wastewater Task Group and took into account the consideration that a goal
of two weeks would require replacement of essentially all existing water and wastewater system
infrastructure. Finally, the intended objectives of the Business Task Group’s goal for a two-week
recovery were generally met by the proposed phased approach of a seismically hardened backbone for
water and wastewater systems.
The proposed target recovery times are based on typical water and wastewater systems in the specified
geographic zone. Estimates of recovery times assume the typical system has implemented
comprehensive resilience improvements, including upgrades to its backbone system, over the 50-year
planning horizon. It is further assumed that the resilient backbone is capable of withstanding the
anticipated impact of a Cascadia subduction zone earthquake with minimal damage. It is recommended
that those responsible for individual systems establish their own target recovery goals as part of a
system-specific assessment to reflect the particular configuration of the individual system and the needs
of the community it serves.
The Oregon Resilience Plan –Water and Wastewater Systems – February 2013 217
Recovery tables were developed for each of three geographic zones of the state, with performance
goals established for each functional category within each zone. These tables include the following:
Table in Figure 8.18: Coastal. This includes the parts of the Coast that are not in tsunami
inundation zones and extends as far as the Coast Range.
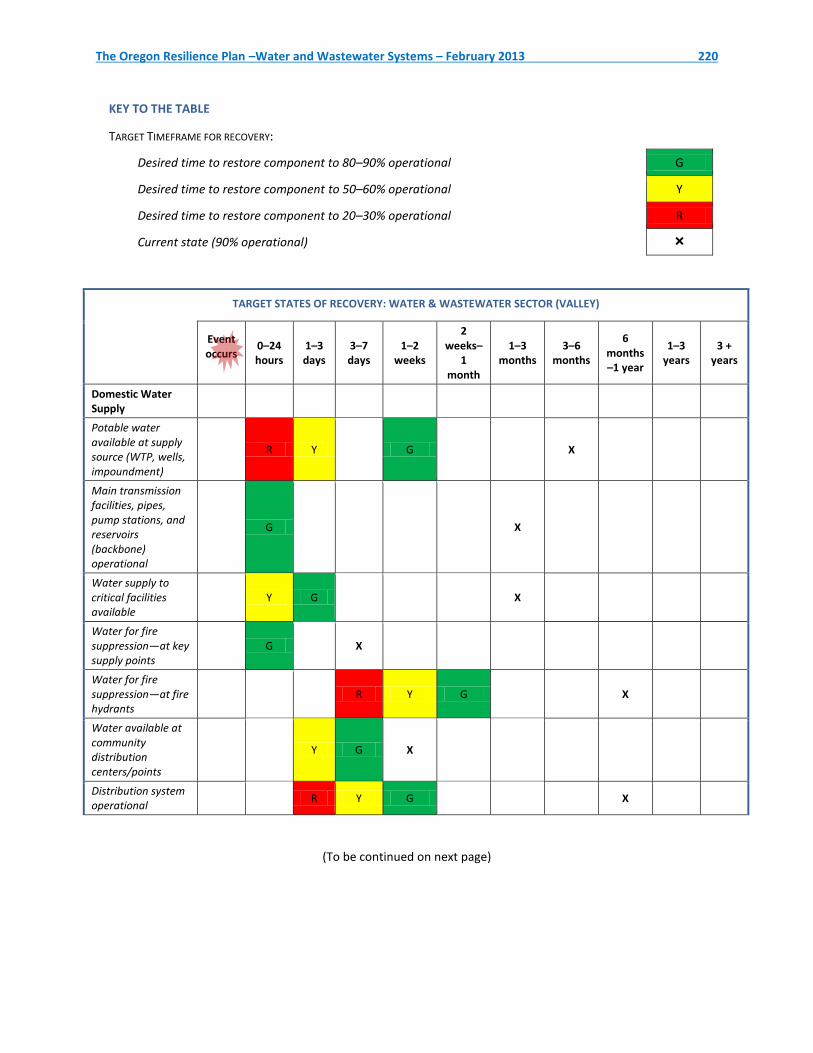
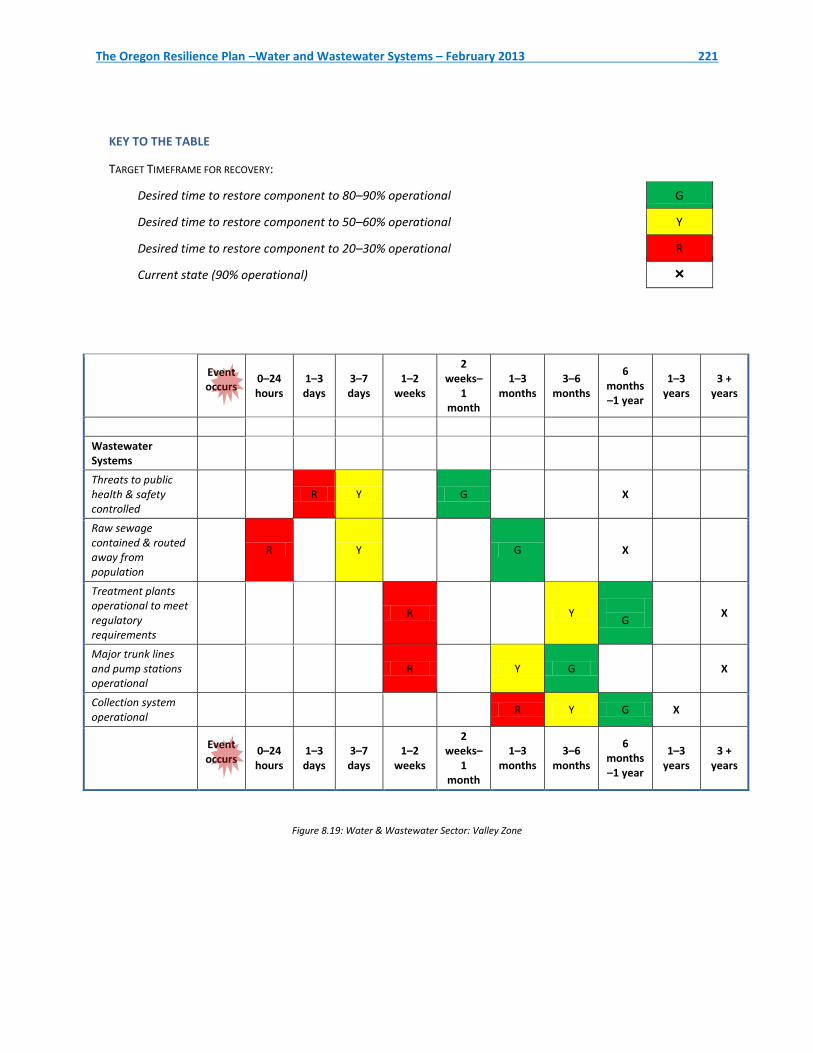
Table in Figure 8.19: Valley. This includes the Willamette Valley and the western-flank of the
Cascades, including major population centers in the state.
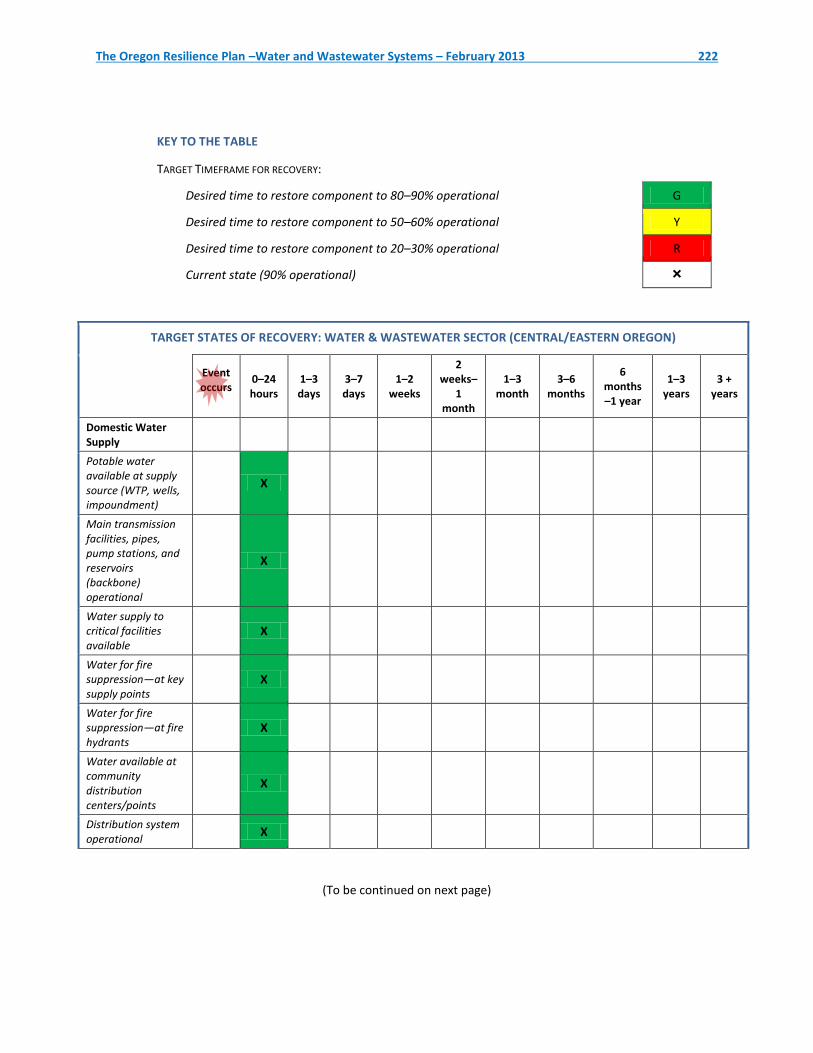
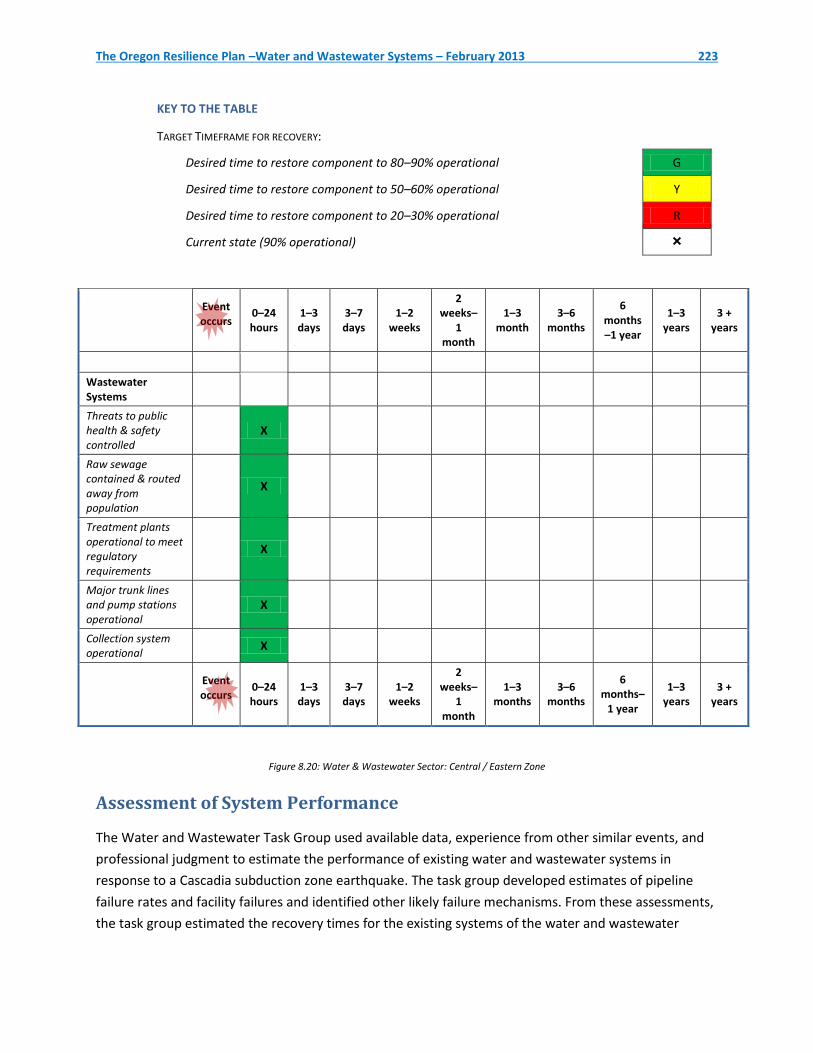
Table in Figure 8.20: Eastern. This includes all areas east of the summit of the Cascades.
As shown in the tables, the performance goals for recovery times vary widely within the state. In
particular, the target recovery times for the Coastal zone are significantly longer than those of the Valley
and Eastern zones. This difference is due in part to the following considerations:
Coastal communities are physically closer to the fault than the communities in the Valley and
Eastern zones and will therefore experience greater physical damage, more disruption, and
longer recovery times. Achieving target recovery times similar to those of the other zones will
require greater effort and expenditure by coastal communities.
The population density of the Coastal zone is far lower than that of the Valley zone; therefore,
the per capita cost of repairs will likely be far higher for coastal communities. Similarly, the per
capita cost for the Eastern zone is expected to be lower given the lower anticipated damage for
that zone.
Coastal communities have fewer resources (in terms of number of residents, available
equipment, consultants, and contractors) to aid with the recovery process and help restore
systems. The competing priorities of the population and economic centers of the state will also
affect the speed at which coastal communities are able to recover. Mobilization of assistance
from other jurisdictions will take additional time and be affected by interdependencies with
other essential services, including transportation, energy, and communications.

The Oregon Resilience Plan –Water and Wastewater Systems – February 2013 218
KEY TO THE TABLE
TARGET TIMEFRAME FOR RECOVERY:
Desired time to restore component to 80–90% operational G
Desired time to restore component to 50–60% operational Y
Desired time to restore component to 20–30% operational R
Current State (90% operational)
TARGET STATES OF RECOVERY: WATER & WASTEWATER SECTOR (COAST)
Event occur
s
0–24 hours
1–3 days
3–7 days
1–2 weeks
2 weeks
– 1 month
1–3 month
s
3–6 month
s
6 month
s–1 year
1–3 years
3 + years
Domestic Water Supply
Potable water available at supply source (WTP, wells, impoundment)
R Y G X
Main transmission facilities, pipes, pump stations, and reservoirs (backbone) operational
R Y G
X
Water supply to critical facilities available
R Y G
X
Water for fire suppression—at key supply points
R Y
G X
Water for fire suppression—at fire hydrants
R
YY G X
Water available at community distribution centers/points
R Y
G
X
Distribution system operational
R
Y G X
(To be continued on next page)
The Oregon Resilience Plan –Water and Wastewater Systems – February 2013 219
KEY TO THE TABLE
TARGET TIMEFRAME FOR RECOVERY:
Desired time to restore component to 80–90% operational G
Desired time to restore component to 50–60% operational Y
Desired time to restore component to 20–30% operational R
Current State (90% operational)
Event occur
s
0–24 hours
1–3 days
3–7 days
1–2 weeks
2 weeks
– 1 month
1–3 month
s
3–6 month
s
6 month
s–1 year
1–3 years
3 + years
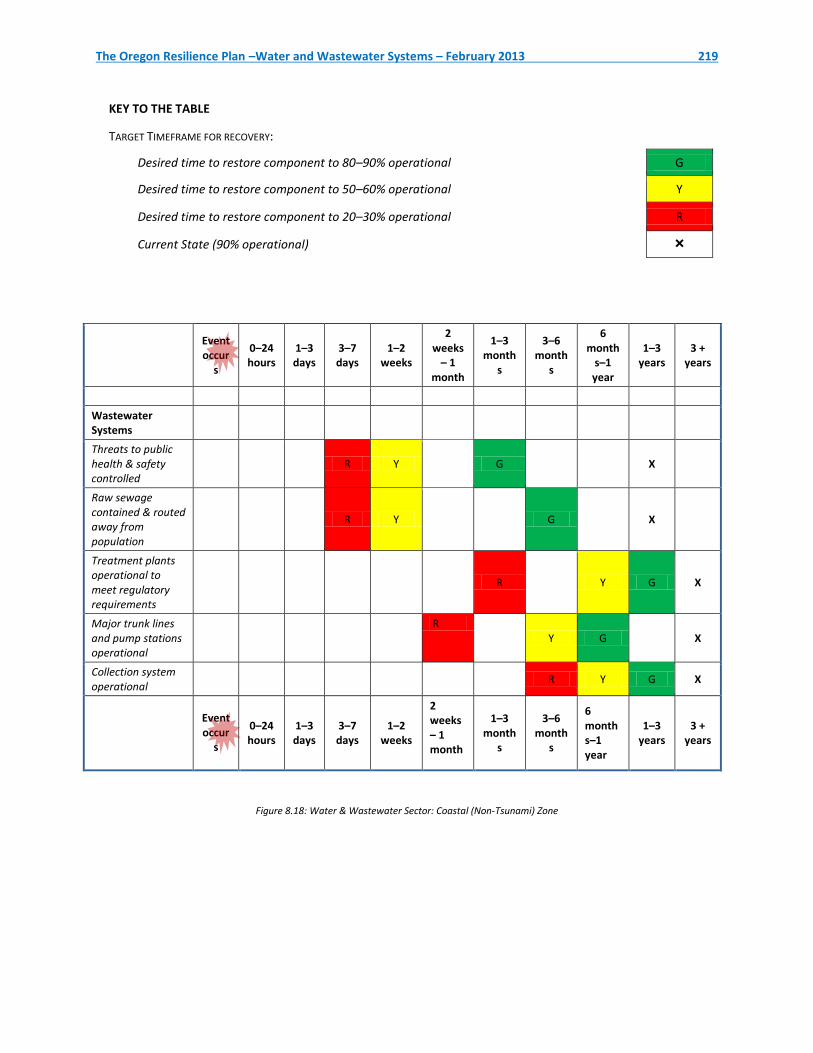
Wastewater Systems
Threats to public health & safety controlled
R Y
G
X
Raw sewage contained & routed away from population
R Y
G
X
Treatment plants operational to meet regulatory requirements
R Y G X
Major trunk lines and pump stations operational
R
Y G X
Collection system operational
R Y G X
Event occur
s
0–24 hours
1–3 days
3–7 days
1–2 weeks
2 weeks– 1 month
1–3 month
s
3–6 month
s
6 months–1 year
1–3 years
3 + years
Figure 8.18: Water & Wastewater Sector: Coastal (Non-Tsunami) Zone
The Oregon Resilience Plan –Water and Wastewater Systems – February 2013 220
KEY TO THE TABLE
TARGET TIMEFRAME FOR RECOVERY:
Desired time to restore component to 80–90% operational G
Desired time to restore component to 50–60% operational Y
Desired time to restore component to 20–30% operational R
Current state (90% operational)
TARGET STATES OF RECOVERY: WATER & WASTEWATER SECTOR (VALLEY)
Event occurs
0–24 hours
1–3 days
3–7 days
1–2 weeks
2 weeks–
1 month
1–3 months
3–6 months
6 months –1 year
1–3 years
3 + years
Domestic Water Supply
Potable water available at supply source (WTP, wells, impoundment)
R Y G X
Main transmission facilities, pipes, pump stations, and reservoirs (backbone) operational
G X
Water supply to critical facilities available
Y G X
Water for fire suppression—at key supply points
G X
Water for fire suppression—at fire hydrants
R Y G X
Water available at community distribution centers/points
Y G X
Distribution system operational
R Y G X
(To be continued on next page)
The Oregon Resilience Plan –Water and Wastewater Systems – February 2013 221
KEY TO THE TABLE
TARGET TIMEFRAME FOR RECOVERY:
Desired time to restore component to 80–90% operational G
Desired time to restore component to 50–60% operational Y
Desired time to restore component to 20–30% operational R
Current state (90% operational)
Event occurs
0–24 hours
1–3 days
3–7 days
1–2 weeks
2 weeks–
1 month
1–3 months
3–6 months
6 months –1 year
1–3 years
3 + years
Wastewater Systems
Threats to public health & safety controlled
R Y G X
Raw sewage contained & routed away from population
R Y G X
Treatment plants operational to meet regulatory requirements
R Y
G X
Major trunk lines and pump stations operational
R Y G X
Collection system operational
R Y G X
Event occurs
0–24 hours
1–3 days
3–7 days
1–2 weeks
2 weeks–
1 month
1–3 months
3–6 months
6 months–1 year
1–3 years
3 + years
Figure 8.19: Water & Wastewater Sector: Valley Zone
The Oregon Resilience Plan –Water and Wastewater Systems – February 2013 222
KEY TO THE TABLE
TARGET TIMEFRAME FOR RECOVERY:
Desired time to restore component to 80–90% operational G
Desired time to restore component to 50–60% operational Y
Desired time to restore component to 20–30% operational R
Current state (90% operational)
TARGET STATES OF RECOVERY: WATER & WASTEWATER SECTOR (CENTRAL/EASTERN OREGON)
Event occurs
0–24 hours
1–3 days
3–7 days
1–2 weeks
2 weeks–
1 month
1–3 month
3–6 months
6 months –1 year
1–3 years
3 + years
Domestic Water Supply
Potable water available at supply source (WTP, wells, impoundment)
X
Main transmission facilities, pipes, pump stations, and reservoirs (backbone) operational
X
Water supply to critical facilities available
X
Water for fire suppression—at key supply points
X
Water for fire suppression—at fire hydrants
X
Water available at community distribution centers/points
X
Distribution system operational X
(To be continued on next page)
The Oregon Resilience Plan –Water and Wastewater Systems – February 2013 223
KEY TO THE TABLE
TARGET TIMEFRAME FOR RECOVERY:
Desired time to restore component to 80–90% operational G
Desired time to restore component to 50–60% operational Y
Desired time to restore component to 20–30% operational R
Current state (90% operational)
Event occurs
0–24 hours
1–3 days
3–7 days
1–2 weeks
2 weeks–
1 month
1–3 month
3–6 months
6 months –1 year
1–3 years
3 + years
Wastewater Systems
Threats to public health & safety controlled
X
Raw sewage contained & routed away from population
X
Treatment plants operational to meet regulatory requirements
X
Major trunk lines and pump stations operational
X
Collection system operational X
Event occurs
0–24 hours
1–3 days
3–7 days
1–2 weeks
2 weeks–
1 month
1–3 months
3–6 months
6 months–
1 year
1–3 years
3 + years
Figure 8.20: Water & Wastewater Sector: Central / Eastern Zone
Assessment of System Performance
The Water and Wastewater Task Group used available data, experience from other similar events, and
professional judgment to estimate the performance of existing water and wastewater systems in
response to a Cascadia subduction zone earthquake. The task group developed estimates of pipeline
failure rates and facility failures and identified other likely failure mechanisms. From these assessments,
the task group estimated the recovery times for the existing systems of the water and wastewater
The Oregon Resilience Plan –Water and Wastewater Systems – February 2013 224
facilities in the coastal and valley zones. This approach and resulting recovery times for existing systems
are presented below.
ESTIMATES OF PIPELINE FAILURES
Water Distribution Systems
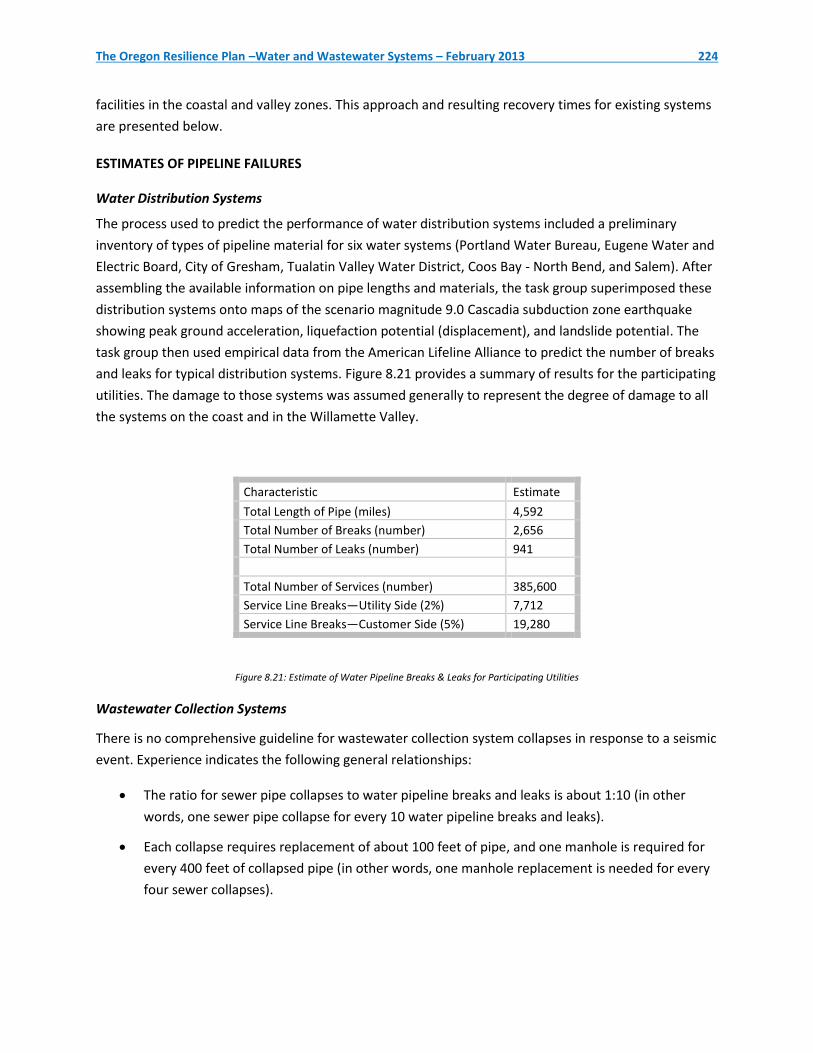
The process used to predict the performance of water distribution systems included a preliminary
inventory of types of pipeline material for six water systems (Portland Water Bureau, Eugene Water and
Electric Board, City of Gresham, Tualatin Valley Water District, Coos Bay - North Bend, and Salem). After
assembling the available information on pipe lengths and materials, the task group superimposed these
distribution systems onto maps of the scenario magnitude 9.0 Cascadia subduction zone earthquake
showing peak ground acceleration, liquefaction potential (displacement), and landslide potential. The
task group then used empirical data from the American Lifeline Alliance to predict the number of breaks
and leaks for typical distribution systems. Figure 8.21 provides a summary of results for the participating
utilities. The damage to those systems was assumed generally to represent the degree of damage to all
the systems on the coast and in the Willamette Valley.
Characteristic Estimate
Total Length of Pipe (miles) 4,592
Total Number of Breaks (number) 2,656
Total Number of Leaks (number) 941
Total Number of Services (number) 385,600
Service Line Breaks—Utility Side (2%) 7,712
Service Line Breaks—Customer Side (5%) 19,280
Figure 8.21: Estimate of Water Pipeline Breaks & Leaks for Participating Utilities
Wastewater Collection Systems
There is no comprehensive guideline for wastewater collection system collapses in response to a seismic
event. Experience indicates the following general relationships:
The ratio for sewer pipe collapses to water pipeline breaks and leaks is about 1:10 (in other
words, one sewer pipe collapse for every 10 water pipeline breaks and leaks).
Each collapse requires replacement of about 100 feet of pipe, and one manhole is required for
every 400 feet of collapsed pipe (in other words, one manhole replacement is needed for every
four sewer collapses).
The Oregon Resilience Plan –Water and Wastewater Systems – February 2013 225
Based on these assumptions, it was projected that the participating utilities would experience a total of
about 360 sewer collapses and about 90 manholes replacements as a result of a Cascadia subduction
zone earthquake.
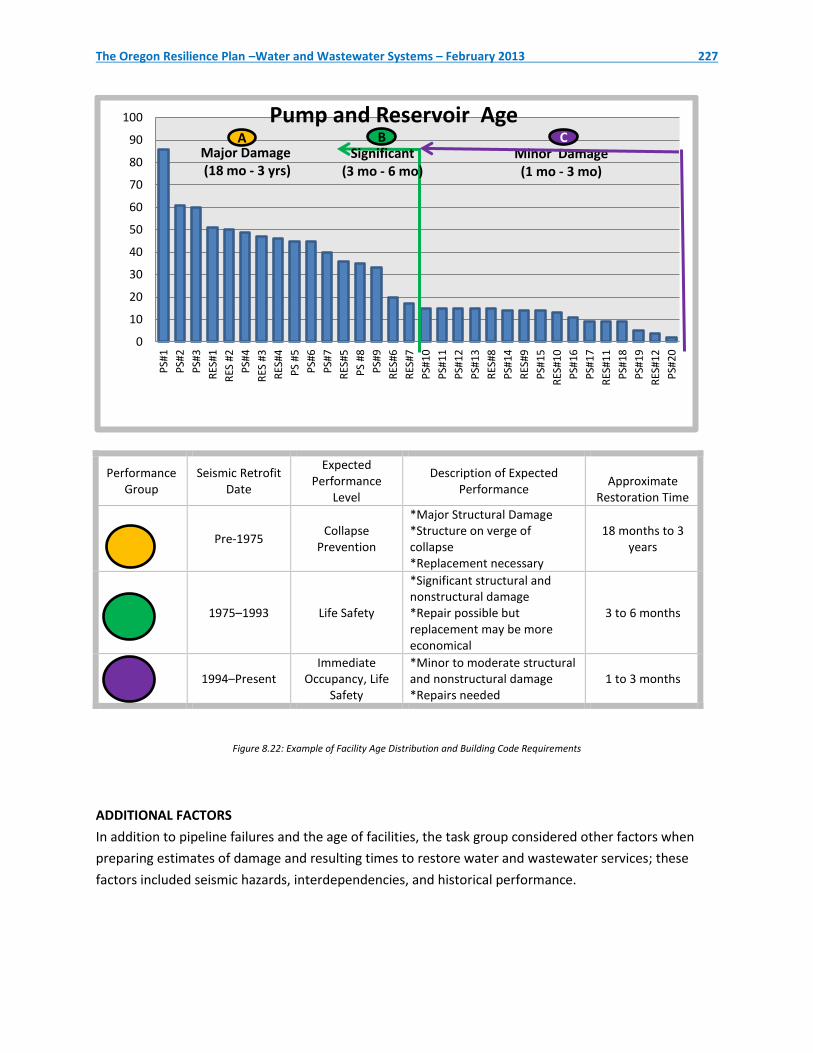
Assessment of Water and Wastewater Structures
Participating utilities also compiled available data on the construction and age of critical water and
wastewater facilities, such as treatment plants, pump stations, and reservoirs. To identify the degree
and severity of likely failures of existing facilities, the task group compared the age distribution of
existing facilities to the building code seismic requirements that were in effect at the time the facilities
were constructed. Figure 8.22 is an example of the typical output that the task group used to estimate
(for each utility) the damage that facilities may experience.
Based on this preliminary assessment, the following general observations were made regarding existing
key structures:
Reservoirs and Tanks
o Nearly all reservoirs and tanks are likely to experience some damage at the connection
between the buried pipe system and the reservoir structure.
o 33 percent of total tankage was built before 1960 and had no lateral force
requirements—these tanks will most likely fail and release contents.
o 30 percent of total tankage was built between 1960 and 1970 and had only a .06 gravity
lateral force requirement—tanks that are near the epicenter will most likely fail and
release contents.
o 12 percent of total tankage was built between 1970 and 1990 and had only a .12 gravity
lateral force requirement—tanks that are close to the epicenter will most likely fail and
release contents.
o 12 percent of total tankage was built between 1990 and 2000 and had somewhat more
stringent lateral force requirement—these tanks will most likely suffer some damage,
but may not release contents.
o 13 percent of total tankage was built after 2000 and had stringent lateral force
requirements—these tanks will most likely remain intact.
Pump Stations
o Nearly all pump stations are likely to experience some damage at the connection
between the buried pipe system and pump station structure.
o 13 percent of pump stations were built before 1960 and had no lateral force
requirements—these stations will likely fail structurally and mechanically.
The Oregon Resilience Plan –Water and Wastewater Systems – February 2013 226
o 22 percent of pump stations were built between 1960 and 1970 and had only a .06
gravity lateral force requirement—these stations will likely fail structurally and
mechanically if located near the epicenter.
o 12 percent of pump stations were built between 1970 and 1990 and had only a .12
gravity lateral force requirement—these stations will likely fail structurally and
mechanically if located close to the epicenter.
o 31 percent of pump stations were built between 1990 and 2000 and had somewhat
more stringent lateral force requirement—these stations will most likely suffer some
damage, but may be usable after repairs.
o 19 percent of pump stations were built between 2000 and 2009 and incorporated
stringent lateral force requirements—these stations are likely to remain intact and
functional.
o 3 percent of pump stations were built after 2009. They meet current code and are most
likely to remain intact and be functional.
Treatment Plants
o Water and wastewater treatments will generally respond in similar ways.
o Treatment plants built on liquefiable soils without special design for liquefiable soils are
likely to suffer catastrophic damage due to foundation failures.
o The identification of and mitigation for liquefaction generally did not become standard
practice until the late 1990’s.
The Oregon Resilience Plan –Water and Wastewater Systems – February 2013 227
Performance Group
Seismic Retrofit Date
Expected Performance
Level
Description of Expected Performance
Approximate Restoration Time
Pre-1975
Collapse Prevention
*Major Structural Damage *Structure on verge of collapse *Replacement necessary
18 months to 3 years
1975–1993 Life Safety
*Significant structural and nonstructural damage *Repair possible but replacement may be more economical
3 to 6 months
1994–Present
Immediate Occupancy, Life
Safety
*Minor to moderate structural and nonstructural damage *Repairs needed
1 to 3 months
Figure 8.22: Example of Facility Age Distribution and Building Code Requirements
ADDITIONAL FACTORS
In addition to pipeline failures and the age of facilities, the task group considered other factors when
preparing estimates of damage and resulting times to restore water and wastewater services; these
factors included seismic hazards, interdependencies, and historical performance.
0
10
20
30
40
50
60
70
80
90
100
PS#
1
PS#
2
PS#
3
RES
#1
RES
#2
PS#
4
RES
#3
RES
#4
PS
#5
PS#
6
PS#
7
RES
#5
PS
#8
PS#
9
RES
#6
RES
#7
PS#
10
PS#
11
PS#
12
PS#
13
RES
#8
PS#
14
RES
#9
PS#
15
RES
#10
PS#
16
PS#
17
RES
#11
PS#
18
PS#
19
RES
#12
PS#
20
Pump and Reservoir Age A B C
Major Damage (18 mo - 3 yrs)
Minor Damage (1 mo - 3 mo)
Significant (3 mo - 6 mo)
The Oregon Resilience Plan –Water and Wastewater Systems – February 2013 228
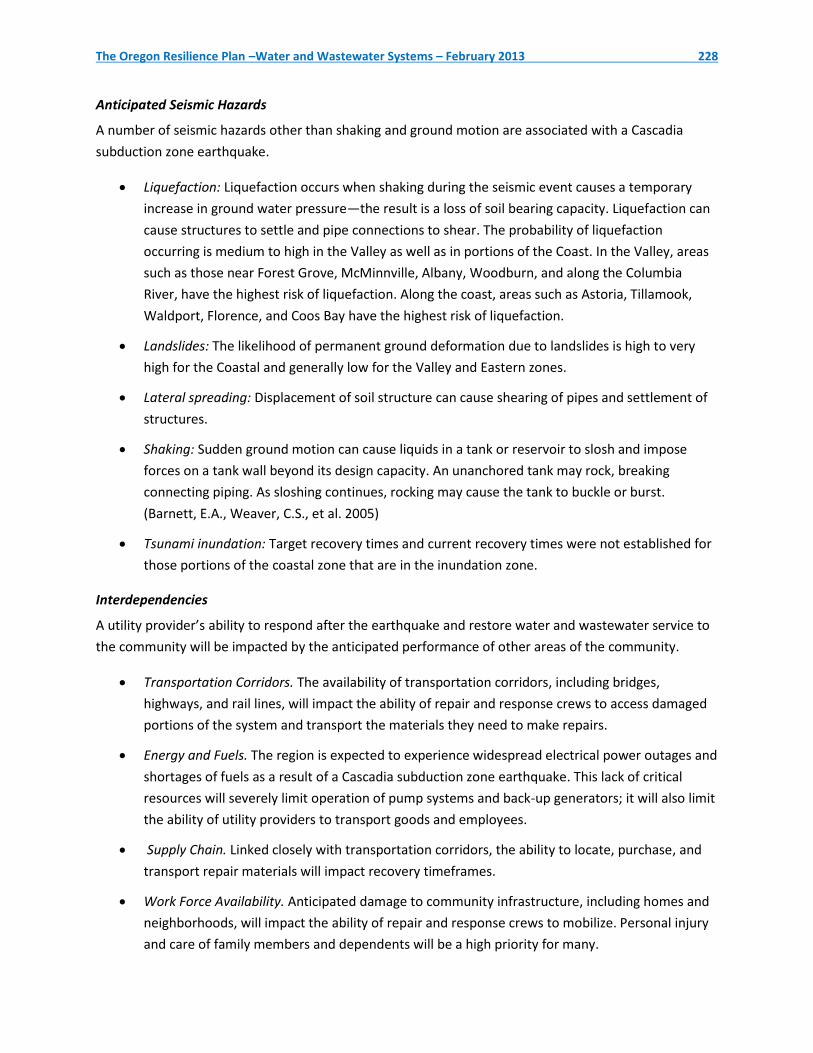
Anticipated Seismic Hazards
A number of seismic hazards other than shaking and ground motion are associated with a Cascadia
subduction zone earthquake.
Liquefaction: Liquefaction occurs when shaking during the seismic event causes a temporary
increase in ground water pressure—the result is a loss of soil bearing capacity. Liquefaction can
cause structures to settle and pipe connections to shear. The probability of liquefaction
occurring is medium to high in the Valley as well as in portions of the Coast. In the Valley, areas
such as those near Forest Grove, McMinnville, Albany, Woodburn, and along the Columbia
River, have the highest risk of liquefaction. Along the coast, areas such as Astoria, Tillamook,
Waldport, Florence, and Coos Bay have the highest risk of liquefaction.
Landslides: The likelihood of permanent ground deformation due to landslides is high to very
high for the Coastal and generally low for the Valley and Eastern zones.
Lateral spreading: Displacement of soil structure can cause shearing of pipes and settlement of
structures.
Shaking: Sudden ground motion can cause liquids in a tank or reservoir to slosh and impose
forces on a tank wall beyond its design capacity. An unanchored tank may rock, breaking
connecting piping. As sloshing continues, rocking may cause the tank to buckle or burst.
(Barnett, E.A., Weaver, C.S., et al. 2005)
Tsunami inundation: Target recovery times and current recovery times were not established for
those portions of the coastal zone that are in the inundation zone.
Interdependencies
A utility provider’s ability to respond after the earthquake and restore water and wastewater service to
the community will be impacted by the anticipated performance of other areas of the community.
Transportation Corridors. The availability of transportation corridors, including bridges,
highways, and rail lines, will impact the ability of repair and response crews to access damaged
portions of the system and transport the materials they need to make repairs.
Energy and Fuels. The region is expected to experience widespread electrical power outages and
shortages of fuels as a result of a Cascadia subduction zone earthquake. This lack of critical
resources will severely limit operation of pump systems and back-up generators; it will also limit
the ability of utility providers to transport goods and employees.
Supply Chain. Linked closely with transportation corridors, the ability to locate, purchase, and
transport repair materials will impact recovery timeframes.
Work Force Availability. Anticipated damage to community infrastructure, including homes and
neighborhoods, will impact the ability of repair and response crews to mobilize. Personal injury
and care of family members and dependents will be a high priority for many.
The Oregon Resilience Plan –Water and Wastewater Systems – February 2013 229
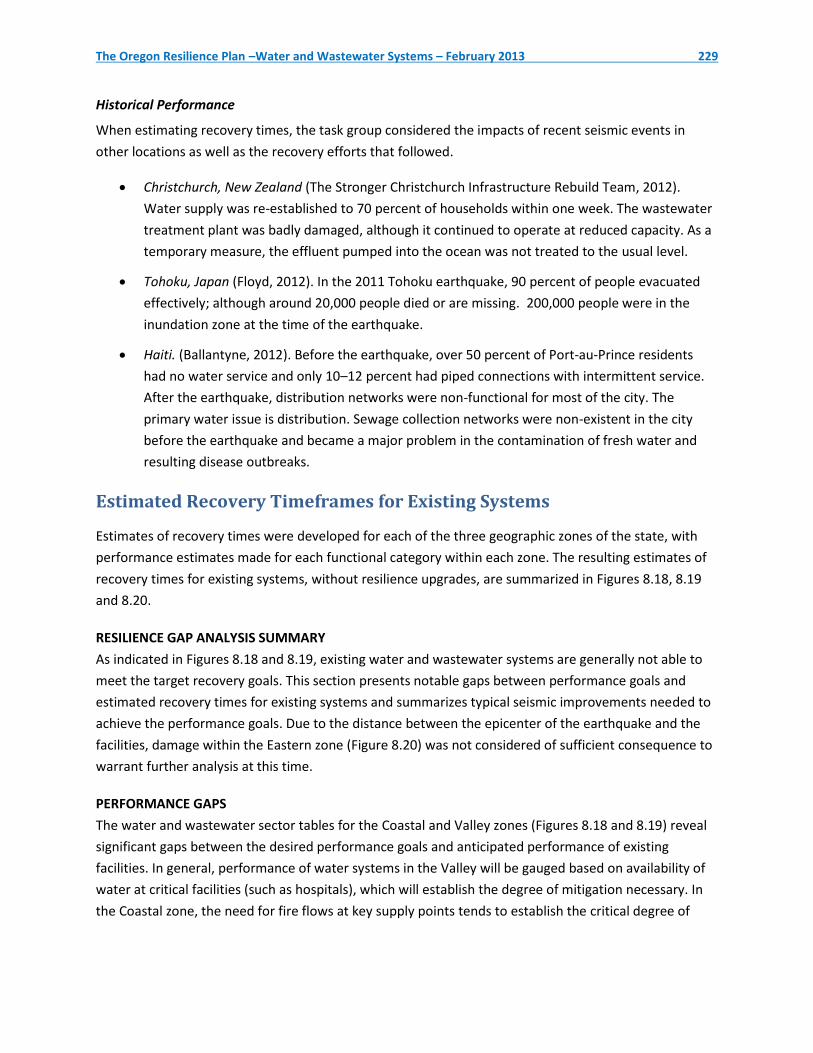
Historical Performance
When estimating recovery times, the task group considered the impacts of recent seismic events in
other locations as well as the recovery efforts that followed.
Christchurch, New Zealand (The Stronger Christchurch Infrastructure Rebuild Team, 2012).
Water supply was re-established to 70 percent of households within one week. The wastewater
treatment plant was badly damaged, although it continued to operate at reduced capacity. As a
temporary measure, the effluent pumped into the ocean was not treated to the usual level.
Tohoku, Japan (Floyd, 2012). In the 2011 Tohoku earthquake, 90 percent of people evacuated
effectively; although around 20,000 people died or are missing. 200,000 people were in the
inundation zone at the time of the earthquake.
Haiti. (Ballantyne, 2012). Before the earthquake, over 50 percent of Port-au-Prince residents
had no water service and only 10–12 percent had piped connections with intermittent service.
After the earthquake, distribution networks were non-functional for most of the city. The
primary water issue is distribution. Sewage collection networks were non-existent in the city
before the earthquake and became a major problem in the contamination of fresh water and
resulting disease outbreaks.
Estimated Recovery Timeframes for Existing Systems
Estimates of recovery times were developed for each of the three geographic zones of the state, with
performance estimates made for each functional category within each zone. The resulting estimates of
recovery times for existing systems, without resilience upgrades, are summarized in Figures 8.18, 8.19
and 8.20.
RESILIENCE GAP ANALYSIS SUMMARY
As indicated in Figures 8.18 and 8.19, existing water and wastewater systems are generally not able to
meet the target recovery goals. This section presents notable gaps between performance goals and
estimated recovery times for existing systems and summarizes typical seismic improvements needed to
achieve the performance goals. Due to the distance between the epicenter of the earthquake and the
facilities, damage within the Eastern zone (Figure 8.20) was not considered of sufficient consequence to
warrant further analysis at this time.
PERFORMANCE GAPS
The water and wastewater sector tables for the Coastal and Valley zones (Figures 8.18 and 8.19) reveal
significant gaps between the desired performance goals and anticipated performance of existing
facilities. In general, performance of water systems in the Valley will be gauged based on availability of
water at critical facilities (such as hospitals), which will establish the degree of mitigation necessary. In
the Coastal zone, the need for fire flows at key supply points tends to establish the critical degree of
The Oregon Resilience Plan –Water and Wastewater Systems – February 2013 230
mitigation necessary. For both Coastal and Valley wastewater systems, the need to contain raw sewage
overflows and control threats to public health tends to establish the degree of mitigation necessary.
It is important to recognize that the identified gaps reflect anticipated goals and performance for a
typical system. In fact, each community or system must conduct its own seismic assessment of the
existing facilities, determine what expectations the governing board and the community have for post-
earthquake performance of the system, and develop a plan to achieve those expectations.
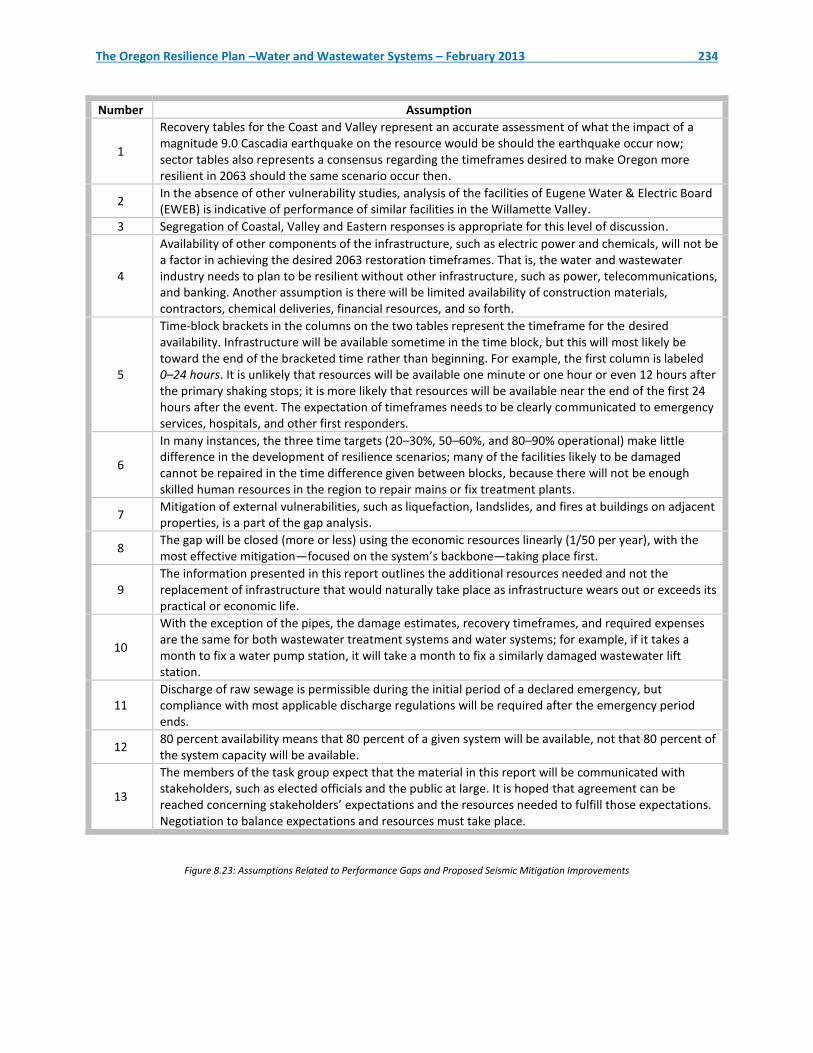
General observations regarding performance gaps and potential mitigation strategies that may be
required to bridge these gaps are summarized below. Assumptions behind these observations are
summarized in Figure 8.23.
In reviewing the proposed mitigation scenarios, seismically induced liquefaction stands out as a
common vulnerability of critical facilities, because nearly all water and wastewater treatment plants are
built near rivers. These facilities were built at times when seismically induced liquefaction was not well
understood. Mitigation of seismically induced liquefaction at many of these plants may not be possible
in a practical sense, because it would require reconstruction of existing foundations of large treatment
structures while the existing facilities remain in operation. Effective mitigation of this critical and
widespread vulnerability may require rebuilding these plants on more stable soils.
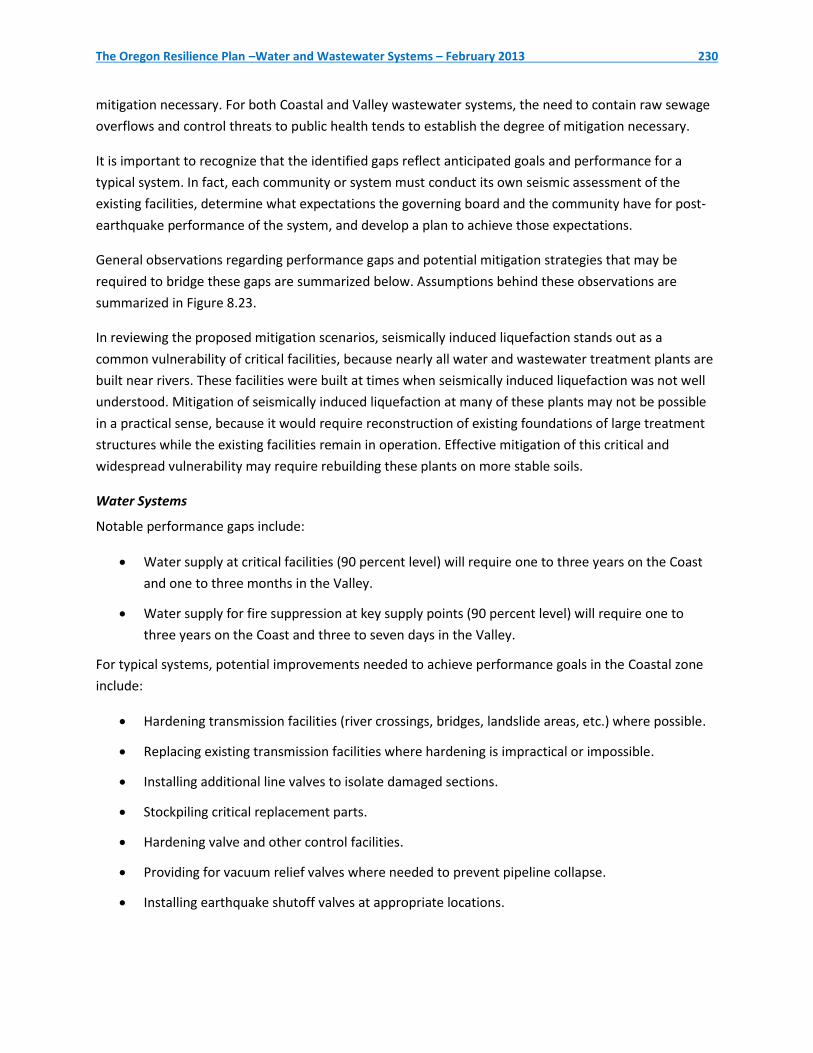
Water Systems
Notable performance gaps include:
Water supply at critical facilities (90 percent level) will require one to three years on the Coast
and one to three months in the Valley.
Water supply for fire suppression at key supply points (90 percent level) will require one to
three years on the Coast and three to seven days in the Valley.
For typical systems, potential improvements needed to achieve performance goals in the Coastal zone
include:
Hardening transmission facilities (river crossings, bridges, landslide areas, etc.) where possible.
Replacing existing transmission facilities where hardening is impractical or impossible.
Installing additional line valves to isolate damaged sections.
Stockpiling critical replacement parts.
Hardening valve and other control facilities.
Providing for vacuum relief valves where needed to prevent pipeline collapse.
Installing earthquake shutoff valves at appropriate locations.
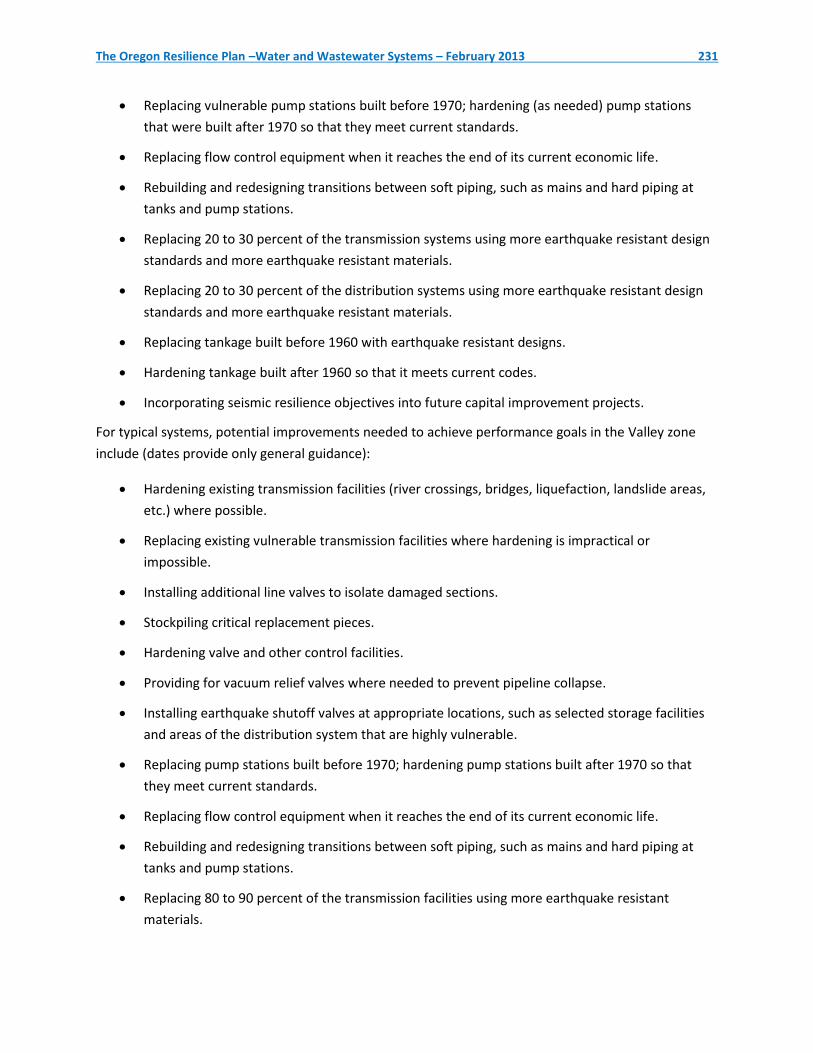
The Oregon Resilience Plan –Water and Wastewater Systems – February 2013 231
Replacing vulnerable pump stations built before 1970; hardening (as needed) pump stations
that were built after 1970 so that they meet current standards.
Replacing flow control equipment when it reaches the end of its current economic life.
Rebuilding and redesigning transitions between soft piping, such as mains and hard piping at
tanks and pump stations.
Replacing 20 to 30 percent of the transmission systems using more earthquake resistant design
standards and more earthquake resistant materials.
Replacing 20 to 30 percent of the distribution systems using more earthquake resistant design
standards and more earthquake resistant materials.
Replacing tankage built before 1960 with earthquake resistant designs.
Hardening tankage built after 1960 so that it meets current codes.
Incorporating seismic resilience objectives into future capital improvement projects.
For typical systems, potential improvements needed to achieve performance goals in the Valley zone
include (dates provide only general guidance):
Hardening existing transmission facilities (river crossings, bridges, liquefaction, landslide areas,
etc.) where possible.
Replacing existing vulnerable transmission facilities where hardening is impractical or
impossible.
Installing additional line valves to isolate damaged sections.
Stockpiling critical replacement pieces.
Hardening valve and other control facilities.
Providing for vacuum relief valves where needed to prevent pipeline collapse.
Installing earthquake shutoff valves at appropriate locations, such as selected storage facilities
and areas of the distribution system that are highly vulnerable.
Replacing pump stations built before 1970; hardening pump stations built after 1970 so that
they meet current standards.
Replacing flow control equipment when it reaches the end of its current economic life.
Rebuilding and redesigning transitions between soft piping, such as mains and hard piping at
tanks and pump stations.
Replacing 80 to 90 percent of the transmission facilities using more earthquake resistant
materials.
The Oregon Resilience Plan –Water and Wastewater Systems – February 2013 232
Replacing 20 to 30 percent of the distribution systems using more earthquake resistant design
standards and more earthquake resistant materials.
Replacing tankage built before 1960 with tankage of earthquake resistant design.
Hardening tankage built after 1960 so that it meets current code.
Incorporating seismic resilience objectives into future capital improvement projects.
Wastewater Systems
Notable performance gaps include the following:
Threats to public health and safety are expected to exist for one to three years on the Coast and
six months to a year in the Valley.
Less than 90 percent of the raw sewage is expected to be contained or routed away from the
population centers for one to three years on the Coast and for six months to a year in the Valley.
Research is required to develop sewer designs that will be resistant to permanent ground deformation
resulting from a Cascadia subduction zone earthquake.
For typical systems, potential improvements needed to achieve performance goals in the Coastal zone
include:
In liquefiable soils, replacing 50 to 60 percent of the collection system with more earthquake
resistant materials.
In liquefiable soils, replacing 50 to 60 percent of the trunk lines with more earthquake resistant
materials.
Relocating or seismically upgrading wastewater treatment plants built before 2000 and all
treatment plants built in areas subject to liquefaction.
Rebuilding or seismically hardening pump stations built before 2000.
Providing for emergency power and emergency treatment chemicals.
Incorporating seismic resilience objectives into future capital improvement projects.
For typical systems, potential improvements needed to achieve performance goals in the Valley zone
include:
In liquefiable soils, replacing 50 to 60 percent of the collection system with more earthquake
resistant materials.
In liquefiable soils, replacing 80 to 90 percent of the trunk lines with more earthquake resistant
materials.

The Oregon Resilience Plan –Water and Wastewater Systems – February 2013 233
Relocating or seismically upgrading wastewater treatment plants built before 2000 and all
treatment plants built in areas subject to liquefaction.
Upgrading or seismically hardening pump stations built before 2000.
Providing for emergency power and emergency treatment chemicals.
Incorporating seismic resilience objectives into future capital improvement projects.
The Oregon Resilience Plan –Water and Wastewater Systems – February 2013 234
Number Assumption
1
Recovery tables for the Coast and Valley represent an accurate assessment of what the impact of a magnitude 9.0 Cascadia earthquake on the resource would be should the earthquake occur now; sector tables also represents a consensus regarding the timeframes desired to make Oregon more resilient in 2063 should the same scenario occur then.
2 In the absence of other vulnerability studies, analysis of the facilities of Eugene Water & Electric Board (EWEB) is indicative of performance of similar facilities in the Willamette Valley.
3 Segregation of Coastal, Valley and Eastern responses is appropriate for this level of discussion.
4
Availability of other components of the infrastructure, such as electric power and chemicals, will not be a factor in achieving the desired 2063 restoration timeframes. That is, the water and wastewater industry needs to plan to be resilient without other infrastructure, such as power, telecommunications, and banking. Another assumption is there will be limited availability of construction materials, contractors, chemical deliveries, financial resources, and so forth.
5
Time-block brackets in the columns on the two tables represent the timeframe for the desired availability. Infrastructure will be available sometime in the time block, but this will most likely be toward the end of the bracketed time rather than beginning. For example, the first column is labeled 0–24 hours. It is unlikely that resources will be available one minute or one hour or even 12 hours after the primary shaking stops; it is more likely that resources will be available near the end of the first 24 hours after the event. The expectation of timeframes needs to be clearly communicated to emergency services, hospitals, and other first responders.
6
In many instances, the three time targets (20–30%, 50–60%, and 80–90% operational) make little difference in the development of resilience scenarios; many of the facilities likely to be damaged cannot be repaired in the time difference given between blocks, because there will not be enough skilled human resources in the region to repair mains or fix treatment plants.
7 Mitigation of external vulnerabilities, such as liquefaction, landslides, and fires at buildings on adjacent properties, is a part of the gap analysis.
8 The gap will be closed (more or less) using the economic resources linearly (1/50 per year), with the most effective mitigation—focused on the system’s backbone—taking place first.
9 The information presented in this report outlines the additional resources needed and not the replacement of infrastructure that would naturally take place as infrastructure wears out or exceeds its practical or economic life.
10
With the exception of the pipes, the damage estimates, recovery timeframes, and required expenses are the same for both wastewater treatment systems and water systems; for example, if it takes a month to fix a water pump station, it will take a month to fix a similarly damaged wastewater lift station.
11 Discharge of raw sewage is permissible during the initial period of a declared emergency, but compliance with most applicable discharge regulations will be required after the emergency period ends.
12 80 percent availability means that 80 percent of a given system will be available, not that 80 percent of the system capacity will be available.
13
The members of the task group expect that the material in this report will be communicated with stakeholders, such as elected officials and the public at large. It is hoped that agreement can be reached concerning stakeholders’ expectations and the resources needed to fulfill those expectations. Negotiation to balance expectations and resources must take place.
Figure 8.23: Assumptions Related to Performance Gaps and Proposed Seismic Mitigation Improvements
The Oregon Resilience Plan –Water and Wastewater Systems – February 2013 235
Recommendations
► Begin aggressive public information efforts to re-set public expectations for a realistic response time. Local governments should consider using local and state planning processes and tools to integrate seismic resilience into their community development and hazard preparation policies.
The old guideline of having a 72-hour emergency survival kit falls far short of the anticipated
needs given the extensive impacts of a Cascadia subduction zone earthquake. Even if basic
supplies could be readily and broadly dispersed, it would likely take more than three days to
achieve that dispersal, and emergency supplies would still fall short of what many people need
to avoid deteriorating health (for example, medications, medical equipment, and ongoing
healthcare support). There is clear value in members of the public having robust emergency
supplies. In many areas, subsistence levels of food and water may be available within a week,
but the public should be advised that response will take much more than 72 hours, and recovery
times will likely be measured in months. This is especially important in coastal communities
where response times could be measured in weeks, and recovery times could be measured in
years.
The majority of jurisdictions in Oregon maintain local hazard mitigation plans, which can
incorporate hazard identification, vulnerability and risk assessments, and mitigation strategies
of public facilities and services. Oregon’s Statewide Planning Goals and Guidelines, especially
Goal 7 (Areas Subject to Natural Hazards) and Goal 11 (Public Facilities and Services), provides
an opportunity through the Comprehensive Plan process to address the vulnerabilities of water
and wastewater systems and devise policies and implementing measures to reduce risk.
► Public agencies should be advised that the Oregon Water/Wastewater Agency Response Network (ORWARN) is a vital resource and membership is recommended.
ORWARN consists of member utilities and cities that provide mutual-aid response following an
emergency. It is recommended that all water and wastewater service providers in the state join. This
applies to agencies from both sides of the Cascades, because agencies from eastern Oregon will
potentially become vital service providers to their counterparts on the coast and in the valley.
► Service providers from all sectors should be required to have a seismic response plan that includes resources normally provided by a functioning infrastructure.
Communities are highly dependent on multiple service providers. These providers need
comprehensive emergency response and recovery plans in order for their staff and related
resources (contractors, consultants) to address seismic events. Non-infrastructure resources, such as
emergency supplies of food and water, communications (including satellite phones), and sister-
agency relationships, are vital resources for meeting emergency response and recovery
The Oregon Resilience Plan –Water and Wastewater Systems – February 2013 236
requirements. Event planning and training at the community level are important tools for building
these response networks.
► Service providers from all sectors are advised to plan for and support employee preparedness.
Previous events have demonstrated that the availability of employees can become a limiting factor
in timely response and recovery of vital services following an event. To minimize delays in response
and recovery, critical service agencies should provide their employees with the information and
training they require to ensure that their families are safe and cared for. Employees have primary
responsibility for their own and their families’ preparedness; employers should clearly communicate
preparedness expectations, but should also provide as much support as practical.
► Water-related industry associations and manufacturers should be strongly encouraged to evaluate the need for seismic design standards for pipelines.
Industry associations, such as the American Water Works Association and the Water Environment
Federation, currently do not have seismic standards for the design of pipelines. These associations
should be encouraged to develop such standards and to educate their members on the availability
and application of the standards.
► Service providers for all essential sectors should be encouraged to develop business continuity plans.
In light of the highly interdependent nature of essential service sectors, all essential service
providers should be encouraged to coordinate with other service providers to assure availability of
essential services following an event. For example, water providers will need access to mapping of
other buried utilities to complete repairs of water pipelines. Each essential service provider also
needs to be prepared to sustain and maintain its workforce to avoid creating impediments to other
service providers. This may include resources such as on-call contracts/agreements with contractors,
consultants, and suppliers of other essential resources (for example, fuel suppliers, material
suppliers, and equipment suppliers) to establish priorities and commitments following events.
► Seismic vulnerability criteria should be incorporated into overall capital improvement project planning and asset management priorities.
Investing in infrastructure solely for improved seismic resilience may be too costly in many cases;
however, a phased implementation of improvements can provide multiple benefits (improved
capacity, better reliability, and reduced operation and maintenance costs). Service providers are
encouraged to take advantage of planned renewal and replacement projects as opportunities to
improve seismic resilience at relatively limited incremental cost.
The Oregon Resilience Plan –Water and Wastewater Systems – February 2013 237
Water-Specific Recommendations
► Require water systems to complete a seismic risk assessment and mitigation plan as part of the existing requirement for five-year updates to water system master plans.
It is assumed that the Oregon Health Authority (OHA) would add this requirement to existing
requirements for water system master plans. The required seismic risk assessment would identify
and assess the likelihood and consequences of seismic failures. The resulting seismic assessment
and mitigation plan would be subject to review and verification of documentation as part of the
routine water system survey performed by OHA. The risk assessment should include a process for
establishing target recovery goals for the area served. Seismic criteria may be based on hazard
vulnerability analyses, building codes, and the findings of the Oregon Department of Geology and
Mineral Industries (DOGAMI), because not all systems in Oregon (for example, those in eastern and
central Oregon) may need to plan for a Cascadia subduction zone earthquake.
► Encourage firefighting agencies and water providers to establish joint standards for use in planning the firefighting response to a large seismic event.
Water providers, fire departments, and emergency managers should lead their communities in
establishing realistic standards and clear, mutually adopted expectations for water supply and
firefighting priorities in the aftermath of a Cascadia subduction zone earthquake. This would result
in joint fire and water decisions on strategies such as seismic valves and auxiliary water supply
points. Rather than mandating a one-size-fits-all standard, the resulting solutions should be
community-specific.
► Water providers should be required to identify and coordinate key water supply points as part of periodic updates to water system master plans.
Water providers, in coordination with emergency response agencies and transportation agencies,
should plan for key water supply and distribution points for firefighting as well as supply points for
public distribution of emergency supplies. In many cases, minor investments in system
infrastructure may be required to maximize the effectiveness, safety, and security of these supply
points.
► The Oregon Health Authority (OHA) should be encouraged to include a seismic design requirement as part of routine design review of water system improvements.
OHA currently provides review and approval of proposed designs of water system improvements.
OHA review should include verification that seismic considerations have been incorporated into the
design of proposed projects. It is not intended that OHA would verify the adequacy of the design;
rather, OHA would simply confirm that seismic criteria were incorporated in the design. The goal of
this recommendation is to ensure that seismic considerations are incorporated into designs for
critical facilities. A review might include checking for items such as flexible connections to tanks, use
of restrained joints, and consideration of geologic hazards. This additional verification is especially
The Oregon Resilience Plan –Water and Wastewater Systems – February 2013 238
important for pipelines, because there are currently no seismic standards for pipeline design (in
contrast, the building code establishes seismic design requirements for structures).
► Encourage the Oregon Department of Environmental Quality (DEQ) and the Oregon Health Authority (OHA) to establish goals and expectations for post-earthquake regulatory compliance and applicable standards.
DEQ and OHA should work with utilities to establish acceptable practices and operational standards
for use during emergency conditions. For example, will it be acceptable to discharge into waters of
the state the chlorinated water from main breaks and main repairs? The agencies should also work
together to:
Identify and address potential analytical laboratory capacity limitations.
Identify potential regulatory and laboratory strategies.
Provide training to utilities on resulting recommendations.
Wastewater-Specific Recommendations
► Require wastewater agencies to complete a seismic risk assessment and mitigation plan as part of periodic updates to facility plans.
It is assumed that the Oregon Department of Environmental Quality (DEQ) would add this
requirement to existing requirements for facility plans. The required seismic risk assessment would
identify and assess the likelihood and consequences of seismic failures. The resulting seismic
assessment and mitigation plan would be subject to review and verification of documentation as
part of the routine assessments conducted by DEQ. The risk assessment should include a process for
establishing target recovery goals for the area served. Seismic criteria may be based on hazard
vulnerability analyses, building codes, and the findings of the Oregon Department of Geology and
Mineral Industries (DOGAMI), because not all systems in Oregon (for example, eastern and central
Oregon) may need to plan for a Cascadia subduction zone.
► Wastewater agencies should be encouraged to conduct more complete characterizations of the impacts of estimated recovery times for seismic events.
In preparing this report, the Water and Wastewater Task Group found that data on the anticipated
performance of Oregon’s wastewater systems in response to a seismic event is limited. Once
additional information becomes available as a result of implementing the preceding
recommendation, it is further recommended that this resilience plan be updated accordingly.
► Encourage the Oregon Department of Environmental Quality (DEQ) to identify and coordinate with wastewater agencies on expectations for the levels of service, regulatory compliance, and applicable standards to be used following a major seismic event.
The Oregon Resilience Plan –Water and Wastewater Systems – February 2013 239
DEQ should work with utilities to establish acceptable practices and operational standards for use
during emergency conditions. For example, will it be acceptable to discharge raw sewage to
receiving water following a disaster declaration? DEQ should also attempt to:
Identify and address potential analytical laboratory capacity limitations.
Identify potential regulatory and laboratory strategies.
Provide training to utilities on resulting recommendations.
► Encourage public health and wastewater agencies to coordinate and establish agreements for the use of temporary sanitary services (portable toilets) immediately after a seismic event.
There are currently no clear lines of authority or defined responsibilities for temporary, emergency
sanitation services such as portable toilets. To the extent possible, this should be pre-established by
public health and wastewater service providers.
► Encourage public health, water, and wastewater agencies to plan for significant water quality impacts to the Willamette and Columbia rivers downstream from Portland.
It is likely that there will be extensive impacts due to potential failure of pipes at river crossings,
leaking from fuel storage tanks, and other contamination and untreated discharges. This could result
in significant adverse impacts on water supply for downstream communities that draw water from
the Columbia River.
The Oregon Resilience Plan –Water and Wastewater Systems – February 2013 240
References
1. American Lifelines Alliances (2011). Seismic Fragility Formulations for Water Systems.
2. Ballantyne, D. (2012). “Water, Wastewater, and Drainage Systems”, Haiti MW 7.0 Earthquake of
January 12, 21010, Lifeline Performance, edited by Curtis Edwards. ASCE Technical Council on
Lifeline Earthquake Engineering, Monograph No. 35, Washington D.C.
3. Barnett, E. A., Weaver, C.S, et al. (2005). “Lifelines and Earthquake Hazards along the Interstate
5 Urban Corridor: Woodburn, Oregon to Centralia, Washington”. Poster.
4. Benjamin, Y. (2012). “Water, Sanitation, and Hygiene situation in Haiti as of 1/21,”
http://blog.sfgate.com/ybenjamin/2010/01/22/water-sanitation-and-hygiene-wash-situation-in-
haiti-as-of-121/. Retrieved August 30, 2012.
5. Floyd, M. (2012). “Lessons for the Pacific Northwest: Japanese death toll could have been
worse”. Oregon State University.
6. Stronger Christchurch Infrastructure Rebuild Team (2012). “Rebuilding the fresh water
network,” http://strongerchristchurch.govt.nz/work/fresh-water/fixing. Retrieved August 30,
2012.
7. Wang, Yumei. Undated. “Tsunami Vertical Evacuation Refuge Activities in Oregon,” Department
of Geology and Mineral Industries.