Embed Size (px)
Citation preview
Defi ned simply, political participation refers to the many different ways that people take part in politics and government: voting or trying to infl uence others to vote, joining a political party or giving money to a can-didate for offi ce, keeping informed about government or debating political issues with others, signing a peti-tion, protesting a policy, advocating for a new law, or just writing a letter to an elected leader. Some scholars of the subject profess that, in addition to these activi-ties, almost any form of civic engagement, like helping out at a local homeless shelter or attending a school board meeting, should count as political participation. And some believe that the rise of the Internet, politi-cal blogs, and social media make traditional ideas about what constitutes political participation obsolete.
But no matter how they defi ne it, most academics who study political participation pay close attention to vot-ing and begin with a puzzle: despite successive legal and other changes that might be expected to increase
electoral participation, voter turnout rates in America today are lower than they were for previous genera-tions, and scores of millions of Americans now sit out each presidential and midterm national election.
THEN In most states, well into the 19th century, only property-owning white males could vote. After the Civil War and into the mid-20th century, many states used all manner of stratagems to keep blacks from vot-ing. Women did not receive the right to vote until 1920 when the Nineteenth Amendment to the Constitution was ratifi ed. Before 1961, residents of the District of Columbia could not vote in presidential elections; the Twenty-Third Amendment to the Constitution gave them the right. Into the 1960s, most whites had only limited formal education; women and many minority groups faced legal, social, and other barriers or disin-centives to voting; and there was nothing resembling today’s steady stream of political news via multiple media outlets.
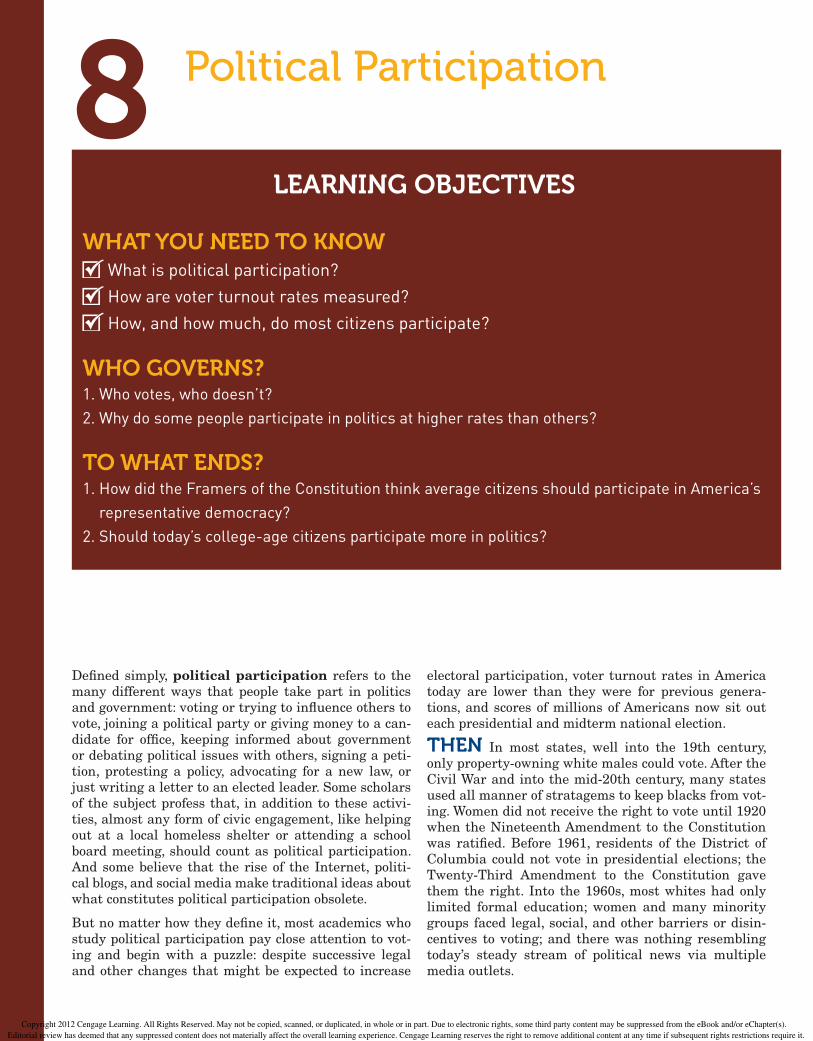
LEARNING OBJECTIVES
WHAT YOU NEED TO KNOWWhat is political participation?How are voter turnout rates measured?How, and how much, do most citizens participate?
WHO GOVERNS?1. Who votes, who doesn’t?2. Why do some people participate in politics at higher rates than others?
TO WHAT ENDS?1. How did the Framers of the Constitution think average citizens should participate in America’s
representative democracy?2. Should today’s college-age citizens participate more in politics?
Political Participation8
Copyright 2012 Cengage Learning. All Rights Reserved. May not be copied, scanned, or duplicated, in whole or in part. Due to electronic rights, some third party content may be suppressed from the eBook and/or eChapter(s). Editorial review has deemed that any suppressed content does not materially affect the overall learning experience. Cengage Learning reserves the right to remove additional content at any time if subsequent rights restrictions require it.
183A
P P
ho
to/M
att
Ro
urk
e
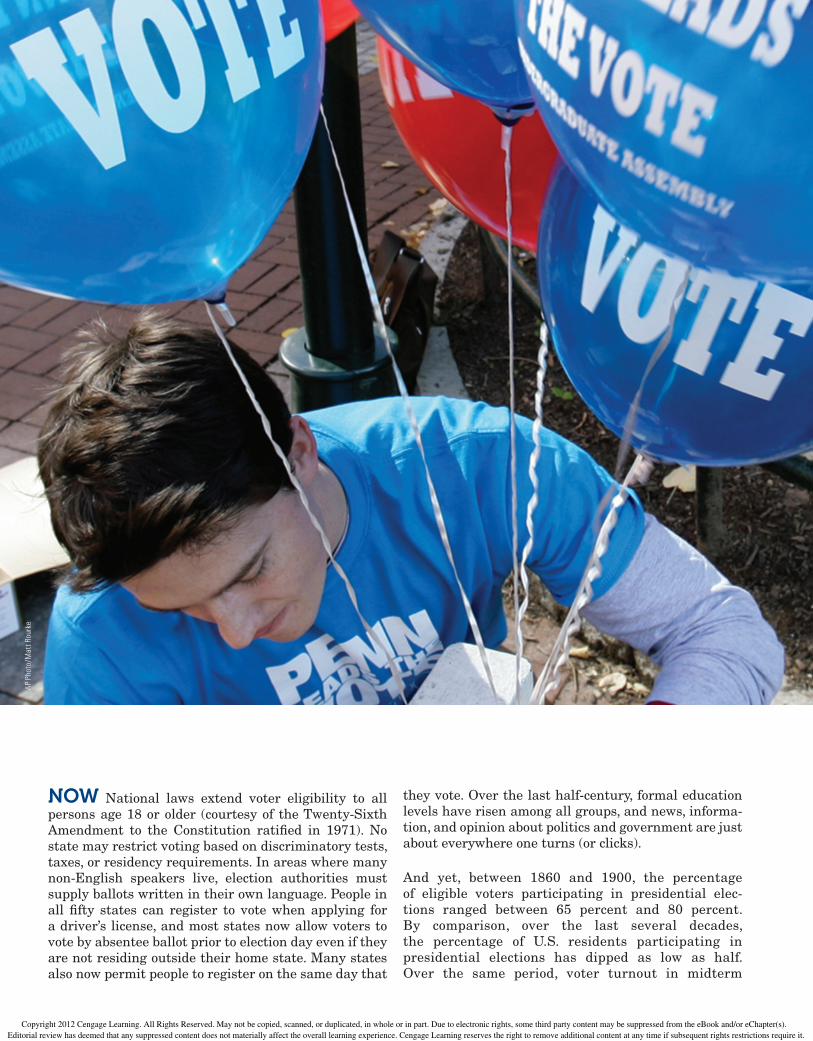
NOW National laws extend voter eligibility to all persons age 18 or older (courtesy of the Twenty-Sixth Amendment to the Constitution ratifi ed in 1971). No state may restrict voting based on discriminatory tests, taxes, or residency requirements. In areas where many non-English speakers live, election authorities must supply ballots written in their own language. People in all fi fty states can register to vote when applying for a driver’s license, and most states now allow voters to vote by absentee ballot prior to election day even if they are not residing outside their home state. Many states also now permit people to register on the same day that
they vote. Over the last half-century, formal education levels have risen among all groups, and news, informa-tion, and opinion about politics and government are just about everywhere one turns (or clicks).
And yet, between 1860 and 1900, the percentage of eligible voters participating in presidential elec-tions ranged between 65 percent and 80 percent. By comparison, over the last several decades, the percentage of U.S. residents participating in presidential elections has dipped as low as half. Over the same period, voter turnout in midterm
Copyright 2012 Cengage Learning. All Rights Reserved. May not be copied, scanned, or duplicated, in whole or in part. Due to electronic rights, some third party content may be suppressed from the eBook and/or eChapter(s). Editorial review has deemed that any suppressed content does not materially affect the overall learning experience. Cengage Learning reserves the right to remove additional content at any time if subsequent rights restrictions require it.
184 Chapter 8 Political Participation
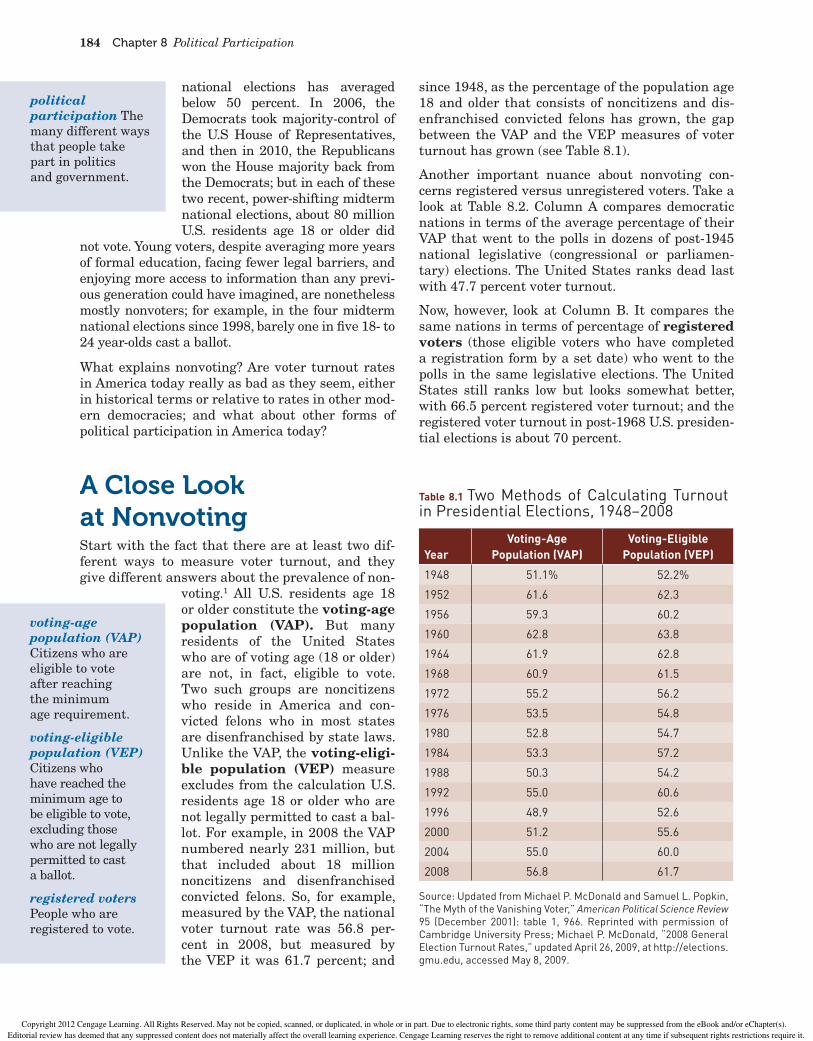
since 1948, as the percentage of the population age 18 and older that consists of noncitizens and dis-enfranchised convicted felons has grown, the gap between the VAP and the VEP measures of voter turnout has grown (see Table 8.1).
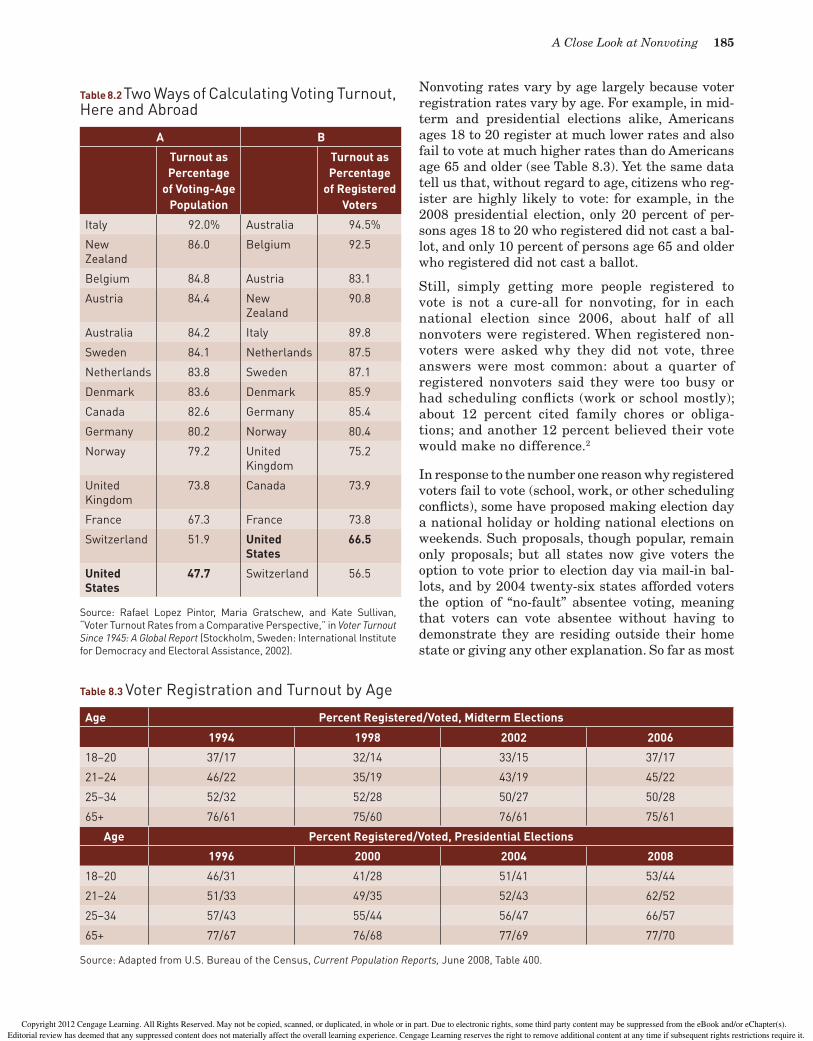
Another important nuance about nonvoting con-cerns registered versus unregistered voters. Take a look at Table 8.2. Column A compares democratic nations in terms of the average percentage of their VAP that went to the polls in dozens of post-1945 national legislative (congressional or parliamen-tary) elections. The United States ranks dead last with 47.7 percent voter turnout.
Now, however, look at Column B. It compares the same nations in terms of percentage of registered voters (those eligible voters who have completed a registration form by a set date) who went to the polls in the same legislative elections. The United States still ranks low but looks somewhat better, with 66.5 percent registered voter turnout; and the registered voter turnout in post-1968 U.S. presiden-tial elections is about 70 percent.
national elections has averaged below 50 percent. In 2006, the Democrats took majority-control of the U.S House of Representatives, and then in 2010, the Republicans won the House majority back from the Democrats; but in each of these two recent, power-shifting midterm national elections, about 80 million U.S. residents age 18 or older did
not vote. Young voters, despite averaging more years of formal education, facing fewer legal barriers, and enjoying more access to information than any previ-ous generation could have imagined, are nonetheless mostly nonvoters; for example, in the four midterm national elections since 1998, barely one in fi ve 18- to 24 year-olds cast a ballot.
What explains nonvoting? Are voter turnout rates in America today really as bad as they seem, either in historical terms or relative to rates in other mod-ern democracies; and what about other forms of political participation in America today?
A Close Look at NonvotingStart with the fact that there are at least two dif-ferent ways to measure voter turnout, and they give different answers about the prevalence of non-
voting.1 All U.S. residents age 18 or older constitute the voting-age population (VAP). But many residents of the United States who are of voting age (18 or older) are not, in fact, eligible to vote. Two such groups are noncitizens who reside in America and con-victed felons who in most states are disenfranchised by state laws. Unlike the VAP, the voting-eligi-ble population (VEP) measure excludes from the calculation U.S. residents age 18 or older who are not legally permitted to cast a bal-lot. For example, in 2008 the VAP numbered nearly 231 million, but that included about 18 million noncitizens and disenfranchised convicted felons. So, for example, measured by the VAP, the national voter turnout rate was 56.8 per-cent in 2008, but measured by the VEP it was 61.7 percent; and
political participation The many different ways that people take part in politics and government.
Table 8.1 Two Methods of Calculating Turnout in Presidential Elections, 1948–2008
YearVoting-Age
Population (VAP)Voting-Eligible
Population (VEP)
1948 51.1% 52.2%
1952 61.6 62.3
1956 59.3 60.2
1960 62.8 63.8
1964 61.9 62.8
1968 60.9 61.5
1972 55.2 56.2
1976 53.5 54.8
1980 52.8 54.7
1984 53.3 57.2
1988 50.3 54.2
1992 55.0 60.6
1996 48.9 52.6
2000 51.2 55.6
2004 55.0 60.0
2008 56.8 61.7
Source: Updated from Michael P. McDonald and Samuel L. Popkin, “The Myth of the Vanishing Voter,” American Political Science Review 95 (December 2001): table 1, 966. Reprinted with permission of Cambridge University Press; Michael P. McDonald, “2008 General Election Turnout Rates,” updated April 26, 2009, at http://elections.gmu.edu, accessed May 8, 2009.
voting-age population (VAP) Citizens who are eligible to vote after reaching the minimum age requirement.
voting-eligible population (VEP) Citizens who have reached the minimum age to be eligible to vote, excluding those who are not legally permitted to cast a ballot.
registered voters People who are registered to vote.
Copyright 2012 Cengage Learning. All Rights Reserved. May not be copied, scanned, or duplicated, in whole or in part. Due to electronic rights, some third party content may be suppressed from the eBook and/or eChapter(s). Editorial review has deemed that any suppressed content does not materially affect the overall learning experience. Cengage Learning reserves the right to remove additional content at any time if subsequent rights restrictions require it.
A Close Look at Nonvoting 185
Nonvoting rates vary by age largely because voter registration rates vary by age. For example, in mid-term and presidential elections alike, Americans ages 18 to 20 register at much lower rates and also fail to vote at much higher rates than do Americans age 65 and older (see Table 8.3). Yet the same data tell us that, without regard to age, citizens who reg-ister are highly likely to vote: for example, in the 2008 presidential election, only 20 percent of per-sons ages 18 to 20 who registered did not cast a bal-lot, and only 10 percent of persons age 65 and older who registered did not cast a ballot.
Still, simply getting more people registered to vote is not a cure-all for nonvoting, for in each national election since 2006, about half of all nonvoters were registered. When registered non-voters were asked why they did not vote, three answers were most common: about a quarter of registered nonvoters said they were too busy or had scheduling confl icts (work or school mostly); about 12 percent cited family chores or obliga-tions; and another 12 percent believed their vote would make no difference.2
In response to the number one reason why registered voters fail to vote (school, work, or other scheduling confl icts), some have proposed making election day a national holiday or holding national elections on weekends. Such proposals, though popular, remain only proposals; but all states now give voters the option to vote prior to election day via mail-in bal-lots, and by 2004 twenty-six states afforded voters the option of “no-fault” absentee voting, meaning that voters can vote absentee without having to demonstrate they are residing outside their home state or giving any other explanation. So far as most
Table 8.2 Two Ways of Calculating Voting Turnout, Here and Abroad
A B
Turnout as Percentage
of Voting-Age Population
Turnout as Percentage
of Registered Voters
Italy 92.0% Australia 94.5%
New Zealand
86.0 Belgium 92.5
Belgium 84.8 Austria 83.1
Austria 84.4 New Zealand
90.8
Australia 84.2 Italy 89.8
Sweden 84.1 Netherlands 87.5
Netherlands 83.8 Sweden 87.1
Denmark 83.6 Denmark 85.9
Canada 82.6 Germany 85.4
Germany 80.2 Norway 80.4
Norway 79.2 United Kingdom
75.2
United Kingdom
73.8 Canada 73.9
France 67.3 France 73.8
Switzerland 51.9 United States
66.5
United States
47.7 Switzerland 56.5
Source: Rafael Lopez Pintor, Maria Gratschew, and Kate Sullivan, “Voter Turnout Rates from a Comparative Perspective,” in Voter Turnout Since 1945: A Global Report (Stockholm, Sweden: International Institute for Democracy and Electoral Assistance, 2002).
Table 8.3 Voter Registration and Turnout by Age
Age Percent Registered/Voted, Midterm Elections
1994 1998 2002 2006
18–20 37/17 32/14 33/15 37/17
21–24 46/22 35/19 43/19 45/22
25–34 52/32 52/28 50/27 50/28
65+ 76/61 75/60 76/61 75/61
Age Percent Registered/Voted, Presidential Elections
1996 2000 2004 2008
18–20 46/31 41/28 51/41 53/44
21–24 51/33 49/35 52/43 62/52
25–34 57/43 55/44 56/47 66/57
65+ 77/67 76/68 77/69 77/70
Source: Adapted from U.S. Bureau of the Census, Current Population Reports, June 2008, Table 400.
Copyright 2012 Cengage Learning. All Rights Reserved. May not be copied, scanned, or duplicated, in whole or in part. Due to electronic rights, some third party content may be suppressed from the eBook and/or eChapter(s). Editorial review has deemed that any suppressed content does not materially affect the overall learning experience. Cengage Learning reserves the right to remove additional content at any time if subsequent rights restrictions require it.
186 Chapter 8 Political Participation
researchers have been able to determine, and with a few dramatic exceptions (for example, Oregon’s 1996 all-mail-in election for the U.S. Senate), the greater fl exibility and convenience of these voting procedures has done little or nothing to increase voter turnout.3
If voter turnout rates are to rise substantially in the United States, then nonregistered voters must become registered to vote in ever greater numbers. In addition to the roughly 40 million registered non-voters, another 40 million or so voting-age citizens were not registered to vote in each of several recent national elections.
In most European nations, registration is done for you—automatically—by the government. By con-trast, in America, the entire burden of registering to vote falls on the individual voters: they must learn how and when and where to register; they must take the time and trouble to go somewhere and fi ll out a registration form; and they must regis-ter if they happen to move. It is costly to register to vote in this country and costless to register in other democracies; it should not be surprising that fewer people are registered here than abroad.
But would making it less burdensome to regis-ter necessarily result in higher percentages of Americans becoming registered voters and voting? In 1993, Congress passed a law designed to make it easier to register to vote. Known as the motor-voter law, the law allows people in all fi fty states to register to vote when applying for driver’s licenses and to provide registration through the mail and at some state offi ces that serve the disabled or provide public assistance (such as checks for eligible low-income families).
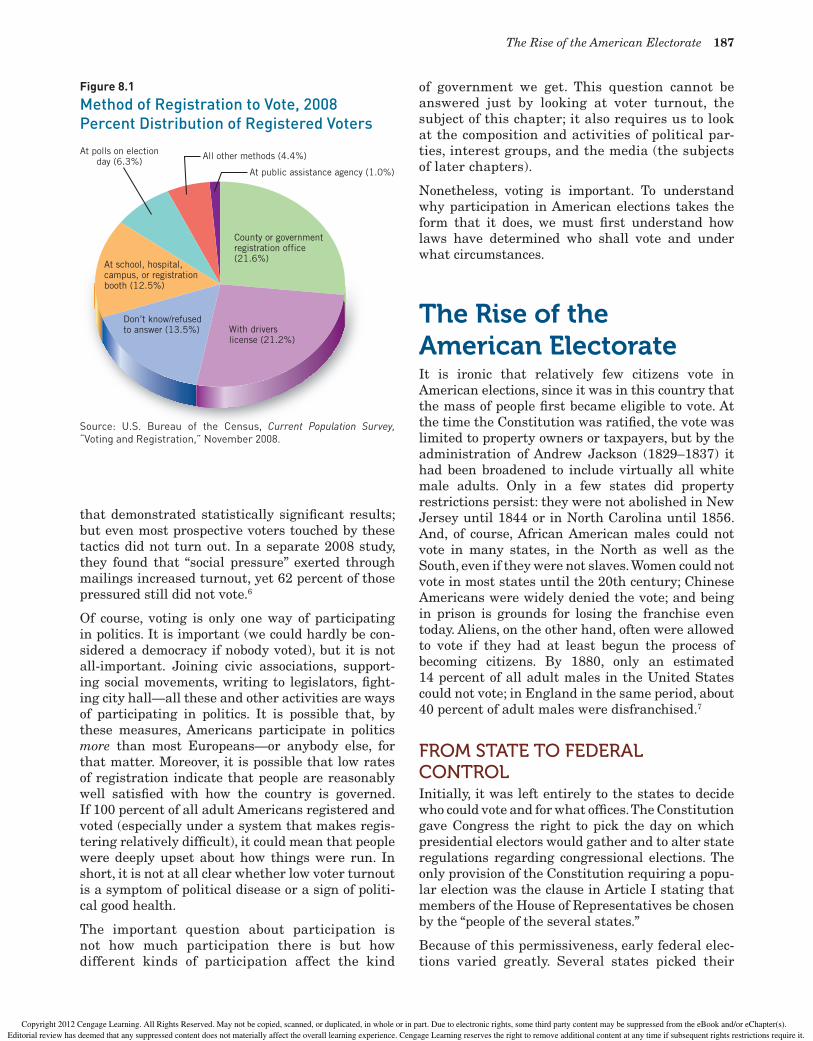
As with mail-in and absentee balloting, the evi-dence regarding the motor-voter law’s impact on voter participation remains less than encourag-ing. In 2001, eight years after the law was enacted, millions of citizens had registered to vote via state motor vehicles bureaus or other state offi ces, but a study found “that those who register when the process is costless are less likely to vote.”4 By 2008, motor-voter law-related means of registration were widely used (see Figure 8.1). But between 1993 and 2008, while voter registration rates had increased somewhat over pre-1993 levels, there still was no solid evidence that the law had substantially increased voter turnout.
Mounting a get-out-the-vote (GOTV) drive can make only a small difference depending on what tactic is used. In a 2008 study, political scientists Donald P. Green and Alan Gerber examined the fi ndings from
Laws on VotingRatifi ed in 1971, the Twenty-Sixth Amendment to the U.S. Constitution forbids states to deny “on account of age” the right to vote to citizens who are age 18 or older. But most states deny voting rights to voting-age citizens who have been con-victed of felony crimes. Relevant state laws vary; for instance, Kentucky and Virginia have largely maintained laws that disenfranchise felons for life, while Maine and Vermont have permitted certain presently incarcerated felons to vote.
The legal voting age in almost all other nations is also 18. In about a dozen other countries, however, the legal voting age has been 16 (as in Brazil) or 17 (as in Indonesia); and in about twenty other nations the legal voting age is 19 (as in South Korea), 20 (as in Japan), or 21 (as in Lebanon).
Some democracies (for example, the United Kingdom) deny prisoners the right to vote, but it is far more common for democracies to permit all prisoners (save, in some nations, persons con-victed of electoral fraud or related crimes) to vote. America is almost alone among democracies in the extent to which laws deny ex-prisoners the right to vote.
America is also in the international minority with respect to laws on voter registration. In most other nations it is legally compulsory for voters to register; a central, regional, or local govern-ment, or, most commonly, a specialized “Electoral Management Body,” is expressly responsible for registering voters in national elections.
In America, voter registration is not legally required, and under a diverse array of state laws, individual voting-age citizens remain responsible for regis-tering to vote.
Source: ACE Electoral Knowledge Network and United Nations Development Program, data on Voter Registration and Voting Age, http://aceproject.org, accessed May 2010; “Felony Disenfranchisement in the United States,” The Sentencing Project, September 2008.
How We Compare
more than a hundred scientifi c studies of diverse GOTV tactics: door-to-door canvassing, leafl ets, direct mail, e-mail, phone calls, radio ads, television ads, and election-day festivals.5 Door-to-door can-vassing and phone calls were the only two tactics
Copyright 2012 Cengage Learning. All Rights Reserved. May not be copied, scanned, or duplicated, in whole or in part. Due to electronic rights, some third party content may be suppressed from the eBook and/or eChapter(s). Editorial review has deemed that any suppressed content does not materially affect the overall learning experience. Cengage Learning reserves the right to remove additional content at any time if subsequent rights restrictions require it.
The Rise of the American Electorate 187
of government we get. This question cannot be answered just by looking at voter turnout, the subject of this chapter; it also requires us to look at the composition and activities of political par-ties, interest groups, and the media (the subjects of later chapters).
Nonetheless, voting is important. To understand why participation in American elections takes the form that it does, we must fi rst understand how laws have determined who shall vote and under what circumstances.
The Rise of the American ElectorateIt is ironic that relatively few citizens vote in American elections, since it was in this country that the mass of people fi rst became eligible to vote. At the time the Constitution was ratifi ed, the vote was limited to property owners or taxpayers, but by the administration of Andrew Jackson (1829–1837) it had been broadened to include virtually all white male adults. Only in a few states did property restrictions persist: they were not abolished in New Jersey until 1844 or in North Carolina until 1856. And, of course, African American males could not vote in many states, in the North as well as the South, even if they were not slaves. Women could not vote in most states until the 20th century; Chinese Americans were widely denied the vote; and being in prison is grounds for losing the franchise even today. Aliens, on the other hand, often were allowed to vote if they had at least begun the process of becoming citizens. By 1880, only an estimated 14 percent of all adult males in the United States could not vote; in England in the same period, about 40 percent of adult males were disfranchised.7
FROM STATE TO FEDERAL CONTROLInitially, it was left entirely to the states to decide who could vote and for what offi ces. The Constitution gave Congress the right to pick the day on which presidential electors would gather and to alter state regulations regarding congressional elections. The only provision of the Constitution requiring a popu-lar election was the clause in Article I stating that members of the House of Representatives be chosen by the “people of the several states.”
Because of this permissiveness, early federal elec-tions varied greatly. Several states picked their
that demonstrated statistically signifi cant results; but even most prospective voters touched by these tactics did not turn out. In a separate 2008 study, they found that “social pressure” exerted through mailings increased turnout, yet 62 percent of those pressured still did not vote.6
Of course, voting is only one way of participating in politics. It is important (we could hardly be con-sidered a democracy if nobody voted), but it is not all-important. Joining civic associations, support-ing social movements, writing to legislators, fi ght-ing city hall—all these and other activities are ways of participating in politics. It is possible that, by these measures, Americans participate in politics more than most Europeans—or anybody else, for that matter. Moreover, it is possible that low rates of registration indicate that people are reasonably well satisfi ed with how the country is governed. If 100 percent of all adult Americans registered and voted (especially under a system that makes regis-tering relatively diffi cult), it could mean that people were deeply upset about how things were run. In short, it is not at all clear whether low voter turnout is a symptom of political disease or a sign of politi-cal good health.
The important question about participation is not how much participation there is but how different kinds of participation affect the kind
County or governmentregistration office(21.6%)
Don’t know/refusedto answer (13.5%)
At school, hospital,campus, or registrationbooth (12.5%)
At polls on electionday (6.3%)
All other methods (4.4%)
At public assistance agency (1.0%)
With driverslicense (21.2%)
Figure 8.1
Method of Registration to Vote, 2008Percent Distribution of Registered Voters
Source: U.S. Bureau of the Census, Current Population Survey, “Voting and Registration,” November 2008.
Copyright 2012 Cengage Learning. All Rights Reserved. May not be copied, scanned, or duplicated, in whole or in part. Due to electronic rights, some third party content may be suppressed from the eBook and/or eChapter(s). Editorial review has deemed that any suppressed content does not materially affect the overall learning experience. Cengage Learning reserves the right to remove additional content at any time if subsequent rights restrictions require it.
188 Chapter 8 Political Participation
they meant. By a series of decisions, it held that the Fifteenth Amendment did not necessarily confer the right to vote on anybody; it merely asserted that if someone was denied that right, the denial could not be explicitly on the grounds of race. And the burden of proving that it was race that led to the denial fell on the black who was turned away at the polls.8
This interpretation opened the door to three espe-cially notorious but then-legal devices to keep blacks from voting. One was a literacy test (a large pro-portion of former slaves were illiterate); another was a requirement that a poll tax be paid (most former slaves were poor); and the third was the practice of keeping blacks from voting in primary elections (in the one-party South, the only meaningful elec-tion was the Democratic primary). To allow whites who were illiterate or poor to vote, a grandfather clause was added to the law, saying that a person could vote, even if he did not meet the legal require-ments, if he or his ancestors voted before 1867 (blacks, of course, could not vote before 1867). When all else failed, blacks were intimidated, threatened, or harassed if they showed up at the polls.
members of the House at large (that is, statewide) rather than by district; others used districts but elected more than one representative from each. Some had their elections in odd-numbered years, and some even required that a congressional can-didate win a majority, rather than simply a plural-ity, of votes to be elected (when that requirement was in effect, runoff elections—in one case, as
many as twelve—were necessary). Furthermore, presidential elec-tors were at fi rst picked by state legislatures rather than by the voters directly.
Congress, by law and constitutional amendment, has steadily reduced state prerogatives in these mat-ters. In 1842, a federal law required that all members of the House be elected by districts; other laws over the years required that all federal elections be held in even-numbered years on the Tuesday following the fi rst Monday in November.
The most important changes in elec-tions have been those that extended the suffrage to women, African Americans, and 18-year-olds and made mandatory the direct popu-lar election of U.S. senators. The Fifteenth Amendment, adopted in 1870, said that the “right of citizens of the United States to vote shall not be denied or abridged by the United States or by any state on account of race, color, or previous condition of servitude.” Reading those words today, one would assume they gave African Americans the right to vote. That is not what the Supreme Court during the 1870s thought
Landmark Cases
Right to Vote• Smith v. Allwright (1944): Since political parties
select candidates for public offi ce, they may not exclude blacks from voting in their primary elections.
literacy test A requirement that citizens show that they can read before registering to vote.
poll tax A requirement that citizens pay a tax in order to register to vote.
grandfather clause A clause in registration laws allowing people who do not meet registration requirements to vote if they or their ancestors had voted before 1867.
white primary The practice of keeping blacks from voting in the southern states’ primaries through arbitrary use of registration requirements and intimidation.
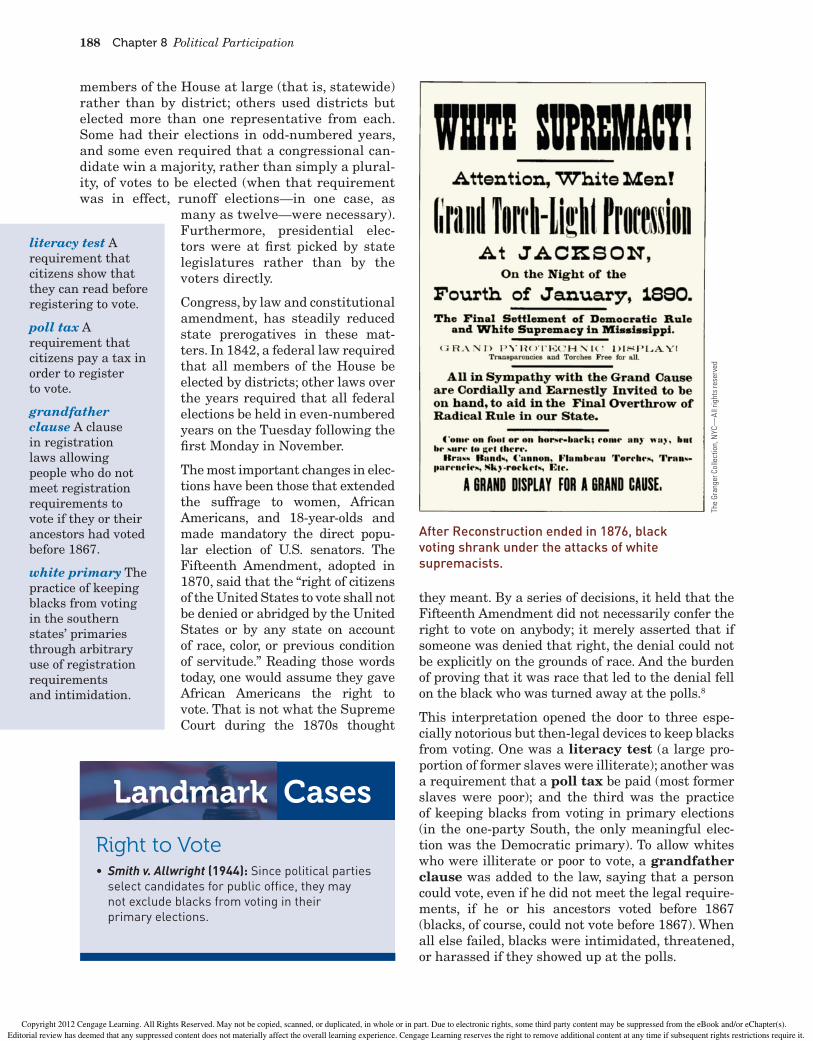
After Reconstruction ended in 1876, black voting shrank under the attacks of white supremacists.
Th
e G
ran
ge
r C
olle
ctio
n, N
YC
—A
ll ri
gh
ts r
ese
rve
d
Copyright 2012 Cengage Learning. All Rights Reserved. May not be copied, scanned, or duplicated, in whole or in part. Due to electronic rights, some third party content may be suppressed from the eBook and/or eChapter(s). Editorial review has deemed that any suppressed content does not materially affect the overall learning experience. Cengage Learning reserves the right to remove additional content at any time if subsequent rights restrictions require it.
The Rise of the American Electorate 189
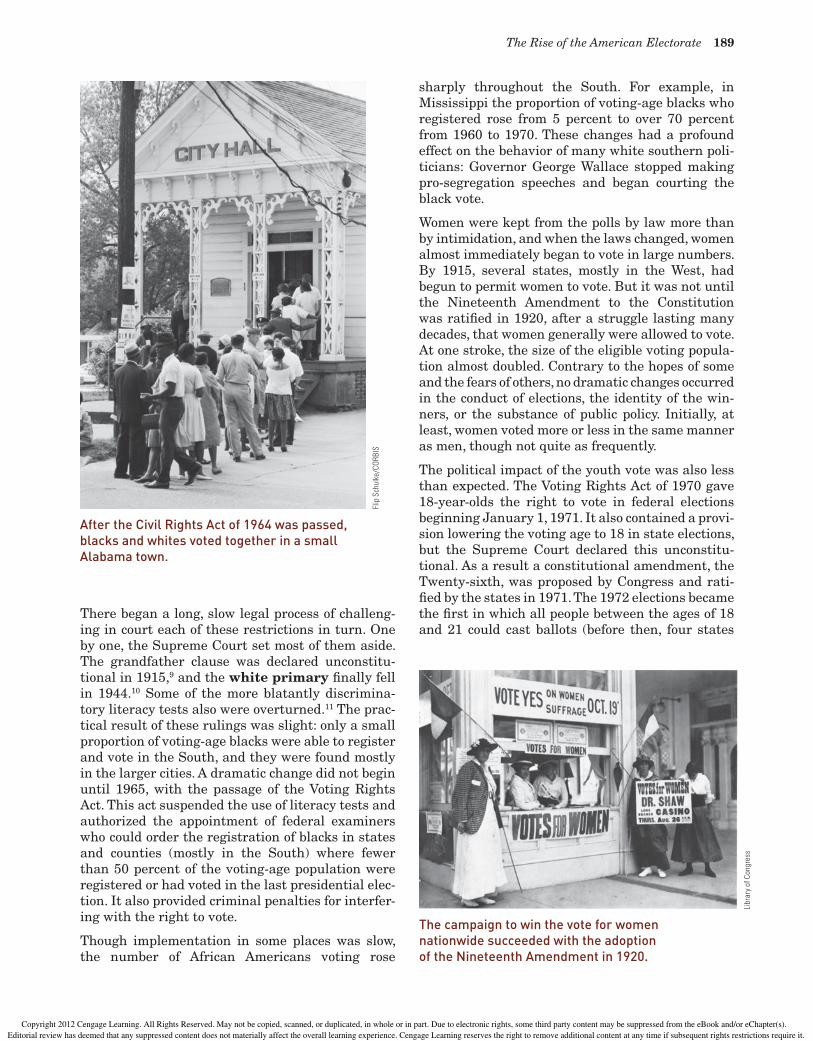
There began a long, slow legal process of challeng-ing in court each of these restrictions in turn. One by one, the Supreme Court set most of them aside. The grandfather clause was declared unconstitu-tional in 1915,9 and the white primary fi nally fell in 1944.10 Some of the more blatantly discrimina-tory literacy tests also were overturned.11 The prac-tical result of these rulings was slight: only a small proportion of voting-age blacks were able to register and vote in the South, and they were found mostly in the larger cities. A dramatic change did not begin until 1965, with the passage of the Voting Rights Act. This act suspended the use of literacy tests and authorized the appointment of federal examiners who could order the registration of blacks in states and counties (mostly in the South) where fewer than 50 percent of the voting-age population were registered or had voted in the last presidential elec-tion. It also provided criminal penalties for interfer-ing with the right to vote.
Though implementation in some places was slow, the number of African Americans voting rose
After the Civil Rights Act of 1964 was passed, blacks and whites voted together in a small Alabama town.
Flip
Sch
ulke
/CO
RB
IS
The campaign to win the vote for women nationwide succeeded with the adoption of the Nineteenth Amendment in 1920.
Lib
rary
of
Co
ng
ress
sharply throughout the South. For example, in Mississippi the proportion of voting-age blacks who registered rose from 5 percent to over 70 percent from 1960 to 1970. These changes had a profound effect on the behavior of many white southern poli-ticians: Governor George Wallace stopped making pro-segregation speeches and began courting the black vote.
Women were kept from the polls by law more than by intimidation, and when the laws changed, women almost immediately began to vote in large numbers. By 1915, several states, mostly in the West, had begun to permit women to vote. But it was not until the Nineteenth Amendment to the Constitution was ratifi ed in 1920, after a struggle lasting many decades, that women generally were allowed to vote. At one stroke, the size of the eligible voting popula-tion almost doubled. Contrary to the hopes of some and the fears of others, no dramatic changes occurred in the conduct of elections, the identity of the win-ners, or the substance of public policy. Initially, at least, women voted more or less in the same manner as men, though not quite as frequently.
The political impact of the youth vote was also less than expected. The Voting Rights Act of 1970 gave 18-year-olds the right to vote in federal elections beginning January 1, 1971. It also contained a provi-sion lowering the voting age to 18 in state elections, but the Supreme Court declared this unconstitu-tional. As a result a constitutional amendment, the Twenty-sixth, was proposed by Congress and rati-fi ed by the states in 1971. The 1972 elections became the fi rst in which all people between the ages of 18 and 21 could cast ballots (before then, four states
Copyright 2012 Cengage Learning. All Rights Reserved. May not be copied, scanned, or duplicated, in whole or in part. Due to electronic rights, some third party content may be suppressed from the eBook and/or eChapter(s). Editorial review has deemed that any suppressed content does not materially affect the overall learning experience. Cengage Learning reserves the right to remove additional content at any time if subsequent rights restrictions require it.
190 Chapter 8 Political Participation
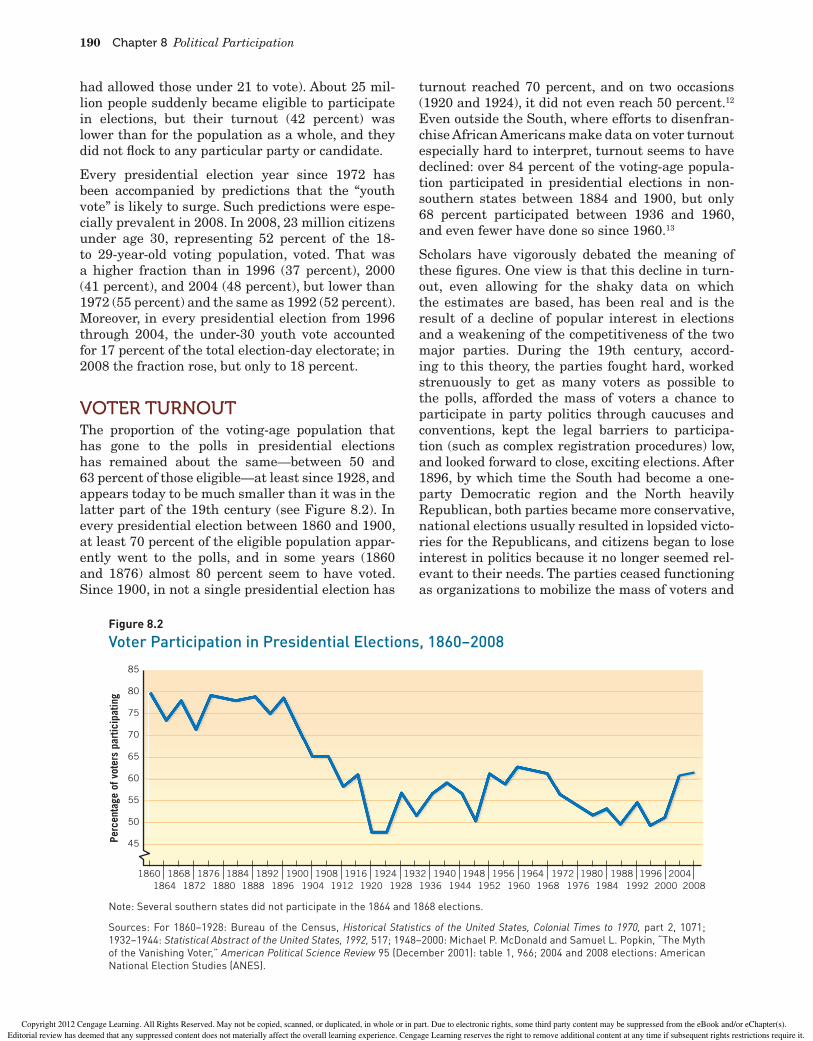
turnout reached 70 percent, and on two occasions (1920 and 1924), it did not even reach 50 percent.12 Even outside the South, where efforts to disenfran-chise African Americans make data on voter turnout especially hard to interpret, turnout seems to have declined: over 84 percent of the voting-age popula-tion participated in presidential elections in non-southern states between 1884 and 1900, but only 68 percent participated between 1936 and 1960, and even fewer have done so since 1960.13
Scholars have vigorously debated the meaning of these fi gures. One view is that this decline in turn-out, even allowing for the shaky data on which the estimates are based, has been real and is the result of a decline of popular interest in elections and a weakening of the competitiveness of the two major parties. During the 19th century, accord-ing to this theory, the parties fought hard, worked strenuously to get as many voters as possible to the polls, afforded the mass of voters a chance to participate in party politics through caucuses and conventions, kept the legal barriers to participa-tion (such as complex registration procedures) low, and looked forward to close, exciting elections. After 1896, by which time the South had become a one-party Democratic region and the North heavily Republican, both parties became more conservative, national elections usually resulted in lopsided victo-ries for the Republicans, and citizens began to lose interest in politics because it no longer seemed rel-evant to their needs. The parties ceased functioning as organizations to mobilize the mass of voters and
had allowed those under 21 to vote). About 25 mil-lion people suddenly became eligible to participate in elections, but their turnout (42 percent) was lower than for the population as a whole, and they did not fl ock to any particular party or candidate.
Every presidential election year since 1972 has been accompanied by predictions that the “youth vote” is likely to surge. Such predictions were espe-cially prevalent in 2008. In 2008, 23 million citizens under age 30, representing 52 percent of the 18- to 29-year-old voting population, voted. That was a higher fraction than in 1996 (37 percent), 2000 (41 percent), and 2004 (48 percent), but lower than 1972 (55 percent) and the same as 1992 (52 percent). Moreover, in every presidential election from 1996 through 2004, the under-30 youth vote accounted for 17 percent of the total election-day electorate; in 2008 the fraction rose, but only to 18 percent.
VOTER TURNOUTThe proportion of the voting-age population that has gone to the polls in presidential elections has remained about the same—between 50 and 63 percent of those eligible—at least since 1928, and appears today to be much smaller than it was in the latter part of the 19th century (see Figure 8.2). In every presidential election between 1860 and 1900, at least 70 percent of the eligible population appar-ently went to the polls, and in some years (1860 and 1876) almost 80 percent seem to have voted. Since 1900, in not a single presidential election has
Perc
enta
ge o
f vot
ers
part
icip
atin
g
85
80
75
70
65
60
55
50
45
1860 1868 1876 1884 1892 1900 1908 1916 1924 1932 1940 1948 1956 1964 1972 1980 1988 1996 20041864 1872 1880 1888 1896 1904 1912 1920 1928 1936 1944 1952 1960 1968 1976 1984 1992 2000 2008
Figure 8.2
Voter Participation in Presidential Elections, 1860–2008
Note: Several southern states did not participate in the 1864 and 1868 elections.
Sources: For 1860–1928: Bureau of the Census, Historical Statistics of the United States, Colonial Times to 1970, part 2, 1071; 1932–1944: Statistical Abstract of the United States, 1992, 517; 1948–2000: Michael P. McDonald and Samuel L. Popkin, “The Myth of the Vanishing Voter,” American Political Science Review 95 (December 2001): table 1, 966; 2004 and 2008 elections: American National Election Studies (ANES).
Copyright 2012 Cengage Learning. All Rights Reserved. May not be copied, scanned, or duplicated, in whole or in part. Due to electronic rights, some third party content may be suppressed from the eBook and/or eChapter(s). Editorial review has deemed that any suppressed content does not materially affect the overall learning experience. Cengage Learning reserves the right to remove additional content at any time if subsequent rights restrictions require it.
The Rise of the American Electorate 191
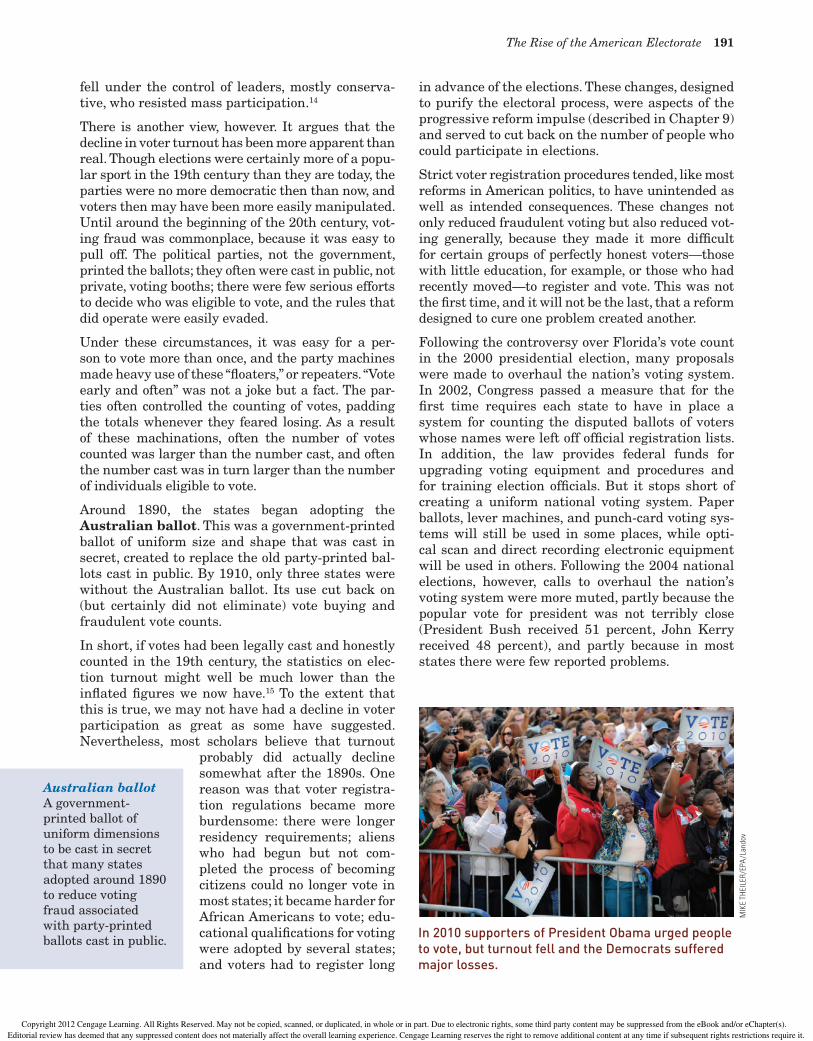
Australian ballot A government-printed ballot of uniform dimensions to be cast in secret that many states adopted around 1890 to reduce voting fraud associated with party-printed ballots cast in public. In 2010 supporters of President Obama urged people
to vote, but turnout fell and the Democrats suffered major losses.
MIK
E T
HE
ILE
R/E
PA/L
an
do
v
fell under the control of leaders, mostly conserva-tive, who resisted mass participation.14
There is another view, however. It argues that the decline in voter turnout has been more apparent than real. Though elections were certainly more of a popu-lar sport in the 19th century than they are today, the parties were no more democratic then than now, and voters then may have been more easily manipulated. Until around the beginning of the 20th century, vot-ing fraud was commonplace, because it was easy to pull off. The political parties, not the government, printed the ballots; they often were cast in public, not private, voting booths; there were few serious efforts to decide who was eligible to vote, and the rules that did operate were easily evaded.
Under these circumstances, it was easy for a per-son to vote more than once, and the party machines made heavy use of these “fl oaters,” or repeaters. “Vote early and often” was not a joke but a fact. The par-ties often controlled the counting of votes, padding the totals whenever they feared losing. As a result of these machinations, often the number of votes counted was larger than the number cast, and often the number cast was in turn larger than the number of individuals eligible to vote.
Around 1890, the states began adopting the Australian ballot. This was a government-printed ballot of uniform size and shape that was cast in secret, created to replace the old party-printed bal-lots cast in public. By 1910, only three states were without the Australian ballot. Its use cut back on (but certainly did not eliminate) vote buying and fraudulent vote counts.
In short, if votes had been legally cast and honestly counted in the 19th century, the statistics on elec-tion turnout might well be much lower than the infl ated fi gures we now have.15 To the extent that this is true, we may not have had a decline in voter participation as great as some have suggested. Nevertheless, most scholars believe that turnout
probably did actually decline somewhat after the 1890s. One reason was that voter registra-tion regulations became more burdensome: there were longer residency requirements; aliens who had begun but not com-pleted the process of becoming citizens could no longer vote in most states; it became harder for African Americans to vote; edu-cational qualifi cations for voting were adopted by several states; and voters had to register long
in advance of the elections. These changes, designed to purify the electoral process, were aspects of the progressive reform impulse (described in Chapter 9) and served to cut back on the number of people who could participate in elections.
Strict voter registration procedures tended, like most reforms in American politics, to have unintended as well as intended consequences. These changes not only reduced fraudulent voting but also reduced vot-ing generally, because they made it more diffi cult for certain groups of perfectly honest voters—those with little education, for example, or those who had recently moved—to register and vote. This was not the fi rst time, and it will not be the last, that a reform designed to cure one problem created another.
Following the controversy over Florida’s vote count in the 2000 presidential election, many proposals were made to overhaul the nation’s voting system. In 2002, Congress passed a measure that for the fi rst time requires each state to have in place a system for counting the disputed ballots of voters whose names were left off offi cial registration lists. In addition, the law provides federal funds for upgrading voting equipment and procedures and for training election offi cials. But it stops short of creating a uniform national voting system. Paper ballots, lever machines, and punch-card voting sys-tems will still be used in some places, while opti-cal scan and direct recording electronic equipment will be used in others. Following the 2004 national elections, however, calls to overhaul the nation’s voting system were more muted, partly because the popular vote for president was not terribly close (President Bush received 51 percent, John Kerry received 48 percent), and partly because in most states there were few reported problems.
Copyright 2012 Cengage Learning. All Rights Reserved. May not be copied, scanned, or duplicated, in whole or in part. Due to electronic rights, some third party content may be suppressed from the eBook and/or eChapter(s). Editorial review has deemed that any suppressed content does not materially affect the overall learning experience. Cengage Learning reserves the right to remove additional content at any time if subsequent rights restrictions require it.
192 Chapter 8 Political Participation
people.”18 Work, family, church, and other volun-tary activities come fi rst, both in terms of how Americans spend their time and in terms of the money they donate. For example, a study by Verba and others found that a higher proportion of citizens take part in nonpolitical than political activities: “More citizens reported giving time to church-related or charitable activities than indi-cated contacting a government offi cial or work-ing informally on a community problem, two of the most frequent forms of political participation beyond the vote.”19
In an earlier study, Verba and Nie analyzed the ways in which people participate in politics and came up with six forms of participation that are characteristic of six different kinds of U.S. citizens. About one-fi fth (22 percent) of the population is completely inactive: they rarely vote, they do not get involved in organizations, and they probably do not even talk about politics very much. These inactives typically have little education and low incomes and are relatively young. Many of them are African American. At the opposite extreme are the complete activists, constituting about one-ninth of the population (11 percent). These people are highly educated, have high incomes, and tend to be middle-aged rather than young or old. They tend to participate in all forms of politics.
Between these extremes are four categories of lim-ited forms of participation. The voting specialists are people who vote but do little else; they tend not to have much schooling or income and to be substan-tially older than the average person. Campaigners not only vote but also like to get involved in cam-paign activities. They are better educated than the average voter, but what seems to distinguish them most is their interest in the confl icts, passions, and
Even after all the legal changes are taken into account, there seems to have been a decline in citi-zen participation in elections. Between 1960 and 1980, the proportion of voting-age people casting a ballot in presidential elections fell by about 10 per-centage points, a drop that cannot be explained by how ballots were printed or how registration rules were rewritten. Nor can these factors explain why 1996 witnessed not only the lowest level of turnout (49 percent) in a presidential election since 1924 but also the single steepest four-year decline (from 55 percent in 1992) since 1920.
Actual trends in turnout aside, what if they gave an election and everyone came? Would universal turnout change national election outcomes and the content of public policy? It has long been argued that because the poor, less educated, and minori-ties are overrepresented among nonvoters, uni-versal turnout would strongly benefi t Democratic
candidates and liberal causes. But a careful study of this question found that the “party of nonvoters” largely mirrors the demographi-cally diverse and ideologically divided population that goes to the polls.16
Who Participates in Politics?To understand better why voter turnout declined and what, if anything, that decline may mean, we must fi rst look at who participates in politics.
FORMS OF PARTICIPATIONVoting is by far the most common form of political participation, while giving money to a candidate and being a member of a political organization are the least common. Many Americans exaggerate how frequently they vote or how active they are in poli-tics. In a study by Sidney Verba and Norman Nie, 72 percent of those interviewed said they voted “regularly” in presidential elections.17 Yet we know that since 1960, on average under 60 percent of the voting-age population has actually cast presiden-tial ballots. Obviously, many people claim to have voted when in fact they have not. If people misre-port their voting behavior, it is likely that they also misreport—that is, exaggerate—the extent to which they participate in other ways.
Indeed, most research shows that “politics is not at the heart of the day-to-day life of the American
activists People who tend to participate in all forms of politics.
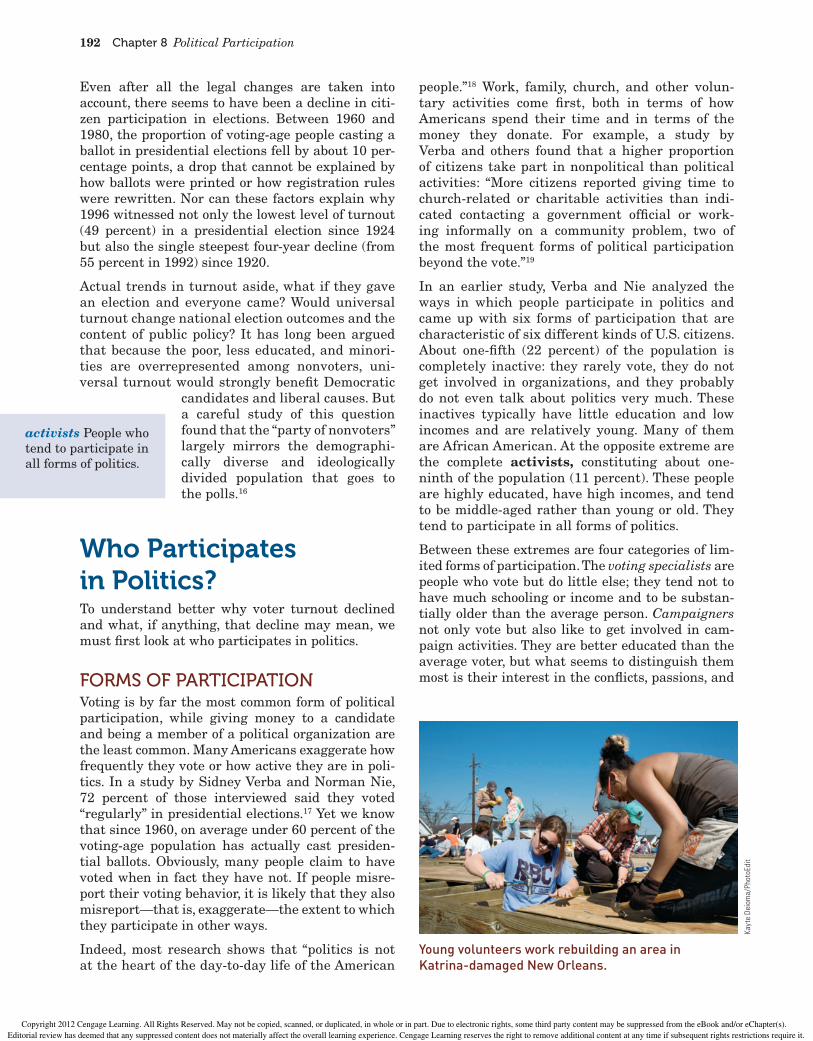
Young volunteers work rebuilding an area in Katrina-damaged New Orleans.
Ka
yte
Dei
om
a/P
ho
toE
dit
Copyright 2012 Cengage Learning. All Rights Reserved. May not be copied, scanned, or duplicated, in whole or in part. Due to electronic rights, some third party content may be suppressed from the eBook and/or eChapter(s). Editorial review has deemed that any suppressed content does not materially affect the overall learning experience. Cengage Learning reserves the right to remove additional content at any time if subsequent rights restrictions require it.
Who Participates in Politics? 193
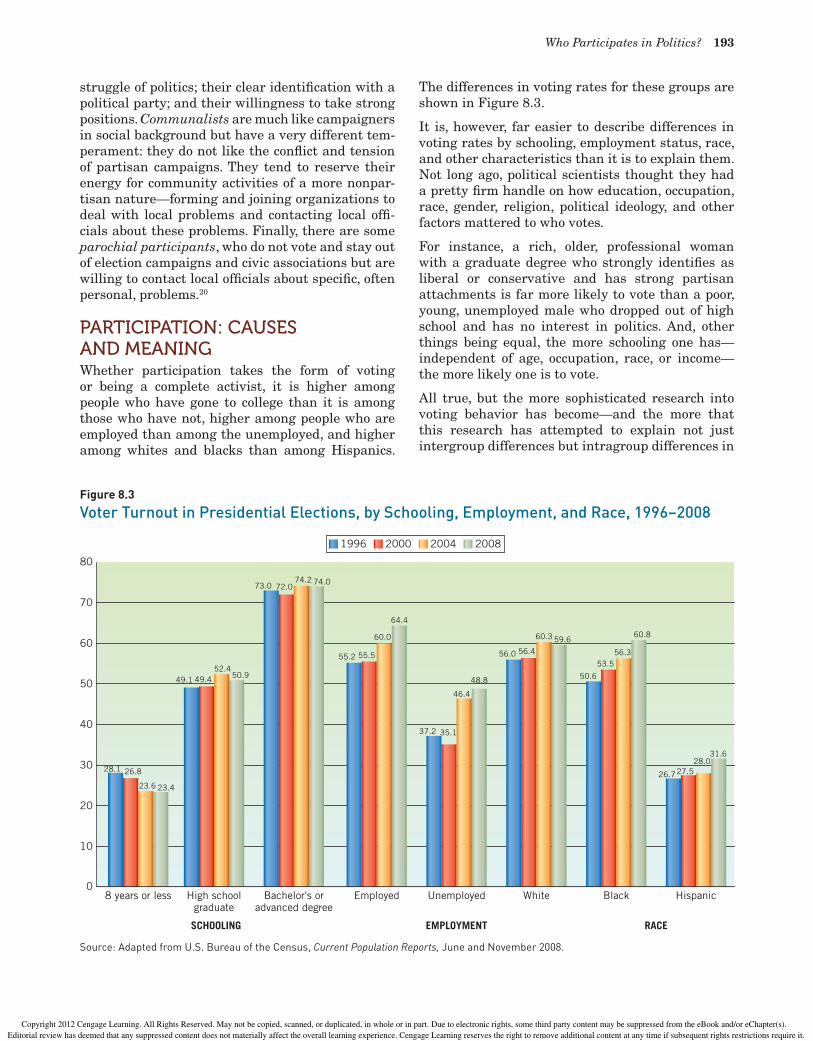
The differences in voting rates for these groups are shown in Figure 8.3.
It is, however, far easier to describe differences in voting rates by schooling, employment status, race, and other characteristics than it is to explain them. Not long ago, political scientists thought they had a pretty fi rm handle on how education, occupation, race, gender, religion, political ideology, and other factors mattered to who votes.
For instance, a rich, older, professional woman with a graduate degree who strongly identifi es as liberal or conservative and has strong partisan attachments is far more likely to vote than a poor, young, unemployed male who dropped out of high school and has no interest in politics. And, other things being equal, the more schooling one has— independent of age, occupation, race, or income—the more likely one is to vote.
All true, but the more sophisticated research into voting behavior has become—and the more that this research has attempted to explain not just intergroup differences but intragroup differences in
struggle of politics; their clear identifi cation with a political party; and their willingness to take strong positions. Communalists are much like campaigners in social background but have a very different tem-perament: they do not like the confl ict and tension of partisan campaigns. They tend to reserve their energy for community activities of a more nonpar-tisan nature—forming and joining organizations to deal with local problems and contacting local offi -cials about these problems. Finally, there are some parochial participants, who do not vote and stay out of election campaigns and civic associations but are willing to contact local offi cials about specifi c, often personal, problems.20
PARTICIPATION: CAUSES AND MEANINGWhether participation takes the form of voting or being a complete activist, it is higher among people who have gone to college than it is among those who have not, higher among people who are employed than among the unemployed, and higher among whites and blacks than among Hispanics.
0
10
20
30
40
50
60
70
80
8 years or less
28.1
49.1 49.452.4
50.9
73.0 72.074.2 74.0
55.2 55.5
60.0
64.4
37.2 35.1
46.4
48.8
56.0 56.4
60.3 59.6
50.6
53.556.3
60.8
31.6
26.727.528.0
26.8
23.6 23.4
High schoolgraduate
Bachelor's oradvanced degree
Employed Unemployed White Black Hispanic
1996 2000 2004 2008
SCHOOLING EMPLOYMENT RACE
Figure 8.3
Voter Turnout in Presidential Elections, by Schooling, Employment, and Race, 1996–2008
Source: Adapted from U.S. Bureau of the Census, Current Population Reports, June and November 2008.
Copyright 2012 Cengage Learning. All Rights Reserved. May not be copied, scanned, or duplicated, in whole or in part. Due to electronic rights, some third party content may be suppressed from the eBook and/or eChapter(s). Editorial review has deemed that any suppressed content does not materially affect the overall learning experience. Cengage Learning reserves the right to remove additional content at any time if subsequent rights restrictions require it.
194 Chapter 8 Political Participation
secretary of state, a county commissioner, a sher-iff, and clerks of various courts, as well as (in the cities) for the mayor, the city councilor, and school committee members and (in towns) for selectmen, town-meeting members, a town moderator, library trustees, health board members, assessors, water commissioners, the town clerk, housing authority members, the tree warden, and the commissioner of the public burial ground. (There are probably others whom we have forgotten.)
In many European nations, by contrast, the vot-ers get to make just one choice once every four or
voting behavior (some rich, old, politically engaged professional women don’t vote; some poor, young, politically disaffected men do vote)—the less confi -dence we can retain in broad generalizations about the causes of participation.
One interesting explanation is religion. As the Research Frontiers box on page 195 explains, by at least some measures, religion does seem to boost participation in politics and in civic life more gen-erally. Even with all the latest and best data at our disposal, however, it is wise to generalize with care: “religion increases participation” would be too sweeping, but “certain types of religious expression increase participation under some conditions” is about right.
The same caution applies when it comes to inter-preting the meaning of participation. Although Americans are going to the polls less than earlier generations did, they are campaigning, contact-ing government offi cials, and (here the evidence is clearest, especially for younger Americans) volun-teering and working on community issues no less and perhaps even more. And while the proportion of the population that votes is lower in the United States than in many other democracies, the per-centage of Americans who engage in one or more political activities beyond voting is higher (see Table 8.4).
Although we vote at lower rates in the United States than people do abroad, the meaning of our voting is different. For one thing, we elect far more pub-lic offi cials than the citizens of any other nation do. There are more than a half million elective offi ces in the United States, and just about every other week of the year there is an election going on somewhere in this country.
A citizen of Massachusetts, for example, votes not only for the U.S. president but also for two sena-tors, the state governor, the member of the House of Representatives for his or her district, a state representative, a state senator, the state attorney general, the state auditor, the state treasurer, the
Table 8.4 Political Participation Here and Abroad
Percent of People Who . . . USARank Among Twenty
Democracies Outranked by . . .
Tried to persuade others to vote for a candidate 44% 2nd Canada
Supported party by attending meeting, putting up poster 30% 2nd Canada
Donated money to political group 21% 1st None
Were contacted by party or candidate 47% 3rd Canada, Ireland
Source: Professor Martin Wattenberg, University of California-Irvine, using data from the Comparative Study of Electoral Systems.
In San Francisco, voting instructions are printed in English, Spanish, and Chinese.
Da
niel
Bro
dy/
Sto
ck B
ost
on
Copyright 2012 Cengage Learning. All Rights Reserved. May not be copied, scanned, or duplicated, in whole or in part. Due to electronic rights, some third party content may be suppressed from the eBook and/or eChapter(s). Editorial review has deemed that any suppressed content does not materially affect the overall learning experience. Cengage Learning reserves the right to remove additional content at any time if subsequent rights restrictions require it.
Who Participates in Politics? 195
fi ve years: they can vote for or against a member of parliament. When there is only one election for one offi ce every several years, that election is bound to assume more importance to voters than many elections for scores of offi ces. But one election for one offi ce probably has less effect on how the nation is governed than many elections for thousands of offi ces. Americans may not vote at high rates, but voting affects a far greater part of the political sys-tem here than abroad.
The kinds of people who vote in the United States also are different from those who vote abroad. Since almost everybody votes in many other democracies, the votes cast there mirror almost exactly the social composition of those nations. Since only slightly over half of the voting-age pop-ulation turns out even for presidential elections here, the votes cast in the United States may not truly refl ect the country.
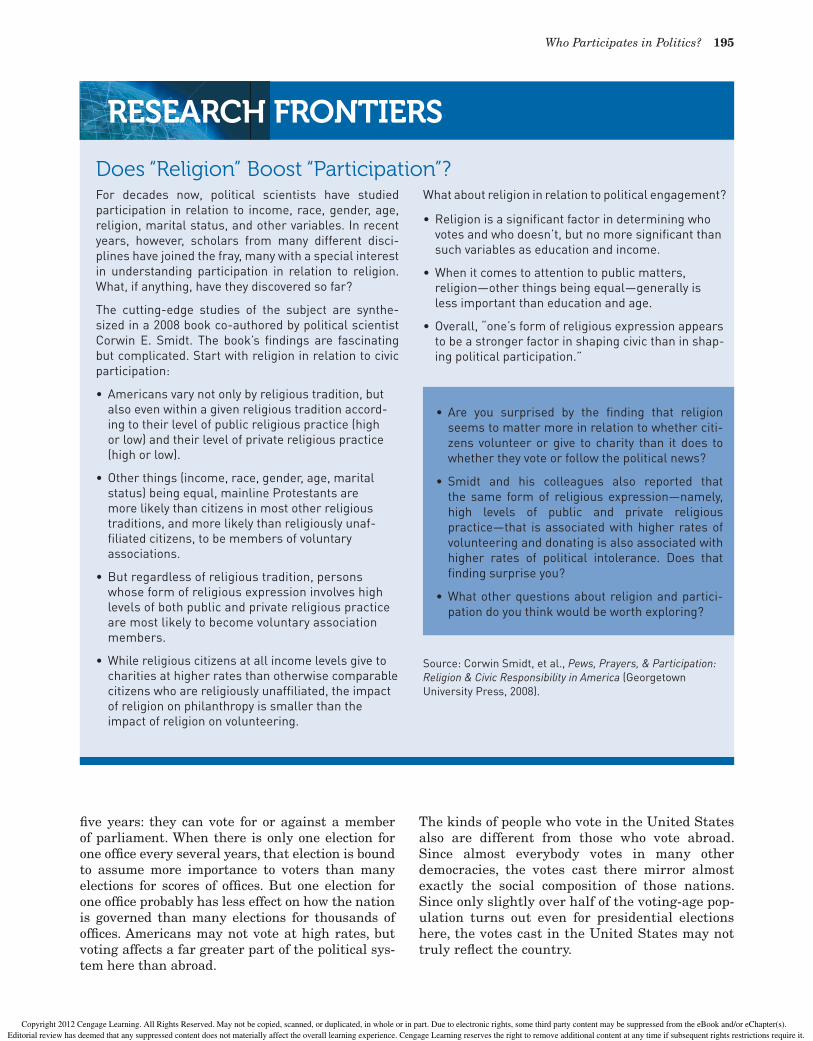
RESEARCH FRONTIERS
Does “Religion” Boost “Participation”?For decades now, political scientists have studied participation in relation to income, race, gender, age, religion, marital status, and other variables. In recent years, however, scholars from many different disci-plines have joined the fray, many with a special interest in understanding participation in relation to religion. What, if anything, have they discovered so far?
The cutting-edge studies of the subject are synthe-sized in a 2008 book co-authored by political scientist Corwin E. Smidt. The book’s fi ndings are fascinating but complicated. Start with religion in relation to civic participation:
• Americans vary not only by religious tradition, but also even within a given religious tradition accord-ing to their level of public religious practice (high or low) and their level of private religious practice (high or low).
• Other things (income, race, gender, age, marital status) being equal, mainline Protestants are more likely than citizens in most other religious traditions, and more likely than religiously unaf-fi liated citizens, to be members of voluntary associations.
• But regardless of religious tradition, persons whose form of religious expression involves high levels of both public and private religious practice are most likely to become voluntary association members.
• While religious citizens at all income levels give to charities at higher rates than otherwise comparable citizens who are religiously unaffi liated, the impact of religion on philanthropy is smaller than the impact of religion on volunteering.
What about religion in relation to political engagement?
• Religion is a signifi cant factor in determining who votes and who doesn’t, but no more signifi cant than such variables as education and income.
• When it comes to attention to public matters, religion—other things being equal—generally is less important than education and age.
• Overall, “one’s form of religious expression appears to be a stronger factor in shaping civic than in shap-ing political participation.”
Source: Corwin Smidt, et al., Pews, Prayers, & Participation: Religion & Civic Responsibility in America (Georgetown University Press, 2008).
• Are you surprised by the fi nding that religion seems to matter more in relation to whether citi-zens volunteer or give to charity than it does to whether they vote or follow the political news?
• Smidt and his colleagues also reported that the same form of religious expression—namely, high levels of public and private religious practice—that is associated with higher rates of volunteering and donating is also associated with higher rates of political intolerance. Does that fi nding surprise you?
• What other questions about religion and partici-pation do you think would be worth exploring?
Copyright 2012 Cengage Learning. All Rights Reserved. May not be copied, scanned, or duplicated, in whole or in part. Due to electronic rights, some third party content may be suppressed from the eBook and/or eChapter(s). Editorial review has deemed that any suppressed content does not materially affect the overall learning experience. Cengage Learning reserves the right to remove additional content at any time if subsequent rights restrictions require it.
196 Chapter 8 Political Participation
Latinos are the largest and fastest-growing minority group in America. Although they remain the most underrepresented group among all voters, the Latino share of the election-day electorate nearly doubled between 1996 (5 percent) and 2008 (9 percent). Until recently, little was known about the relationship between political participation and variables such as command of the language and involvement in non-political institutions such as workplaces, voluntary associations, and churches that provide information or impart skills relevant to politics.
But together with other recent research, a detailed 2008 study examined how ever more of the nation’s Latino citizens are participating in politics in con-junction with their participation in diverse urban church communities.21 Latino politics, it now seems clear, increasingly is taking shape as a form of hyphenated-American identity politics in which many Latino voters, including the young and the
poor, not only gain information and hone politically relevant skills via church membership but also attach quasi-religious meaning to many forms of civic engagement.
The popular view that Americans don’t vote as a result of apathy is not quite right. It is nearer to the truth to say that we don’t all register to vote and don’t always vote even when registered. There are many factors having nothing to do with apathy that shape our participation rates—age, race, party organization, the barriers to registration, and popu-lar views about the signifi cance of elections.
Compared to other nations, Americans vote at lower rates but more frequently and for many more offi ces, so elections make a bigger difference in the conduct of public affairs here than abroad. We also engage somewhat more frequently than people abroad in various nonelectoral forms of participation.
Copyright 2012 Cengage Learning. All Rights Reserved. May not be copied, scanned, or duplicated, in whole or in part. Due to electronic rights, some third party content may be suppressed from the eBook and/or eChapter(s). Editorial review has deemed that any suppressed content does not materially affect the overall learning experience. Cengage Learning reserves the right to remove additional content at any time if subsequent rights restrictions require it.
Who Participates in Politics? 197
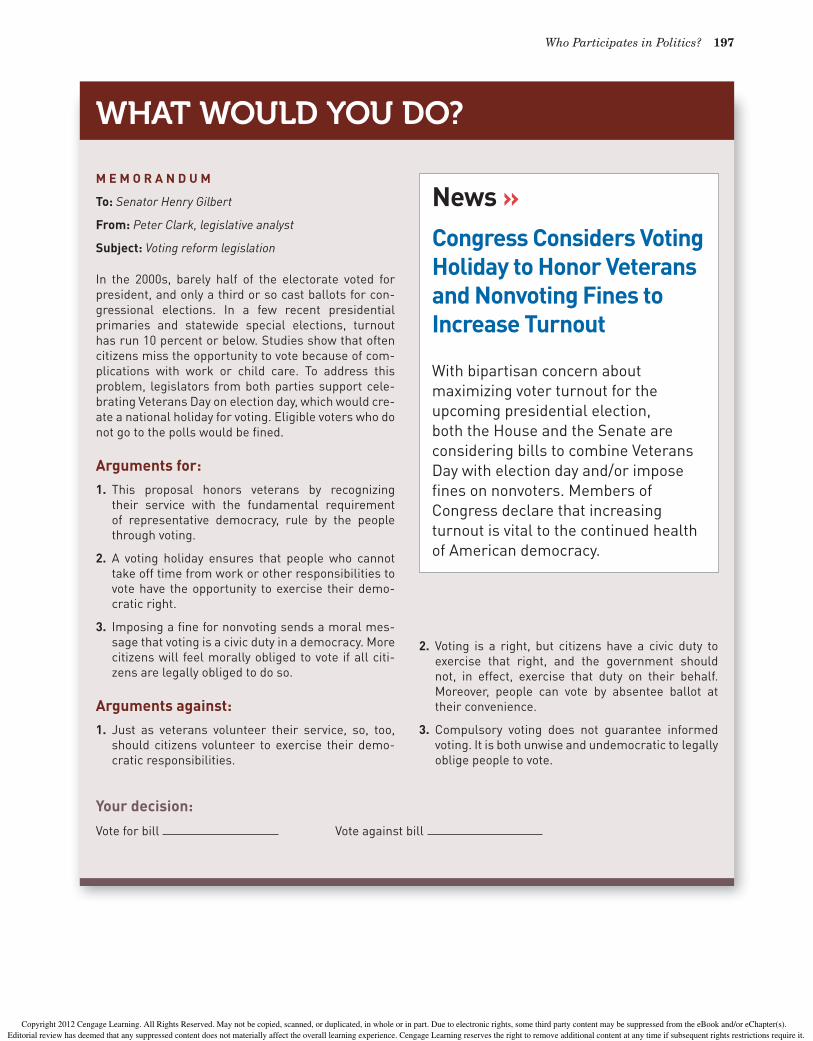
WHAT WOULD YOU DO?
M E M O R A N D U M
To: Senator Henry Gilbert
From: Peter Clark, legislative analyst
Subject: Voting reform legislation
In the 2000s, barely half of the electorate voted for president, and only a third or so cast ballots for con-gressional elections. In a few recent presidential primaries and statewide special elections, turnout has run 10 percent or below. Studies show that often citizens miss the opportunity to vote because of com-plications with work or child care. To address this problem, legislators from both parties support cele-brating Veterans Day on election day, which would cre-ate a national holiday for voting. Eligible voters who do not go to the polls would be fi ned.
Arguments for:1. This proposal honors veterans by recognizing
their service with the fundamental requirement of representative democracy, rule by the people through voting.
2. A voting holiday ensures that people who cannot take off time from work or other responsibilities to vote have the opportunity to exercise their demo-cratic right.
3. Imposing a fi ne for nonvoting sends a moral mes-sage that voting is a civic duty in a democracy. More citizens will feel morally obliged to vote if all citi-zens are legally obliged to do so.
Arguments against:1. Just as veterans volunteer their service, so, too,
should citizens volunteer to exercise their demo-cratic responsibilities.
Your decision:Vote for bill Vote against bill
2. Voting is a right, but citizens have a civic duty to exercise that right, and the government should not, in effect, exercise that duty on their behalf. Moreover, people can vote by absentee ballot at their convenience.
3. Compulsory voting does not guarantee informed voting. It is both unwise and undemocratic to legally oblige people to vote.
News »Congress Considers Voting Holiday to Honor Veterans and Nonvoting Fines to Increase Turnout
With bipartisan concern about maximizing voter turnout for the upcoming presidential election, both the House and the Senate are considering bills to combine Veterans Day with election day and/or impose fi nes on nonvoters. Members of Congress declare that increasing turnout is vital to the continued health of American democracy.
Copyright 2012 Cengage Learning. All Rights Reserved. May not be copied, scanned, or duplicated, in whole or in part. Due to electronic rights, some third party content may be suppressed from the eBook and/or eChapter(s). Editorial review has deemed that any suppressed content does not materially affect the overall learning experience. Cengage Learning reserves the right to remove additional content at any time if subsequent rights restrictions require it.
198 Chapter 8 Political Participation
LEARNING OBJECTIVES
WHAT YOU NEED TO KNOW
What is political participation?Political participation refers to the many different ways that people take part in politics and government. Voting is one of the most common and widely studied forms of political participation.
How are voter turnout rates measured?There are at least two ways to measure voter turnout, by voting-age population (all residents age 18 and older) and voting-eligible population (all residents age 18 and older excluding noncitizens, disenfranchised convicted felons, and others who are not eligible to vote); voter turnout rates are higher when measured according to the voter-eligible population.How, and how much, do most citizens participate?Most citizens vote at least on occasion in national elections and engage in one or more other forms of political participation, but maybe only one citizen in ten both votes regularly and participates regularly and in many different ways in politics and government.
RECONSIDERING WHO GOVERNS?1. Who votes, who doesn’t?
The most powerful determinants of voting are age (older people vote more than younger people) and education (college graduates vote more than high school graduates). Race makes a difference, but white rates, adjusted for income and other factors, are no longer consistently much higher than black rates; indeed, a higher percentage of blacks than whites voted in the 2008 presidential election.
2. Why do some people participate in politics at higher rates than others?Older people and college graduates have learned to have a greater interest in politics, in part because they see ways in which government policies will affect them, and in part because they may have acquired a political ideology that makes politics intrinsically interesting. As we have seen, Americans vote less than people in most other democratic nations. That gap is in part the result of the failure of many Americans to register to vote; efforts to increase registration, such as the motor-voter law, have gotten more names onto the voting rolls, but often these new additions do not vote as frequently as other registered voters.
Copyright 2012 Cengage Learning. All Rights Reserved. May not be copied, scanned, or duplicated, in whole or in part. Due to electronic rights, some third party content may be suppressed from the eBook and/or eChapter(s). Editorial review has deemed that any suppressed content does not materially affect the overall learning experience. Cengage Learning reserves the right to remove additional content at any time if subsequent rights restrictions require it.
Summary 199
RECONSIDERING TO WHAT ENDS?1. How did the Framers of the Constitution think average citizens should participate
in America’s representative democracy?The Framers believed citizens should play an important but not the decisive role in the American Republic. They elect the House, but until the Constitution was amended in 1913, they did not elect the Senate; the president and senators, not ordinary people, select federal judges; and the president is chosen by electors. Over time, the system has become much more responsive to public opinion. Voters now help pick party candidates through party primaries, and their views are regularly solicited by opinion polls.
2. Should today’s college-age citizens participate more in politics?We would say yes, but the fact is that many young adults seem less disposed to traditional forms of political activity, including voting, than they are toward other types of civic engagement, such as community service or volunteer work. One forecast to ponder: unless youth voting rates increase relative to those of senior citizens, then, on election day 2020, persons 65 and older (about 22 percent of the general population) will cast a quarter of all ballots, while persons 18 to 29 (about 21 percent of the general population) will account for less than an eighth of the voting electorate.
QUESTIONS TO CONSIDER1. Do you think that most people your
age are more likely to volunteer or do community service than they are to vote or get involved in political campaigns? How about you?
2. America has tens of thousands of federal, state, and local elected offi cials and millions of government workers (including the public employees known as public school teachers). But have you ever considered running for elected offi ce one day or maybe working for a government agency? Why or why not?
3. What is your best guess as to why, despite having virtually unlimited access via the Internet and other media to news, information, and opinion, only a small fraction of young people are highly attentive to politics and government?
4. What was the voter turnout rate in your home state in the last three
national elections, and how did it compare to the voter turnout rate nationally? Was there a signifi cant difference between the national rate and the rate in your state, and what factors do you suppose might explain it?
5. Are convicted felons permitted to vote in your home state? If not, how many persons in your state today are not eligible to vote as a result, and is there any legislative effort underway to restore their voting rights?
6. Can you name your own members of the U.S. Congress (House and Senate), your state senator and representative, the mayor or other chief executive of your local government, and any two members of your city council or other local legislative body? If not, look them up and learn them.
Copyright 2012 Cengage Learning. All Rights Reserved. May not be copied, scanned, or duplicated, in whole or in part. Due to electronic rights, some third party content may be suppressed from the eBook and/or eChapter(s). Editorial review has deemed that any suppressed content does not materially affect the overall learning experience. Cengage Learning reserves the right to remove additional content at any time if subsequent rights restrictions require it.
200 Chapter 8 Political Participation
Burnham, Walter Dean. Critical Elections and the Mainsprings of American Politics. New York: Norton, 1970. A classic argument about the decline of voter participation, linking it to changes in the economic system.
Eisner, Jane. Taking Back the Vote: Getting American Youth Involved in Our Democracy. Boston: Beacon Press, 2004. Highly readable account of why millennium-generation college-age Americans volunteer lots but vote little, with recommendations for getting young people more interested in politics.
Green, Donald P., and Alan S. Gerbec. Get Out the Vote!: How to Increase Voter Turnout. Washington, D.C.: Brookings Institution Press, 2nd edition, 2008. Excellent review of the evidence on what works—and what doesn’t—to get more people to the polls.
Verba, Sidney, Norman H. Nie, and Jae-on Kim. Participation and Political Equality. Cambridge: Cambridge University Press, 1978. Classic comparative study of political participation in seven nations.
Wattenberg, Martin P. Where Have All the Voters Gone? Cambridge, MA: Harvard University Press, 2002. An insightful account of why voter turnout in America has lagged behind voter turnout in most other well-established democracies.
Wilson, Catherine E. The Politics of Latino Faith: Religion, Identity, and Urban Community. New York: New York University Press, 2008. Richly detailed study of how Latino religious life intersects with politics in three cities.
TO LEARN MOREInformation for voters:DemocracyNet: www.congress.org/congressorg/e4/League of Women Voters: www.lwv.org/Voter Information Services: www.vis.org/Women’s Voting Guide: www.womenvote.org/resourcesNational Mail Voter Registration Form: www.fec.gov/votregis/vr.shtmlThe Vanishing Voter: www.vanishingvoter.org/Voter turnout statistics: www.fec.gov/pages/electpg.htm
Copyright 2012 Cengage Learning. All Rights Reserved. May not be copied, scanned, or duplicated, in whole or in part. Due to electronic rights, some third party content may be suppressed from the eBook and/or eChapter(s). Editorial review has deemed that any suppressed content does not materially affect the overall learning experience. Cengage Learning reserves the right to remove additional content at any time if subsequent rights restrictions require it.