Embed Size (px)
Citation preview
1
Olympic College 2014 Financial Report Table of Contents Trustees and Administrative Officers ............................................................................................. 2
Management’s Discussion and Analysis ........................................................................................ 3
Independent Auditor’s Report on Financial Statements ............................................................... 12
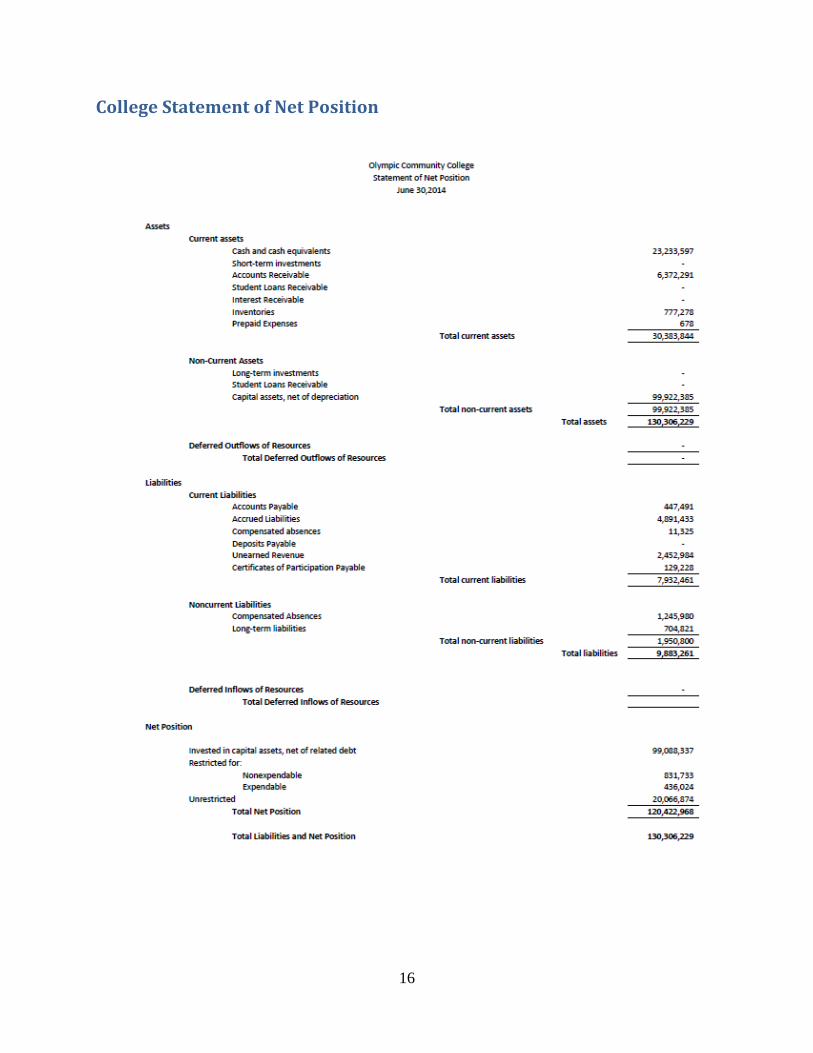
College Statement of Net Position ................................................................................................ 16
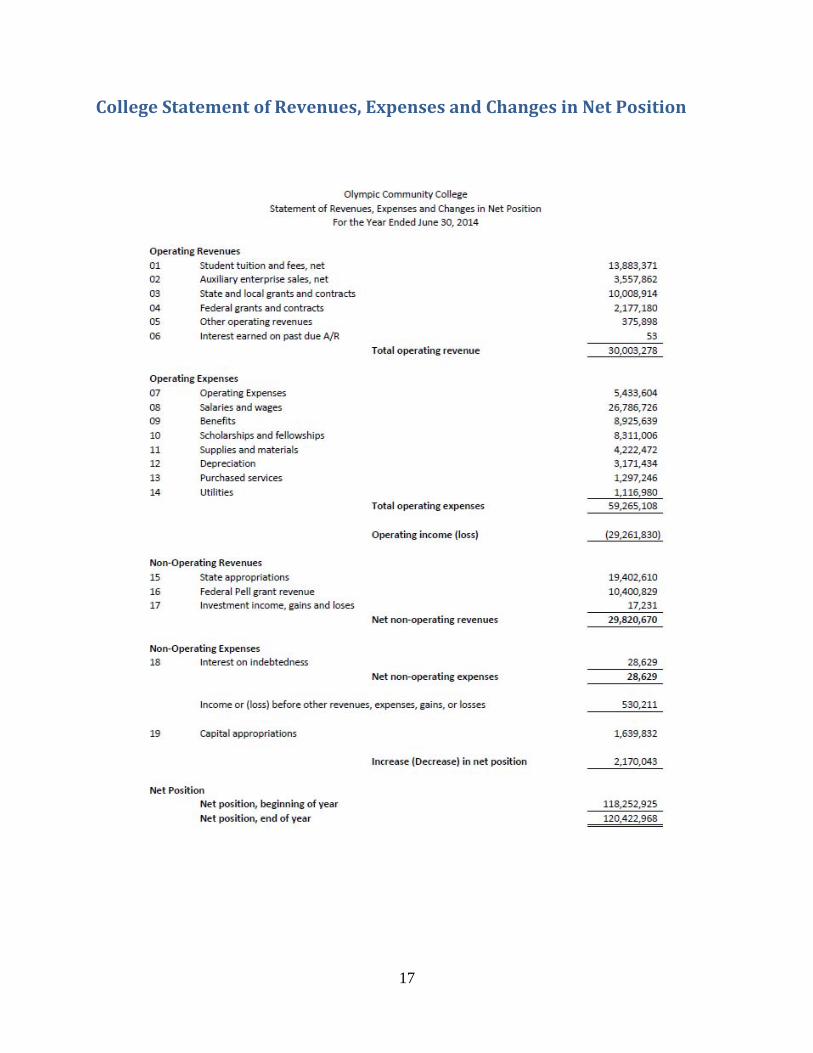
College Statement of Revenues, Expenses and Changes in Net Position ..................................... 17
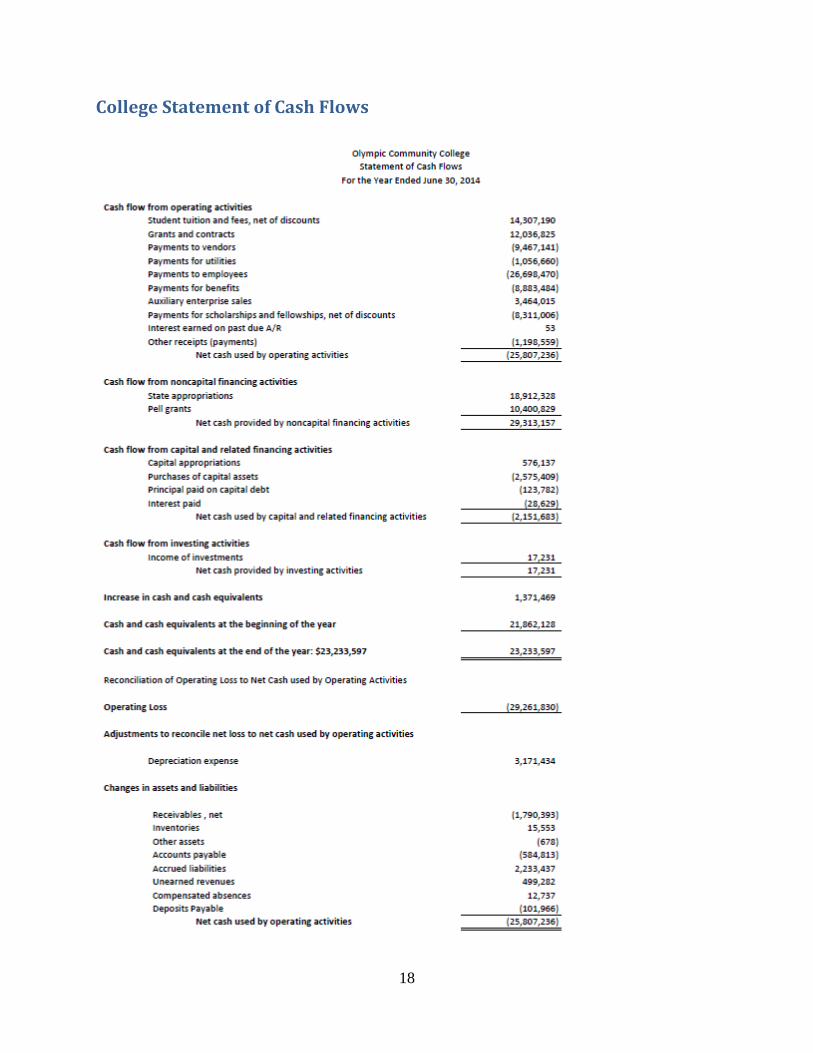
College Statement of Cash Flows ................................................................................................. 18
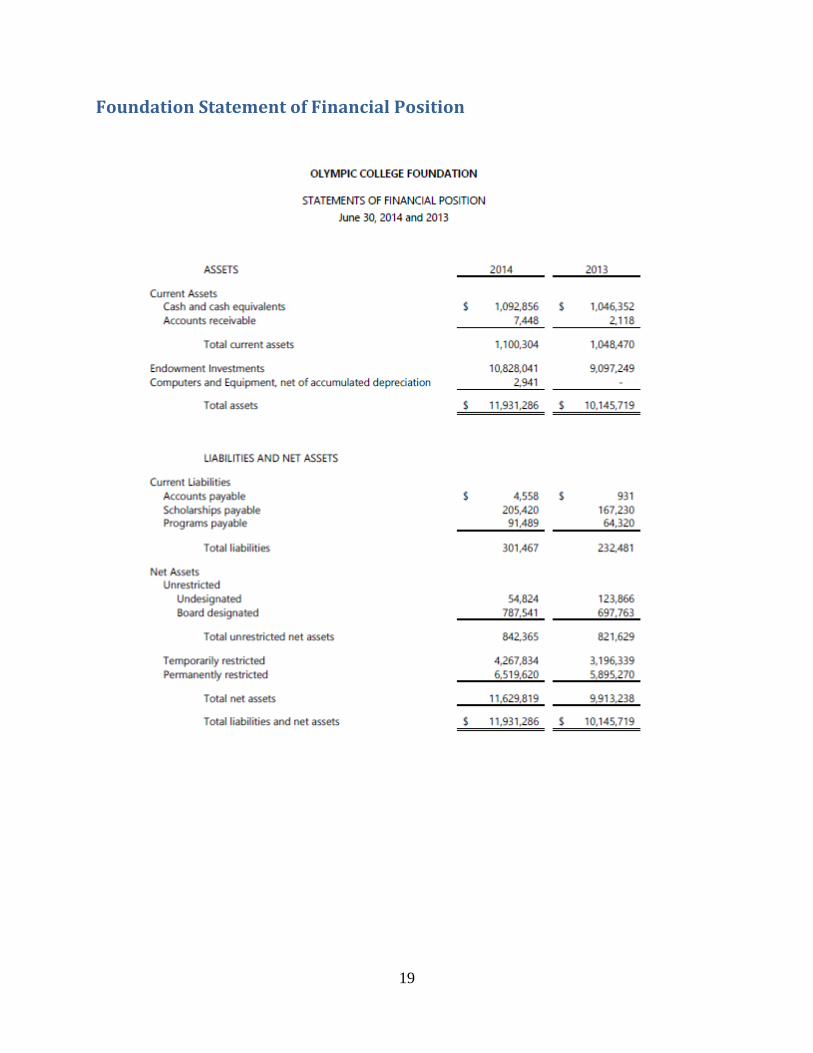
Foundation Statement of Financial Position ................................................................................. 19
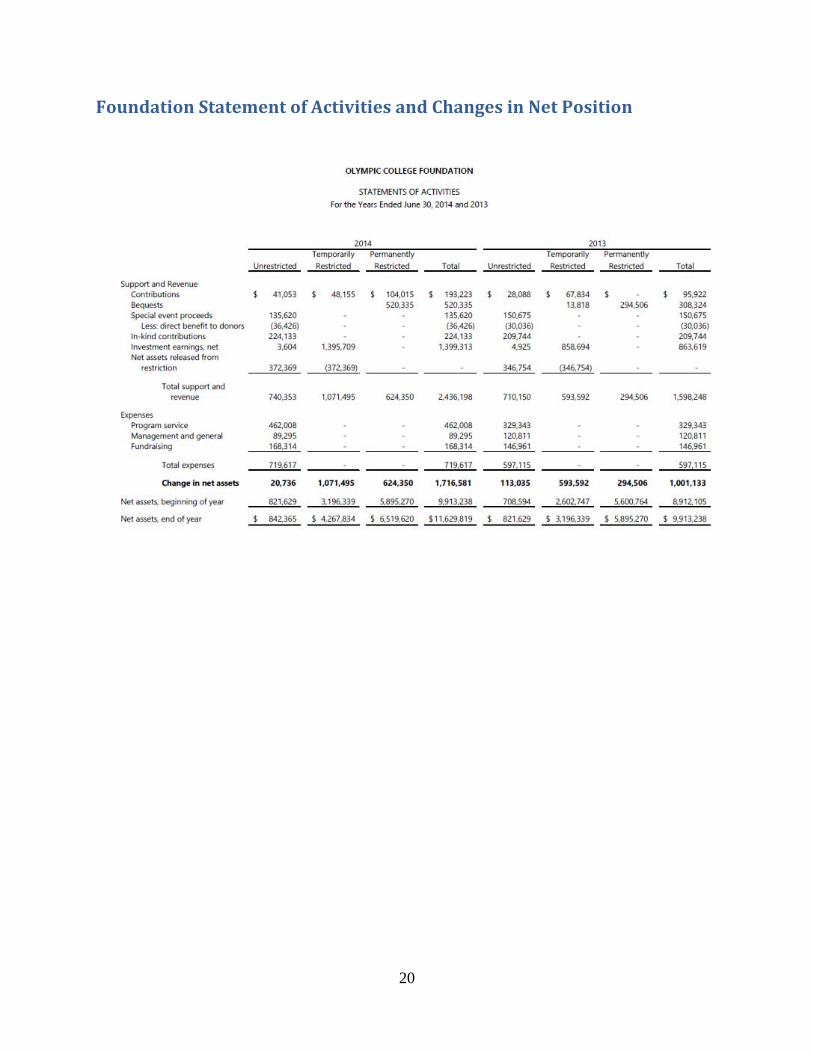
Foundation Statement of Activities and Changes in Net Position ................................................ 20
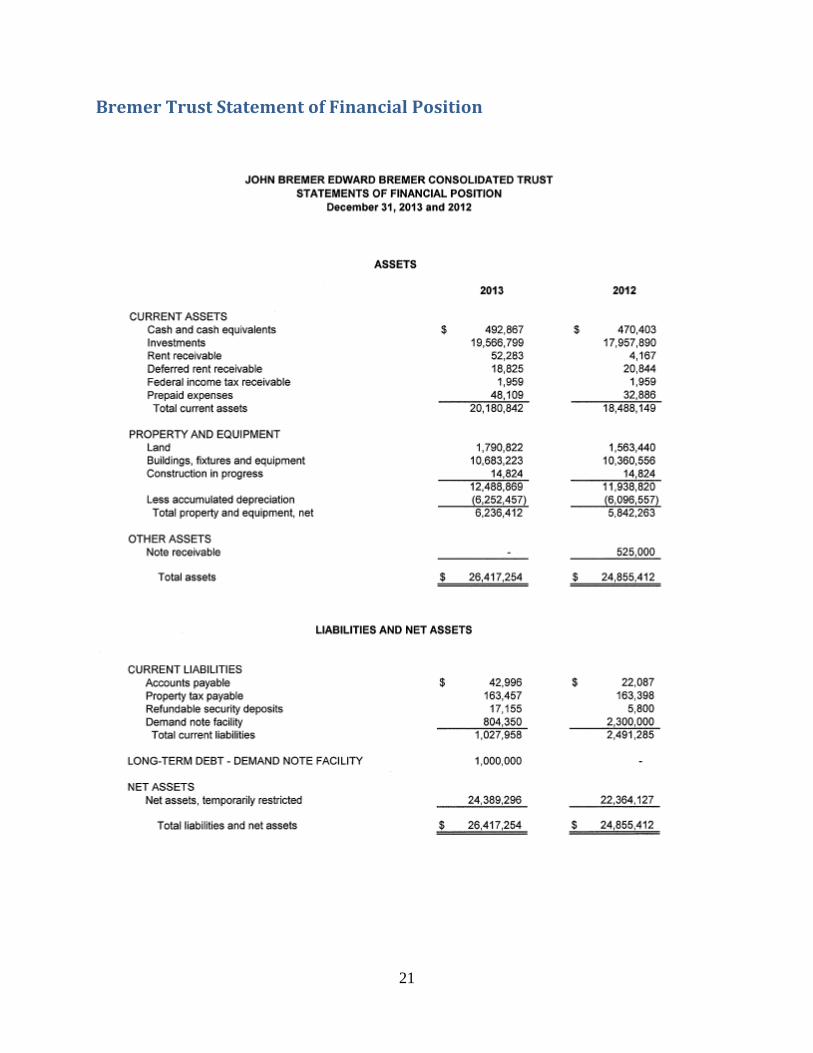
Bremer Trust Statement of Financial Position .............................................................................. 21
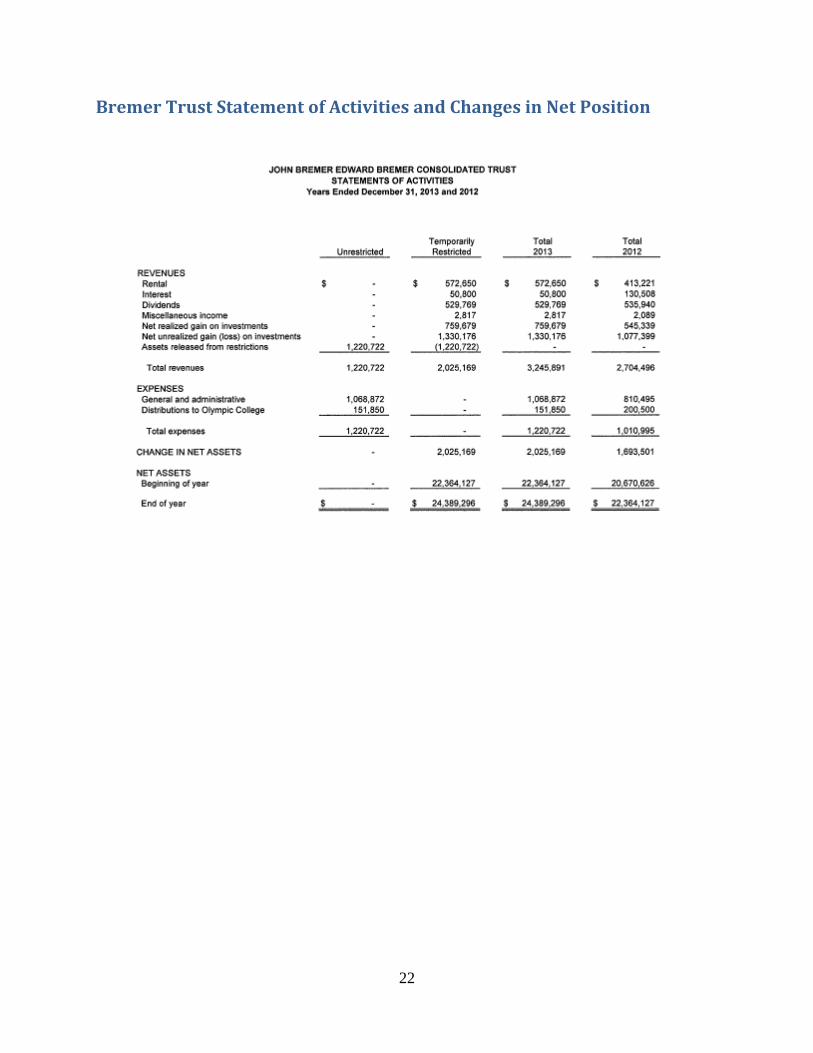
Bremer Trust Statement of Activities and Changes in Net Position ............................................. 22
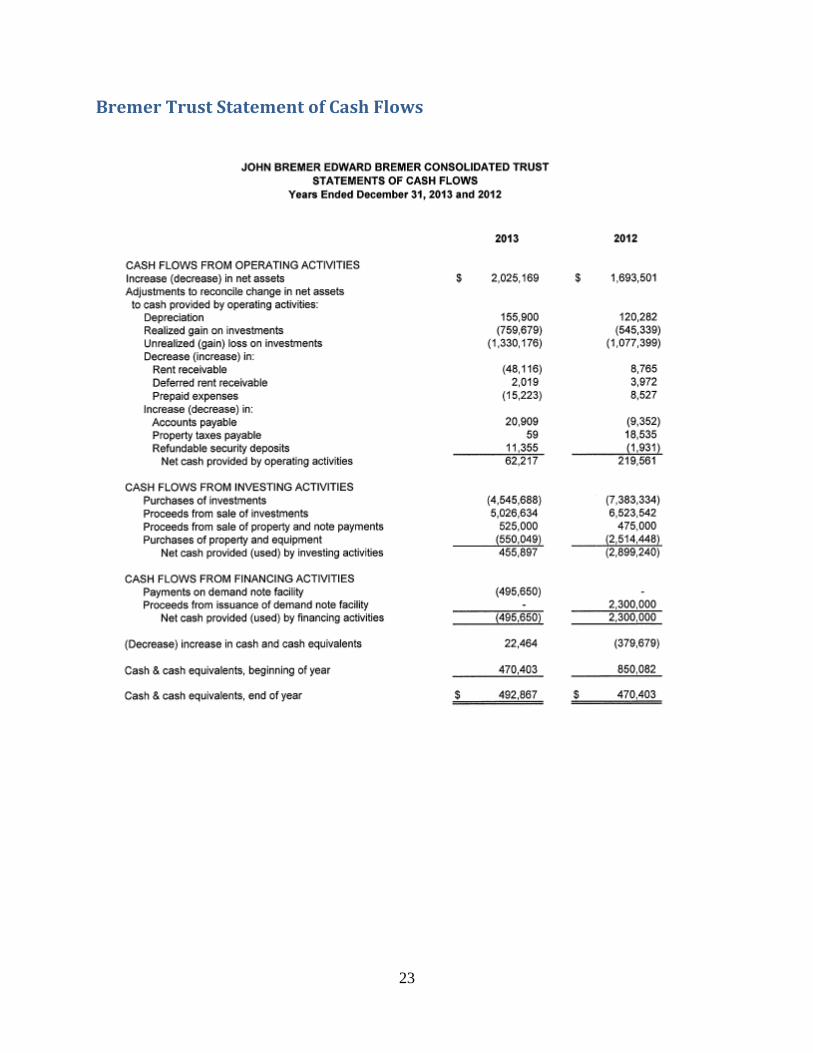
Bremer Trust Statement of Cash Flows ........................................................................................ 23
Notes to the Financial Statements ................................................................................................. 24
For information about the financial data included in this report, contact: Janell Whiteley, Director of Business Services Olympic College 1600 Chester Avenue Bremerton, WA 98337 (360) 475-7504
2
TrusteesandAdministrativeOfficers BOARD OF TRUSTEES Jim Page, Chair Bev Cheney, Vice Chair Darlene Peters Alice Tawresey Steve Warner EXECUTIVE OFFICERS Dr. David Mitchell, President Dr. Damon Bell, Vice President for Student Achievement Mary Garguile, Vice President for Instruction Bruce Riveland, Vice President for Administrative Services ACADEMIC DEANS Mark Harrison, Dean, Math, Science and Health Occupations Dr. Gina Huston, Dean, Social Sciences and Humanities Norma Whitacre, Dean, Business and Technology Trustees and Officer list effective as of December 31, 2014

3
Management’s Discussion and Analysis
OlympicCollege The following discussion and analysis provides an overview of the financial position and activities of Olympic College (the College) for the fiscal year ended June 30, 2014 (FY 2014). The 2014 report constitutes the college’s inaugural audited financial statements. This overview provides readers with an objective and easily readable analysis of the College’s financial performance for the year, based on currently known facts and conditions. This discussion has been prepared by management and should be read in conjunction with the College’s financial statements and accompanying note disclosures. Reporting Entity Olympic College is one of thirty public community and technical college districts in the state of Washington, providing comprehensive, open-door academic programs, workforce education, basic skills and community service educational programs to approximately 12,000 students. The College confers bachelor’s degrees, associates degrees, certificates and high school diplomas. The College was established in 1946 and its primary purpose is to enrich our diverse communities through quality education and support so students achieve their educational goals. The College’s main campuses are located in Bremerton, Poulsbo and Shelton, with the majority of students enrolling in courses at the Bremerton campus. The College is governed by a five member Board of Trustees appointed by the governor of the state with the consent of the state Senate. By statute, the Board of Trustees has full control of the College, except as otherwise provided by law. Using the Financial Statements The financial statements presented in this report encompass the College and it’s discretely presented component units. The College’s financial statements include the Statement of Net Position; the Statement of Revenues, Expenses and Changes in Net Position, and the Statement of Cash Flows. The Statement of Net Position provides information about the College at a moment in time, at year-end. The Statement of Revenue, Expenses and Changes in Net Position and the Statement of Cash flows provide information about operations and activities over a period of time. Together, these statements, along with the accompanying notes, provide a comprehensive way to assess the college’s financial health as a whole. The Statement of Net Position and Statement of Revenues, Expenses and Changes in Net position are reported under the accrual basis of accounting where all of the current year’s revenues and expenses are taken into account regardless of when cash is received or payments are made. Full accrual statements are intended to provide a view of the College’s financial position similar to that presented by most private-sector companies. These financial statements are prepared in accordance with generally accepted accounting principles as prescribed by the Governmental Accounting Standards Board (GASB), which establishes standards for external financial reporting for public colleges and universities. The full scope of the College’s activities
4
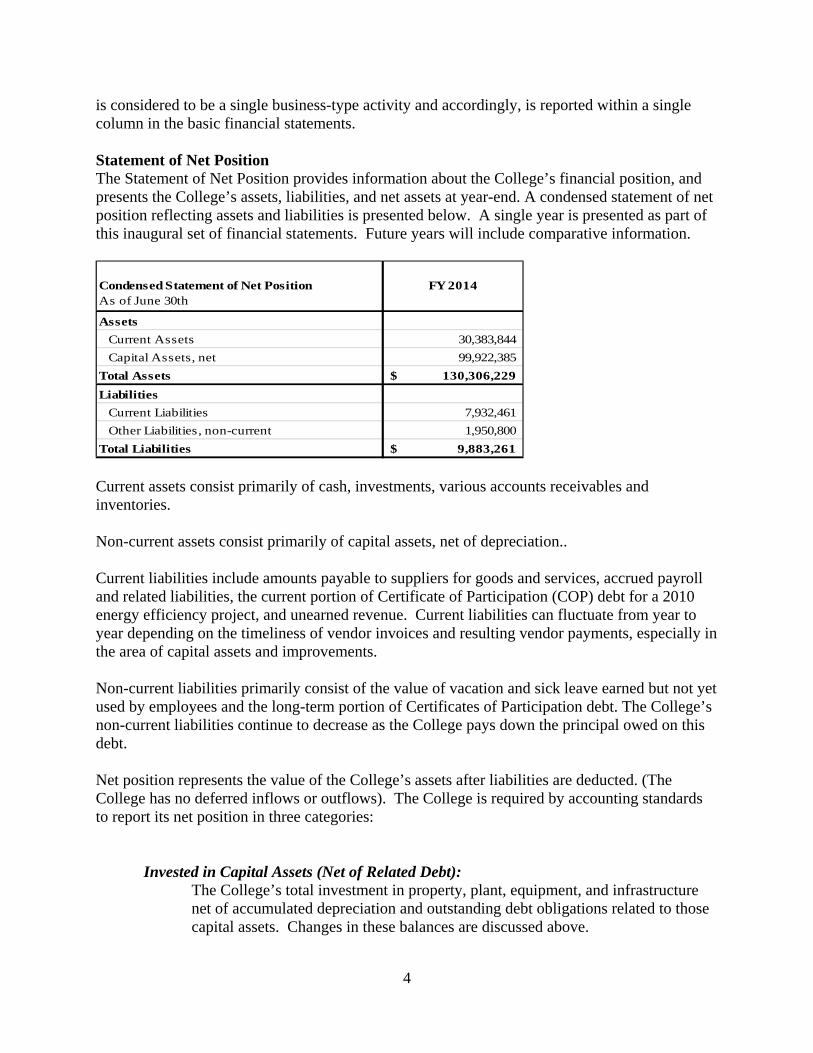
is considered to be a single business-type activity and accordingly, is reported within a single column in the basic financial statements. Statement of Net Position The Statement of Net Position provides information about the College’s financial position, and presents the College’s assets, liabilities, and net assets at year-end. A condensed statement of net position reflecting assets and liabilities is presented below. A single year is presented as part of this inaugural set of financial statements. Future years will include comparative information.
Condensed Statement of Net PositionAs of June 30th
FY 2014
Assets
Current Assets 30,383,844
Capital Assets, net 99,922,385
Total Assets 130,306,229$
Liabilities
Current Liabilities 7,932,461
Other Liabilities, non-current 1,950,800
Total Liabilities 9,883,261$ Current assets consist primarily of cash, investments, various accounts receivables and inventories. Non-current assets consist primarily of capital assets, net of depreciation.. Current liabilities include amounts payable to suppliers for goods and services, accrued payroll and related liabilities, the current portion of Certificate of Participation (COP) debt for a 2010 energy efficiency project, and unearned revenue. Current liabilities can fluctuate from year to year depending on the timeliness of vendor invoices and resulting vendor payments, especially in the area of capital assets and improvements. Non-current liabilities primarily consist of the value of vacation and sick leave earned but not yet used by employees and the long-term portion of Certificates of Participation debt. The College’s non-current liabilities continue to decrease as the College pays down the principal owed on this debt. Net position represents the value of the College’s assets after liabilities are deducted. (The College has no deferred inflows or outflows). The College is required by accounting standards to report its net position in three categories:
Invested in Capital Assets (Net of Related Debt): The College’s total investment in property, plant, equipment, and infrastructure net of accumulated depreciation and outstanding debt obligations related to those capital assets. Changes in these balances are discussed above.
5
Restricted: Non Expendable – consists of funds in which a donor or external party has imposed the restriction that the corpus or principal is not available for expenditures but for investment purposes only. The non-expendable funds for the College are endowments and unearned revenues. Expendable – resources the College is legally or contractually obligated to spend in accordance with restrictions placed by donor and/or external parties who have placed time or purpose restrictions on the use of the asset. The expendable funds for the College are the interest earnings from Endowments as well as the fund balance for 860 (Institutions of Higher Education 3 1/2% loan fund) The amount available from endowments for expenditure in 2014 totaled $9,033.29, of which $6,317.65 is reflected on the Statement of Net Position as Restricted: Expendable.
Unrestricted:
Includes all other assets not subject to externally imposed restrictions, but which may be designated or obligated for specific purposes by the Board of Trustees or management. These balances include contributions from the Bremer Trust. Prudent balances are maintained for use as working capital, as a reserve against emergencies and for other purposes, in accordance with policies established by the Board of Trustees.
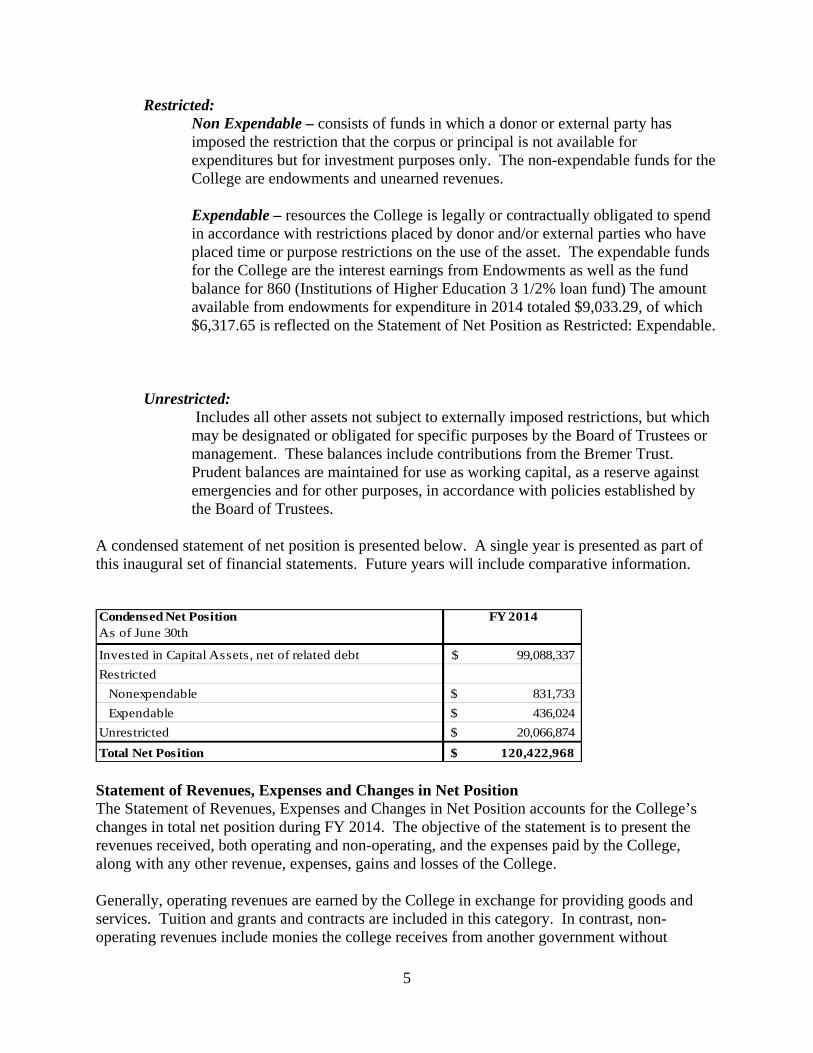
A condensed statement of net position is presented below. A single year is presented as part of this inaugural set of financial statements. Future years will include comparative information. Condensed Net PositionAs of June 30th
FY 2014
Invested in Capital Assets, net of related debt 99,088,337$
Restricted
Nonexpendable 831,733$
Expendable 436,024$
Unrestricted 20,066,874$
Total Net Position 120,422,968$ Statement of Revenues, Expenses and Changes in Net Position The Statement of Revenues, Expenses and Changes in Net Position accounts for the College’s changes in total net position during FY 2014. The objective of the statement is to present the revenues received, both operating and non-operating, and the expenses paid by the College, along with any other revenue, expenses, gains and losses of the College. Generally, operating revenues are earned by the College in exchange for providing goods and services. Tuition and grants and contracts are included in this category. In contrast, non-operating revenues include monies the college receives from another government without
6
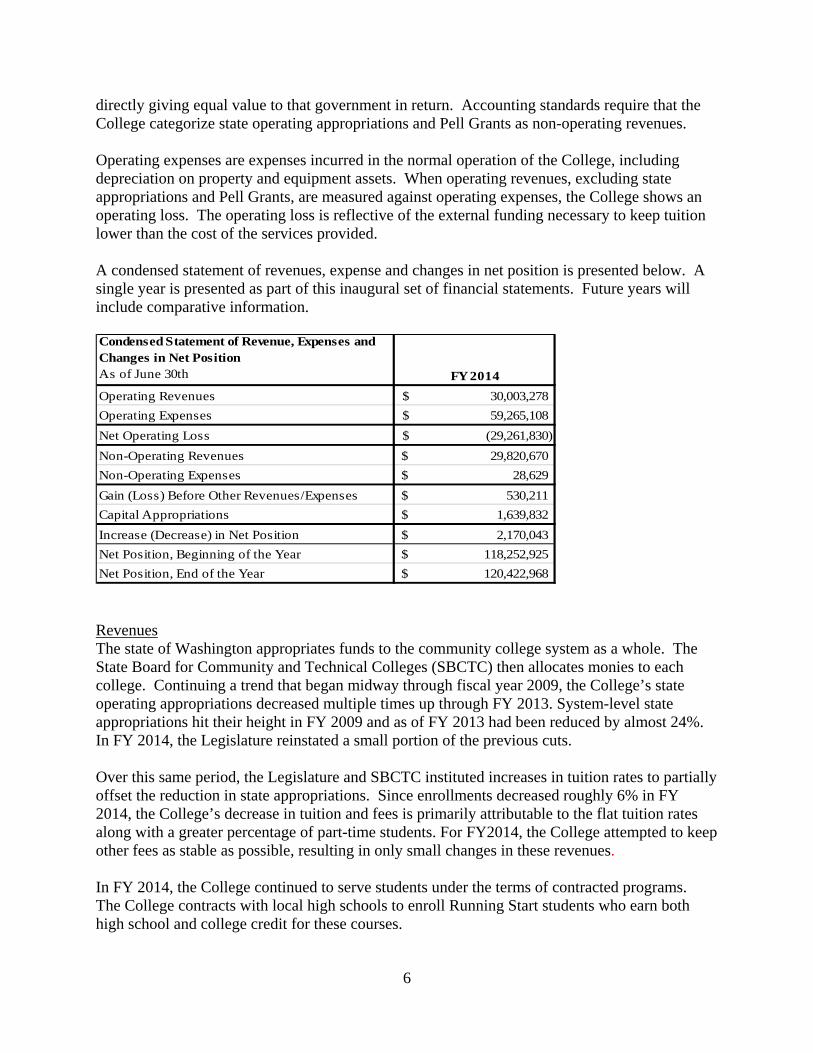
directly giving equal value to that government in return. Accounting standards require that the College categorize state operating appropriations and Pell Grants as non-operating revenues. Operating expenses are expenses incurred in the normal operation of the College, including depreciation on property and equipment assets. When operating revenues, excluding state appropriations and Pell Grants, are measured against operating expenses, the College shows an operating loss. The operating loss is reflective of the external funding necessary to keep tuition lower than the cost of the services provided. A condensed statement of revenues, expense and changes in net position is presented below. A single year is presented as part of this inaugural set of financial statements. Future years will include comparative information. Condensed Statement of Revenue, Expenses and Changes in Net PositionAs of June 30th FY 2014
Operating Revenues 30,003,278$
Operating Expenses 59,265,108$
Net Operating Loss (29,261,830)$
Non-Operating Revenues 29,820,670$
Non-Operating Expenses 28,629$
Gain (Loss) Before Other Revenues/Expenses 530,211$
Capital Appropriations 1,639,832$
Increase (Decrease) in Net Position 2,170,043$
Net Position, Beginning of the Year 118,252,925$
Net Position, End of the Year 120,422,968$ Revenues The state of Washington appropriates funds to the community college system as a whole. The State Board for Community and Technical Colleges (SBCTC) then allocates monies to each college. Continuing a trend that began midway through fiscal year 2009, the College’s state operating appropriations decreased multiple times up through FY 2013. System-level state appropriations hit their height in FY 2009 and as of FY 2013 had been reduced by almost 24%. In FY 2014, the Legislature reinstated a small portion of the previous cuts. Over this same period, the Legislature and SBCTC instituted increases in tuition rates to partially offset the reduction in state appropriations. Since enrollments decreased roughly 6% in FY 2014, the College’s decrease in tuition and fees is primarily attributable to the flat tuition rates along with a greater percentage of part-time students. For FY2014, the College attempted to keep other fees as stable as possible, resulting in only small changes in these revenues. In FY 2014, the College continued to serve students under the terms of contracted programs. The College contracts with local high schools to enroll Running Start students who earn both high school and college credit for these courses.
7
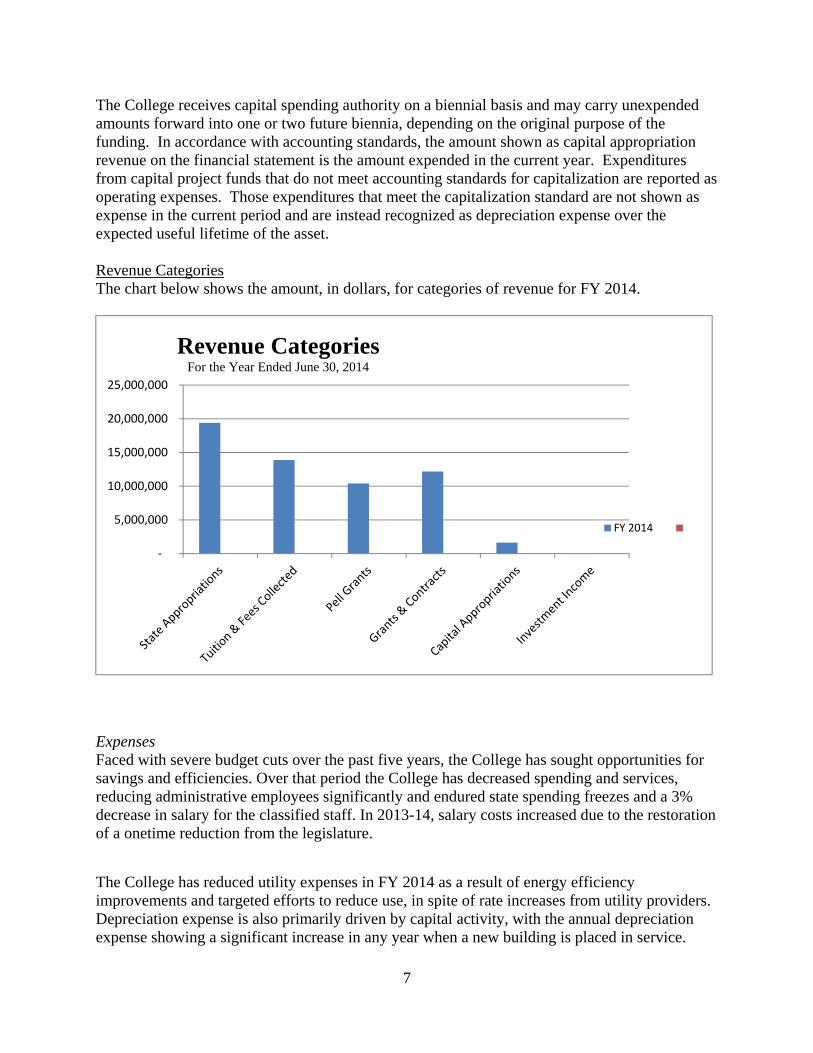
The College receives capital spending authority on a biennial basis and may carry unexpended amounts forward into one or two future biennia, depending on the original purpose of the funding. In accordance with accounting standards, the amount shown as capital appropriation revenue on the financial statement is the amount expended in the current year. Expenditures from capital project funds that do not meet accounting standards for capitalization are reported as operating expenses. Those expenditures that meet the capitalization standard are not shown as expense in the current period and are instead recognized as depreciation expense over the expected useful lifetime of the asset. Revenue Categories The chart below shows the amount, in dollars, for categories of revenue for FY 2014.
Expenses Faced with severe budget cuts over the past five years, the College has sought opportunities for savings and efficiencies. Over that period the College has decreased spending and services, reducing administrative employees significantly and endured state spending freezes and a 3% decrease in salary for the classified staff. In 2013-14, salary costs increased due to the restoration of a onetime reduction from the legislature.
The College has reduced utility expenses in FY 2014 as a result of energy efficiency improvements and targeted efforts to reduce use, in spite of rate increases from utility providers. Depreciation expense is also primarily driven by capital activity, with the annual depreciation expense showing a significant increase in any year when a new building is placed in service.
‐
5,000,000
10,000,000
15,000,000
20,000,000
25,000,000
Revenue CategoriesFor the Year Ended June 30, 2014
FY 2014
8
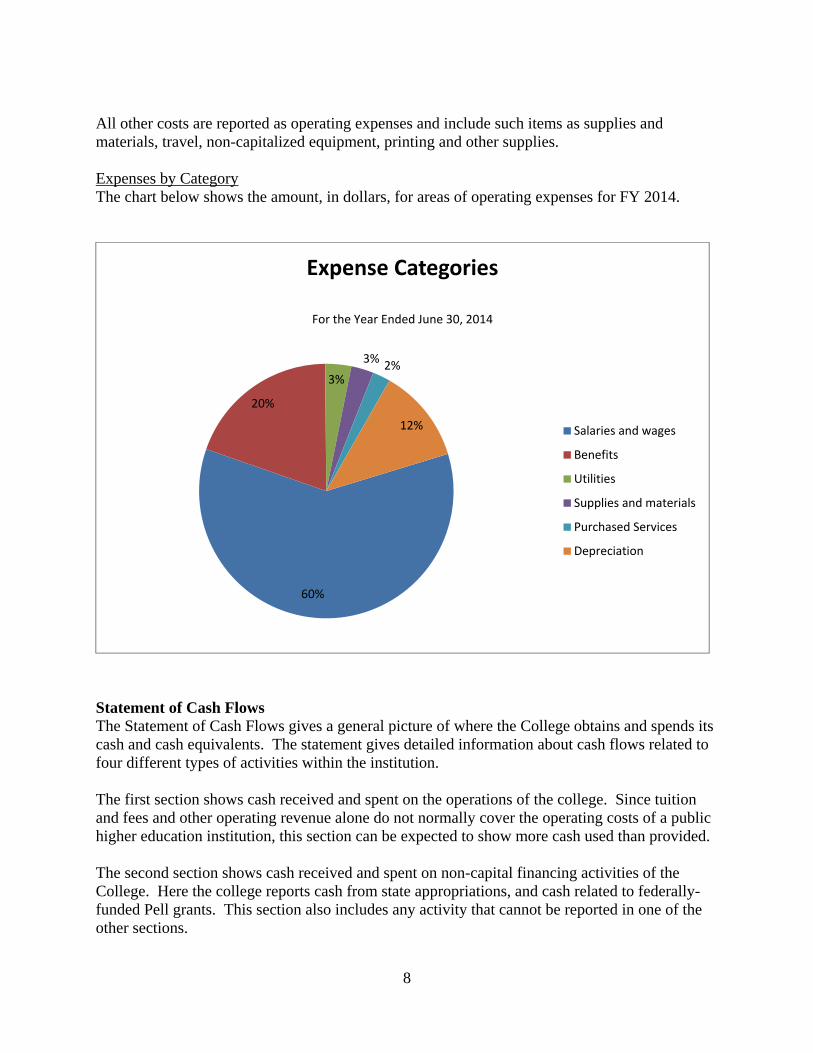
All other costs are reported as operating expenses and include such items as supplies and materials, travel, non-capitalized equipment, printing and other supplies. Expenses by Category The chart below shows the amount, in dollars, for areas of operating expenses for FY 2014.
Statement of Cash Flows The Statement of Cash Flows gives a general picture of where the College obtains and spends its cash and cash equivalents. The statement gives detailed information about cash flows related to four different types of activities within the institution. The first section shows cash received and spent on the operations of the college. Since tuition and fees and other operating revenue alone do not normally cover the operating costs of a public higher education institution, this section can be expected to show more cash used than provided. The second section shows cash received and spent on non-capital financing activities of the College. Here the college reports cash from state appropriations, and cash related to federally-funded Pell grants. This section also includes any activity that cannot be reported in one of the other sections.
60%
20%
3%
3%2%
12%
Expense Categories
For the Year Ended June 30, 2014
Salaries and wages
Benefits
Utilities
Supplies and materials
Purchased Services
Depreciation

9
The third section shows cash received and spent on capital and related financing activities. This includes state capital appropriations for major projects, minor works and repairs. It also includes cash proceeds, capital project expenditures, and interest and principal payments related to Certificates of Participation. The fourth section shows cash received from interest earnings on investments. A condensed statement of cash flows is presented below. A single year is presented as part of this inaugural set of financial statements. Future years will include comparative information.
Condensed Statement of Cash FlowsAs of June 30th FY 2014
Operating Activities (25,807,236)$
Non-Capital Financing Activities 29,313,157$
Capital Financing Activities (2,151,683)$
Investing Activities 17,231$
Net Change in Cash 1,371,469$
Cash, Beginning of Year 21,862,128$
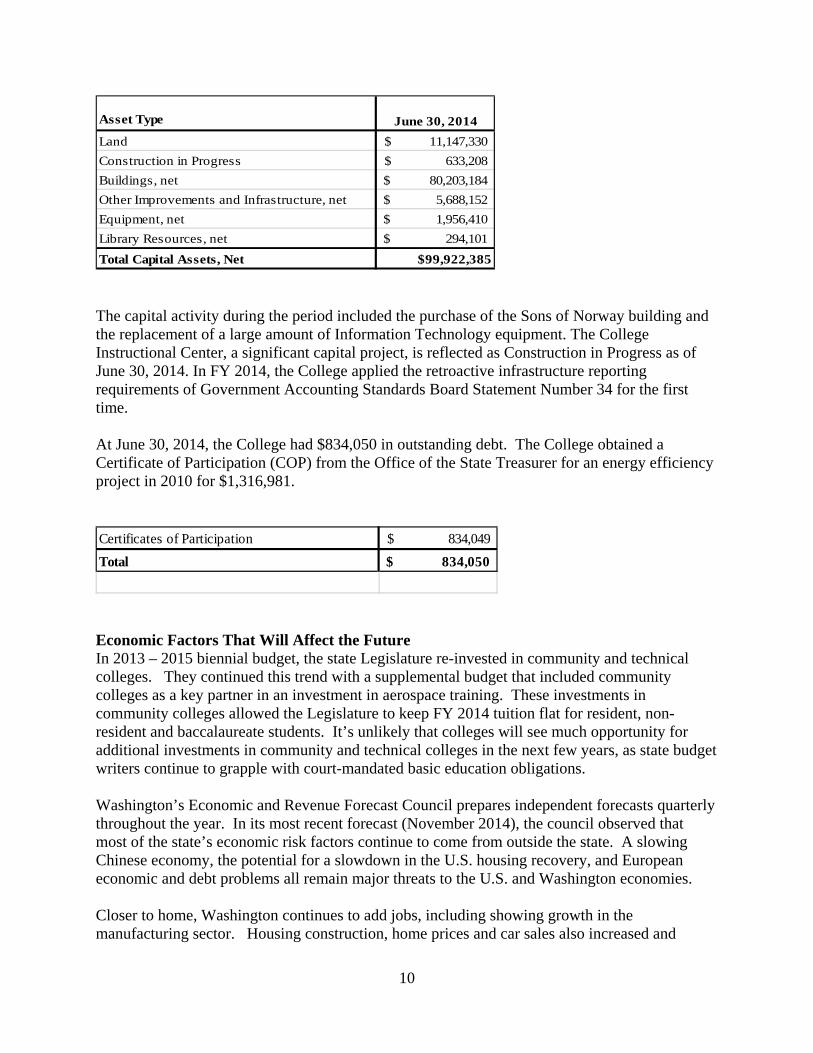
Cash, End of Year 23,233,597$ The College’s cash and cash equivalents at June 30th increased in 2014 by $1,371,469. Primary contributing factors include enrollments above the state FTE band, and increases to tuition revenue. The cash represents commitments for endowments, self-support programs, class lab fees, student activity fees, capital projects, equipment reserves and financial aid funds. Capital Assets and Long-Term Debt Activities The community and technical college system submits a single prioritized request to the Office of Financial Management and the Legislature for appropriated capital funds, which includes major projects, minor projects, repairs, emergency funds, alternative financing and major leases. The primary funding source for college capital projects is state general obligation bonds. In recent years, declining state revenues significantly reduced the state’s debt capacity and are expected to continue to impact the number of new projects that can be financed. See the Notes to the Financial Statements for additional information concerning capital assets and long-term debt. At June 30, 2014, the College had invested $99,922,385 in capital assets, net of accumulated depreciation.
10
Asset Type June 30, 2014
Land 11,147,330$
Construction in Progress 633,208$
Buildings, net 80,203,184$
Other Improvements and Infrastructure, net 5,688,152$
Equipment, net 1,956,410$
Library Resources, net 294,101$
Total Capital Assets, Net $99,922,385 The capital activity during the period included the purchase of the Sons of Norway building and the replacement of a large amount of Information Technology equipment. The College Instructional Center, a significant capital project, is reflected as Construction in Progress as of June 30, 2014. In FY 2014, the College applied the retroactive infrastructure reporting requirements of Government Accounting Standards Board Statement Number 34 for the first time. At June 30, 2014, the College had $834,050 in outstanding debt. The College obtained a Certificate of Participation (COP) from the Office of the State Treasurer for an energy efficiency project in 2010 for $1,316,981. Certificates of Participation 834,049$
Total 834,050$
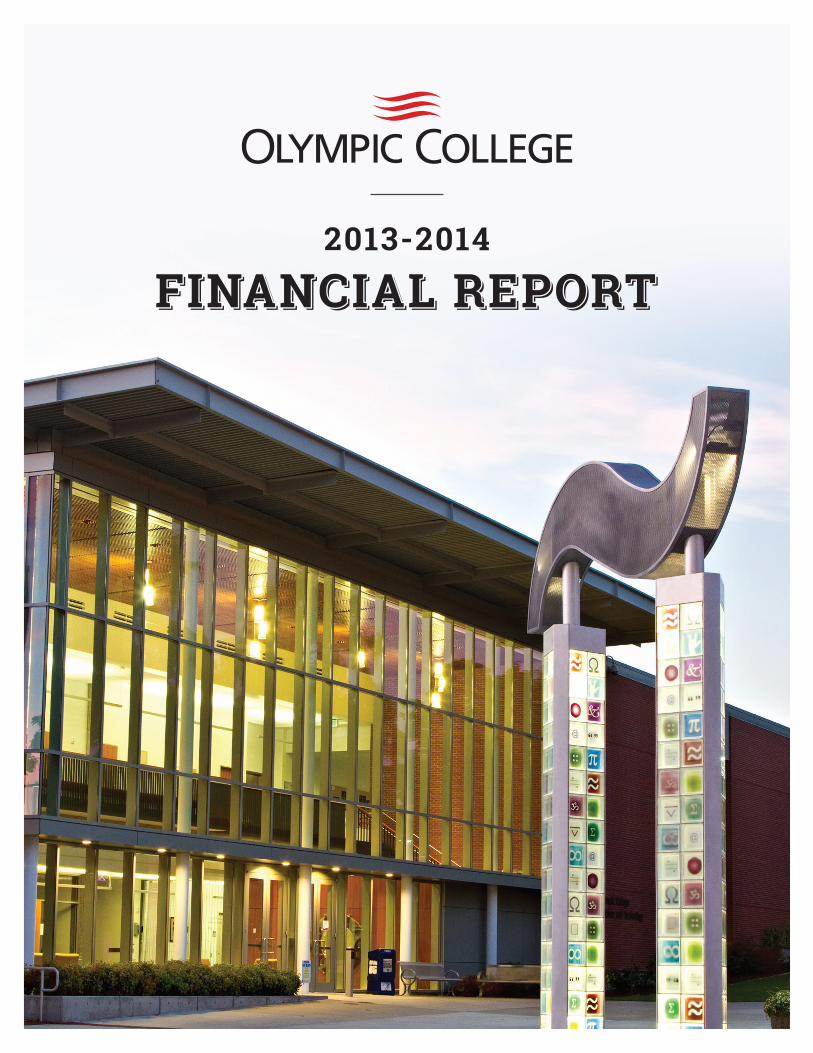
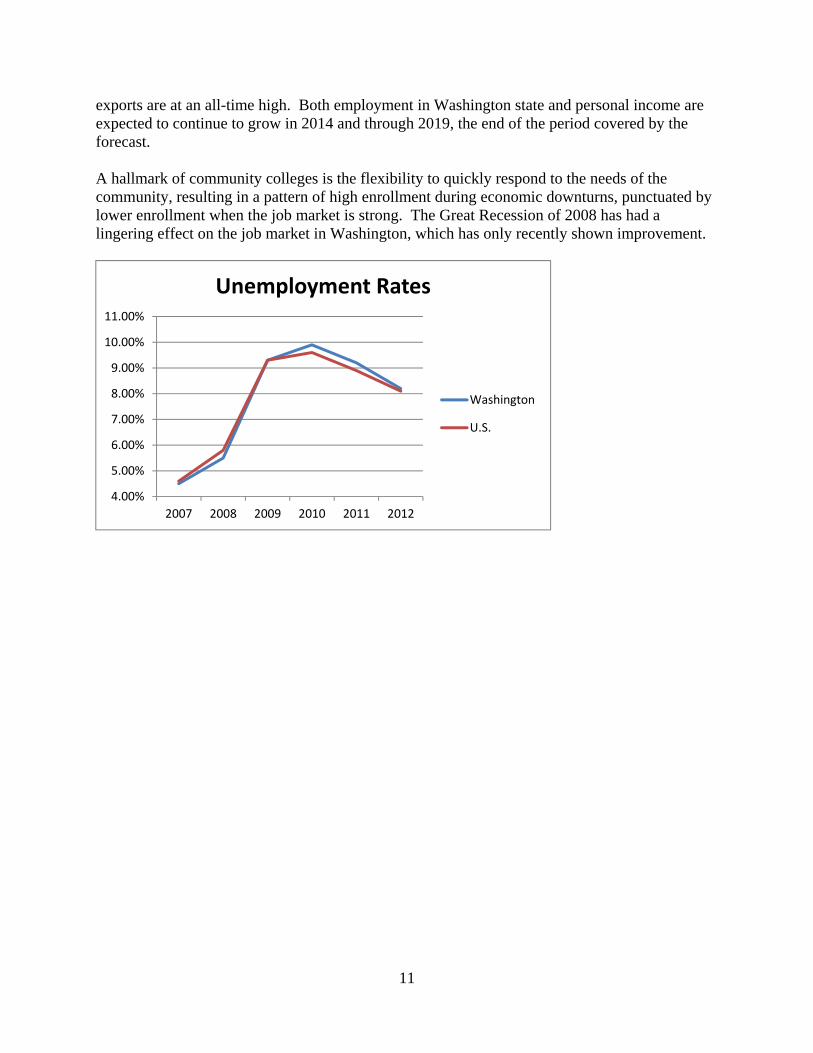
Economic Factors That Will Affect the Future In 2013 – 2015 biennial budget, the state Legislature re-invested in community and technical colleges. They continued this trend with a supplemental budget that included community colleges as a key partner in an investment in aerospace training. These investments in community colleges allowed the Legislature to keep FY 2014 tuition flat for resident, non-resident and baccalaureate students. It’s unlikely that colleges will see much opportunity for additional investments in community and technical colleges in the next few years, as state budget writers continue to grapple with court-mandated basic education obligations. Washington’s Economic and Revenue Forecast Council prepares independent forecasts quarterly throughout the year. In its most recent forecast (November 2014), the council observed that most of the state’s economic risk factors continue to come from outside the state. A slowing Chinese economy, the potential for a slowdown in the U.S. housing recovery, and European economic and debt problems all remain major threats to the U.S. and Washington economies. Closer to home, Washington continues to add jobs, including showing growth in the manufacturing sector. Housing construction, home prices and car sales also increased and
11
exports are at an all-time high. Both employment in Washington state and personal income are expected to continue to grow in 2014 and through 2019, the end of the period covered by the forecast. A hallmark of community colleges is the flexibility to quickly respond to the needs of the community, resulting in a pattern of high enrollment during economic downturns, punctuated by lower enrollment when the job market is strong. The Great Recession of 2008 has had a lingering effect on the job market in Washington, which has only recently shown improvement.
4.00%
5.00%
6.00%
7.00%
8.00%
9.00%
10.00%
11.00%
2007 2008 2009 2010 2011 2012
Unemployment Rates
Washington
U.S.
12
IndependentAuditor’sReportonFinancialStatements
13
14
15
16
CollegeStatementofNetPosition
17
CollegeStatementofRevenues,ExpensesandChangesinNetPosition
18
CollegeStatementofCashFlows
19
FoundationStatementofFinancialPosition
20
FoundationStatementofActivitiesandChangesinNetPosition
21
BremerTrustStatementofFinancialPosition
22
BremerTrustStatementofActivitiesandChangesinNetPosition
23
BremerTrustStatementofCashFlows
24
NotestotheFinancialStatementsJune 30, 2014 These notes form an integral part of the financial statements. 1. Summary of Significant Accounting Policies Financial Reporting Entity Olympic College (the College) is a comprehensive community college offering open-door academic programs, workforce education, basic skills, and community services. The College confers applied baccalaureate degrees, associates degrees, certificates and high school diplomas. It is governed by a five-member Board of Trustees appointed by the Governor and confirmed by the state Senate. The College is an agency of the State of Washington. The financial activity of the college is included in the State’s Comprehensive Annual Financial Report. The Olympic College Foundation (the Foundation) is a separate but affiliated non-profit entity, incorporated under Washington law in 1993 and recognized as a tax exempt 501(c)(3) charity. The Foundation’s charitable purpose is to support student success and program excellence at Olympic College by promoting and receiving philanthropic gifts for the benefit of Olympic College, including student scholarships, program enhancements, professional development, equipment, capital projects, cultural events and activities that enrich the entire college community. Because the majority of the Foundation’s income and resources are restricted by donors and may only be used for the benefit of the college or its students, the Foundation is considered a discrete component unit based on the criteria contained in Governmental Accounting Standards Board (GASB) Statement Nos. 61, 39 and 14. A discrete component unit is an entity which is legally separate from the College, but has the potential to provide significant financial benefits to the College or whose relationship with the College is such that excluding it would cause the College’s financial statements to be misleading or incomplete. The Foundation’s financial statements are discretely presented in this report. Intra-entity transactions and balances between the College and the Foundation are not eliminated for financial statement presentation. During the fiscal year ended June 30, 2014, the Foundation distributed approximately $168,404 to the College for restricted and unrestricted purposes. A copy of the Foundation’s complete financial statements may be obtained from the Director of the Foundation, Olympic College, 1600 Chester Avenue, Bremerton, WA 98337 or by calling (360) 475-7120.
The College is the beneficiary of the Bremer Trust. On January 1, 1987, the Estate of Ed Bremer and the John Bremer Residuary Trust formed Bremers Partnership by each contributing property. On January 1, 1988, the assets of the Estate were transferred into the Trust, the resulting reporting entity. The endowments of the Trust require that the trustee distribute to Olympic College, on an annual basis, a minimum of 50% of the change in net assets of the Trust, exclusive of capital gains or losses.
25
The Bremer Trust financial statements are discretely presented in this report. Intra-entity transactions and balances between the College and the Bremer Trust are not eliminated for financial statement presentation. During the fiscal year ended June 30, 2104, the Trust distributed $151,850 to the College for unrestricted purposes. Basis of Presentation The college follows all GASB pronouncements. The financial statements have been prepared in accordance with GASB Statement No. 34, Basic Financial Statements and Management Discussion and Analysis for State and Local Governments as amended by GASB Statement No. 35, Basic Financial Statements and Management Discussion and Analysis for Public Colleges and Universities. For financial reporting purposes, the College is considered a special-purpose government engaged only in Business Type Activities (BTA). In accordance with BTA reporting, the College presents a Management’s Discussion and Analysis; a Statement of Net Position; a Statement of Revenues, Expenses and Changes in Net Position; a Statement of Cash Flows; and Notes to the Financial Statements. The format provides a comprehensive, entity-wide perspective of the college’s assets, deferred inflows, liabilities, deferred outflows, net position, revenues, expenses, changes in net position and cash flows. New Accounting Pronouncements Beginning in fiscal year 2013-14, the College adopted the provisions of GASB Statement No. 60, Accounting and Financial Reporting for Service Concession Arrangements (GASB 60), which improves financial reporting by addressing issues related to service concession arrangements, which are a type of public-private or public-public partnership. The College has no significant arrangements allowing external parties to operate college capital assets. Beginning in fiscal year 2013-14, the College adopted the provisions of GASB Statement No. 62, Codification of Accounting and Financial Reporting Guidance Contained in Pre-November 30, 1989 FASB and AICPA Pronouncements (GASB 62) and amendments contained in GASB Statement No. 66 Technical Corrections – 2012, which incorporates into GASB’s authoritative literature certain accounting and financial reporting guidance included in the pronouncements of the FASB and American Institute of Certified P:ublic Accountants (AICPA). This statement also supersedes GASB Statement No. 20, Accounting and Financial Reporting for Proprietary Funds and Other Governmental Entities That Use Proprietary Fund Accounting. Beginning in fiscal year 2013-14, the College adopted the provisions of GASB Statement No. 63, Financial Reporting of Deferred Outflows of Resources, Deferred Inflows of Resources, and Net Position (GASB 63), which provides financial reporting guidance for deferred outflows of resources and deferred inflows of resources. This statement amends the net asset reporting requirement in GASB Statement No. 34, Basic Financial Statements-and Management’s Discussion and Analysis-for State and Local Governments, and other pronouncements by incorporating deferred outflows of resources and deferred inflows of resources into the definitions of the required components of the residual measure and by renaming that measure as net position, rather than net assets. The College did not identify any transactions requiring treatment as a deferred inflow or outflow.
26
In March 2012, the GASB issued Statement No. 65, Items Previously Reported as Assets and Liabilities (GASB 65), which establishes accounting and financial reporting standards that reclassify, as deferred outflows of resources or deferred inflows of resources, certain items that were previously reported as assets and liabilities and recognizes, as outflows of resources or inflows of resources, certain items that were previously reported as assets and liabilities. GASB 65 is effective for financial statements for periods beginning after December 15, 2012. The College did not identify any transactions requiring reclassification of previously reported assets and liabilities.
In June 2012, the GASB issued Statement No. 68, Accounting and Financial Reporting for Pensions (GASB 68), which improves accounting and financial reporting by state and local governments for pensions. This statement also supersedes GASB Statement No. 27, Accounting for Pensions by State and Local Governmental Employers, as well as GASB Statement No. 50, Pension Disclosures. GASB 68 is effective for fiscal years beginning after June 15, 2014.
In April 2013, the GASB issued Statement No. 70, Accounting and Financial Reporting for Nonexchange Financial Guarantees, which improves recognition, measurement and disclosure guidance for state and local governments that have extended or received financial guarantees that are non-exchange transactions. The College does not have any non-exchange transactions.
Basis of Accounting
The financial statements of the College have been prepared using the economic resources measurement focus and the accrual basis of accounting. Under the accrual basis, revenues are recognized when earned and expenses are recorded when an obligation has been incurred, regardless of the timing of the cash flows.
Non-exchange transactions, in which the College receives (or gives) value without directly giving (or receiving) equal value in exchange includes state and federal appropriations, and certain grants and donations. Revenues are recognized, net of estimated uncollectible amounts, as soon as all eligibility requirements imposed by the provider have been met, if probable of collection. The preparation of financial statements in conformity with accounting principles generally accepted in the United States of America requires management to make estimates and assumptions that affect the reported amounts of assets and liabilities and disclosure of contingent assets and liabilities at the date of the financial statements and the reported amounts of revenue and expenses during the reporting period. Actual results could differ from those estimates. During the course of operations, numerous transactions occur between funds for goods provided and services rendered. For the financial statements, interfund receivables and payables have generally been eliminated. However, revenues and expenses from the College’s auxiliary enterprises are treated as though the College were dealing with private vendors. For all other funds, transactions that are reimbursements of expenses are recorded as reductions of expense.
27
Cash, Cash Equivalents and Investments Cash and cash equivalents include cash on hand, bank demand deposits, and deposits with the Washington State Local Government Investment Pool (LGIP). Cash and cash equivalents that are held with the intent to fund College operations are classified as current assets. The College records all cash, cash equivalents, and investments at fair value. The College combines unrestricted cash operating funds from all departments into an internal investment pool, the income from which is allocated on a proportional basis. The internal investment pool is comprised of cash and cash equivalents. Accounts Receivable Accounts receivable consists of tuition and fee charges to students and auxiliary enterprise services provided to students, faculty and staff. This also includes amounts due from federal, state and local governments or private sources as allowed under the terms of grants and contracts. Accounts receivable are shown net of estimated uncollectible amounts. Inventories Inventories, consisting primarily of merchandise for resale in the college bookstore, are valued at cost using FIFO. Capital Assets In accordance with state law, capital assets constructed with state funds are owned by the State of Washington. Property titles are shown accordingly. However, responsibility for managing the assets rests with the College. As a result, the assets are included in the financial statements because excluding them would have been misleading to the reader. Land, buildings and equipment are recorded at cost, or if acquired by gift, at fair market value at the date of the gift. As this is the first institution-level financial statement prepared by the college, GASB 34 guidance concerning preparing initial estimates for historical cost and accumulated depreciation related to infrastructure was followed. Capital additions, replacements and major renovations are capitalized. The value of assets constructed includes all material direct and indirect construction costs. Any interest costs incurred are capitalized during the period of construction. Routine repairs and maintenance are charged to operating expense in the year in which the expense was incurred. In accordance with the state capitalization policy, all land, intangible assets and software with a unit cost of $1,000,000 or more, buildings and improvements with a unit cost of $100,000 or more, library collections with a total cost of $5,000 or more and all other assets with a unit cost of $5,000 or more are capitalized. Depreciation is computed using the straight line method over the estimated useful lives of the assets as defined by the State of Washington’s Office of Financial Management. Useful lives range from 15 to 50 years for buildings and improvements, 3 to 50 years for improvements other than buildings, 7 years for library resources and 2 to 10 years for most equipment and 11 to 40 years for heavy duty equipment, aircraft, locomotives and vessels. In accordance with GASB Statement 42, the college reviews assets for impairment whenever events or changes in circumstances have indicated that the carrying amount of its assets might
28
not be recoverable. Impaired assets are reported at the lower of cost or fair value. At June 30, 2014, no assets had been written down.
Unearned Revenues Unearned revenues occur when funds have been collected prior to the end of the fiscal year but related to the subsequent fiscal year. The College has recorded summer and fall quarter tuition and fees and student residence housing deposits as unearned revenues.
Tax Exemption The College is a tax-exempt organization under the provisions of Section 115 (1) of the Internal Revenue Code and is exempt from federal income taxes on related income. Net Position The College’s net position is classified as follows.
Net Investment in Capital Assets. This represents the College’s total investment in capital assets, net of outstanding debt obligations related to those capital assets.
Restricted for Nonexpendable. This consists of endowment and similar type funds for which donors or other outside sources have stipulated as a condition of the gift instrument that the principal is to be maintained inviolate and in perpetuity and invested for the purpose of producing present and future income which may either be expended or added to the principal.
Restricted for Expendable. These include resources the College is legally or contractually obligated to spend in accordance with restrictions imposed by third parties.
Unrestricted. These represent resources derived from student tuition and fees, and sales and services of educational departments and auxiliary enterprises.
Classification of Revenues The College has classified its revenues as either operating or non-operating revenues according to the following criteria: Operating Revenues. This includes activities that have the characteristics of exchange transactions such as (1) student tuition and fees, net of waivers and scholarship discounts and allowances, (2) sales and services of auxiliary enterprises and (3) most federal, state and local grants and contracts. Non-operating Revenues. This includes activities that have the characteristics of non-exchange transactions, such as gifts and contributions, state appropriations and investment income. Scholarship Discounts and Allowances Student tuition and fee revenues, and certain other revenues from students, are reported net of scholarship discounts and allowances in the Statements of Revenues, Expenses and Changes in Net Position. Scholarship discounts and allowances are the difference between the stated charge for goods and services provided by the College and the amount that is paid by students and/or third parties making payments on the students’ behalf. Certain governmental grants, such as Pell grants, and other Federal, State or non-governmental programs are recorded as either operating
29
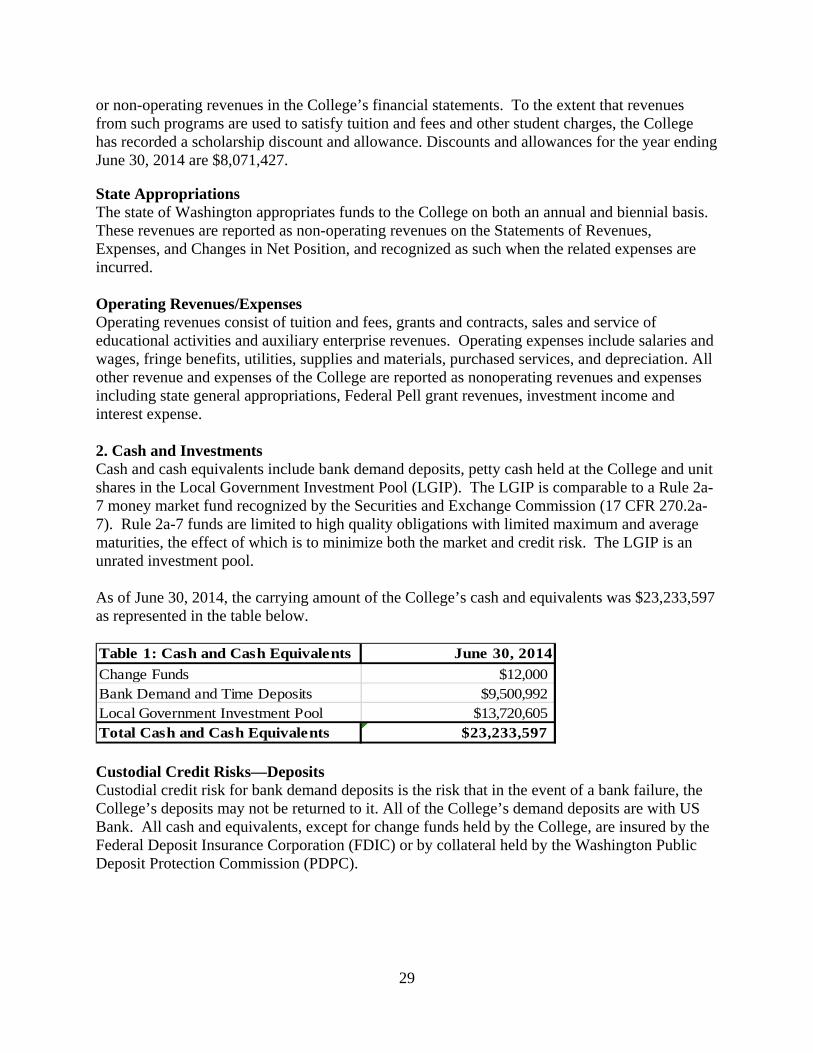
or non-operating revenues in the College’s financial statements. To the extent that revenues from such programs are used to satisfy tuition and fees and other student charges, the College has recorded a scholarship discount and allowance. Discounts and allowances for the year ending June 30, 2014 are $8,071,427. State Appropriations The state of Washington appropriates funds to the College on both an annual and biennial basis. These revenues are reported as non-operating revenues on the Statements of Revenues, Expenses, and Changes in Net Position, and recognized as such when the related expenses are incurred. Operating Revenues/Expenses Operating revenues consist of tuition and fees, grants and contracts, sales and service of educational activities and auxiliary enterprise revenues. Operating expenses include salaries and wages, fringe benefits, utilities, supplies and materials, purchased services, and depreciation. All other revenue and expenses of the College are reported as nonoperating revenues and expenses including state general appropriations, Federal Pell grant revenues, investment income and interest expense. 2. Cash and Investments Cash and cash equivalents include bank demand deposits, petty cash held at the College and unit shares in the Local Government Investment Pool (LGIP). The LGIP is comparable to a Rule 2a-7 money market fund recognized by the Securities and Exchange Commission (17 CFR 270.2a-7). Rule 2a-7 funds are limited to high quality obligations with limited maximum and average maturities, the effect of which is to minimize both the market and credit risk. The LGIP is an unrated investment pool. As of June 30, 2014, the carrying amount of the College’s cash and equivalents was $23,233,597 as represented in the table below. Table 1: Cash and Cash Equivalents June 30, 2014
Change Funds $12,000Bank Demand and Time Deposits $9,500,992Local Government Investment Pool $13,720,605Total Cash and Cash Equivalents $23,233,597 Custodial Credit Risks—Deposits Custodial credit risk for bank demand deposits is the risk that in the event of a bank failure, the College’s deposits may not be returned to it. All of the College’s demand deposits are with US Bank. All cash and equivalents, except for change funds held by the College, are insured by the Federal Deposit Insurance Corporation (FDIC) or by collateral held by the Washington Public Deposit Protection Commission (PDPC).
30
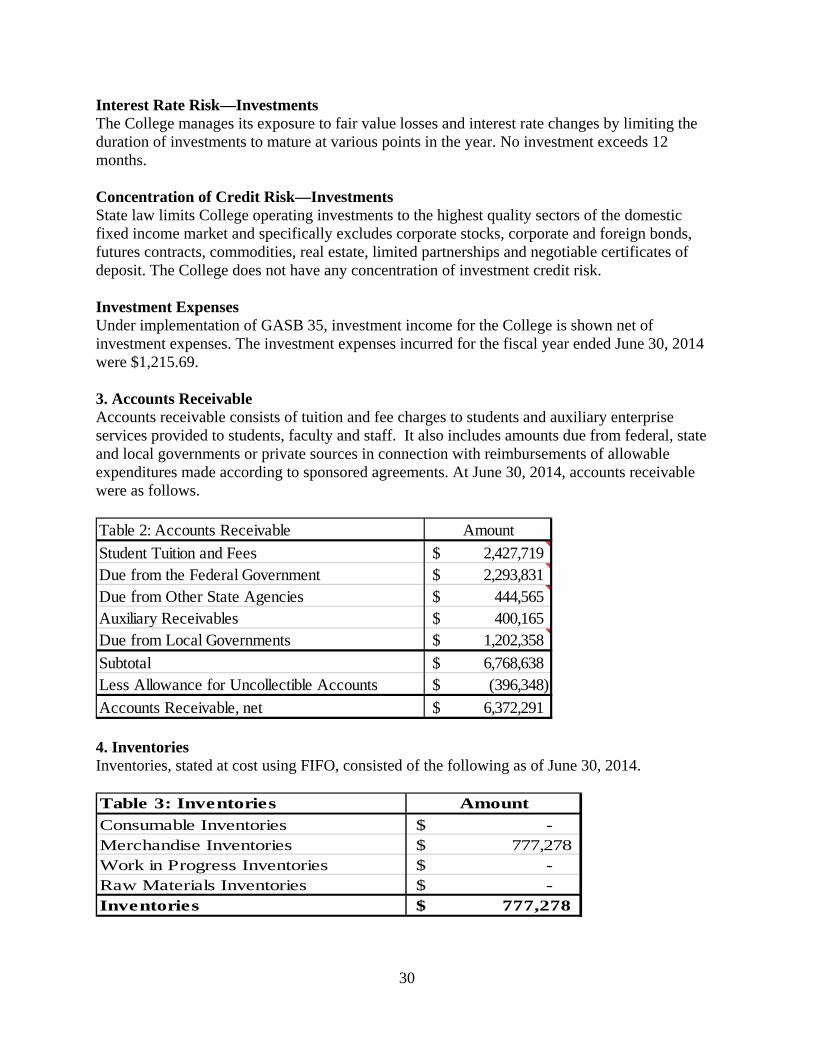
Interest Rate Risk—Investments The College manages its exposure to fair value losses and interest rate changes by limiting the duration of investments to mature at various points in the year. No investment exceeds 12 months. Concentration of Credit Risk—Investments State law limits College operating investments to the highest quality sectors of the domestic fixed income market and specifically excludes corporate stocks, corporate and foreign bonds, futures contracts, commodities, real estate, limited partnerships and negotiable certificates of deposit. The College does not have any concentration of investment credit risk. Investment Expenses Under implementation of GASB 35, investment income for the College is shown net of investment expenses. The investment expenses incurred for the fiscal year ended June 30, 2014 were $1,215.69. 3. Accounts Receivable Accounts receivable consists of tuition and fee charges to students and auxiliary enterprise services provided to students, faculty and staff. It also includes amounts due from federal, state and local governments or private sources in connection with reimbursements of allowable expenditures made according to sponsored agreements. At June 30, 2014, accounts receivable were as follows. Table 2: Accounts Receivable Amount
Student Tuition and Fees 2,427,719$ Due from the Federal Government 2,293,831$ Due from Other State Agencies 444,565$ Auxiliary Receivables 400,165$ Due from Local Governments 1,202,358$
Subtotal 6,768,638$ Less Allowance for Uncollectible Accounts (396,348)$
Accounts Receivable, net 6,372,291$ 4. Inventories Inventories, stated at cost using FIFO, consisted of the following as of June 30, 2014.
Table 3: Inventories Amount
Consumable Inventories -$ Merchandise Inventories 777,278$ Work in Progress Inventories -$ Raw Materials Inventories -$ Inventories 777,278$
31
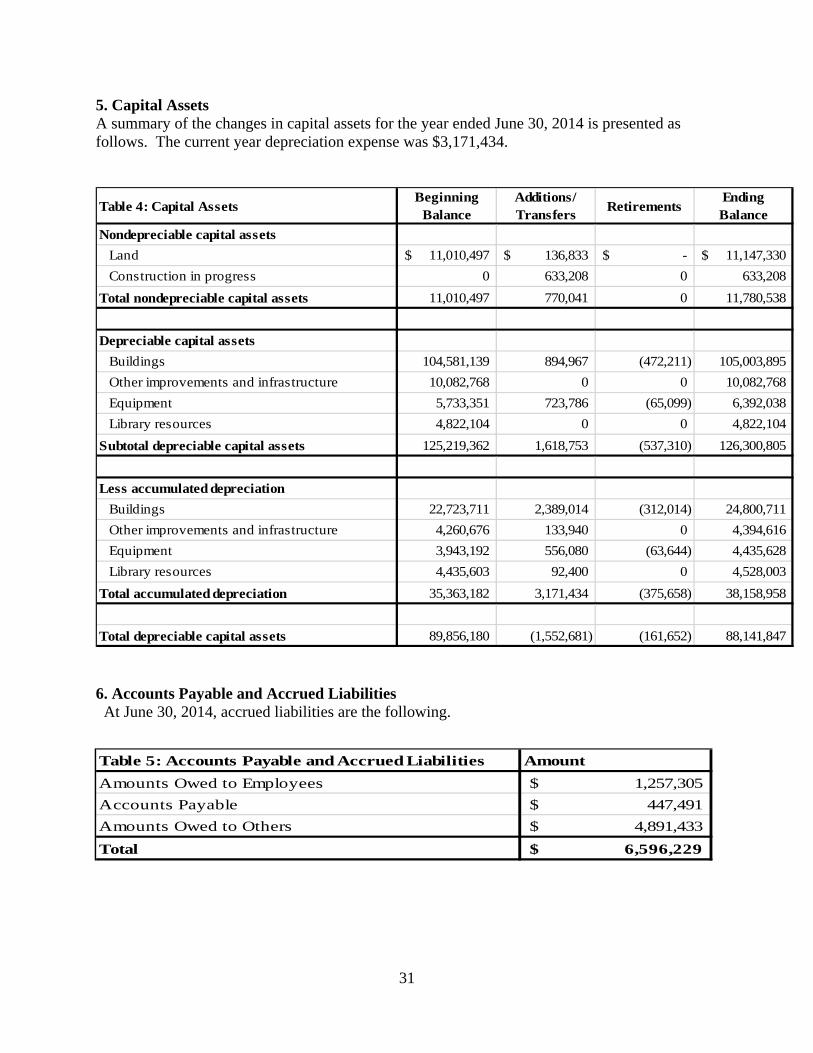
5. Capital Assets A summary of the changes in capital assets for the year ended June 30, 2014 is presented as follows. The current year depreciation expense was $3,171,434.
Table 4: Capital AssetsBeginning
BalanceAdditions/ Transfers
Retirements Ending Balance
Nondepreciable capital assets
Land 11,010,497$ 136,833$ -$ 11,147,330$
Construction in progress 0 633,208 0 633,208
Total nondepreciable capital assets 11,010,497 770,041 0 11,780,538
Depreciable capital assets
Buildings 104,581,139 894,967 (472,211) 105,003,895
Other improvements and infrastructure 10,082,768 0 0 10,082,768
Equipment 5,733,351 723,786 (65,099) 6,392,038
Library resources 4,822,104 0 0 4,822,104
Subtotal depreciable capital assets 125,219,362 1,618,753 (537,310) 126,300,805
Less accumulated depreciation
Buildings 22,723,711 2,389,014 (312,014) 24,800,711
Other improvements and infrastructure 4,260,676 133,940 0 4,394,616
Equipment 3,943,192 556,080 (63,644) 4,435,628
Library resources 4,435,603 92,400 0 4,528,003
Total accumulated depreciation 35,363,182 3,171,434 (375,658) 38,158,958
Total depreciable capital assets 89,856,180 (1,552,681) (161,652) 88,141,847
6. Accounts Payable and Accrued Liabilities At June 30, 2014, accrued liabilities are the following.
Table 5: Accounts Payable and Accrued Liabilities Amount
Amounts Owed to Employees 1,257,305$
Accounts Payable 447,491$
Amounts Owed to Others 4,891,433$
Total 6,596,229$
32
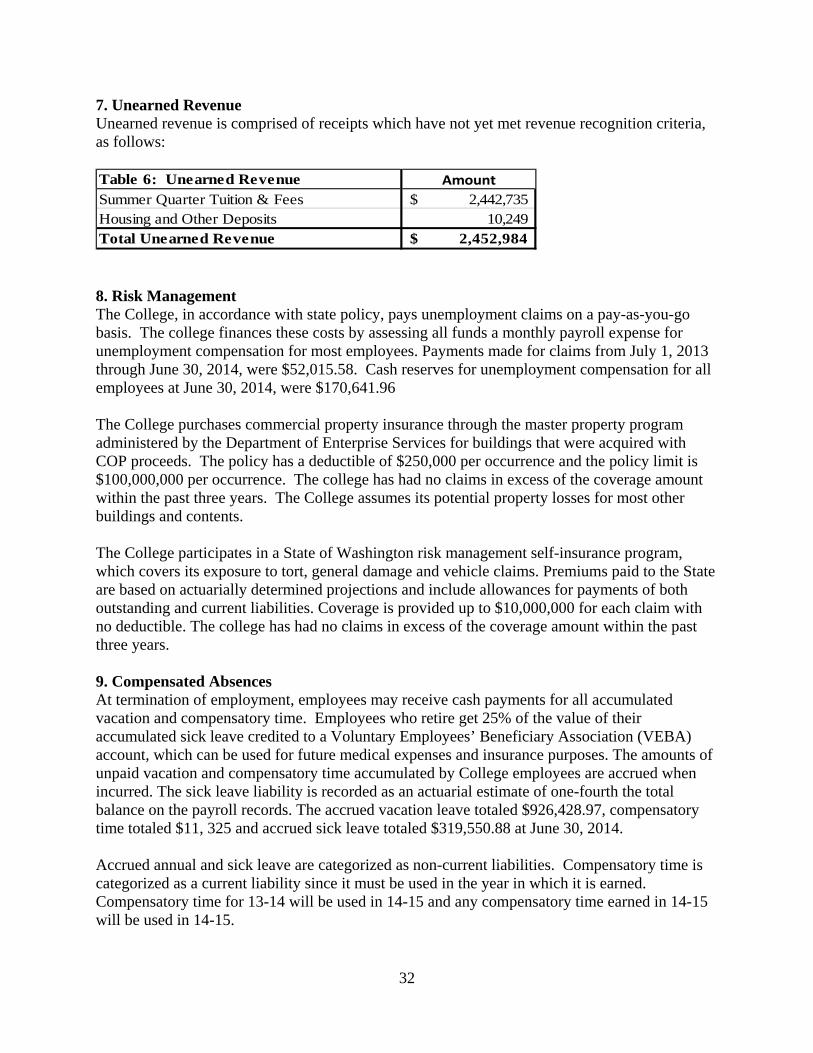
7. Unearned Revenue Unearned revenue is comprised of receipts which have not yet met revenue recognition criteria, as follows:
8. Risk Management The College, in accordance with state policy, pays unemployment claims on a pay-as-you-go basis. The college finances these costs by assessing all funds a monthly payroll expense for unemployment compensation for most employees. Payments made for claims from July 1, 2013 through June 30, 2014, were $52,015.58. Cash reserves for unemployment compensation for all employees at June 30, 2014, were $170,641.96 The College purchases commercial property insurance through the master property program administered by the Department of Enterprise Services for buildings that were acquired with COP proceeds. The policy has a deductible of $250,000 per occurrence and the policy limit is $100,000,000 per occurrence. The college has had no claims in excess of the coverage amount within the past three years. The College assumes its potential property losses for most other buildings and contents. The College participates in a State of Washington risk management self-insurance program, which covers its exposure to tort, general damage and vehicle claims. Premiums paid to the State are based on actuarially determined projections and include allowances for payments of both outstanding and current liabilities. Coverage is provided up to $10,000,000 for each claim with no deductible. The college has had no claims in excess of the coverage amount within the past three years. 9. Compensated Absences At termination of employment, employees may receive cash payments for all accumulated vacation and compensatory time. Employees who retire get 25% of the value of their accumulated sick leave credited to a Voluntary Employees’ Beneficiary Association (VEBA) account, which can be used for future medical expenses and insurance purposes. The amounts of unpaid vacation and compensatory time accumulated by College employees are accrued when incurred. The sick leave liability is recorded as an actuarial estimate of one-fourth the total balance on the payroll records. The accrued vacation leave totaled $926,428.97, compensatory time totaled $11, 325 and accrued sick leave totaled $319,550.88 at June 30, 2014. Accrued annual and sick leave are categorized as non-current liabilities. Compensatory time is categorized as a current liability since it must be used in the year in which it is earned. Compensatory time for 13-14 will be used in 14-15 and any compensatory time earned in 14-15 will be used in 14-15.
Table 6: Unearned Revenue Amount
Summer Quarter Tuition & Fees 2,442,735$ Housing and Other Deposits 10,249 Total Unearned Revenue 2,452,984$
33
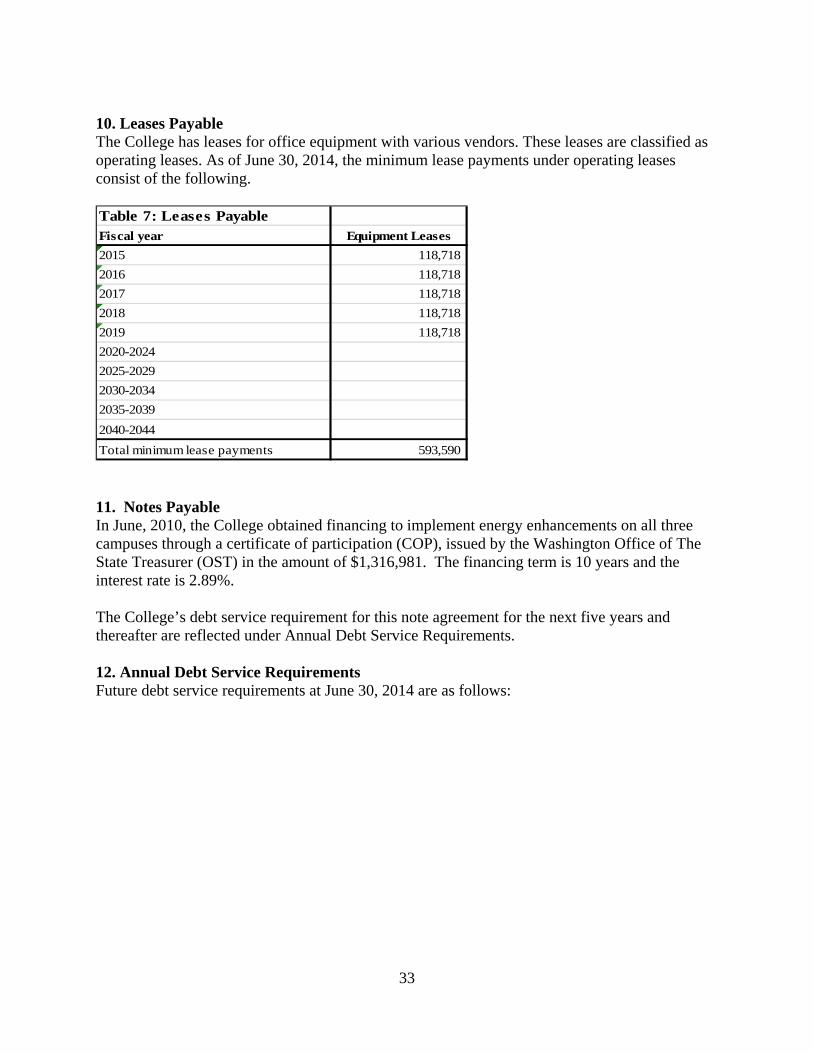
10. Leases Payable The College has leases for office equipment with various vendors. These leases are classified as operating leases. As of June 30, 2014, the minimum lease payments under operating leases consist of the following. Table 7: Leases PayableFiscal year Equipment Leases
2015 118,718
2016 118,718
2017 118,718
2018 118,718
2019 118,718
2020-2024
2025-2029
2030-2034
2035-2039
2040-2044
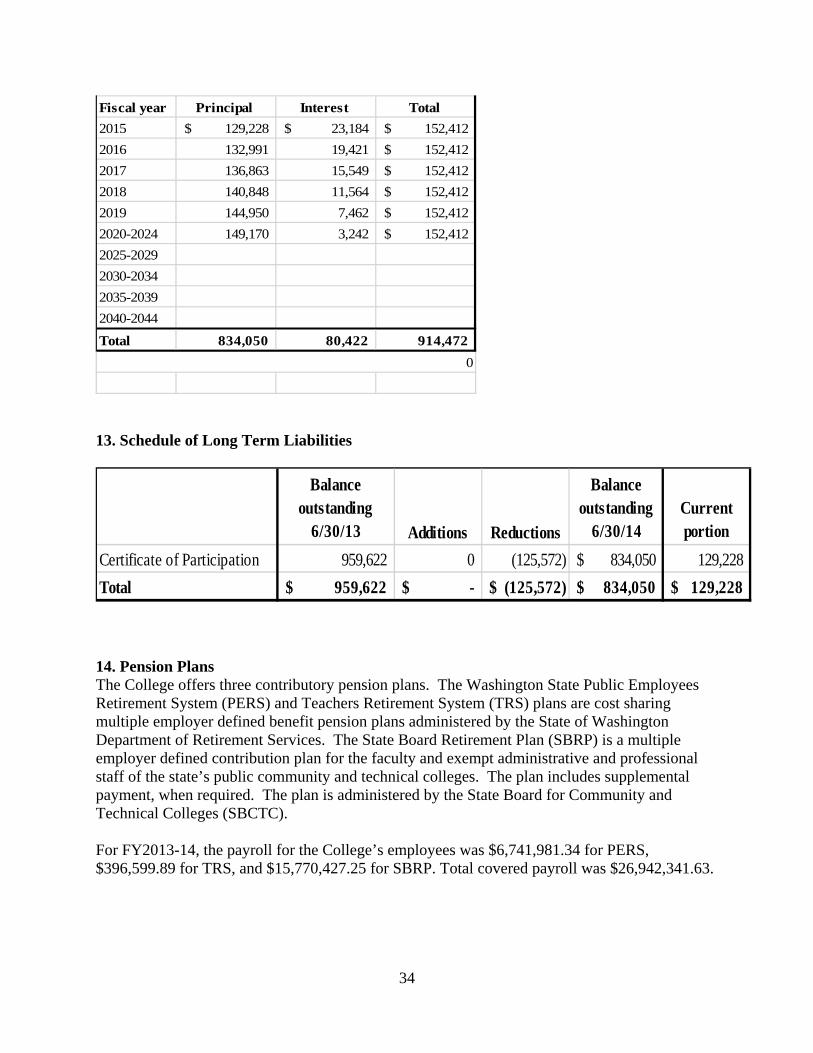
Total minimum lease payments 593,590 11. Notes Payable In June, 2010, the College obtained financing to implement energy enhancements on all three campuses through a certificate of participation (COP), issued by the Washington Office of The State Treasurer (OST) in the amount of $1,316,981. The financing term is 10 years and the interest rate is 2.89%. The College’s debt service requirement for this note agreement for the next five years and thereafter are reflected under Annual Debt Service Requirements. 12. Annual Debt Service Requirements Future debt service requirements at June 30, 2014 are as follows:
34
Fiscal year Principal Interest Total
2015 129,228$ 23,184$ 152,412$
2016 132,991 19,421 152,412$
2017 136,863 15,549 152,412$
2018 140,848 11,564 152,412$
2019 144,950 7,462 152,412$
2020-2024 149,170 3,242 152,412$
2025-2029
2030-2034
2035-2039
2040-2044
Total 834,050 80,422 914,472
0
13. Schedule of Long Term Liabilities
Balance outstanding
6/30/13 Additions Reductions
Balance outstanding
6/30/14Current portion
Certificate of Participation 959,622 0 (125,572) 834,050$ 129,228
Total 959,622$ -$ (125,572)$ 834,050$ 129,228$ 14. Pension Plans The College offers three contributory pension plans. The Washington State Public Employees Retirement System (PERS) and Teachers Retirement System (TRS) plans are cost sharing multiple employer defined benefit pension plans administered by the State of Washington Department of Retirement Services. The State Board Retirement Plan (SBRP) is a multiple employer defined contribution plan for the faculty and exempt administrative and professional staff of the state’s public community and technical colleges. The plan includes supplemental payment, when required. The plan is administered by the State Board for Community and Technical Colleges (SBCTC). For FY2013-14, the payroll for the College’s employees was $6,741,981.34 for PERS, $396,599.89 for TRS, and $15,770,427.25 for SBRP. Total covered payroll was $26,942,341.63.
35
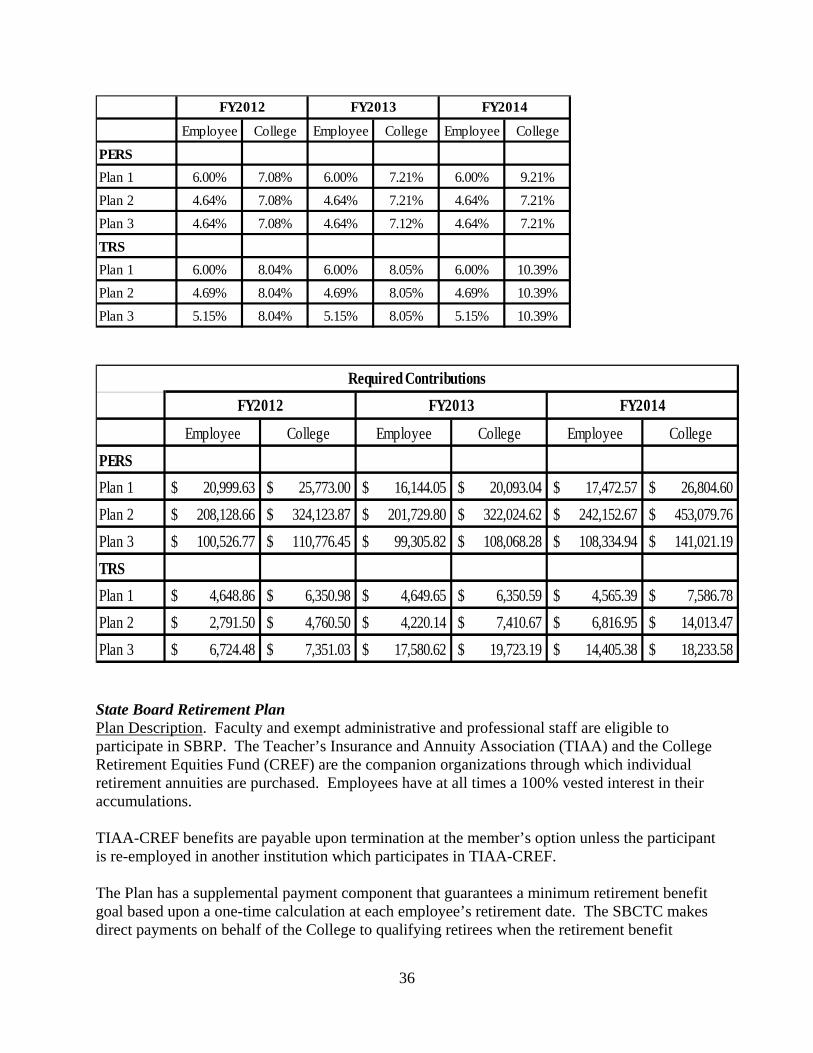
PERS and TRS Plan Descriptions. PERS Plan 1 provides retirement and disability benefits and minimum benefit increases to eligible nonacademic plan members hired prior to October 1, 1977. PERS Plans 2 and 3 provide retirement and disability benefits and a cost-of-living adjustment to eligible nonacademic plan members hired on or after October 1, 1977. Retirement benefits are vested after five years of eligible service. PERS Plan 3 has a defined contribution component that members may elect to self-direct as established by the Employee Retirement Benefits Board. PERS 3 defined benefit plan benefits are vested after an employee completes five years of eligible service. TRS Plan 3 provides retirement benefits to certain eligible faculty hired on or after October 1, 1977. The plan includes both a defined benefit portion and a defined contribution portion. The defined benefit portion is funded by employer contributions only. Benefits are vested after an employee completes five or ten years of eligible service, depending on the employee’s age and service credit, and include an annual cost-of living adjustment. The defined contribution component is fully funded by employee contributions and investment performance. The authority to establish and amend benefit provisions resides with the legislature. PERS and TRS issue publicly available financial reports that include financial statements and required supplementary information. The report may be obtained by writing to the Department of Retirement Systems, PO Box 48380, Olympia, Washington 98504-8380 or online at http://www.drs.wa.gov/administration. Funding Policy. Each biennium, the state Pension Funding Council adopts PERS and TRS Plan 1 employer contribution rates, Plan 2 employer and employee contribution rates, and Plan 3 employer contribution rates. Employee contribution rates for PERS and TRS Plans 1 are established by statute. By statute, PERS 3 employees may select among six contribution rate options, ranging from 5 to 15 percent. The required contribution rates expressed as a percentage of current year covered payroll are shown in the table below. The College and the employees made 100% of required contributions. Contribution Rates and Required Contributions. The College’s contribution rates and required contributions for the above retirement plans for the years ending June 30, 2014, 2013, and 2012 are as follows.
36
Employee College Employee College Employee College
PERS
Plan 1 6.00% 7.08% 6.00% 7.21% 6.00% 9.21%
Plan 2 4.64% 7.08% 4.64% 7.21% 4.64% 7.21%
Plan 3 4.64% 7.08% 4.64% 7.12% 4.64% 7.21%
TRS
Plan 1 6.00% 8.04% 6.00% 8.05% 6.00% 10.39%
Plan 2 4.69% 8.04% 4.69% 8.05% 4.69% 10.39%
Plan 3 5.15% 8.04% 5.15% 8.05% 5.15% 10.39%
FY2012 FY2013 FY2014
Employee College Employee College Employee College
PERS
Plan 1 $ 20,999.63 $ 25,773.00 $ 16,144.05 $ 20,093.04 $ 17,472.57 $ 26,804.60
Plan 2 $ 208,128.66 $ 324,123.87 $ 201,729.80 $ 322,024.62 $ 242,152.67 $ 453,079.76
Plan 3 $ 100,526.77 $ 110,776.45 $ 99,305.82 $ 108,068.28 $ 108,334.94 $ 141,021.19
TRS
Plan 1 $ 4,648.86 $ 6,350.98 $ 4,649.65 $ 6,350.59 $ 4,565.39 $ 7,586.78
Plan 2 $ 2,791.50 $ 4,760.50 $ 4,220.14 $ 7,410.67 $ 6,816.95 $ 14,013.47
Plan 3 $ 6,724.48 $ 7,351.03 $ 17,580.62 $ 19,723.19 $ 14,405.38 $ 18,233.58
Required Contributions
FY2012 FY2013 FY2014
State Board Retirement Plan Plan Description. Faculty and exempt administrative and professional staff are eligible to participate in SBRP. The Teacher’s Insurance and Annuity Association (TIAA) and the College Retirement Equities Fund (CREF) are the companion organizations through which individual retirement annuities are purchased. Employees have at all times a 100% vested interest in their accumulations. TIAA-CREF benefits are payable upon termination at the member’s option unless the participant is re-employed in another institution which participates in TIAA-CREF. The Plan has a supplemental payment component that guarantees a minimum retirement benefit goal based upon a one-time calculation at each employee’s retirement date. The SBCTC makes direct payments on behalf of the College to qualifying retirees when the retirement benefit
37
provided by TIAA-CREF does not meet the benefit goal. Employees are eligible for a non-reduced supplemental payment after the age of 65 with ten years of full-time service. The minimum retirement benefit goal is 2% of the average annual salary for each year of full-time service up to a maximum of 25 years. However, if the participant does not elect to make the 10% TIAA-CREF contribution after age 49, the benefit goal is 1.5% for each year of full-time service for those years the lower contribution rate is selected. The State Board for Community and Technical Colleges is authorized to amend benefit provisions under RCW 28B.10.400. In 2011, the plan was amended to eliminate the supplemental benefit provisions for all employees hired after June 30, 2011. Contributions. Contribution rates for the SBRP (TIAA-CREF), which are based upon age, are 5%, 7.5% or 10% of salary and are matched by the College. Employee and employer contributions for the year ended June 30, 2014 were each $2,859,589.80. The SBRP supplemental pension benefits are unfunded. For the year ended June 30, 2014, supplemental benefits were paid by the SBCTC on behalf of the College in the amount of $4,685.16. In 2012, legislation (RCW 28B.10.423) was passed requiring colleges to pay into a Supplemental Benefit Fund managed by the State Investment Board, for the purpose of funding future benefit obligations. During FY 2014, the College paid into this fund at a rate of 0.5% of covered salaries, totaling $78,869.98. As of June 30, 2014, the Community and Technical College system accounted for $5,008,355 of the fund balance. Washington State Deferred Compensation Program The College, through the state of Washington, offers its employees a deferred compensation plan created under Internal Revenue Code Section 457. The plan, available to all State employees, permits individuals to defer a portion of their salary until future years. The state of Washington administers the plan on behalf of the College’s employees. The deferred compensation is not available to employees until termination, retirement or unforeseeable financial emergency. The College does not have access to the funds. Other Post-Employment Benefits Health care and life insurance programs for employees of the state of Washington are administered by the Washington State Health Care Authority (HCA). The HCA calculates the premium amounts each year that are sufficient to fund the statewide health and life insurance programs on a pay-as-you-go basis. These costs are passed through to individual state agencies based upon active employee headcount; the agencies pay the premiums for active employees to the HCA. The agencies may also charge employees for certain higher cost options elected by the employee. State of Washington retirees may elect coverage through state health and life insurance plans, for which they pay less than the full cost of the benefits, based on their age and other demographic factors. The health care premiums for active employees, which are paid by the agency during the employees’ working careers, subsidize the “underpayments” of retirees. An additional factor in the Other Post-Employment Benefits (OPEB) obligation is a payment that is required by the
38
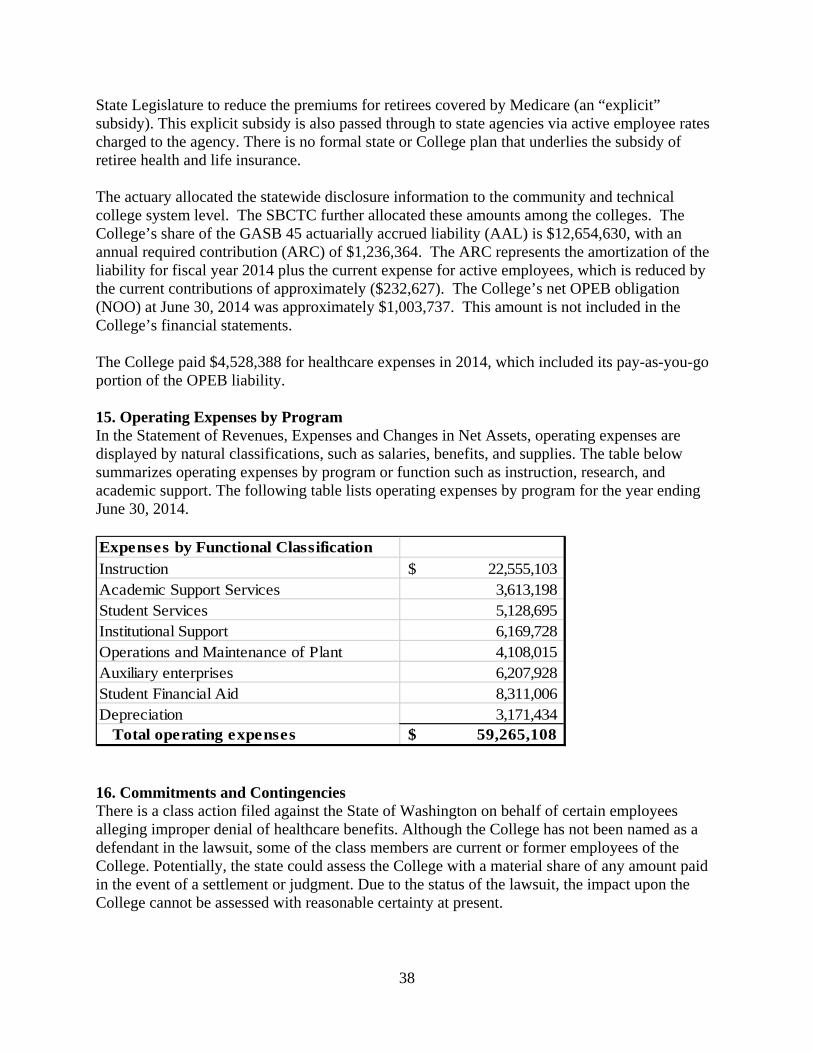
State Legislature to reduce the premiums for retirees covered by Medicare (an “explicit” subsidy). This explicit subsidy is also passed through to state agencies via active employee rates charged to the agency. There is no formal state or College plan that underlies the subsidy of retiree health and life insurance. The actuary allocated the statewide disclosure information to the community and technical college system level. The SBCTC further allocated these amounts among the colleges. The College’s share of the GASB 45 actuarially accrued liability (AAL) is $12,654,630, with an annual required contribution (ARC) of $1,236,364. The ARC represents the amortization of the liability for fiscal year 2014 plus the current expense for active employees, which is reduced by the current contributions of approximately ($232,627). The College’s net OPEB obligation (NOO) at June 30, 2014 was approximately $1,003,737. This amount is not included in the College’s financial statements. The College paid $4,528,388 for healthcare expenses in 2014, which included its pay-as-you-go portion of the OPEB liability. 15. Operating Expenses by Program In the Statement of Revenues, Expenses and Changes in Net Assets, operating expenses are displayed by natural classifications, such as salaries, benefits, and supplies. The table below summarizes operating expenses by program or function such as instruction, research, and academic support. The following table lists operating expenses by program for the year ending June 30, 2014. Expenses by Functional Classification
Instruction 22,555,103$ Academic Support Services 3,613,198 Student Services 5,128,695 Institutional Support 6,169,728 Operations and Maintenance of Plant 4,108,015 Auxiliary enterprises 6,207,928 Student Financial Aid 8,311,006 Depreciation 3,171,434 Total operating expenses 59,265,108$ 16. Commitments and Contingencies There is a class action filed against the State of Washington on behalf of certain employees alleging improper denial of healthcare benefits. Although the College has not been named as a defendant in the lawsuit, some of the class members are current or former employees of the College. Potentially, the state could assess the College with a material share of any amount paid in the event of a settlement or judgment. Due to the status of the lawsuit, the impact upon the College cannot be assessed with reasonable certainty at present.
39
Additionally, the College is engaged in various legal actions in the ordinary course of business. Management does not believe the ultimate outcome of these actions will have a material adverse effect on the financial statements. The College has commitments of $5,968,000 for various capital improvement projects that include energy enhancements to the campus and planning for a new College Instruction Center building. 17. Subsequent Events The College is not aware of any subsequent events or factors affecting these financial statements. We would like to acknowledge the following staff responsible for the content of this report: Janell Whiteley, Director of Business Services Lynn Kitts, Program Specialist 3 Bruce Riveland, Vice President for Administrative Services