Embed Size (px)
Citation preview

8-1 Inventory Management
William J. Stevenson
Operations Management
8th edition

8-2 Inventory Management
CHAPTER8
Inventory Management
McGraw-Hill/IrwinOperations Management, Eighth Edition, by William J. StevensonCopyright © 2005 by The McGraw-Hill Companies, Inc. All rights
reserved.

8-3 Inventory Management
Independent Demand
A
B(4) C(2)
D(2) E(1) D(3) F(2)
Dependent Demand
Independent demand is uncertain. Dependent demand is certain.
Inventory: a stock or store of goods

8-4 Inventory Management
Types of InventoriesTypes of Inventories
Raw materials & purchased parts Partially completed goods called
work in progress Finished-goods inventories
(manufacturing firms) or merchandise (retail stores)

8-5 Inventory Management
Types of Inventories (Cont’d)Types of Inventories (Cont’d)
Replacement parts, tools, & supplies
Goods-in-transit to warehouses or customers

8-6 Inventory Management
Functions of InventoryFunctions of Inventory
To meet anticipated demand
To smooth production requirements
To decouple operations
To protect against stock-outs

8-7 Inventory Management
Functions of Inventory (Cont’d)Functions of Inventory (Cont’d)
To take advantage of order cycles
To help hedge against price increases
To permit operations
To take advantage of quantity discounts

8-8 Inventory Management
Objective of Inventory ControlObjective of Inventory Control
To achieve satisfactory levels of customer service while keeping inventory costs within reasonable bounds
Level of customer service
Costs of ordering and carrying inventory

8-9 Inventory Management
A system to keep track of inventory
A reliable forecast of demand
Knowledge of lead times
Reasonable estimates of Holding costs
Ordering costs
Shortage costs
A classification system
Effective Inventory ManagementEffective Inventory Management

8-10 Inventory Management
Inventory Counting SystemsInventory Counting Systems
Periodic SystemPhysical count of items made at periodic intervals
Perpetual Inventory System System that keeps track of removals from inventory continuously, thus monitoringcurrent levels of each item

8-11 Inventory Management
Inventory Counting Systems (Cont’d)Inventory Counting Systems (Cont’d)
Two-Bin System - Two containers of inventory; reorder when the first is empty
Universal Bar Code - Bar code printed on a label that hasinformation about the item to which it is attached
0
214800 232087768
8-12 Inventory Management
Lead time: time interval between ordering and receiving the order
Holding (carrying) costs: cost to carry an item in inventory for a length of time, usually a year
Ordering costs: costs of ordering and receiving inventory
Shortage costs: costs when demand exceeds supply
Key Inventory TermsKey Inventory Terms

8-13 Inventory Management
ABC Classification SystemABC Classification System
Classifying inventory according to some measure of importance and allocating control efforts accordingly.
AA - very important
BB - mod. important
CC - least important
Figure 8.1

8-14 Inventory Management
Cycle CountingCycle Counting
A physical count of items in inventory
Cycle counting management
How much accuracy is needed?
When should cycle counting be performed?
Who should do it?

8-15 Inventory Management
Economic order quantity model
Economic production model
Quantity discount model
Economic Order Quantity ModelsEconomic Order Quantity Models

8-16 Inventory Management
Only one product is involved
Annual demand requirements known
Demand is even throughout the year
Lead time does not vary
Each order is received in a single delivery
There are no quantity discounts
Assumptions of EOQ ModelAssumptions of EOQ Model

8-17 Inventory Management
The Inventory CycleThe Inventory CycleFigure 8.2

8-18 Inventory Management
Figure 8-3Figure 8-3
8-19 Inventory Management
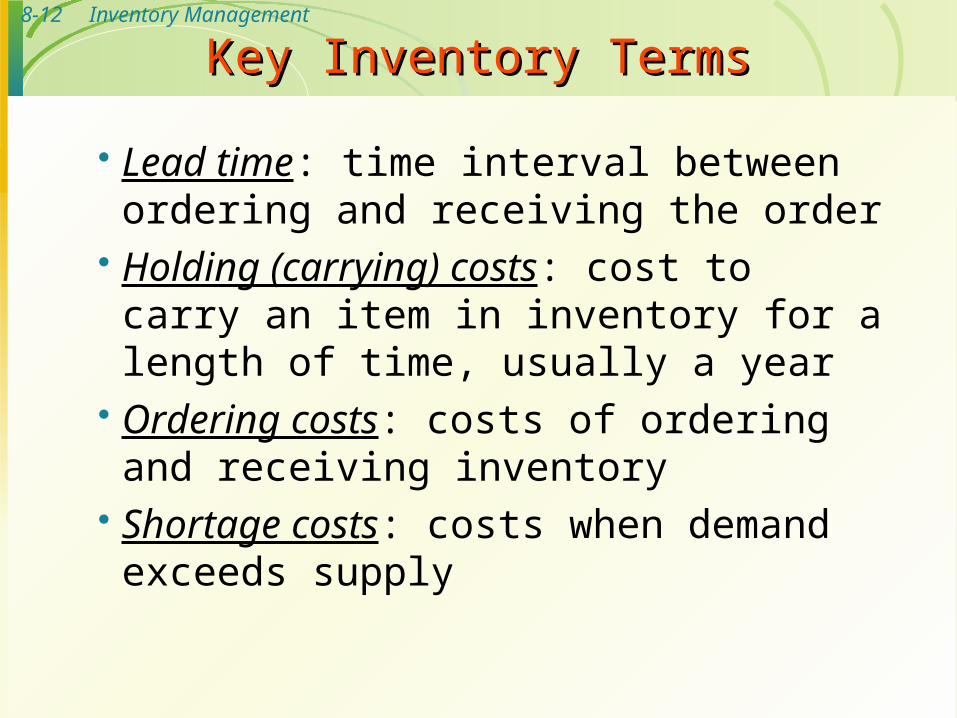
Total CostTotal Cost
Annualcarryingcost
Annualorderingcost
Total cost = +
Q2H D
QSTC = +

8-20 Inventory Management
Figure 8-4Figure 8-4
8-21 Inventory Management
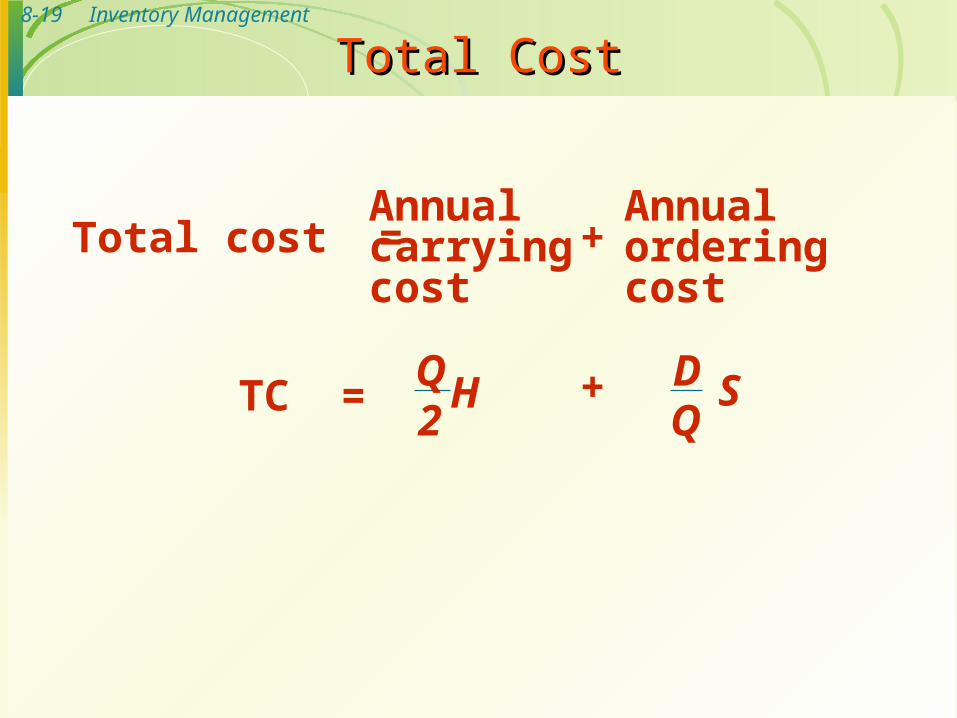
Deriving the EOQDeriving the EOQ
Using calculus, we take the derivative of the total cost function and set the derivative (slope) equal to zero and solve for Q.
Q = 2DS
H =
2(Annual Demand)(Order or Setup Cost)
Annual Holding CostOPT
8-22 Inventory Management
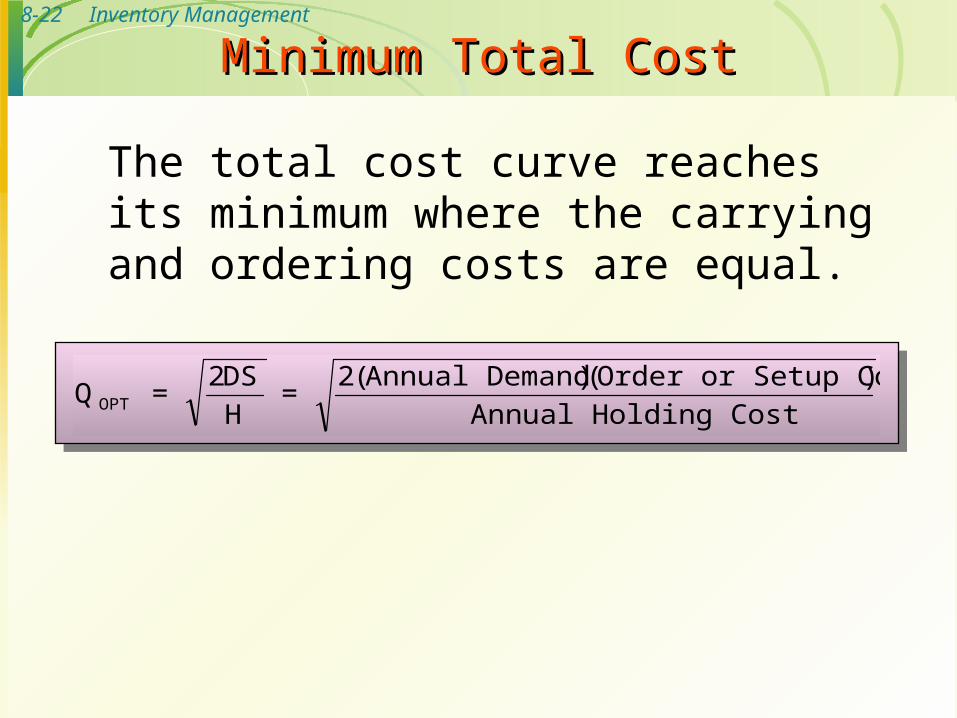
Minimum Total CostMinimum Total Cost
The total cost curve reaches its minimum where the carrying and ordering costs are equal.
Q = 2DS
H =
2(Annual Demand)(Order or Setup Cost)
Annual Holding CostOPT

8-23 Inventory Management
Figure 8-5Figure 8-5

8-24 Inventory Management
Production done in batches or lots Capacity to produce a part exceeds the part’s
usage or demand rate Assumptions of EPQ are similar to EOQ
except orders are received incrementally during production
Economic Production Quantity (EPQ)Economic Production Quantity (EPQ)

8-25 Inventory Management
Only one item is involved Annual demand is known Usage rate is constant Usage occurs continually Production rate is constant Lead time does not vary No quantity discounts
Economic Production Quantity AssumptionsEconomic Production Quantity Assumptions
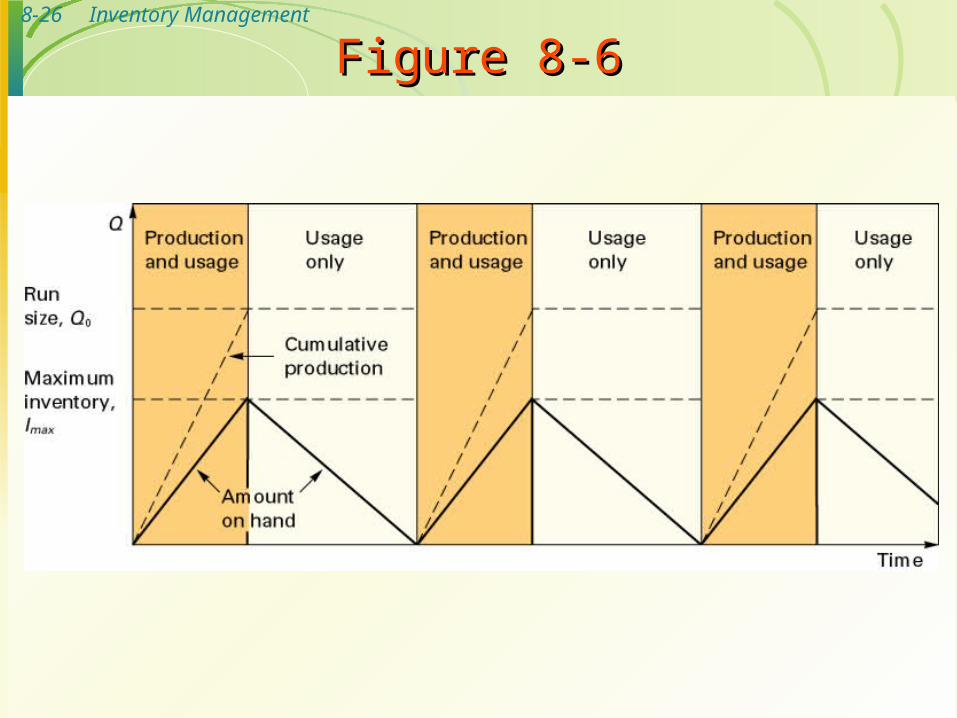
8-26 Inventory Management
Figure 8-6Figure 8-6

8-27 Inventory Management
Economic Run SizeEconomic Run Size
QDS
H
p
p u0
2

8-28 Inventory Management
Total Costs with Purchasing CostTotal Costs with Purchasing Cost
Annualcarryingcost
PurchasingcostTC = +
Q2H D
QSTC = +
+Annualorderingcost
PD +

8-29 Inventory Management
Total Costs with PDTotal Costs with PDFigure 8.7

8-30 Inventory Management
Figure 8-8Figure 8-8

8-31 Inventory ManagementTotal Cost with Constant Carrying Total Cost with Constant Carrying Costs Costs
Figure 8.9

8-32 Inventory Management
Figure 8-10Figure 8-10

8-33 Inventory Management
Figure 8-11Figure 8-11

8-34 Inventory Management
When to Reorder with EOQ OrderingWhen to Reorder with EOQ Ordering
Reorder Point - When the quantity on hand of an item drops to this amount, the item is reordered
Safety Stock - Stock that is held in excess of expected demand due to variable demand rate and/or lead time.
Service Level - Probability that demand will not exceed supply during lead time.

8-35 Inventory Management
Determinants of the Reorder PointDeterminants of the Reorder Point
The rate of demand The lead time Demand and/or lead time variability Stockout risk (safety stock)

8-36 Inventory Management
Safety StockSafety StockFigure 8.12
Safety stock reduces risk ofstockout during lead time

8-37 Inventory Management
Reorder PointReorder PointFigure 8.13

8-38 Inventory Management
Figure 8-14Figure 8-14

8-39 Inventory Management
Orders are placed at fixed time intervals Order quantity for next interval? Suppliers might encourage fixed intervals May require only periodic checks of
inventory levels Risk of stockout
Fixed-Order-Interval ModelFixed-Order-Interval Model

8-40 Inventory Management
Figure 8-15Figure 8-15

8-41 Inventory Management
Tight control of inventory items Items from same supplier may yield savings
in: Ordering Packing Shipping costs
May be practical when inventories cannot be closely monitored
Fixed-Interval BenefitsFixed-Interval Benefits

8-42 Inventory Management
Requires a larger safety stock Increases carrying cost Costs of periodic reviews
Fixed-Interval DisadvantagesFixed-Interval Disadvantages

8-43 Inventory Management
Single period model: model for ordering of perishables and other items with limited useful lives
Shortage cost: generally the unrealized profits per unit
Excess cost: difference between purchase cost and salvage value of items left over at the end of a period
Single Period ModelSingle Period Model

8-44 Inventory Management
Continuous stocking levels
Identifies optimal stocking levels
Optimal stocking level balances unit shortage and excess cost
Discrete stocking levels
Service levels are discrete rather than continuous
Desired service level is equaled or exceeded
Single Period ModelSingle Period Model

8-45 Inventory Management
Figure 8-16Figure 8-16
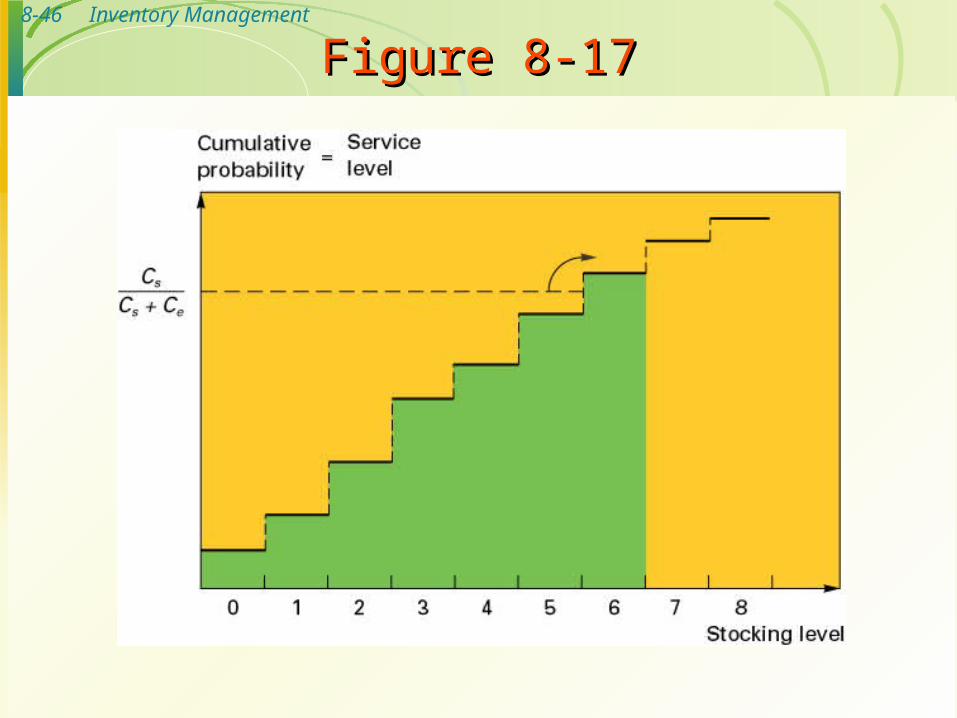
8-46 Inventory Management
Figure 8-17Figure 8-17
8-47 Inventory Management
Too much inventory Tends to hide problems Easier to live with problems than to eliminate
them Costly to maintain
Wise strategy Reduce lot sizes Reduce safety stock
Operations StrategyOperations Strategy

8-48 Inventory Management
Additional PowerPoint slides contributed by Geoff Willis, University of Central Oklahoma.
CHAPTER8

8-49 Inventory Management
Economic Production QuantityEconomic Production Quantity
Inventory Level
Usage Usage
Pro
duct
ion
& U
sage
Pro
duct
ion
& U
sage

8-50 Inventory Management
Gortrac ManufacturingGortrac Manufacturing
GTS3
Inventory/Assessment/Reduction

8-51 Inventory Management
MaterialsMaterials
PS7
Washburn Guitars